
Abstract
In this article, the effect of adding polylactide (PLA) and nanoclay on the thermal stability of polypropylene (PP) films was analyzed using thermogravimetric analysis. The thermal degradation kinetic parameters such as activation energy (Ea), order of reaction (n), and frequency factor (ln (Z)) of the samples were studied over a temperature range of 30–550°C. Analyses were performed under nitrogen atmosphere with four different heating rates (i.e. 5, 10, 15, and 20°C min−1). The Ea was calculated by Kissinger, Kim–Park, and Flynn–Wall methods. The Ea value of PP was much higher than PLA, whereas the addition of PLA and nanoclay in PP decreased the Ea. The addition of compatibilizer increased the compatibility and Ea of blended films upto some extent. The lifetime of PP was found to be decreased with the addition of PLA and nanoclay. Studies indicated that the thermal degradation behavior and lifetime of the investigated samples depend on the fractions of constituents and heating rates.
Introduction
Polypropylene (PP) is one of the cheapest plastic materials widely used for various applications such as electronics parts, automobile application, textile, food packaging, and trash bag. 1 PP is mostly preferred in packaging application due to good mechanical, physical, and chemical properties such as tensile strength, chemical resistance, and gas barrier properties. 2,3 However, these PP films are nonbiodegradable and hydrophobic in nature. This makes it difficult to dispose of the packaging film after short-term use. Packaging films were accumulated on land sites and ocean and pollute the environment. 4 Recycling of these films is not a suitable option due to the production of low-quality product. Biodegradability and degradablility of packaging films have been a suitable option for plastic waste management. Degradability of PP is improved by blending with biodegradable polymers such as polylactic acid, 5 starch, cellulose, and polycaprolactone. In the biodegradation process, films are broken down into small by-products and consumed by microorganisms as an energy source.
Polylactide (PLA) is a biocompatible and biodegradable material. 6 PLAs are not used in packaging application due to low shelf life, high cost, and brittle nature. Several research studies have been reported on the blending of PP with PLA and confirmed their degradability. Compatibilizers such as polypropylene-grafted maleic anhydride (PP-g-MA) are generally used to improve the miscibility between the two polymers. 7
Montmorillonite is widely used in a wide range of applications due to its high surface area, swelling capacity, and high cation exchange capacity, which is helpful for microorganism growth. 8 Nanocomposites enhanced the properties of polymer compared to untreated polymer or micro- and macrocomposites. The main improvement is increases in mechanical strength, thermal stability, and increased biodegradability and biodegradation of polymers. 9 There is a need to know the thermal stability and lifetime estimation of PP, PP/PLA blend, and their nanocomposites with the help of degradation kinetics parameters for various applications.
The kinetics of degradation can generate parameters such as activation energy (Ea), reaction order (n), and frequency factor (Z), which can be subsequently used to deduce the lifetime of polymers at different temperatures. These parameters were calculated by various kinetic methods such as Friedman, 10 Kissinger, 11 Flynn–Wall, 12 Kim–Park, 13 and Freeman–Carroll. 14 These are the thermogravimetric analysis (TGA) method, which is generally used to measure the thermal degradation kinetics. Friedman, Freeman–Carroll, Coats–Redfern are the single heating rate and model-fitting technique, while Flynn–Wall–Ozawa, Kim–Park, and Kissinger are the multiple heating rate and model-free technique. Model-free methods are used due to their simplicity and avoidance of errors connected with the choice of a kinetic model and assumptions. So, in view of the abovementioned information, we performed the kinetic analysis of the modified PP films by model-free methods suggested by Kissinger, Flynn–Wall, and Kim–Park.
In this article, we described the thermal degradation behavior and the effect of PLA concentration and nanoclay on the thermal stability of PP using TGA. The analysis has been performed at four different heating rates under nitrogen atmosphere. Three heating rate methods were used to estimate the degradation kinetic parameters (Ea, n, and Z). These degradation kinetic parameters were used to predict the lifetime of PP, PP/PLA blend, and their composites.
Theoretical background
TGA is an important method to determine the rate of degradation of polymers. The TGA results were used to calculate the thermal degradation kinetic parameters of PP, PP/PLA blends, and their nanocomposites. In TGA, the rate of degradation reaction (α) can be defined as the ratio of actual weight loss at time (t) to total weight loss corresponding to the decomposition process

where wt, w0, and wf are the actual weight of sample at time t, initial weight, and final weight of a test sample, respectively. The rate of degradation (dα/dt) is a function of temperature and weight of the sample
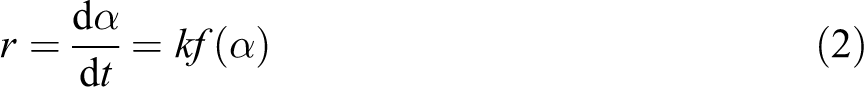
Here, f(α) is the rate of conversion and r is the reaction rate; k is the rate constant and a function of temperature described by the Arrhenius equation

where Ea is the activation energy, Z is the frequency factor, T the absolute temperature, and R the gas constant. The reaction rate can be expressed by combining equations (2) and (3) as

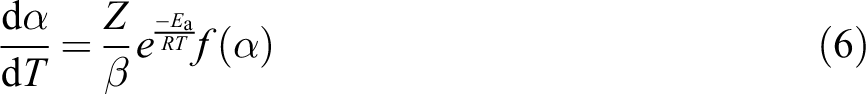
By introducing heating rate in the rate of degradation (dα/dt), the modified equation is

Combining equations (2), (4), and (5) yields the following expression
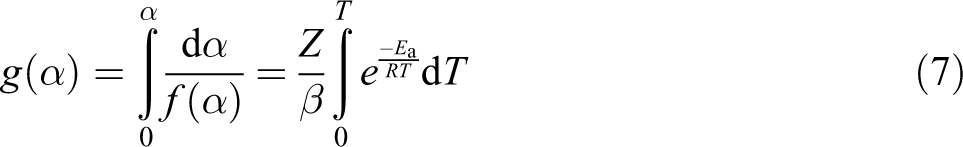
And, the integral function of α is g(α) as follows
Experimental
Materials
Pellets of PP of density 0.9 g cm−3, melt flow index = 3 g 10 min−1, and melting point 165°C were provided by Haldia Petrochemicals Ltd (Haldia, West Bengal, India). PLA (4032D) having a density of 1.24 g cm−1 was provided by NatureWorks LLC (Minnetonka, Minnesota, USA). Nanoclay (Cloisite 30B) was supplied by Connell Bros. Company Pvt. Ltd (Mumbai, Maharashtra, India). Pluss Polymers Pvt. Ltd (Gurgaon, Haryana, India) supplied the compatibilizer—PP-g-MA having a Tm of 163°C.
Preparation of blends and nanocomposites
The blends of PP/PLA with and without compatibilizer and nanocomposites having nanoclay were formulated as shown in Table 1. Mixer supplied by Haake PolyLab (Germany) was used for melt blending. All materials were mixed manually before fed. Based on our previous work, 7 the compostion of PP/PLA was taken as 85/15 and the amount of compatibilizer was kept as 4 phr. Later, 2 wt% nanoclay was added to PP and 2wt% nanoclay was added to compatibilized 85/15 (PP/PLA) blend. The mixing chamber temperature was 190°C and a rotor speed of 60 r min−1 was maintained during the mixing for 4 min. The extrudate obtained from the mixer was sheeted out through a two-roll mill at room temperature with a nip gap of 2 mm.
PP, PP/PLA blends, and their nanocomposites with different compostion.
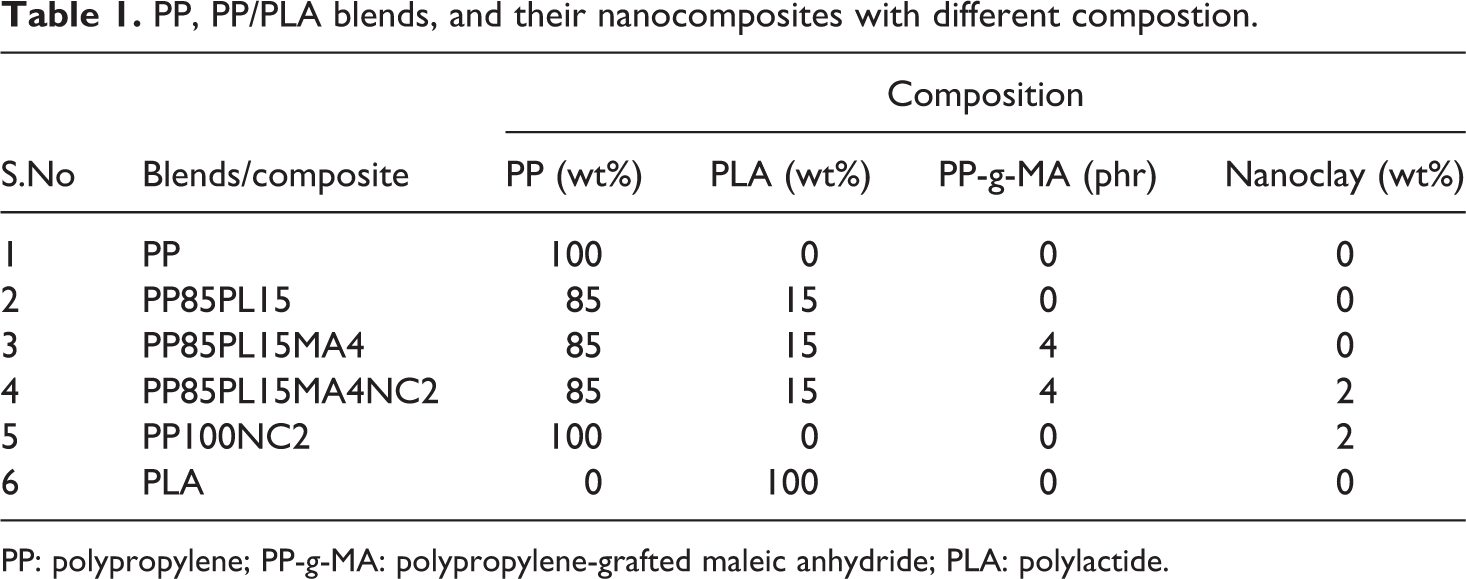
PP: polypropylene; PP-g-MA: polypropylene-grafted maleic anhydride; PLA: polylactide.
Preparation of films
Films were casted from the blends and nanocomposites at 400 kN m−2 and 185°C in compression molding for 2 min. The films of thickness 80–85 μm were obtained from the mold and cooling of mold was performed by water.
Fourier transform infrared spectroscopy
An Agilent Pro Cary 660 (Santa Clara, California, USA) Fourier-transform infrared (FTIR) spectrophotometer having a zinc selenide crystal was used to obtain the FTIR spectra of all the samples. The spectra were recorded in the range of 500–4000 cm−1. A total of 16 scans/sample were taken, with a resolution of 4 cm−1.
Thermogravimetric analysis
The thermal degradation kinetics of PP, PP/PLA blends, and their nanocomposites were studied using a Q-500 instrument purchased from TA Instruments (USA). The analyses were done under the nitrogen atmosphere. The weight of samples was 5-10 mg. The samples were heated in the range of room temperature to 550°C at four heating rates 5, 10, 15, and 20°C min−1. The flow rate of nitrogen was 50 mL min−1. Each experiment was repeated three times.
Results and discussion
FTIR spectroscopy
The FTIR spectra of PP, PP/PLA blends, and their nanocomposites are shown in Figure 1, in which peaks at 2949–2866, 1454, and 1375 cm−1 were assigned to C–H stretching, CH3 bending, and C–H bending, respectively, for PP. 15 In the spectra of PLA, the peaks at 1746, 1178, and 1084 cm−1 were associated with C=O stretching, symmetric C–O–C stretching, and asymmetric CH3, respectively. 16 The peaks in PP/PLA blend (PP85PL15) were observed around 2949–2866, 1454, 1375, 1178, and 1086–1184 cm−1. The addition of compatibilizer in the blend PP85PL15MA4 was confirmed by the emergence of new peak at 1757 cm−1 representing the carbonyl of ester linkage stretching. 16 The peaks in nanocomposites PP100NC2 and PP85PL15MA4NC2 at between 900 cm−1 and 1100 cm−1 confirmed the presence of nanoclay. 17
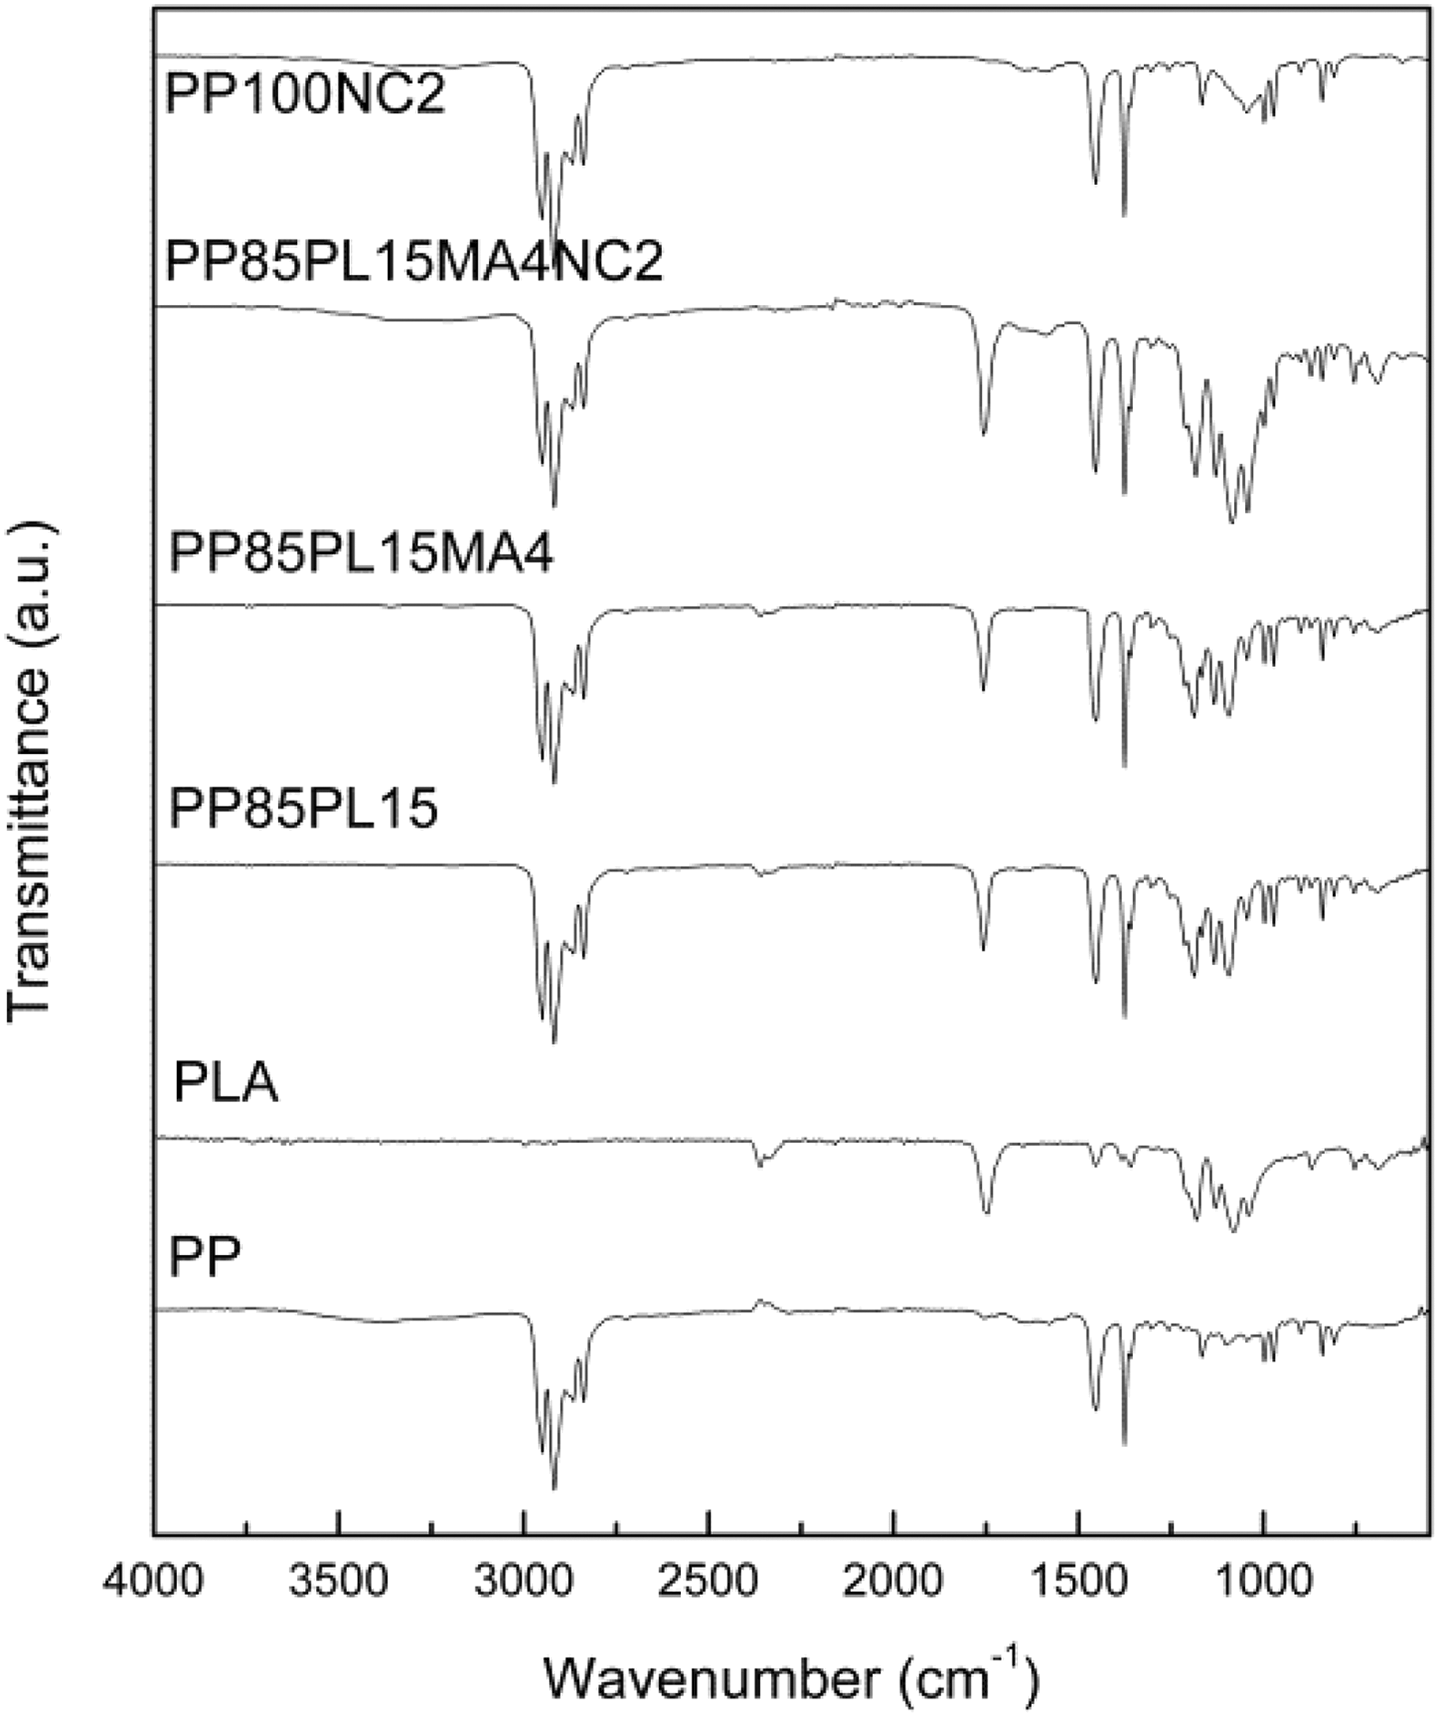
FTIR spectrum of PP, PP/PLA blends, and their nanocomposites.
Thermal stability
The thermal stability of PP, PP/PLA blends, and their nanocomposites require different for different application such as wire manufacturing. In this article, thermal degradation of the samples was performed to estimate the lifetime. Figure 2 shows the TG and derivative TG thermograms of all the samples. The TG thermograms of PP, PLA, and PP100NC2 samples show single-stage decomposition. Under nitrogen atmosphere, thermal decomposition of PP via random scission is a primary pathway followed by a radical transfer process. 18 The decompostion temperature shifts toward the higher temperature with the increase in heating rate. This could be due to the principle of time–temperature superposition. The TG thermograms of all the blended samples (i.e. PP85PL15, PP85PL15MA4, and PP85PL15MA4NC2) show two-step thermal decomposition, which confirmed the presence of both PP and PLA in the blends. The initial degradation temperature (Ti) corresponds to 5% weight loss of the samples, the final degradation temperature (Tf) corresponds to 5% residual left after which no appreciable weight loss is possible and Tm is temperature corresponds to maximum weight loss at different heating rates, are summarized in Table 2 and the standard uncertainty shown in brackets. The degradation temperatures of PP, PP/PLA blends, and their nanocomposite samples at different conversion levels are shown in Table 3. At the heating rate of 5°C min−1, the initial degradation temperature of PP was 337°C, whereas the addition of PLA in PP decreased the initial degradation temperature to 291°C due to the incompatibility between the two polymers. However, the addition of compatibilizer in PP85PL15 blend increases the initial degradation temperature upto 304°C. The addition of compatibilizer increases the interection between the two polymers, which is due to the increase in some interfacial adhesion between PP and PLA, resulting in increased thermal stability of the blend. 19 The PP100NC2 composite had an initial degradation temperature of 291°C, which was lower than PP. The decrease in the intial degradation temperature is due to the catalysis effect of nanoclay toward the degradation of polymer matrix under nitrogen atmosphere. 20 The addition of nanoclay in compatibilized blend also decreases the thermal stability of the nanocomposite sample.
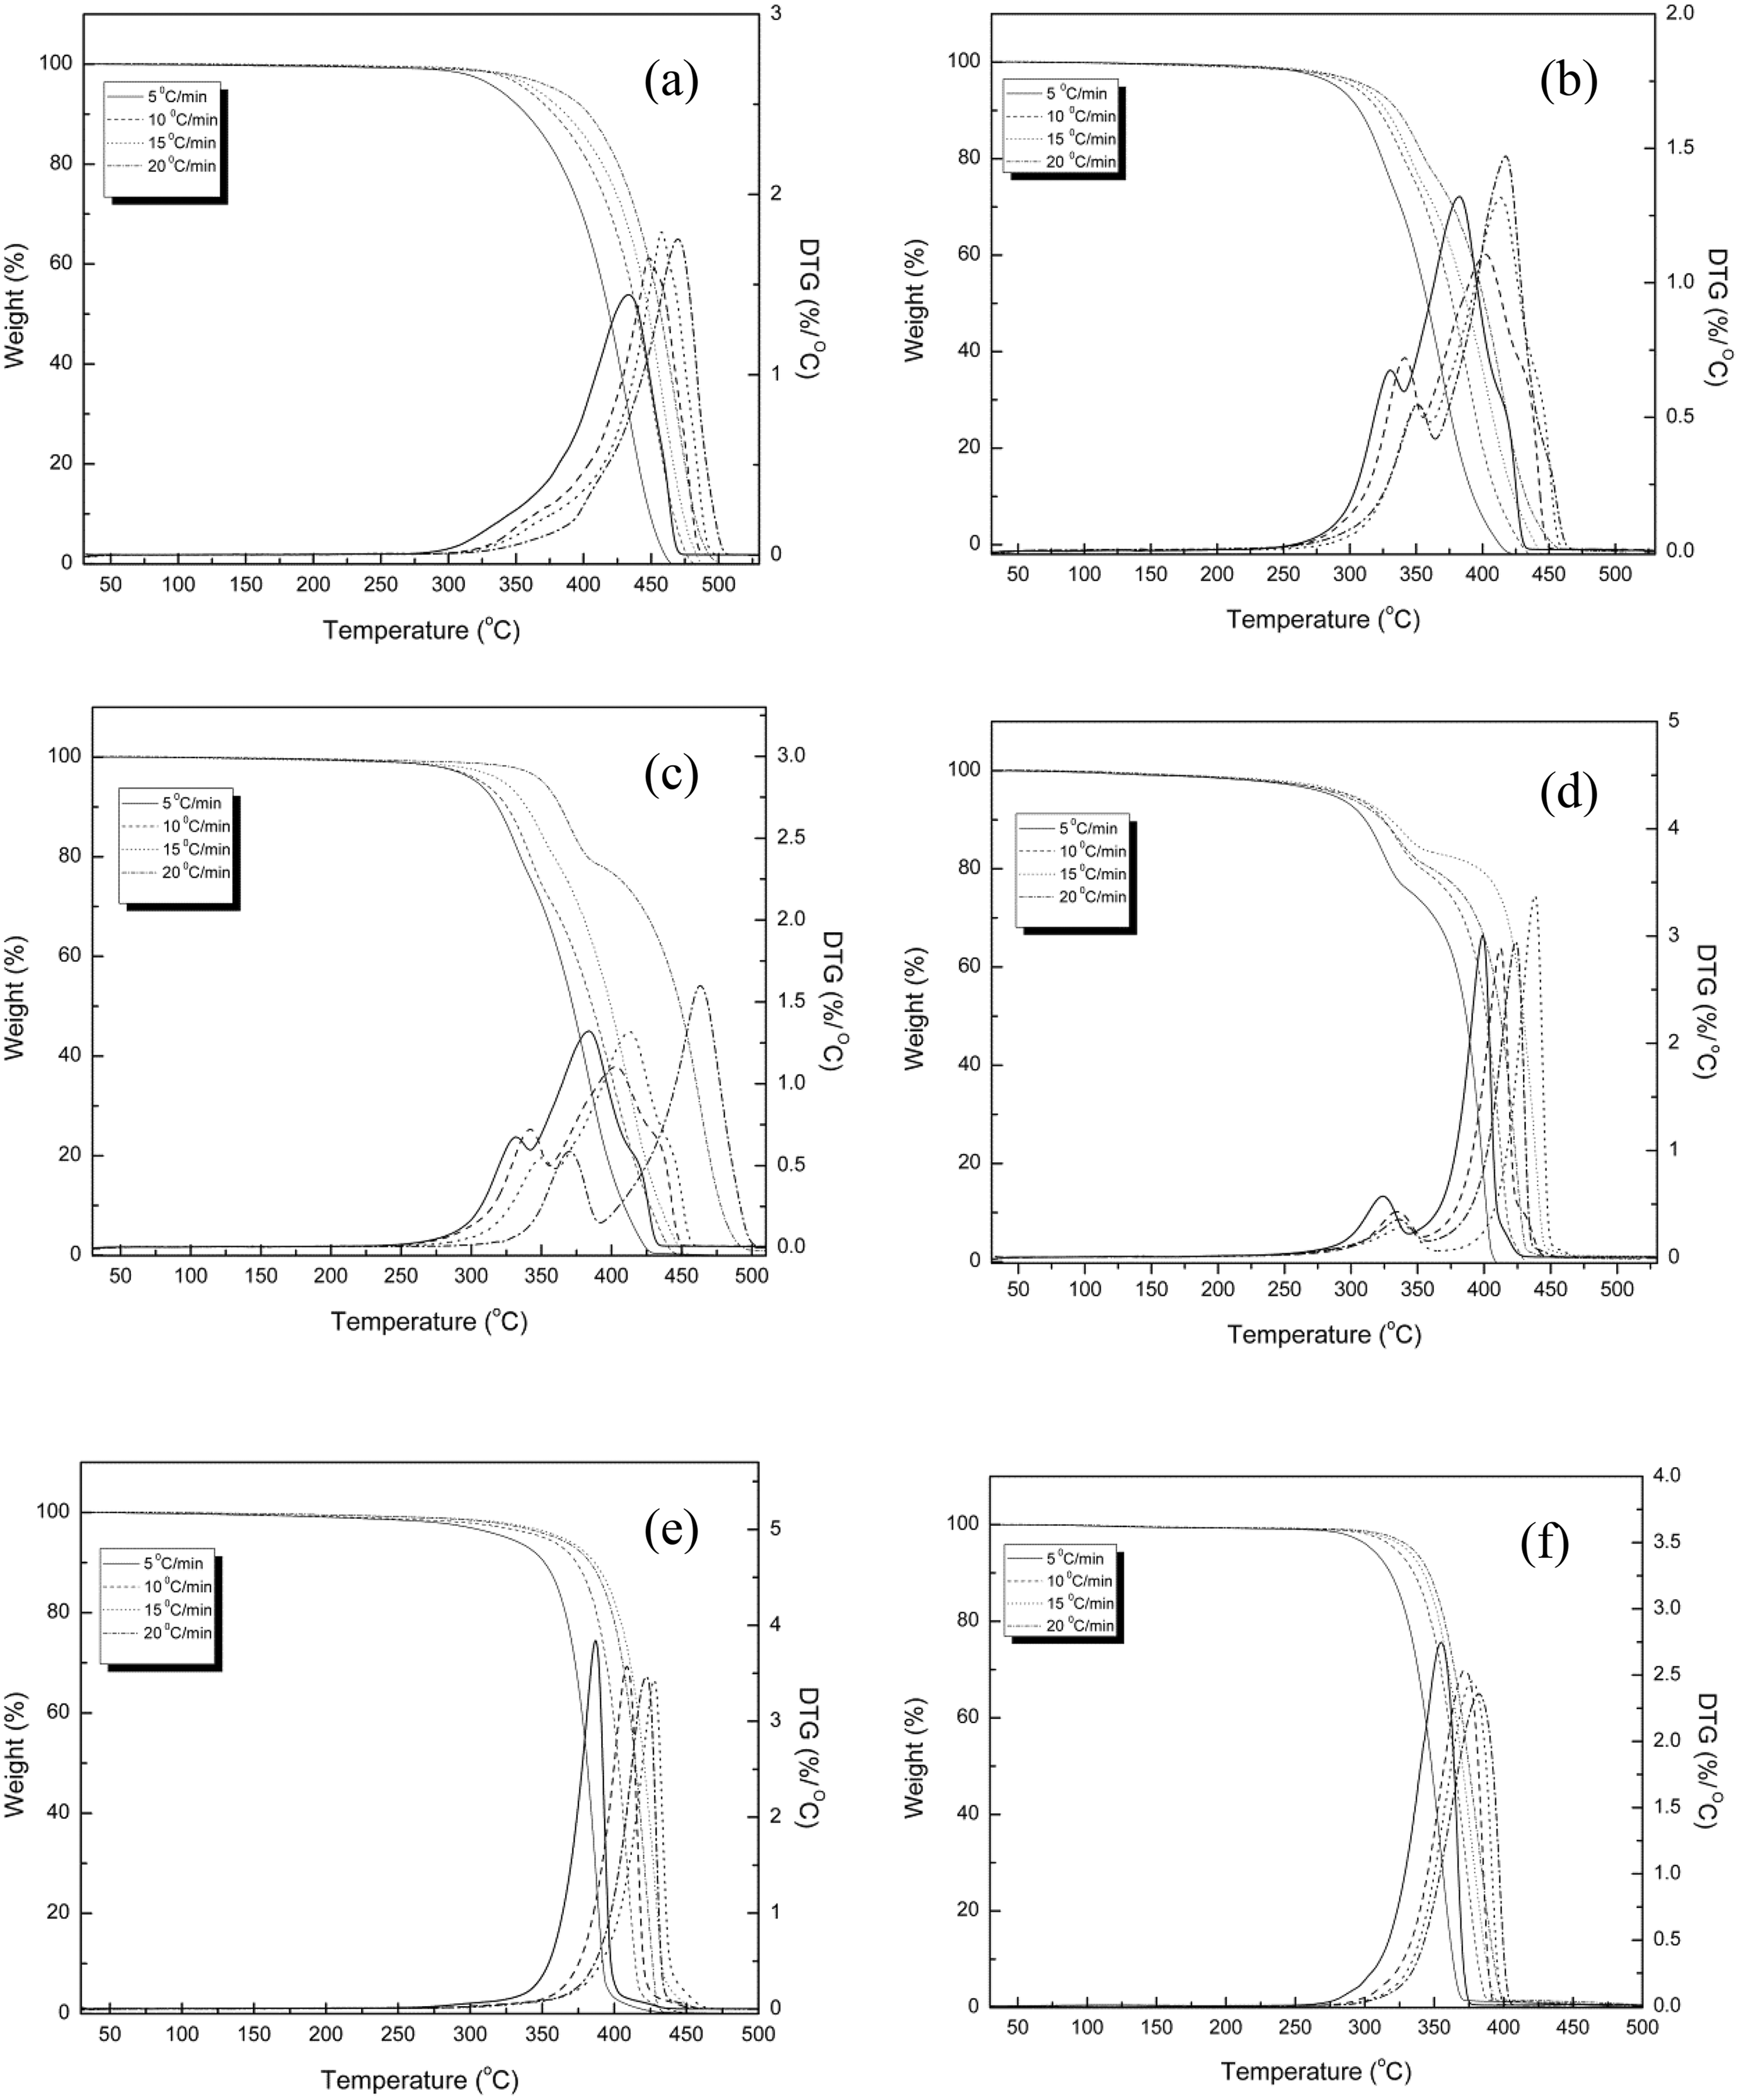
TG and DTG curves of PP, PP85PL15, PP85PL15MA4, PP85PL15MA4NC2, PP100NC2, and PLA.
TGA data of PP, PP/PLA blends, and their nanocomposites with different compostion.
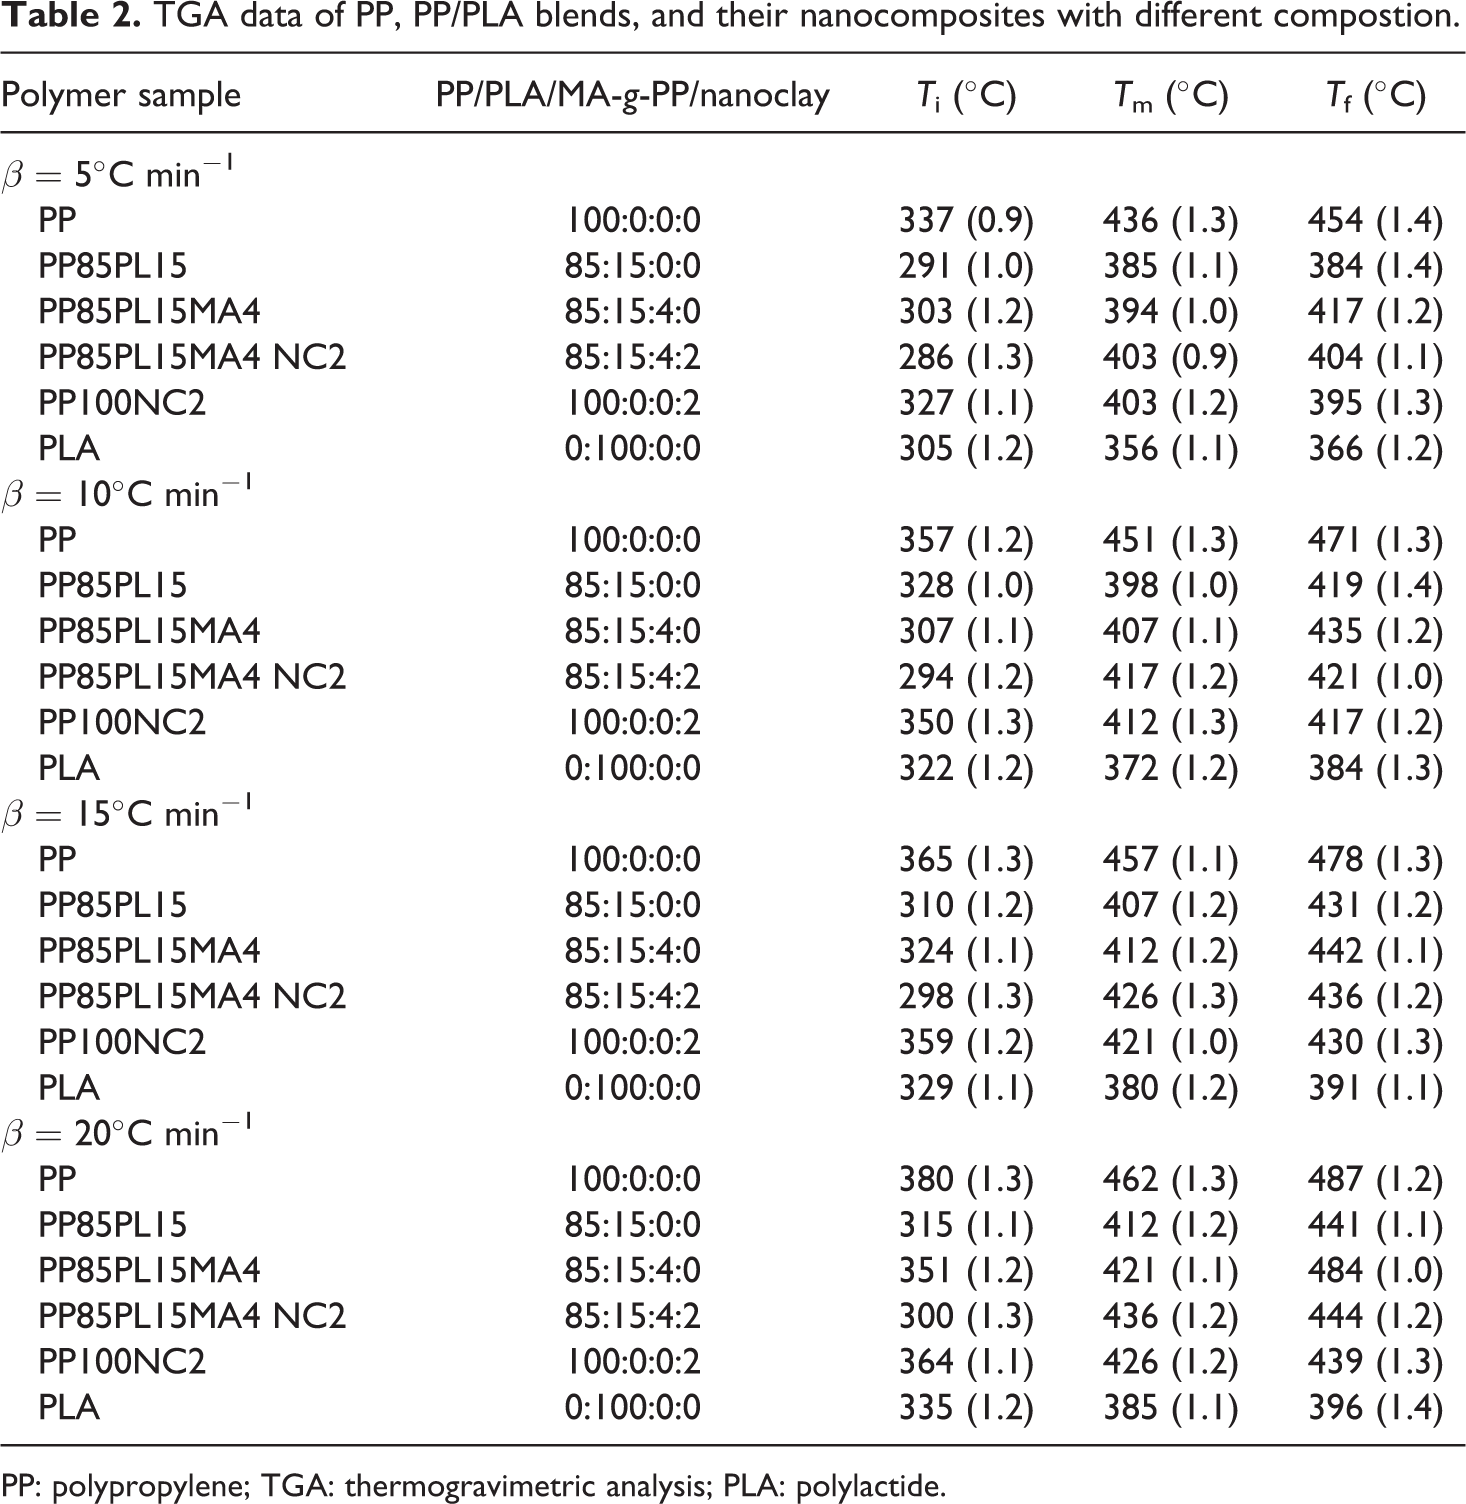
PP: polypropylene; TGA: thermogravimetric analysis; PLA: polylactide.
Thermal degradation as percentage conversion at different heating rates.
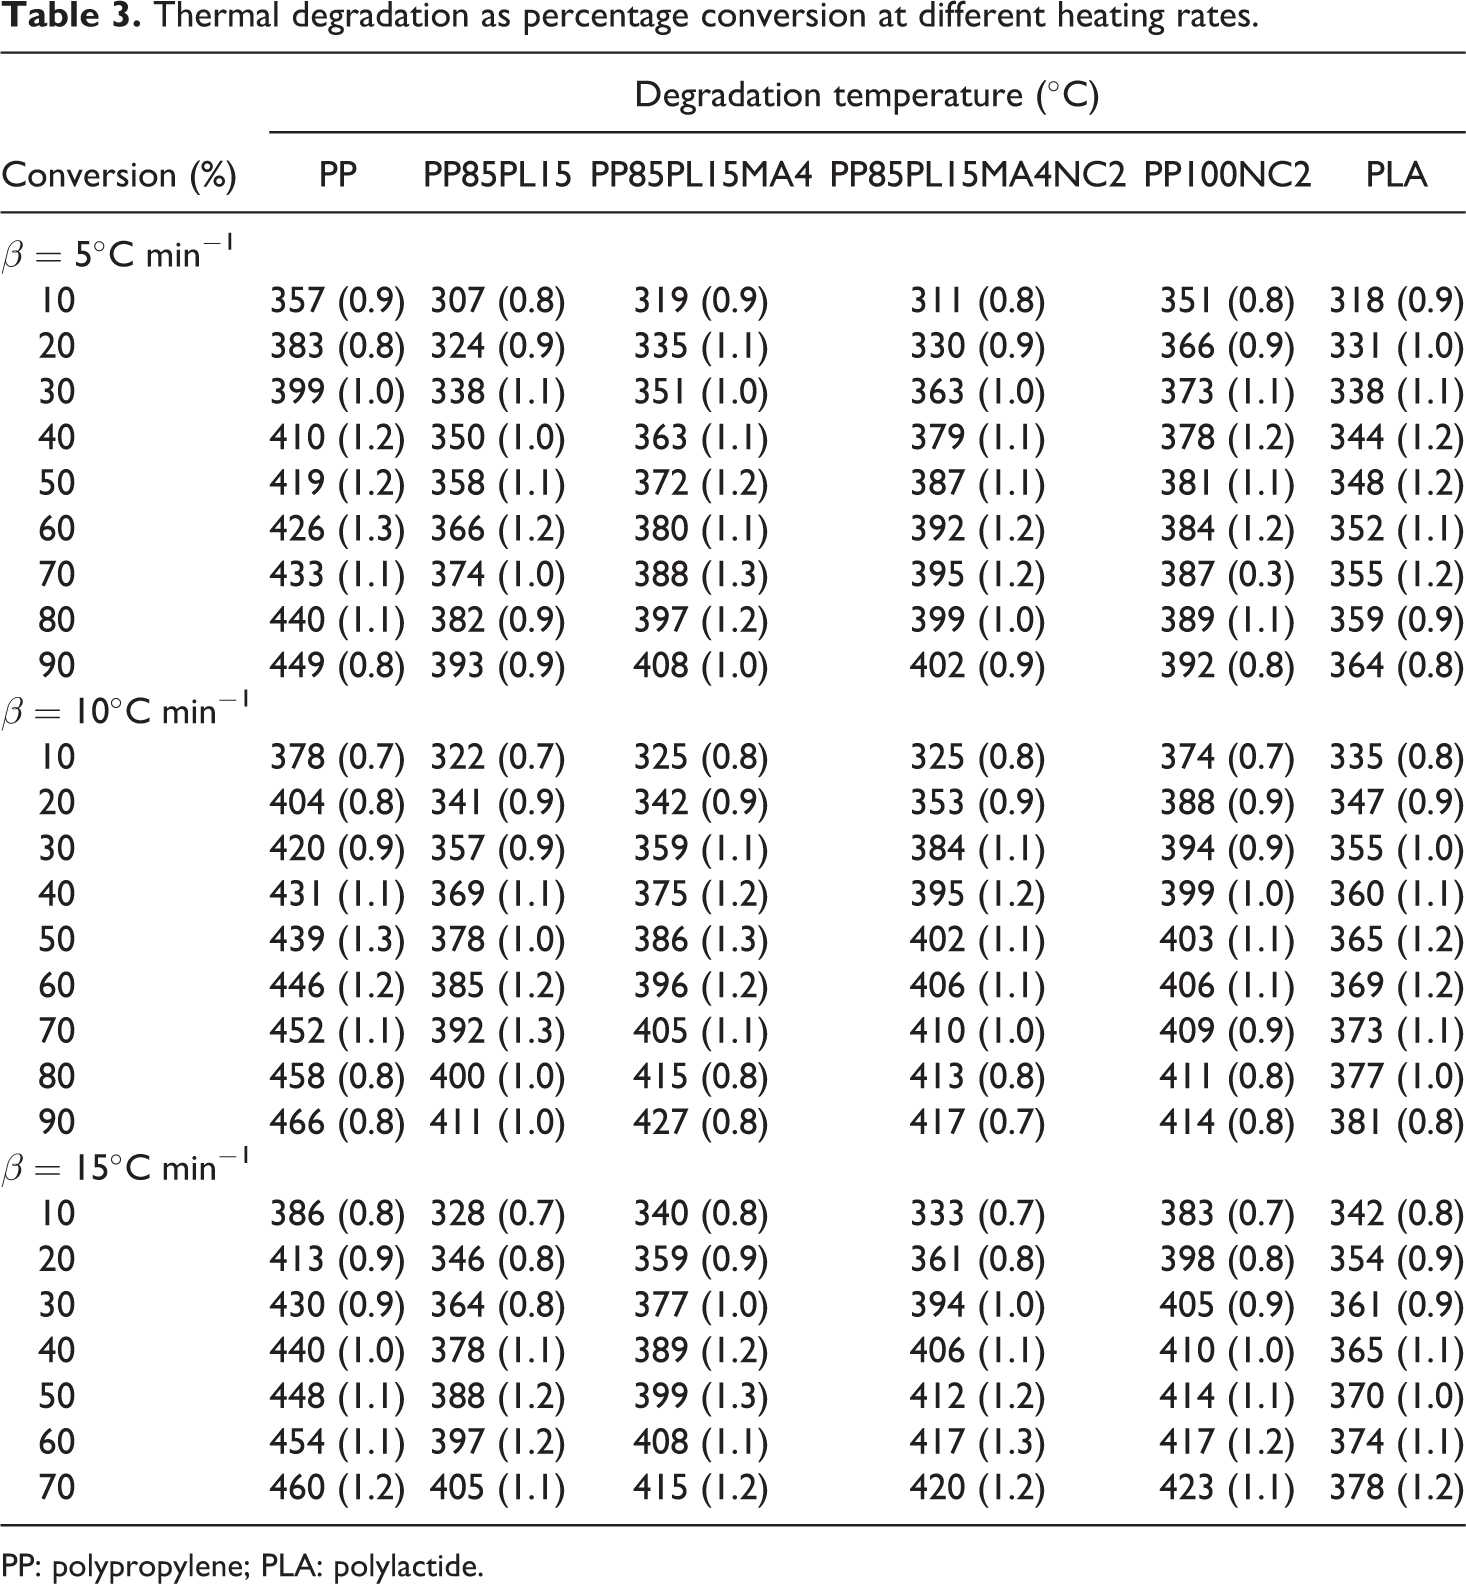
PP: polypropylene; PLA: polylactide.
Kinetics analysis
The degradation study of PP, PP/PLA blends, and their nanocomposites was performed with the help of three multiple heating rate techniques, namely, Kissinger, 11 Kim–Park, 21 and Flynn–Wall. 12 These multiple heating rate methods were used to calculate the parameters of degradation kinetics, namely, activation energy (Ea), reaction order (n), and frequency factor (Z).
Kissinger method
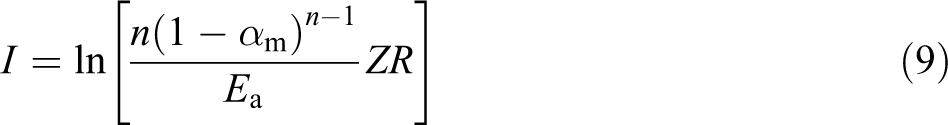
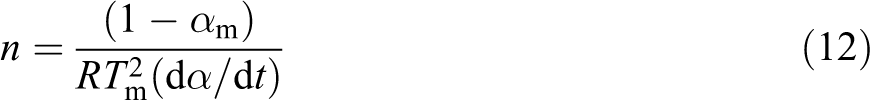
The kinetic parameters of degradation such Ea, n, and Z are determined through the Kissinger method 11

where Tm is the maximum decompostion temperature, β is the heating rate, and αm is the conversion at maximum decompostion temperature. The value of ln(Z) can be obtained from the intercept I. I is calculated from the following equation
The plot of
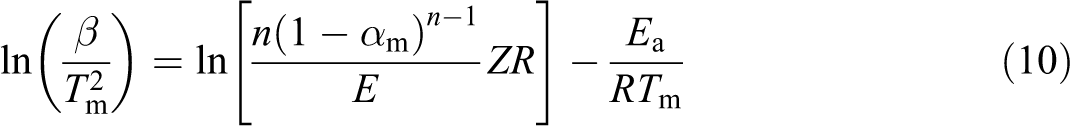
Figure 3 shows the plot of
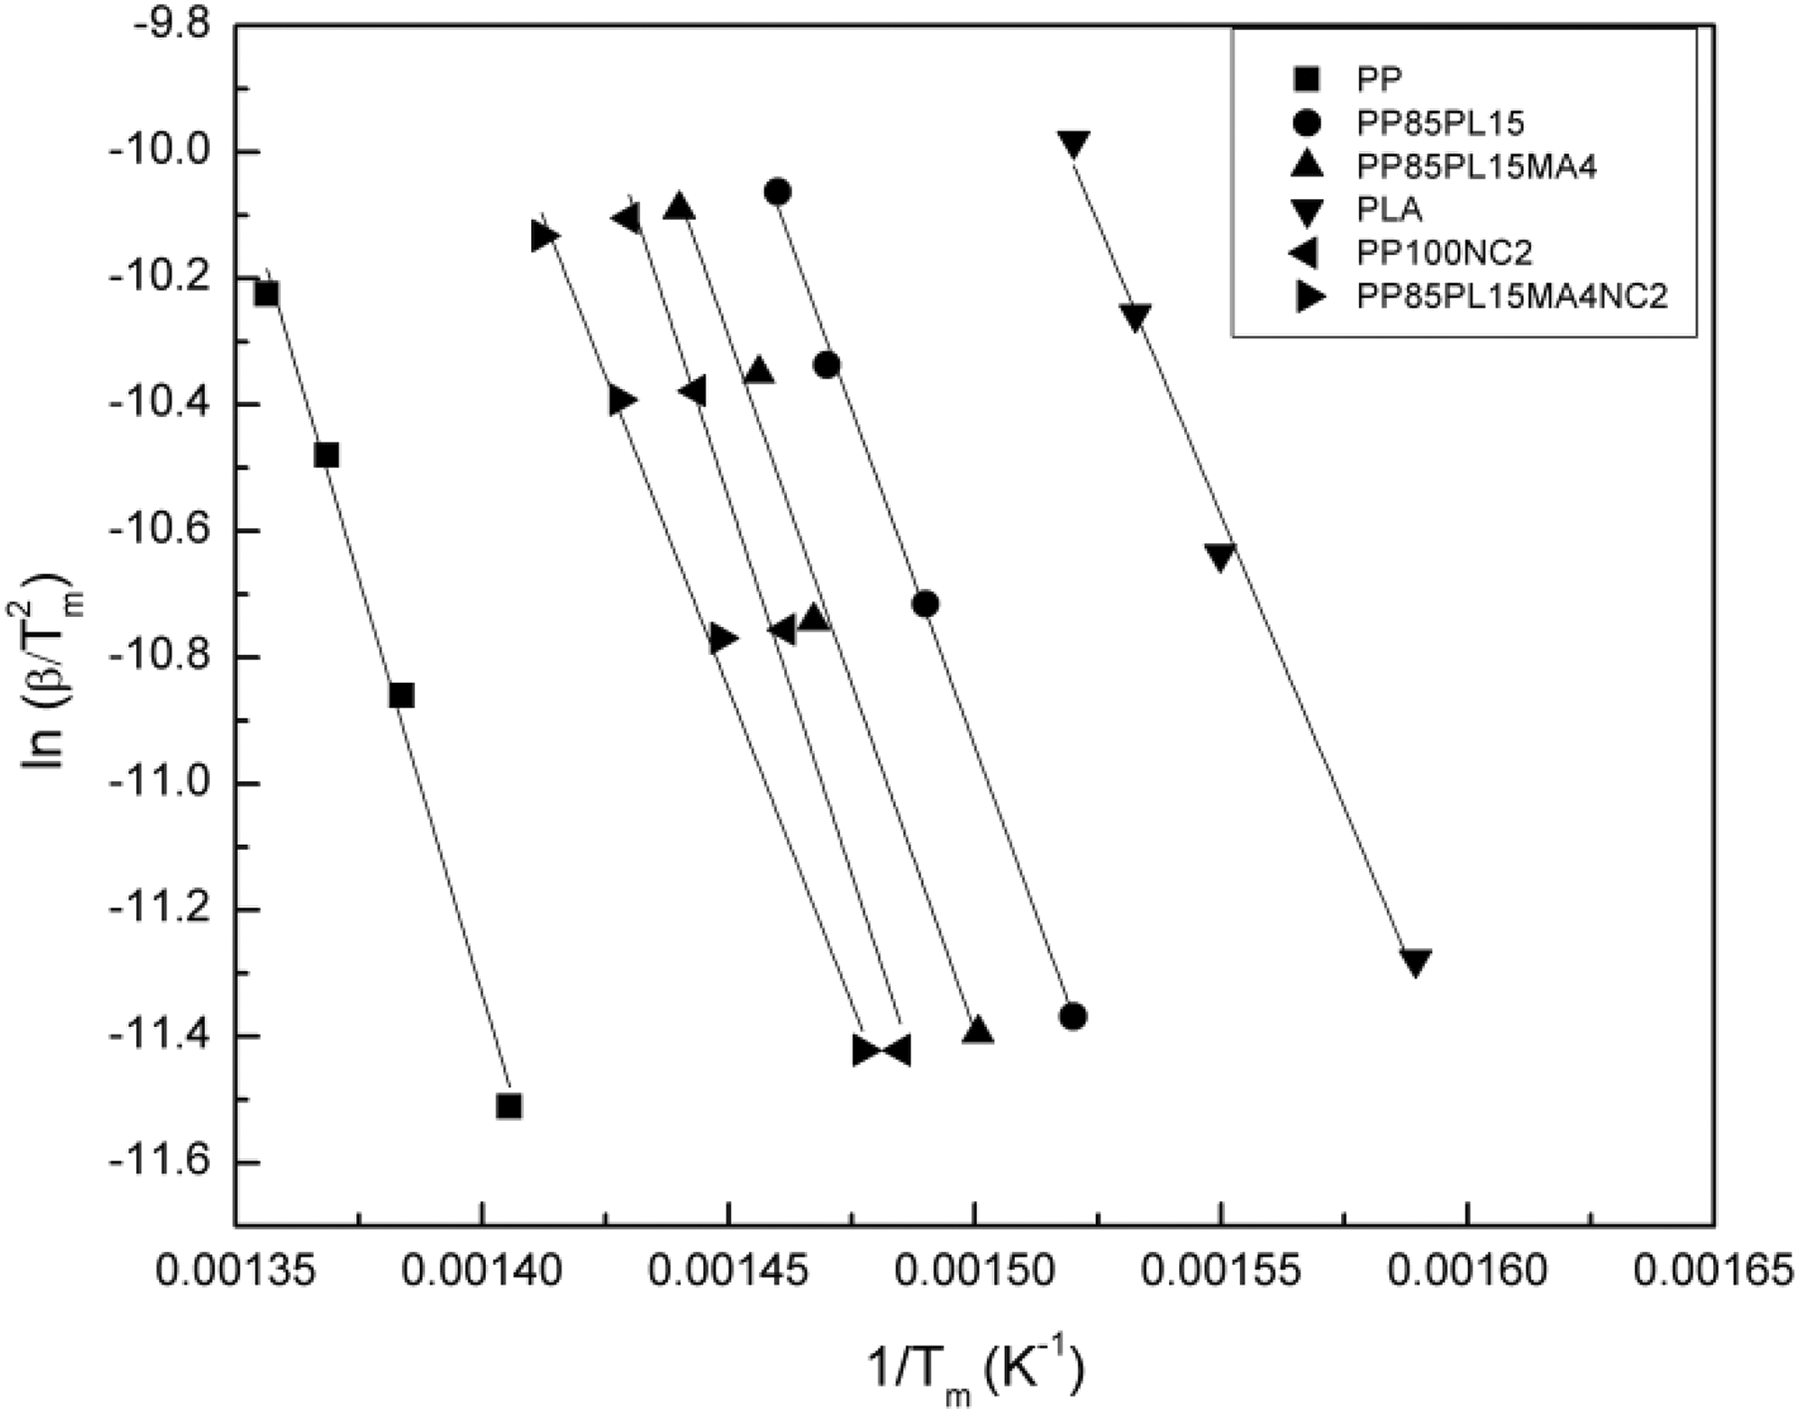
Kissinger plots for all samples under nitrogen at different heating rates.
Degradation kinetic parameters for all samples by Kissinger technique.
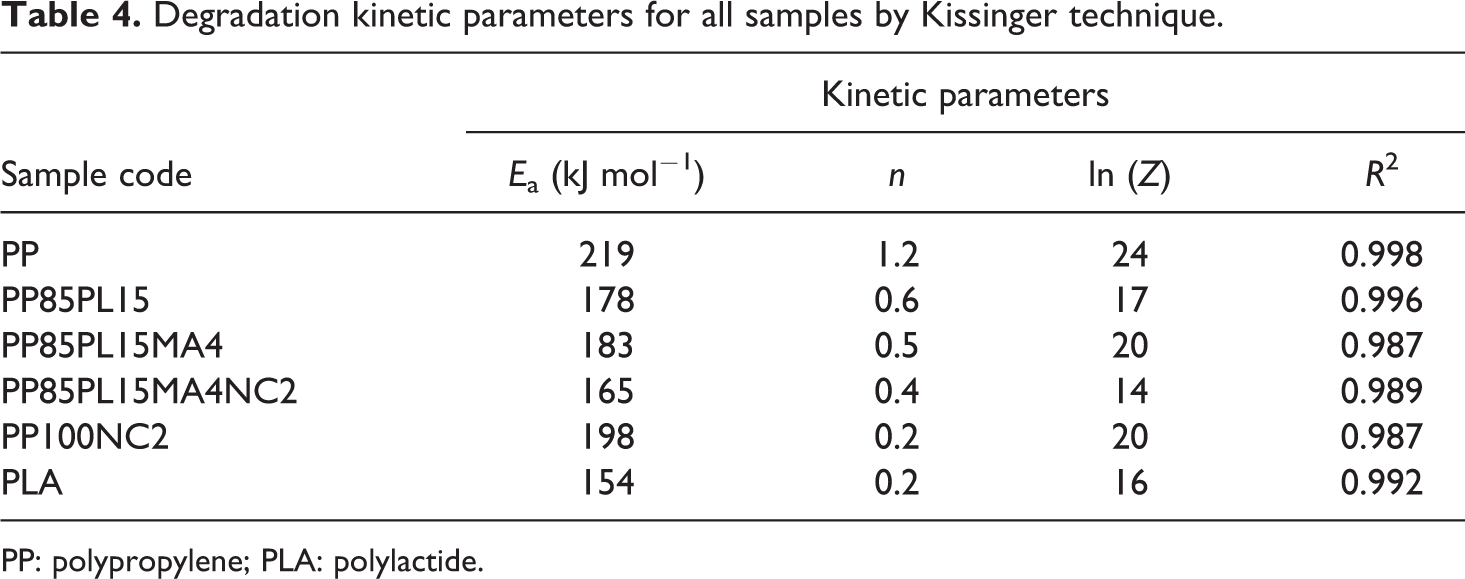
PP: polypropylene; PLA: polylactide.
Kim–Park method
The kinetic parameters of degradation such Ea, n, and Z are determined through the Kim–Park method 21

where
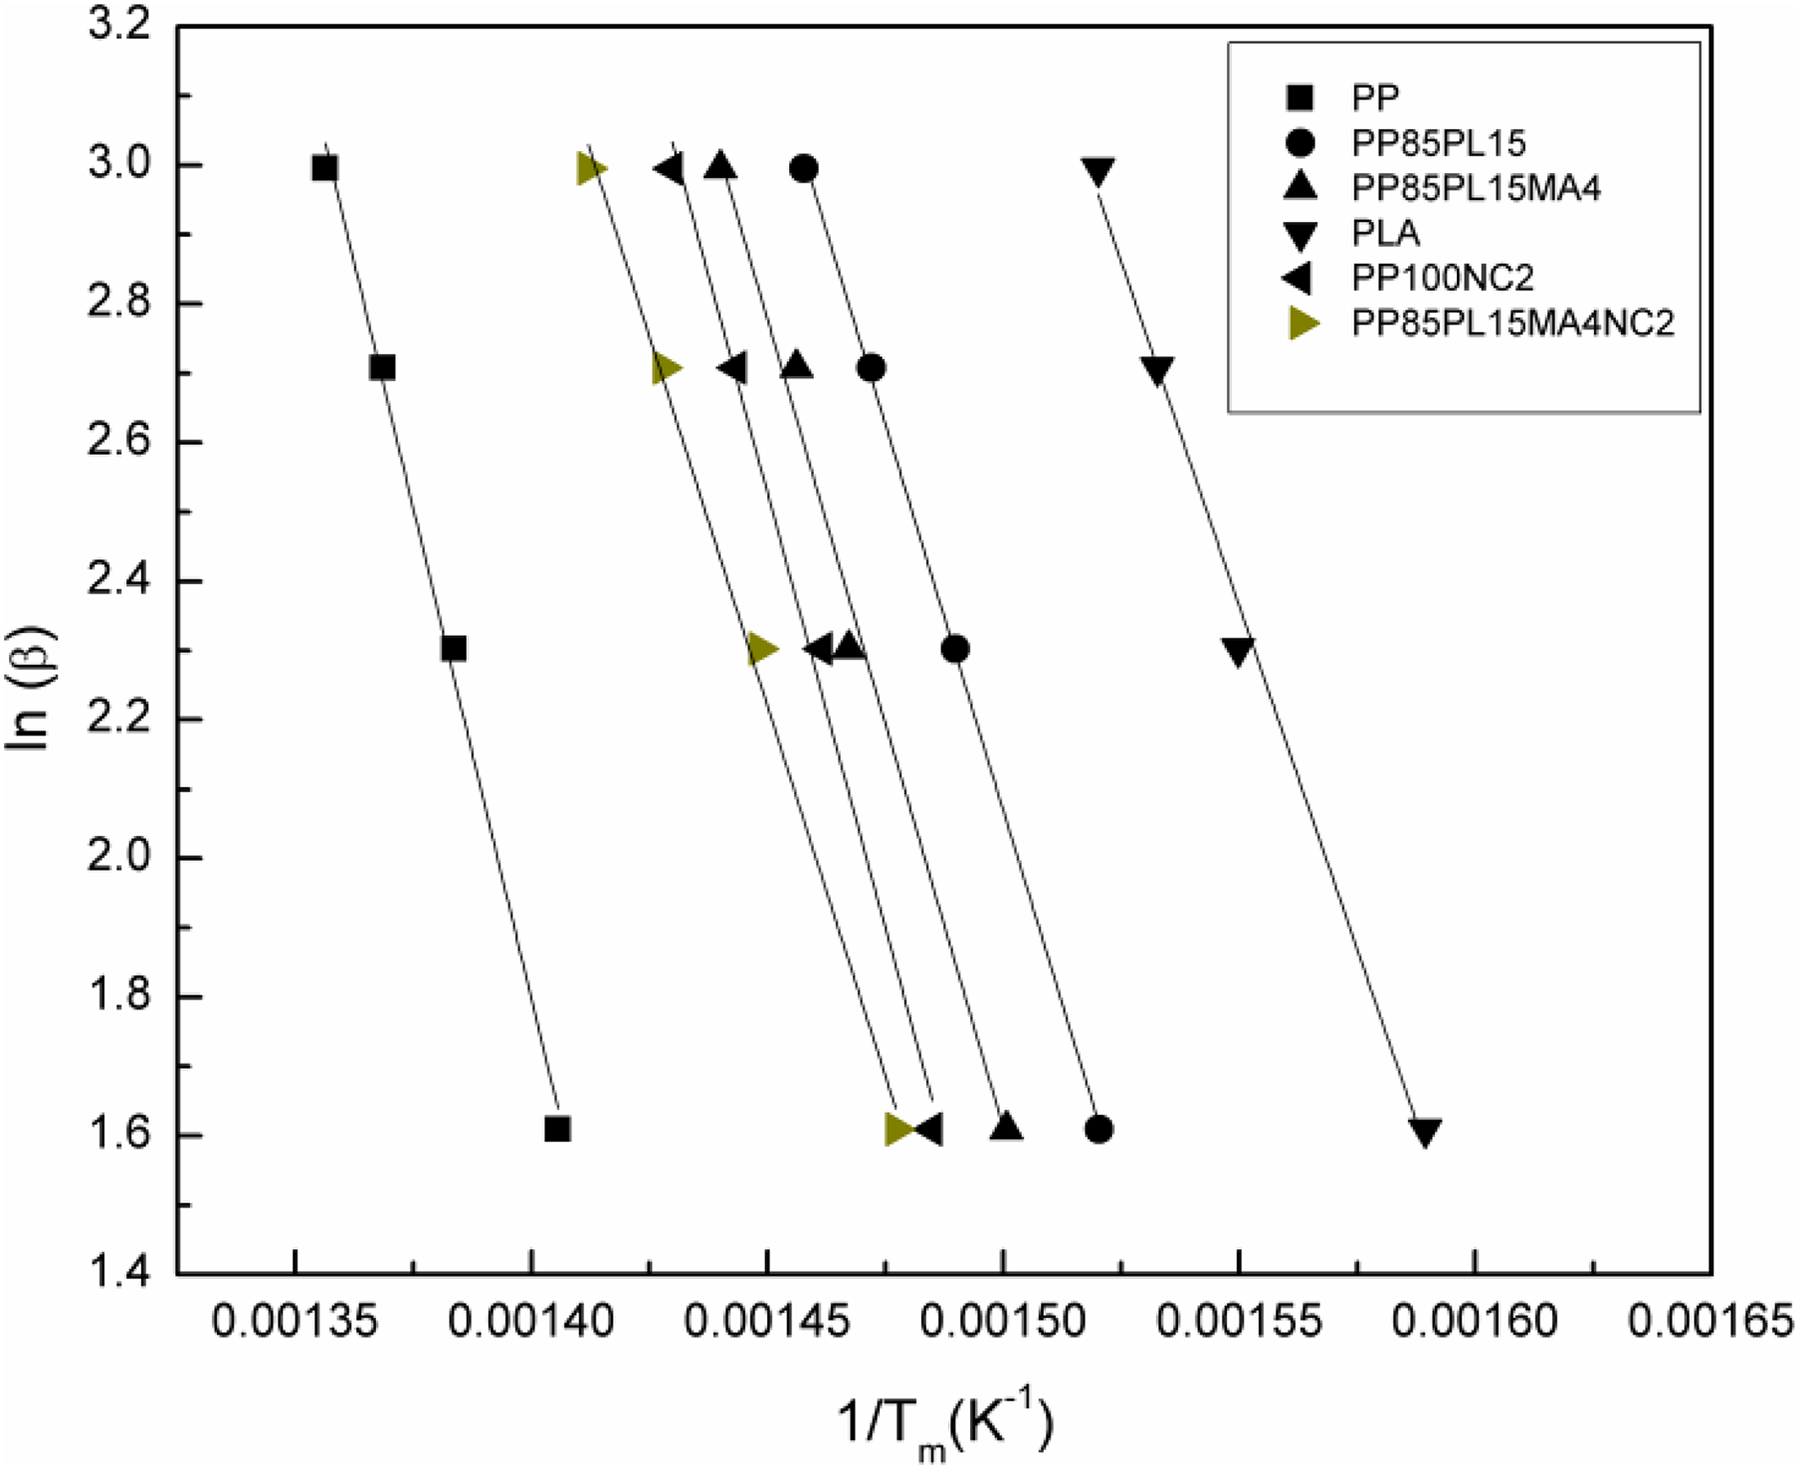
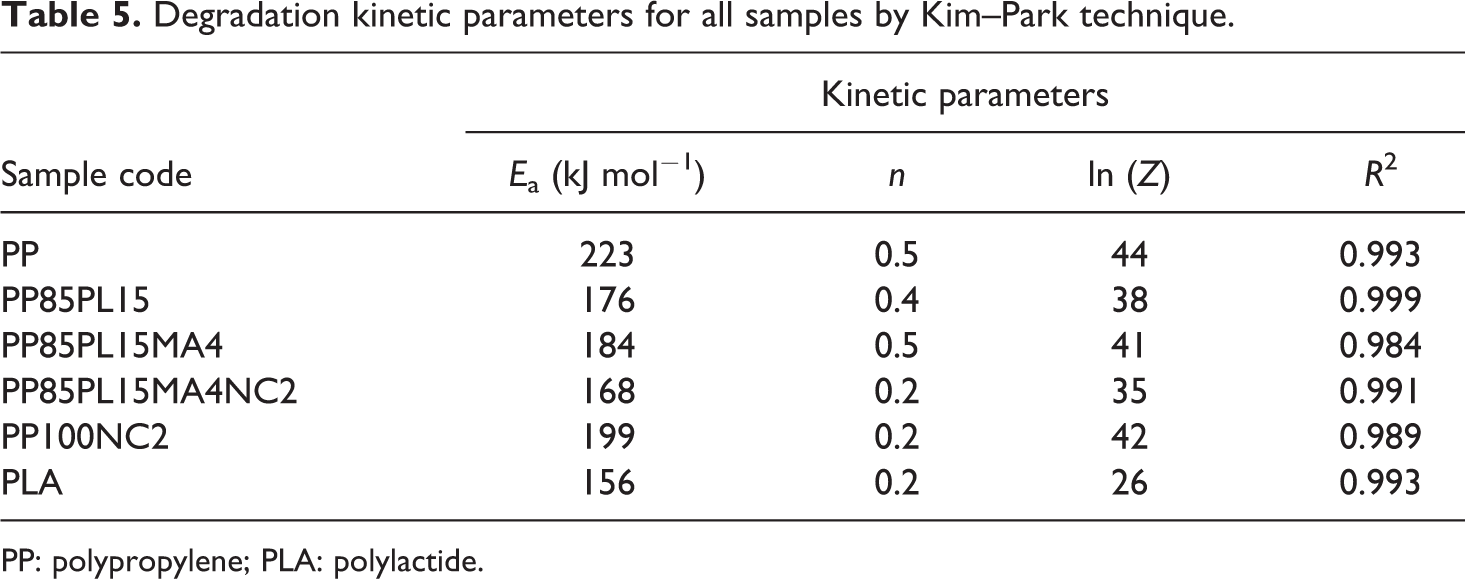
The plot of ln(β) versus (1/Tm) produced a straight line with the slope (−1.0516(Ea /R)). The Ea of thermal decomposition is calculated from the slope. Figure 4 shows the plot of ln(β) versus (1/Tm) at different heating rates 5, 10, 15, and 20°C min−1. The plots of PP, PP/PLA blends, and their nanocomposites show a straight line and their values are presented in Table 5. The value of Ea for PP and PLA is 223 kJ mol−1 and 156 kJ mol−1, respectively. The addition of PLA and nanoclay in PP decreases the value of Ea to 176 kJ mol−1 and 198 kJ mol−1, respectively. The Ea of PP100NC2 decreases due to the catalytic action of nanoclay in the polymer matrix of the composite system, 20 whereas the Ea of PP85PL15 decreases due to the incompatibility between the two polymers. The addition of compatibilizer increases the compatibility of the PP85PL15 blend and enhances the Ea to 185 kJ mol−1. Further addition of nanoclay in PP85PL15MA4 blend decreases the Ea to 168 kJ mol−1.
Kim–Park plots for all samples under nitrogen at different heating rates.
Degradation kinetic parameters for all samples by Kim–Park technique.
PP: polypropylene; PLA: polylactide.
Flynn–Wall method
The kinetic parameters of degradation were estimated by the Flynn–Wall method. 12 It is a logarithm of the integrated results expressed as following

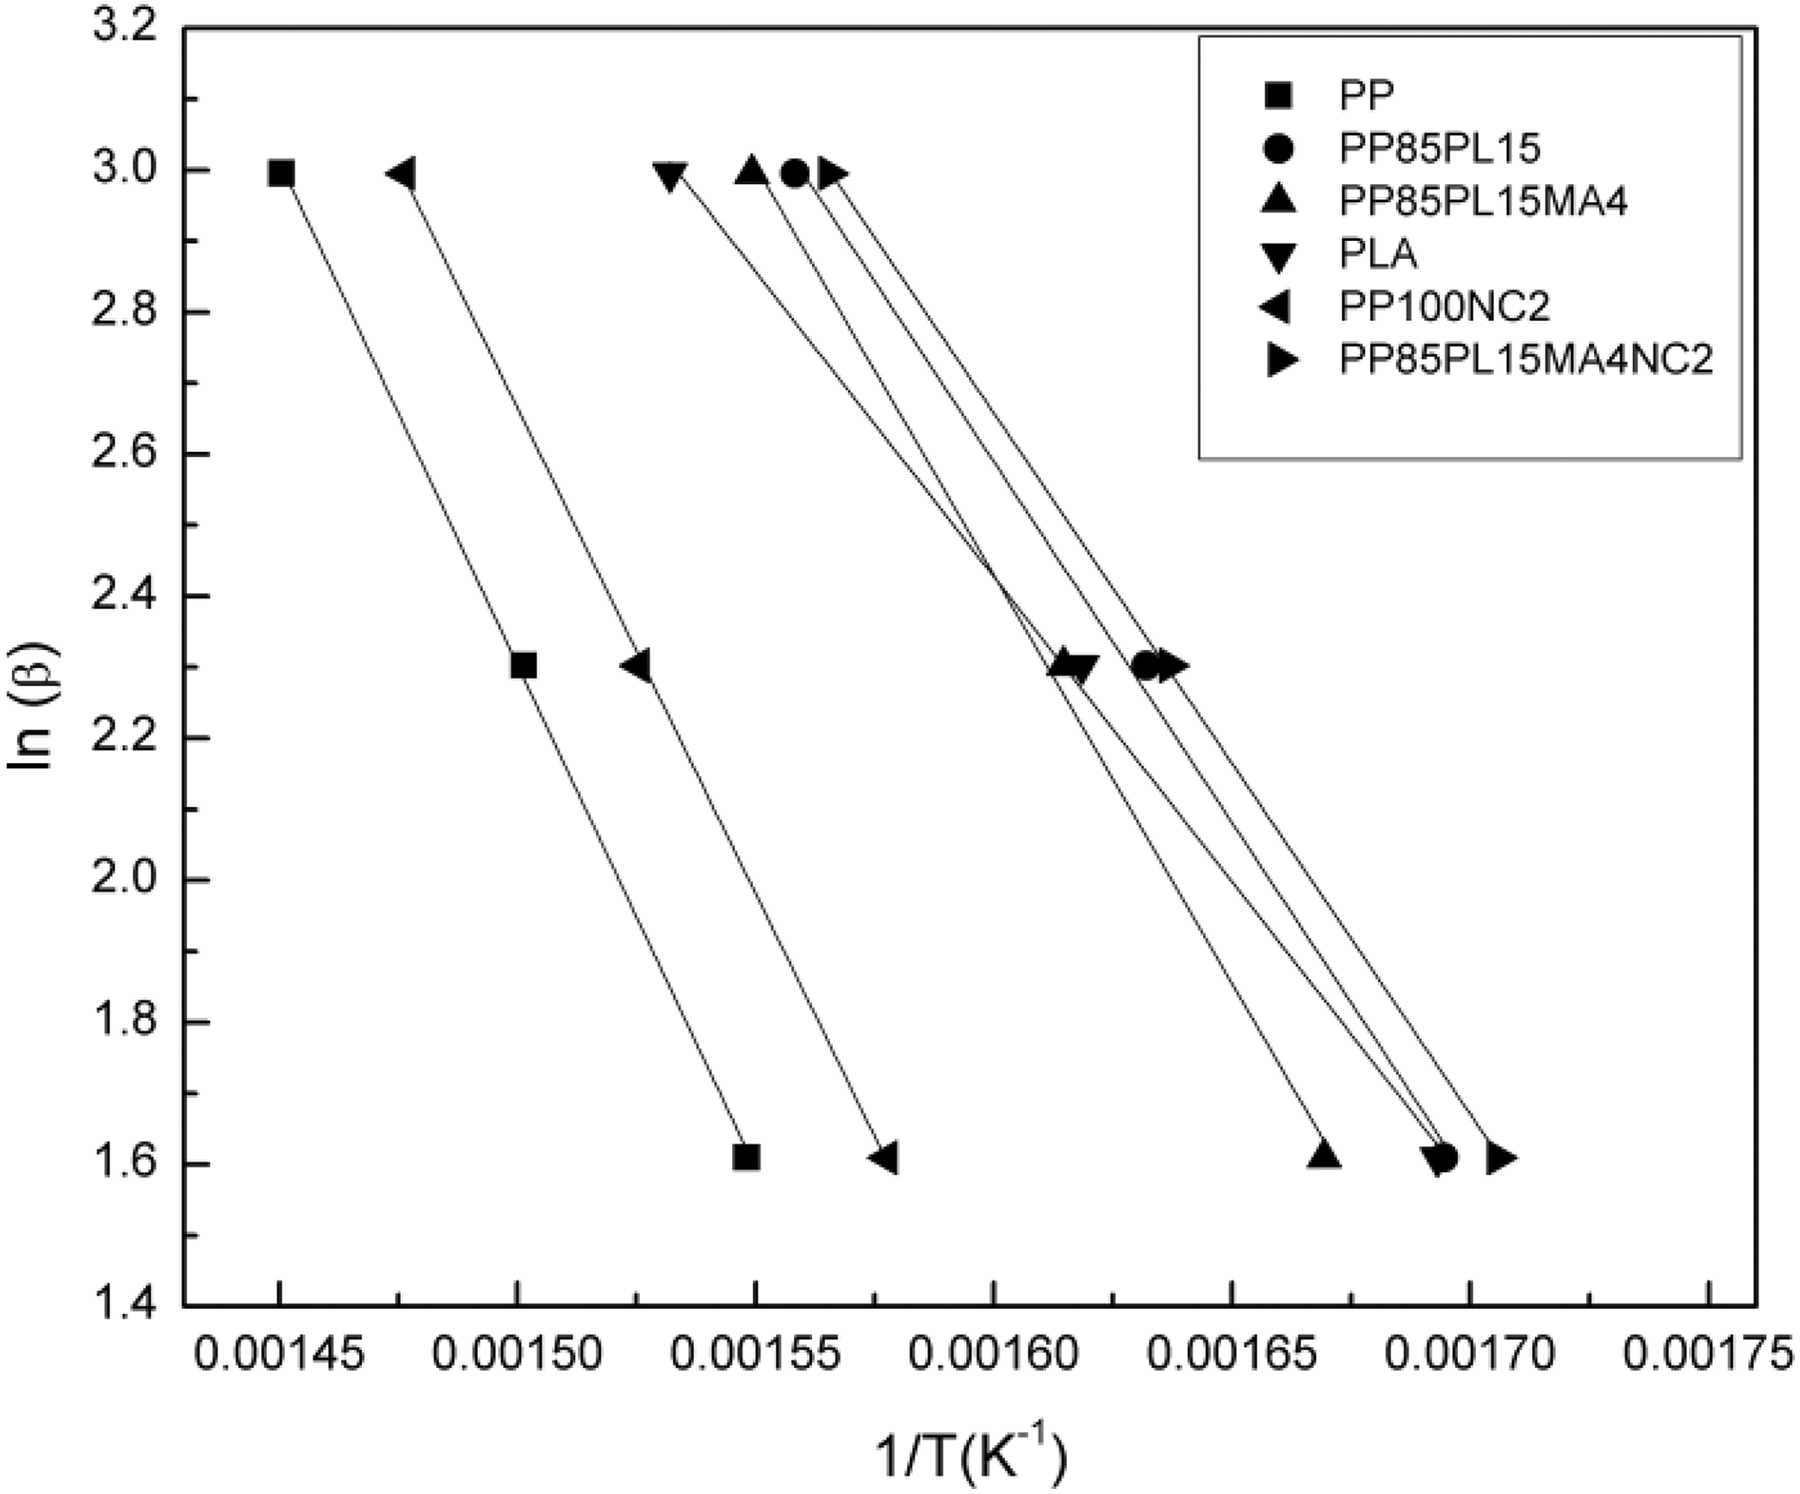
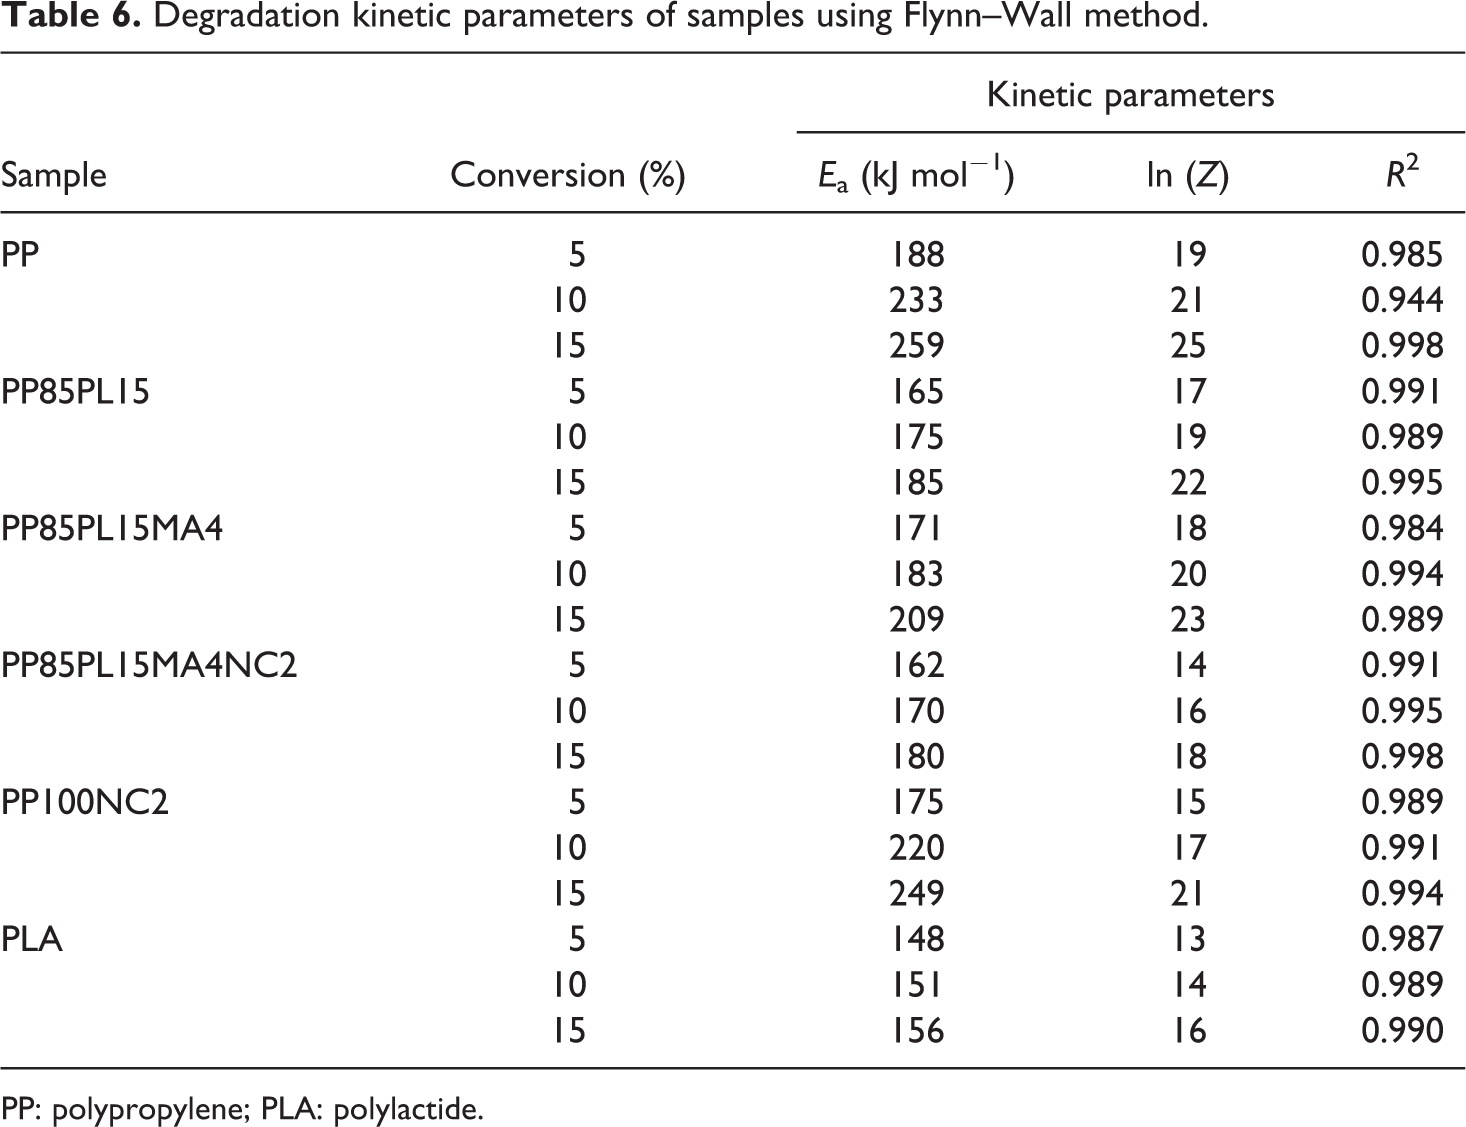
The plot of ln(β) versus (1/T) produced a straight line with the slope (−0.4567(Ea /R)). The Ea of thermal decomposition is calculated from the slope. The Flynn–Wall model can also be used to calculate the Ea of solid-phase reaction. Figure 5 shows the plot of ln(β) versus (1/T) at different heating rates. The plots of PP, PP/PLA blends, and their nanocomposites show a straight line and their values are presented in Table 6. The value of Ea at 15% conversion for PP and PLA is 259 kJ mol−1 and 156 kJ mol−1, respectively. The addition of PLA and nanoclay in PP decreases the value of Ea to185 kJ mol−1 and 249 kJ mol−1, respectively. The Ea of PP100NC2 decreases due to the catalytic action of nanoclay in the polymer matrix of the composite system, 20 whereas the Ea of PP85PL15 decreases due to the incompatibility between the two polymers. The addition of compatibilizer increases the compatibility of the PP85PL15 blend and enhances the Ea to 209 kJ mol−1. Further addition of nanoclay in PP85PL15MA4 blend decreases the Ea to 180 kJ mol−1.
Flynn–Wall plots at different heating rates under nitrogen of all samples for 15% conversion.
Degradation kinetic parameters of samples using Flynn–Wall method.
PP: polypropylene; PLA: polylactide.
The decompostion kinetic parameters are affected by different degradation mechanisms at both initial and final stages. In the initial stage, weaker bonds are the main cause of polymer degradation, which is confirmed by the low Ea at the initial stage. However, degradation of PP is a complex radical chain mechanism intiated by random chain scission and followed by radical transfer process. 22 The presence of methyl side groups in PP favors intramolecular hydrogen transfer during thermal degradation of PP. 23 The decomposition of PP generates smaller intermediate products after which further reaction produces low-molecular-weight products in the form of liquids and gases. 24 In this process, small fragments from the polymers could be evaporated and weight loss is recorded. Hence, the weight change rate of the polymer is influenced by both chemical and physical processes.
Rate constant versus temperature
Figure 6 shows the plots of rate constant versus temperature of PP, PP/PLA blends, and their composites. The rate constant changes with the temperature. All samples show a slow increase of rate constant at lower temperature and an exponential increase of rate constant at higher temperature. The value of rate constant of all the blended and nanocomposite samples is lower than PP, but the trend of all the samples is almost similar throughout the region. The threshold value of the rate constant is different for all the samples.
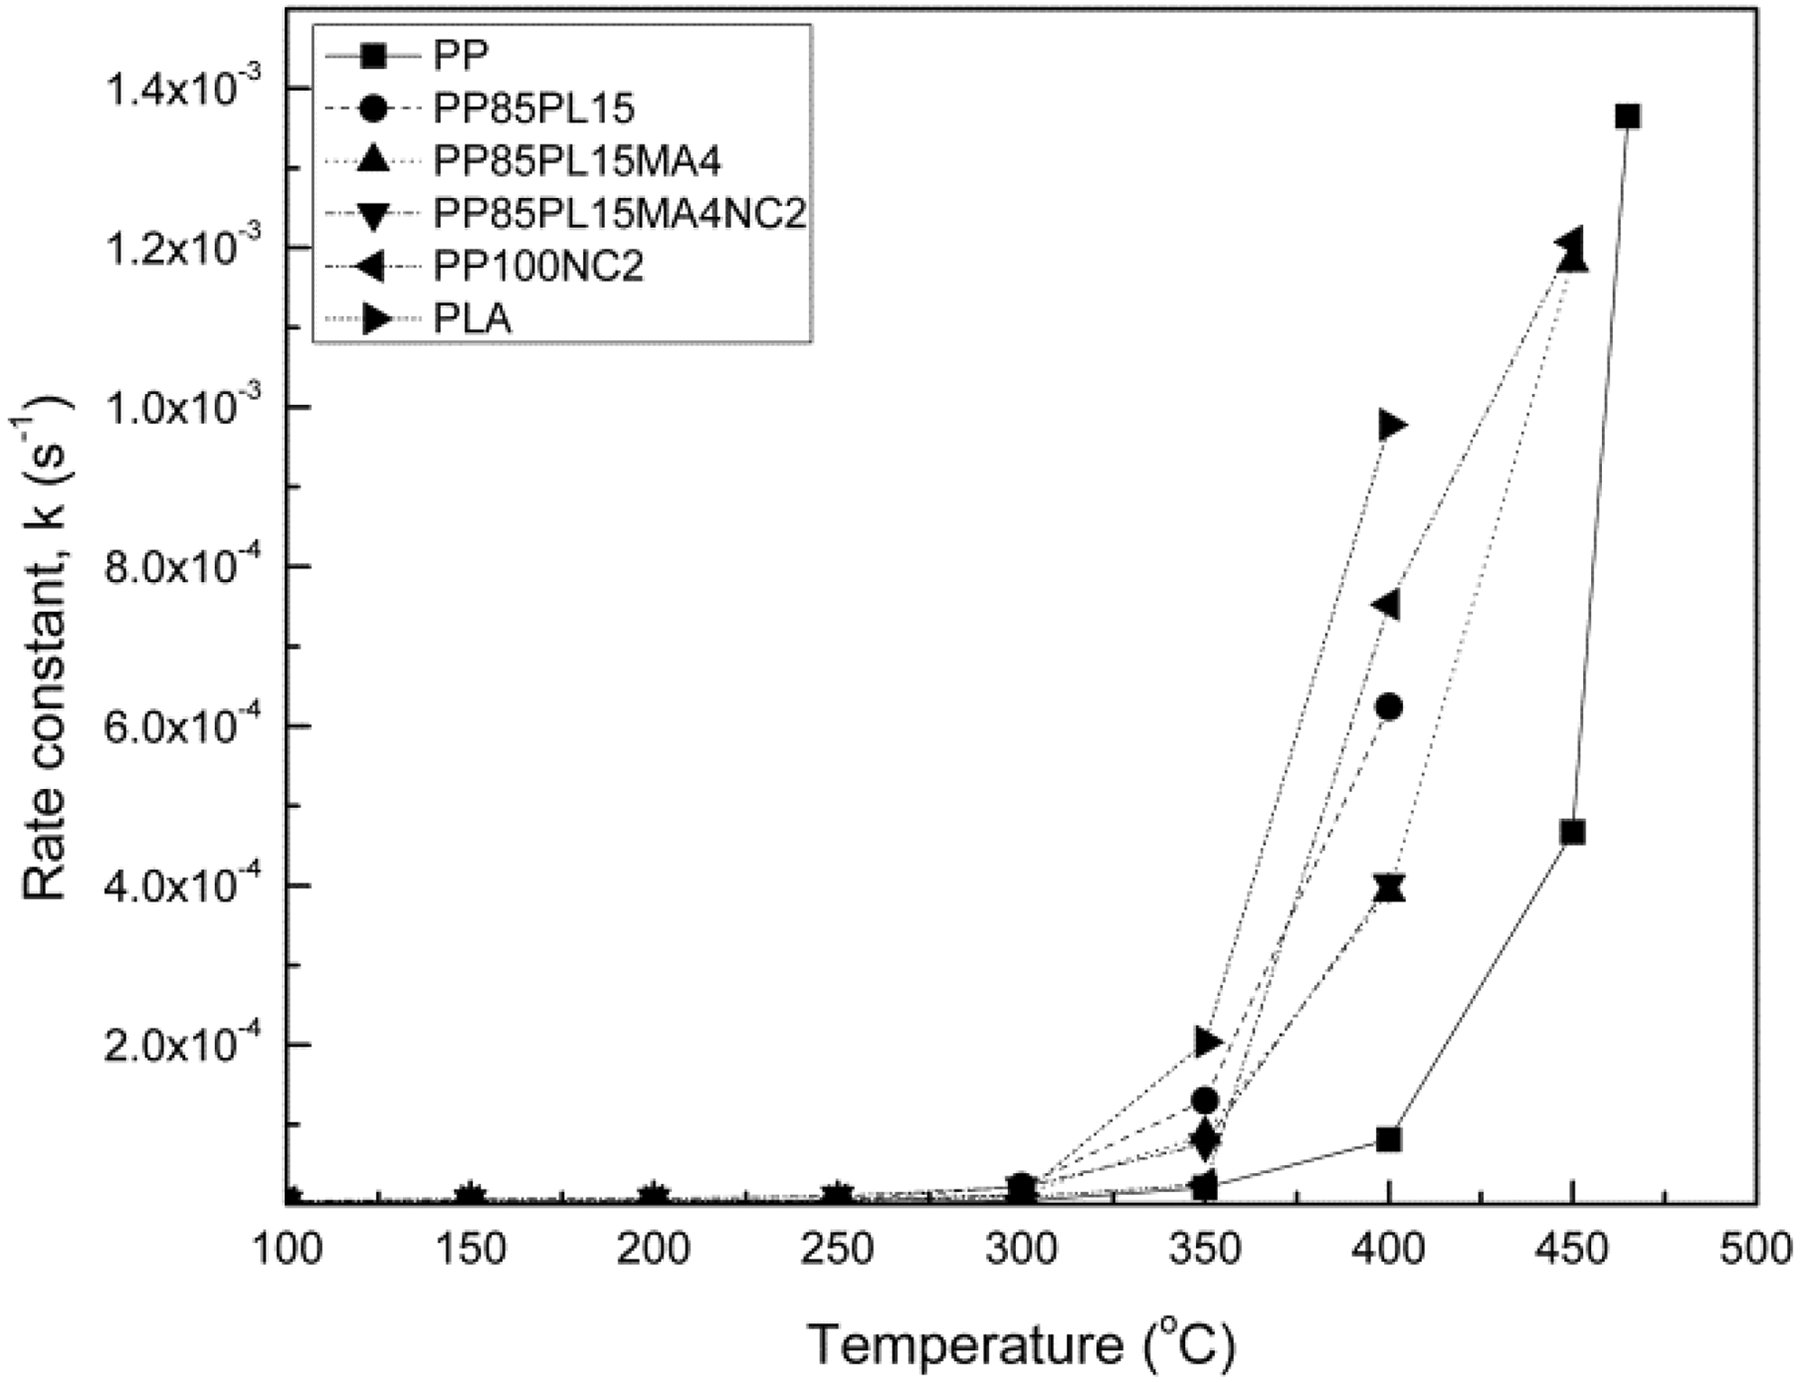
Rate constant versus temperature plots for PP, PP/PLA blends, and their composite samples at 5% conversion.
Lifetime estimation
The life cycle of PP, PP/PLA blends, and their nanocomposites is calculated using Toop’s equation 25 expressed as below


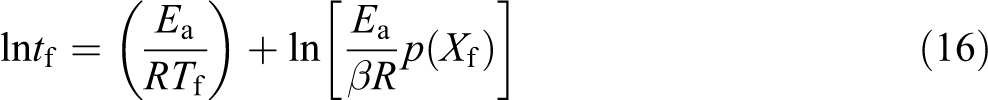
where Xf is Ea/RTc and Tc (K) is the temperature at 5% weight loss. 26 tf is estimated as the time of failure (min). Tf is the failure temperature (K) and log p(Xf) is a function of Xf. The Ea is calculated from Kissinger, Kim–Park, and Flynn–Wall (at conversion = 15%) methods at a β of 5°C min−1. Lifetime values of PP, PP/PLA blends, and their composites were calculated using equation (16) with the Ea. The estimated lifetime of PP, PP/PLA blends, and their nanocomposites is shown in Figure 7. It is very clear that the lifetime of all the samples decreases with increase in temperature irrespective of the method used for estimation. For example, the lifetime of neat PP by thermal degradation at 30°C estimated by three methods, namely, Kissinger, Kim–Park, and Flynn–Wall method, is 4.6 × 10⁷, 1.2 × 10⁸, and 1.05 × 10¹¹ years, respectively, whereas these values are much lower at 50°C—2.6 × 10⁵, 6.04 × 10⁵, and 18.6 × 10⁷ years, respectively. Similarly, in the case of PP85PL15, the estimated lifetime is 4.6 × 10⁵, 3.7 × 10⁵, and 1.5 × 10⁶ years at 30°C and 6.1 × 10³, 4.9 × 10³, and 1.6 × 10⁴ years at 50°C, respectively. In the case of PP100NC2, the estimated lifetime is 7.0 × 10⁶, 2.8 × 10⁷, and 1.8 × 10¹⁰ years at 30°C and 1.7 × 10⁴, 1.7 × 10⁵, and 4.09 × 10⁷ years at 50°C, respectively. The lifetime of PP85PL15 blend is lower than PP due to the incompatibility of the two polymers, which decreases the thermal stability and lifetime of the blended sample. 19 The lifetime of PP100NC2 composite is lower than PP due to the catalytic effect of nanoclay in the polymer matrix, which decreases the thermal stability and lifetime of the composite materials.
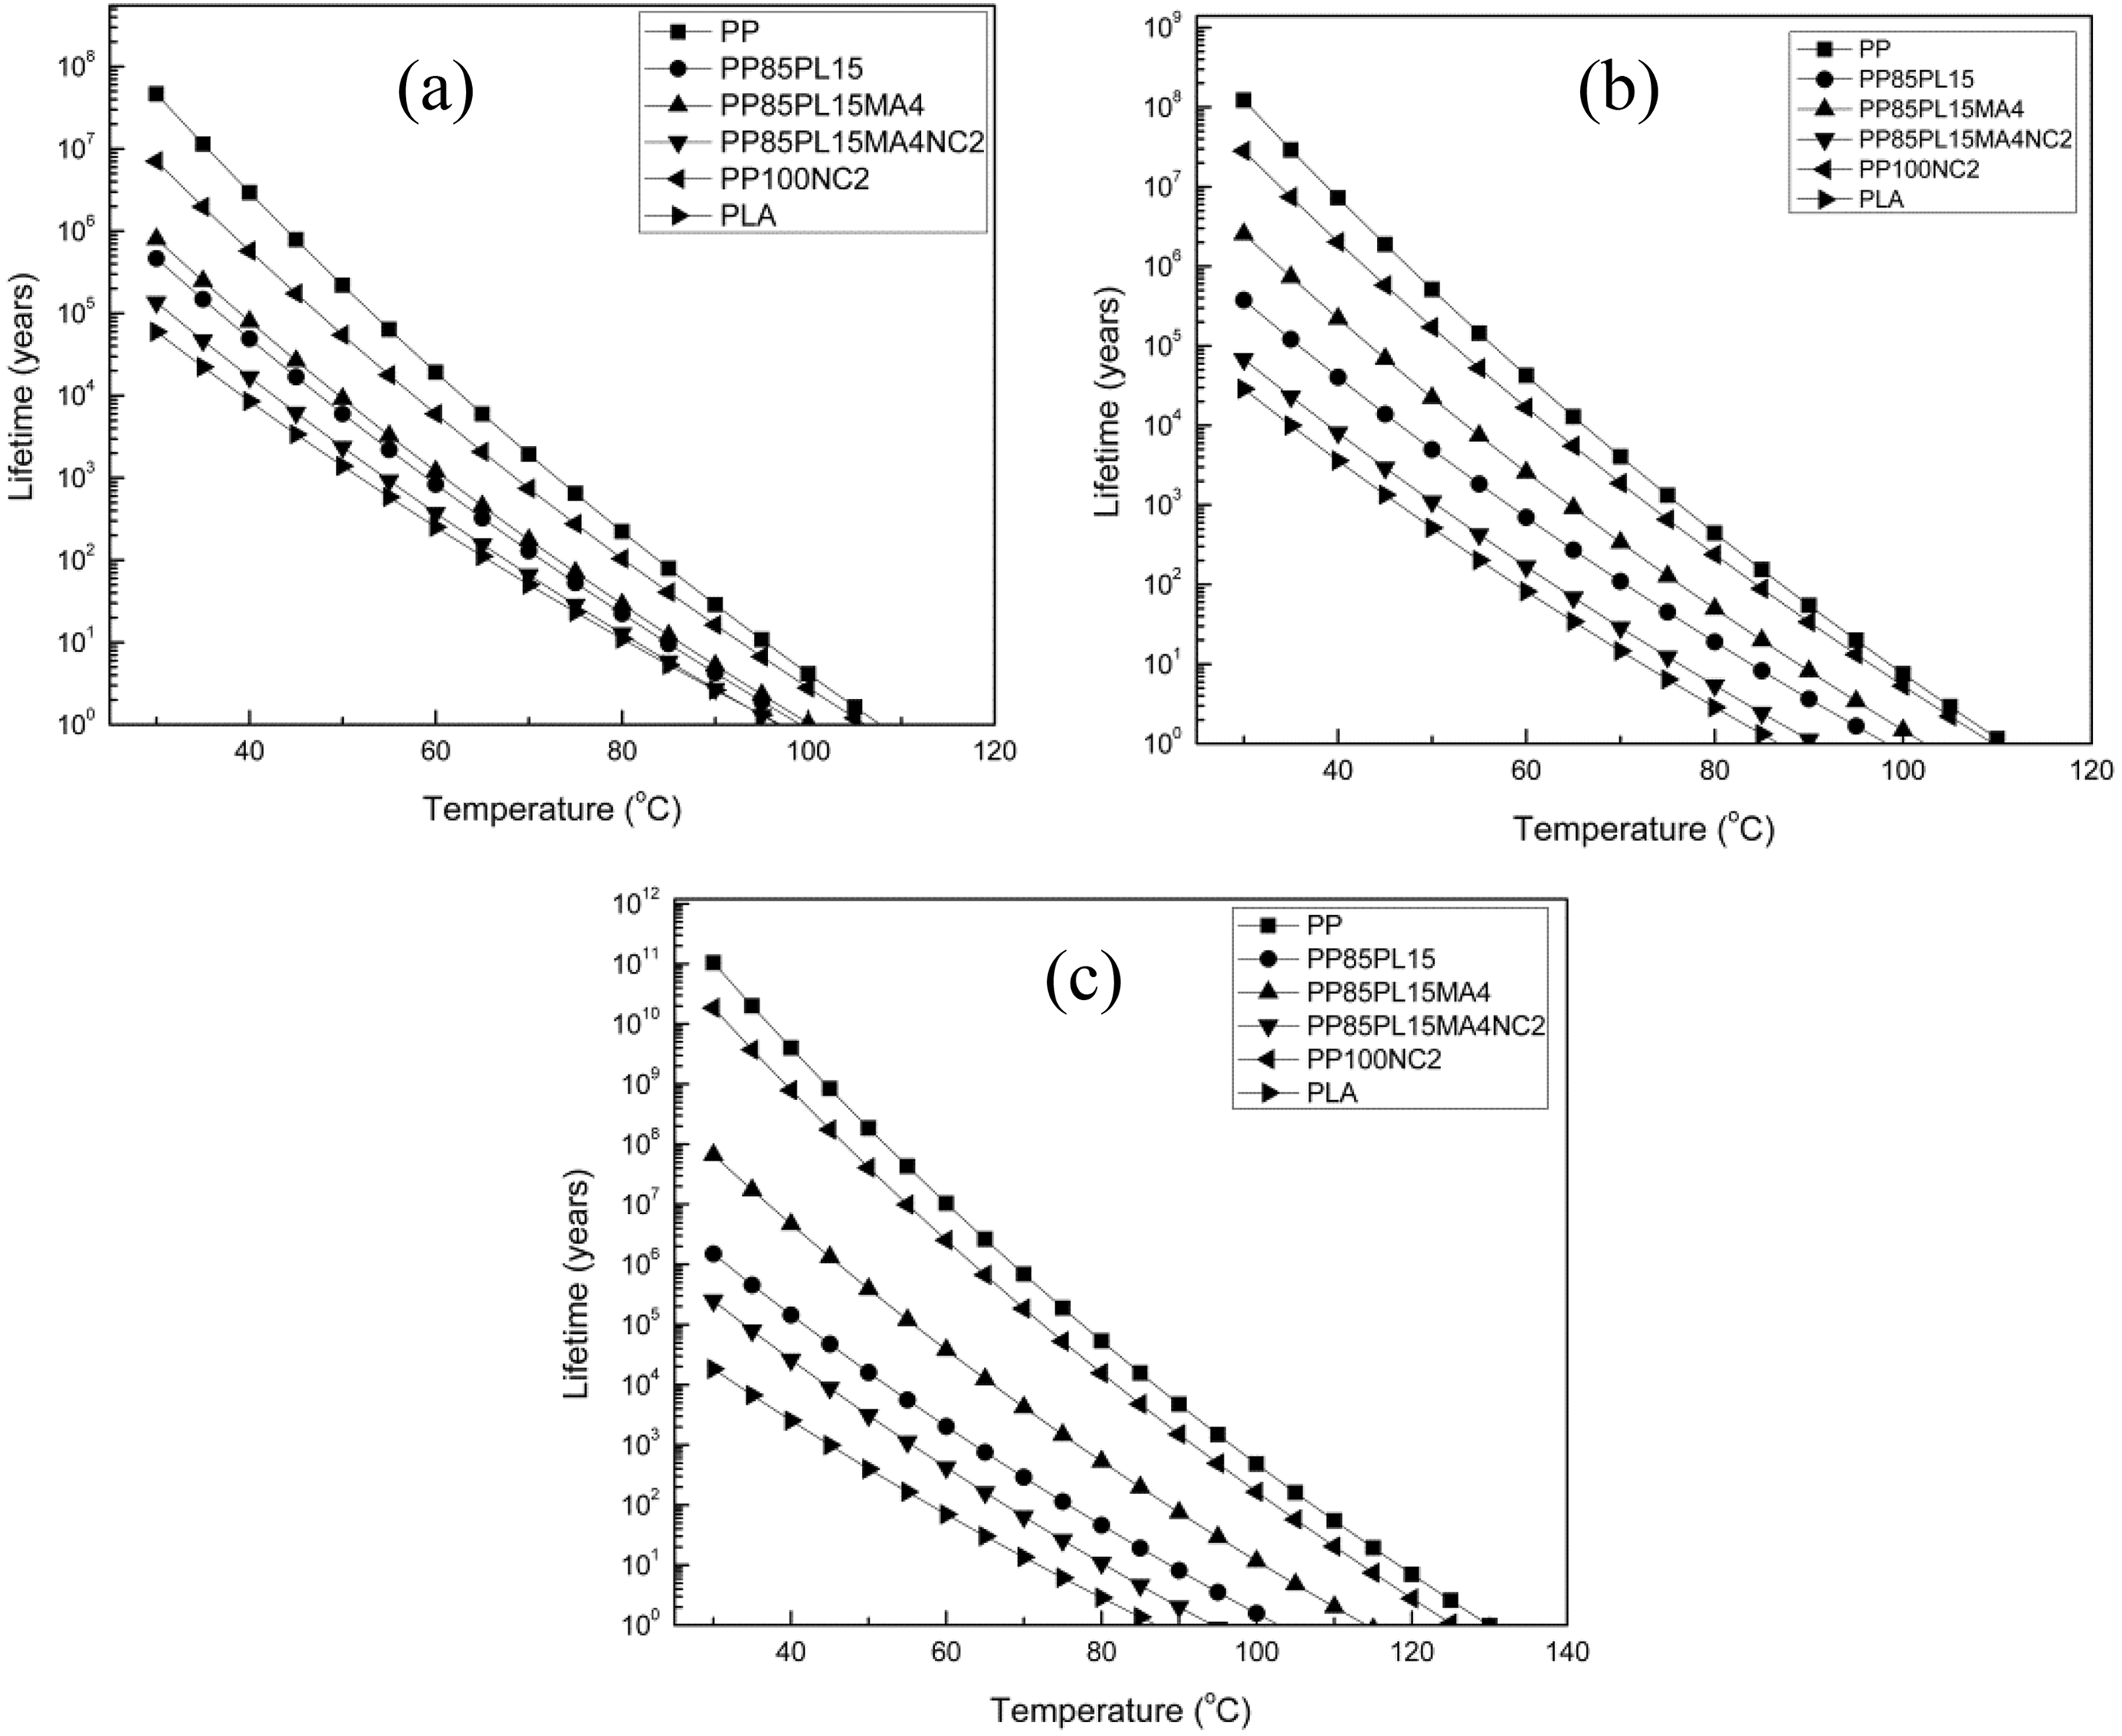
Lifetime of PP, PP/PLA blends, and their composites by (a) Kissinger (b) Kim–Park, and (c) Flynn–Wall methods.
Conclusions
In this work, the thermal degradation of PP, PP/PLA blends, and their composites was studied under nitrogen atmosphere. PP, PLA, and nanoclay-filled PP show a single-step thermal degradation thermogram, whereas PP/PLA blends show two-step thermal degradation thermogram. The thermal stability of PP was decreased with the addition of PLA in the blended sample, whereas the addition of compatibilizer increases the thermal stability of PP/PLA blends mainly due to the increased interfacial adhesion and interaction between the polymer chains of the two polymers. The addition of nanoclay also decreases the thermal stability of PP films. The variation in the degradation trends shown by the data of different samples is obviously due to the difference in degradation reaction mechanism, sample composition, and microstructural features of the polymers in the blends and nanocomposites. The Ea of PP/PLA blends is lower than PP due to the radical character of degraded PLA derivatives, which affects the initial thermal degradation reaction. The degradation kinetic parameters Ea, n, and ln (Z) of the blends and composites are constituent dependent. The lifetime of all the samples decreases drastically with the increase in temperature. The addition of nanoclay results in reduced lifetime of PP. The FTIR studies confirmed the compatibility between two polymers in the blend and confirmed the presence of nanoclay in composite samples.
Footnotes
Acknowledgement
The authors wish to express their sincere thanks to the Council of Scientific and Industrial Research (CSIR), Govt. of India, for funding the work.
Funding
The author(s) disclosed receipt of the following financial support for the research, authorship, and/or publication of this article: This work was financially supported by the Council of Scientific and Industrial Research (CSIR), Govt. of India, through scheme number 22(00745)/17/EMR-II.