
Abstract
In this work, a kinetic study on the thermal degradation of films prepared from high-density polyethylene (HDPE), poly(
Introduction
In the year 2012, India became the third largest consumer of polymers in the world with 12.5 million tonnes per annum (TPA), after the United States (39 million TPA) and China (37.5 million TPA). 1 Of this huge consumption of polymers, polyolefins account for over 60% share, which are predominantly utilized for consumer packaging. However, these polymers are not biodegradable and the quantum of waste generated from post-consumer plastic poses serious environmental challenges. 2 Biodegradable aliphatic polyesters such as poly(L-lactic acid) (PLLA) and poly(ε-caprolactone) have high prospects to replace petroleum-based polymers. 3 PLLA, especially, has been studied most extensively, as it is easy to produce from renewable resources and its processability is almost equivalent to the conventional thermoplastics. 4 Initially, PLLA was primarily utilized in medical applications only because of its high cost, but presently, it is being produced in large volumes and extensively used as single-use disposable items, thus available at lower price compared with other biodegradable polymers. 5 Attempts are being made to utilize polyolefins in conjunction with biodegradable polymeric materials and develop ecocompatible blends for sustainable environment. 6 –12 However, during preparation process of blends, polymers are usually subjected to high temperatures, and therefore, it is imperative to know the effect of one polymer on the thermal stability of the other. 13 Moreover, thermal degradation of polymers is of great interest as polymers are an alternative source of energy or chemical raw materials as well as it contributes to the solution of environmental problems. 14 Many aspects of polymer blends containing polyethylene (PE) and PLLA have been studied extensively but their thermal stability is still unclear. Although the properties and thermal degradation mechanism of PE is reasonably well known, 15 –18 but when blended with PLLA, this polymer behaves differently and the thermal stability of these blends may be altered with respect to each other. Similarly, in commercial grades of PLLA, low proportions of D-lactic enantiomer reduces its rate of crystallization to such levels that under standard processing conditions the product is practically amorphous and brittle. 19 In this way, the investigation of thermal stability and degradation kinetics of PE/PLLA blends becomes very important and interesting.
Thermogravimetry (TG) is the most commonly used technique for quickly analyzing the thermal degradation kinetics of polymer materials because of its simplicity, accuracy and detailed information provided by a simple thermogram. The kinetic modelling of the thermal decomposition process of a polymer or polymer blend plays an important role in accurately predicting its behaviour under different environments. Therefore, a precise prediction requires information of the kinetic parameters, namely activation energy (Ea), frequency factor (ln (A)) and the reaction model (f(α)). 20 This latter parameter, also known as conversion function, is an algebraic expression associated with the physical model that describes the kinetics of a solid-state reaction.
Several methods for the calculation of kinetic parameters of the thermal degradation by TG measurements have been developed. These can be classified into two groups: single heating rate methods and multiple heating rate methods. In single heating rate methods such as Friedman, 21 Freeman–Carroll 22 and Coats–Redfern, 23 the kinetic parameters can be calculated from only one TG and one derivative thermogravimetric (DTG) curve obtained at a single heating rate, whereas in the multiple heating-rate methods like Flynn–Wall, 24 Ozawa, 25 Reich, 26 Kim–Park 27 and Kissinger, 28 calculation of the kinetic parameters is performed from thermograms obtained at various heating rates. Friedman’s method can be considered as both single heating rate method and multiple heating rate method. 29 The multiple heating rate Friedman method is based on a comparison of weight loss rates (dα/dt) for a fractional weight loss, determined at different heating rates. Another classification of methods for the analysis of kinetic parameters is either model fitting or model-free methods. 30 Both the methods can be performed under isothermal and non-isothermal conditions. 31 The model-free methods require several kinetic curves to perform the analysis. Calculations from several curves at different heating rates are performed on the same value of conversion, which allows calculating the activation energy for each conversion point. The best known representatives of the model-free approach are the isoconversional methods. Model fitting methods consist of fitting different models to the thermogravimetric analysis (TGA) data so that a model is chosen when it gives the best statistical fit as the model from which the kinetic parameters are calculated.
Since the thermal degradation of the polymers is a very complex reaction, the choice of a reliable model or a combination of kinetic models is extremely important. Historically, model fitting methods were widely used for solid-state reaction because of their ability to directly determine the kinetic parameters from a single TGA measurement, but in recent years, the use of model-free (isoconversional) methods increased. 32 The reason behind the poor status of model fitting methods is that the deriving kinetic parameters for an assumed model from a single heating rate produce unreliable and sometimes nonsensical results. Following this, some advanced isoconversional methods like Vyazovkin, 33 which have their roots in the Friedman and Flynn–Wall–Ozawa methods of the 1960s, have become increasingly popular.
In the present research work, thermal degradation process of high-density PE (HDPE)/PLLA blends is studied by TGA, and the thermal analysis curves were recorded at several linear heating rates. Kinetic analysis is performed with the application of model-free methods suggested by Friedman, Kissinger and Flynn–Wall. The TGA data and the estimated kinetic parameters of HDPE/PLLA blends were later employed to predict their lifetime.
Theoretical considerations
In general, the rate of degradation or conversion with temperature or time (dα/dt) is calculated in terms of weight loss, that is:

where, wi, wt and wf are the initial weight, actual weight at time t and the final weight, respectively. The wf is measured at the end of the degradation.
The rate of thermal degradation, based on chemical reaction (solid state), is usually based on a single-step kinetic equation: 34

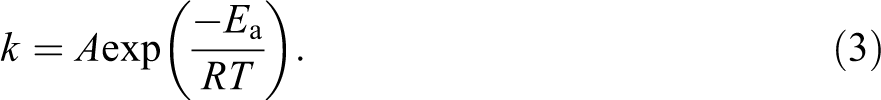
where r is the rate of reaction (degradation), f(α) is the reaction model and k is the temperature-dependent rate constant, which is generally assumed to follow the Arrhenius equation:
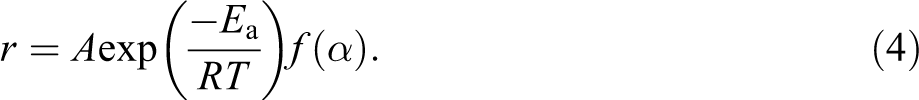
Combining equations (2) and (3), the rate of degradation can be expressed as:
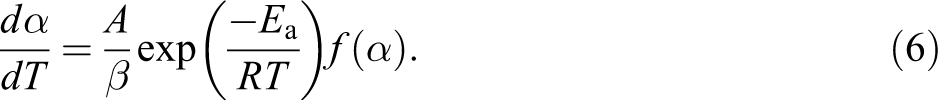
In TGA, if the heating rate is shown as β, which is equal to dT/dt, the degree of conversion α can be expressed as the function of the temperature, which is further dependent on the heating time. Therefore:

From equations (4) and (5), the following expression may be obtained:
Integrating both sides of the above equation, it becomes:
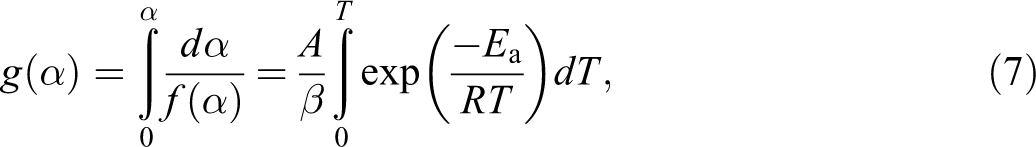
where, g(α) is the integral function of α.
The degradation process of polymer materials generally follows the sigmoidal or deceleration functions, which can be used to analyze the reaction mechanism imitated by the dynamic TG curves. 35
Experimental
Materials
HDPE pellets of film grade (trade name F5400®) having density of 0.954 g cm−3 and melting temperature (Tm) of 131°C was purchased from Haldia Petrochemicals Limited (Haldia, Purba Medinipur, West Bengal, India). PLLA (trade name L9000®), containing 2% w/w D-isomer and having weight-average molecular weight
Methods
Blends of HDPE/PLLA with and without MA-g-HDPE were prepared by melt blending in a Brabender plastograph twin-screw extruder mixer (Brabender® GmbH & Co. KG, Duisburg, Germany). The melt mixing was performed at 190°C with 50 r min−1 rotor speed for 4 min. Films were then casted from the blends at 190°C and 5 MPa pressure in a moulding press (George E. Moore Press, UK) for 2 min to obtain 40–45 μm thick films. The names assigned to different blend samples, their formulations and the thickness of the film obtained from them are given in Table 1.
Sample names, formulation and film thickness obtained.
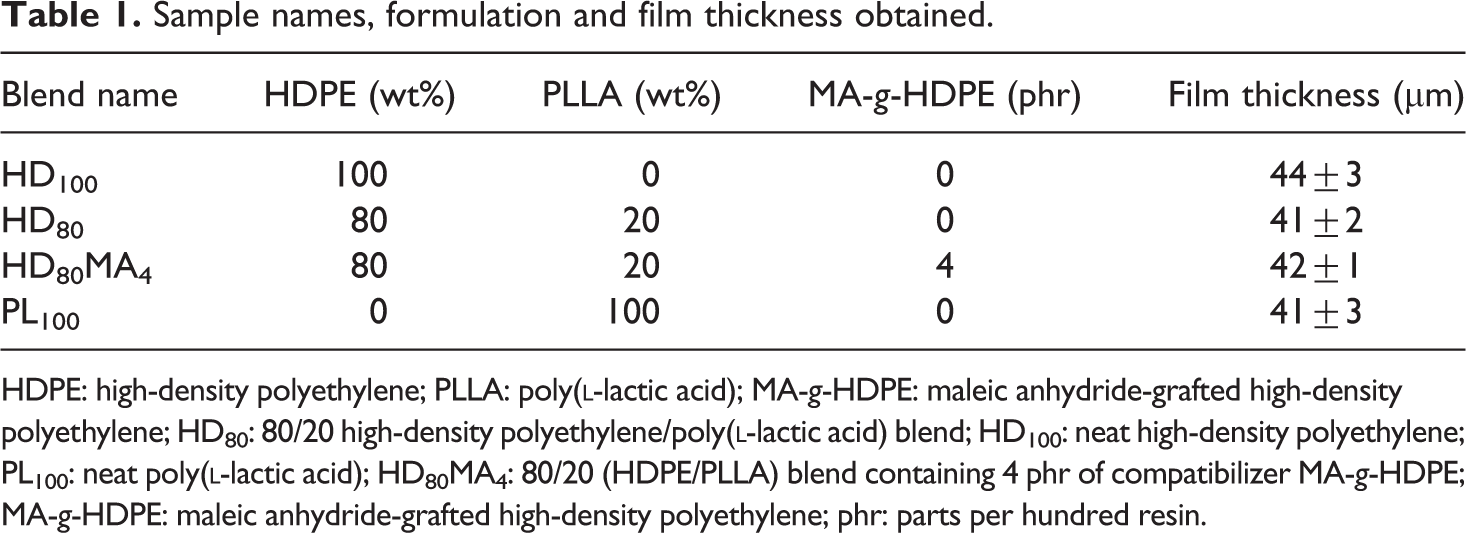
HDPE: high-density polyethylene; PLLA: poly(
For thermal analysis, each sample weighing around 5 mg was heated from room temperature to 650°C at four heating rates (5, 10, 15 and 20°C min−1) under nitrogen atmosphere with a flow rate of 50 mL min−1. The time interval of each sample for recording sample weight loss was 1 s. The kinetics of thermal degradation of the prepared HDPE/PLLA blended film samples were calculated by following techniques:
Friedman method
Friedman method 21 is a differential and one of the first isoconversional methods based on the basic Arrhenius equation, and its mathematical expression is given by:

From the linear plot of ln (dα/dt) versus (1/T), Ea can be obtained from its slope, which is equal to (−Ea/R). Similarly, Ea/nR can be calculated from the linear plot of ln (1 − α) versus 1/T.
Kissinger method
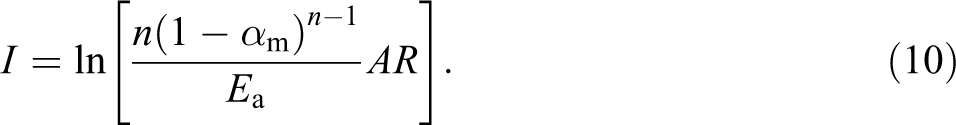
The Kissinger method 28 is a model-free isoconversional multiple heating rate technique in which there is no need to calculate Ea for each conversion value in order to evaluate kinetic parameters. The equation of this method is expressed as:
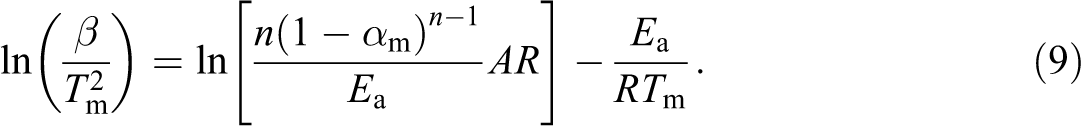
Here, Ea value can be calculated from the slope of the plot between
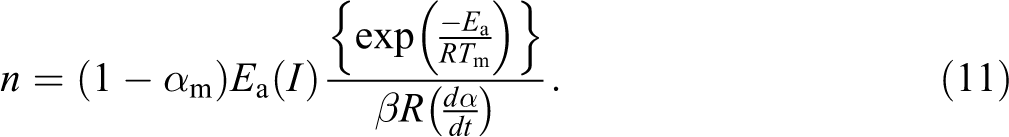
The value of n can be obtained from the following equation:
Flynn–Wall method
The multiple heating rate method proposed by Flynn–Wall 24 uses the following approximate equation at a constant weight loss in a thermal degradation process.

From this equation, Ea can easily be calculated based on the slope of a plot of ln β versus 1/T at a fixed weight loss.
Lifetime prediction
The approximate lifetimes of HDPE, PLLA and their blends are calculated to envisage the stability of their films in temperature range of 50–250°C. On the basis of the average values Ea, n and ln (A) obtained, the lifetime estimates for pure HDPE, pure PLLA and the blends generated from the conversion (weight loss) of 5% are constructed using the equation (equation (6.14)) given by Toop 36 and subsequently applied by Paik and Kar. 37

where tf is approximated time of failure, Tf is the temperature at failure and p(Xf) is a function whose value depends on the Ea at the failure temperature.
Scanning electron microscopy
Scanning electron microscopy (SEM) was used to characterize the fracture surface morphology of the film samples in a JEOL scanning electron microscope (JSM 5800; Tokyo, Japan) using an acceleration voltage of 10 kV. The samples were immersed in liquid nitrogen for 30 s (approximately), and a brittle fracture was performed. After proper drying, all the specimens were sputter coated with 5 nm thick gold film in an automatic sputter coater (Polaron, East Sussex, UK) to avoid the charging effect and to enhance the emission of the secondary electrons.
Results and discussion
Thermal stability
Figure 1 shows the TG and DTG curves for (a) neat HDPE (HD100), (b) 80/20 (HDPE/PLLA) blend (HD80), (c) 80/20 (HDPE/PLLA) blend containing 4 phr of compatibilizer MA-g-HDPE (HD80MA4) and (d) neat PLLA (PL100) at four different heating rates (5, 10, 15 and 20°C min−1).
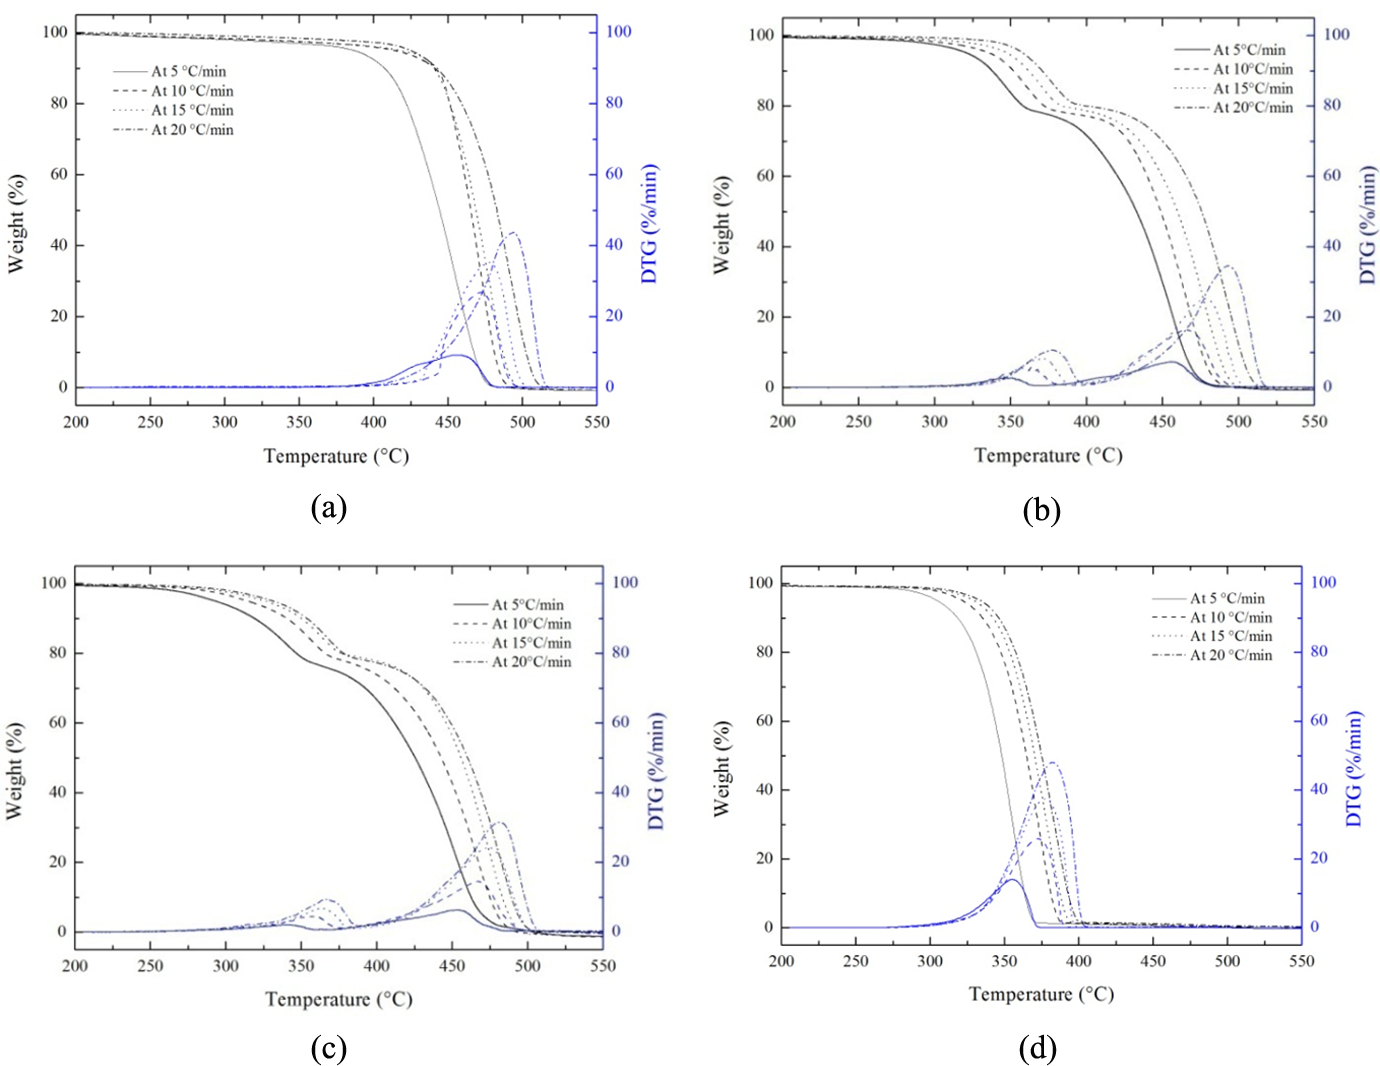
(a) TG and DTG curves of HD100. (b) TG and DTG curves of HD80. (c) TG and DTG curves of HD80MA4. (d) TG and DTG curves of PL100. TG: thermogravimetry; DTG: derivative thermogravimetry; HD100: neat high-density polyethylene; HD80: 80/20 high-density polyethylene/poly(
The TG curves of HD100 and PL100 samples exhibit single-step decomposition over a relatively short temperature range. In inert atmosphere, random scission has been reported to be the primary pathway for degradation inPE. 38 It is observed that the degradation temperature is increased with increase in the heating rate (β), which is in agreement with the principle of time–temperature superposition. At a faster heating rate, a particular sample requires lesser time to reach the assigned temperature. The TG curves of 80/20 (HDPE/PLLA) blends, that is, HD80 and HD80MA4 reflected a two-step degradation process, showing degradation process of the HDPE and PLLA components individually. The range of each degradation temperature corresponded to that of HDPE or PLLA homopolymers, and the ratio of weight loss in every step was similar to the composition ratio of each ingredient. These observations imply that the HDPE and PLLA ingredients did not significantly influence the degradation temperatures of each other. The initial degradation temperature (Ti), temperatures at the maximum rates of thermal decomposition and final temperature of degradation (Tf) calculated at different heating rates are shown in Table 2.
TGA data for HDPE, PLLA and their blends at different heating rates.
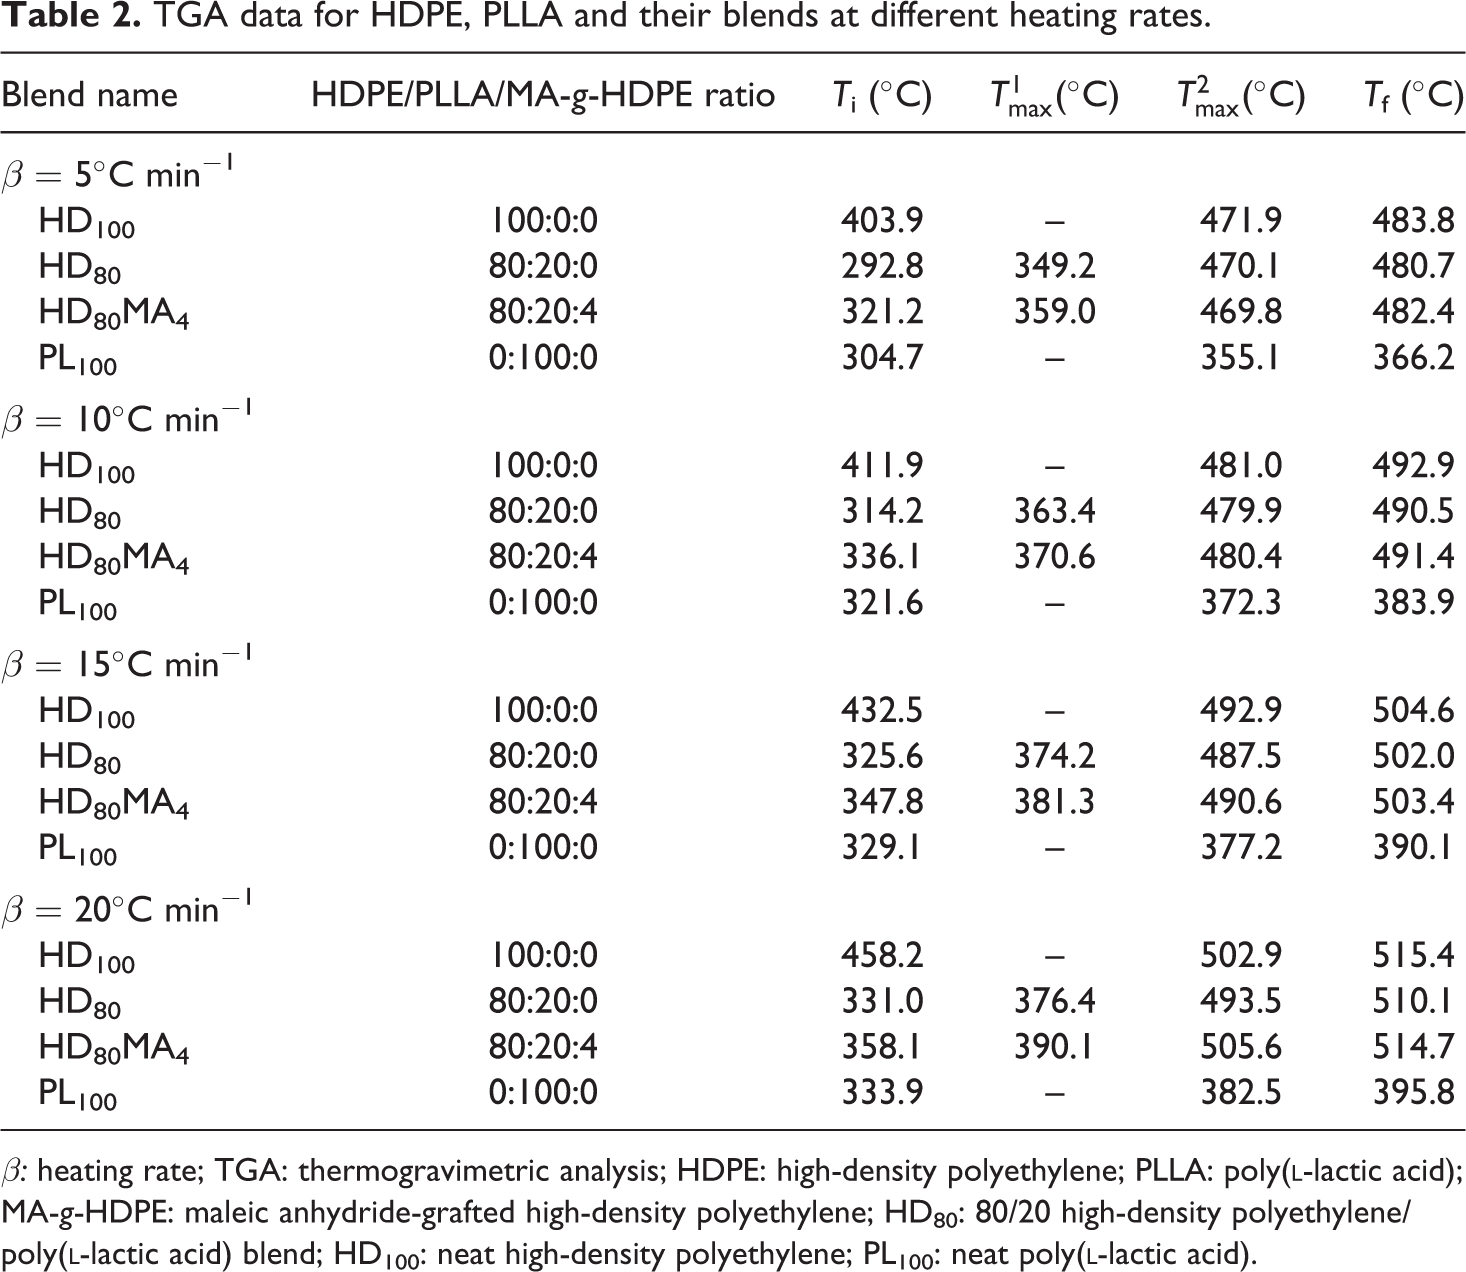
β: heating rate; TGA: thermogravimetric analysis; HDPE: high-density polyethylene; PLLA: poly(
It is observed that Ti shifts to lower temperatures by adding PLLA in HDPE, which also results in larger ΔT (difference of Ti and Tf). At 5°C min−1 heating rate, HDPE starts to degrade at 403.9°C, whilst HDPE containing 20 wt% MA-g-HDPE starts degrading at much lower temperature (292.8°C), which may be attributed to the low thermal stability of the PLLA added in HDPE. However, the Ti of 80/20 (HDPE/PLLA) blend increased when compatibilizer MA-g-HDPE was added. It might be due to complicated arrangement and increased interfacial adhesion (or cross-linking) of polymer chains, which affects their movements and decomposition with temperature. These results indicate that the compatibilizer introduced some interfacial adhesion and compatibility between HDPE and PLLA, resulting in increased thermal stability of the blend. The degradation temperatures of different blend samples in proportion to their conversion are summarized in Table 3. At a lower heating rate, the equilibrium reaches swiftly at the prescribed point with an increase in temperature. However, when the heating rate is high, equilibrium reaches slowly, and consequently, higher degradation temperature is observed, probably due to the slower diffusion of heat. 39 At the heating rate of 5°C min−1, the thermal degradation temperature of HD100 sample at 10% conversion was observed as 421.8°C, whereas at 20°C min−1, it was noticed as 433.2°C. Similarly, for HD80 sample, these values are 318.9°C and 340.3°C, respectively.
Thermal degradation temperatures corresponding to progressive conversion at different heating rates.
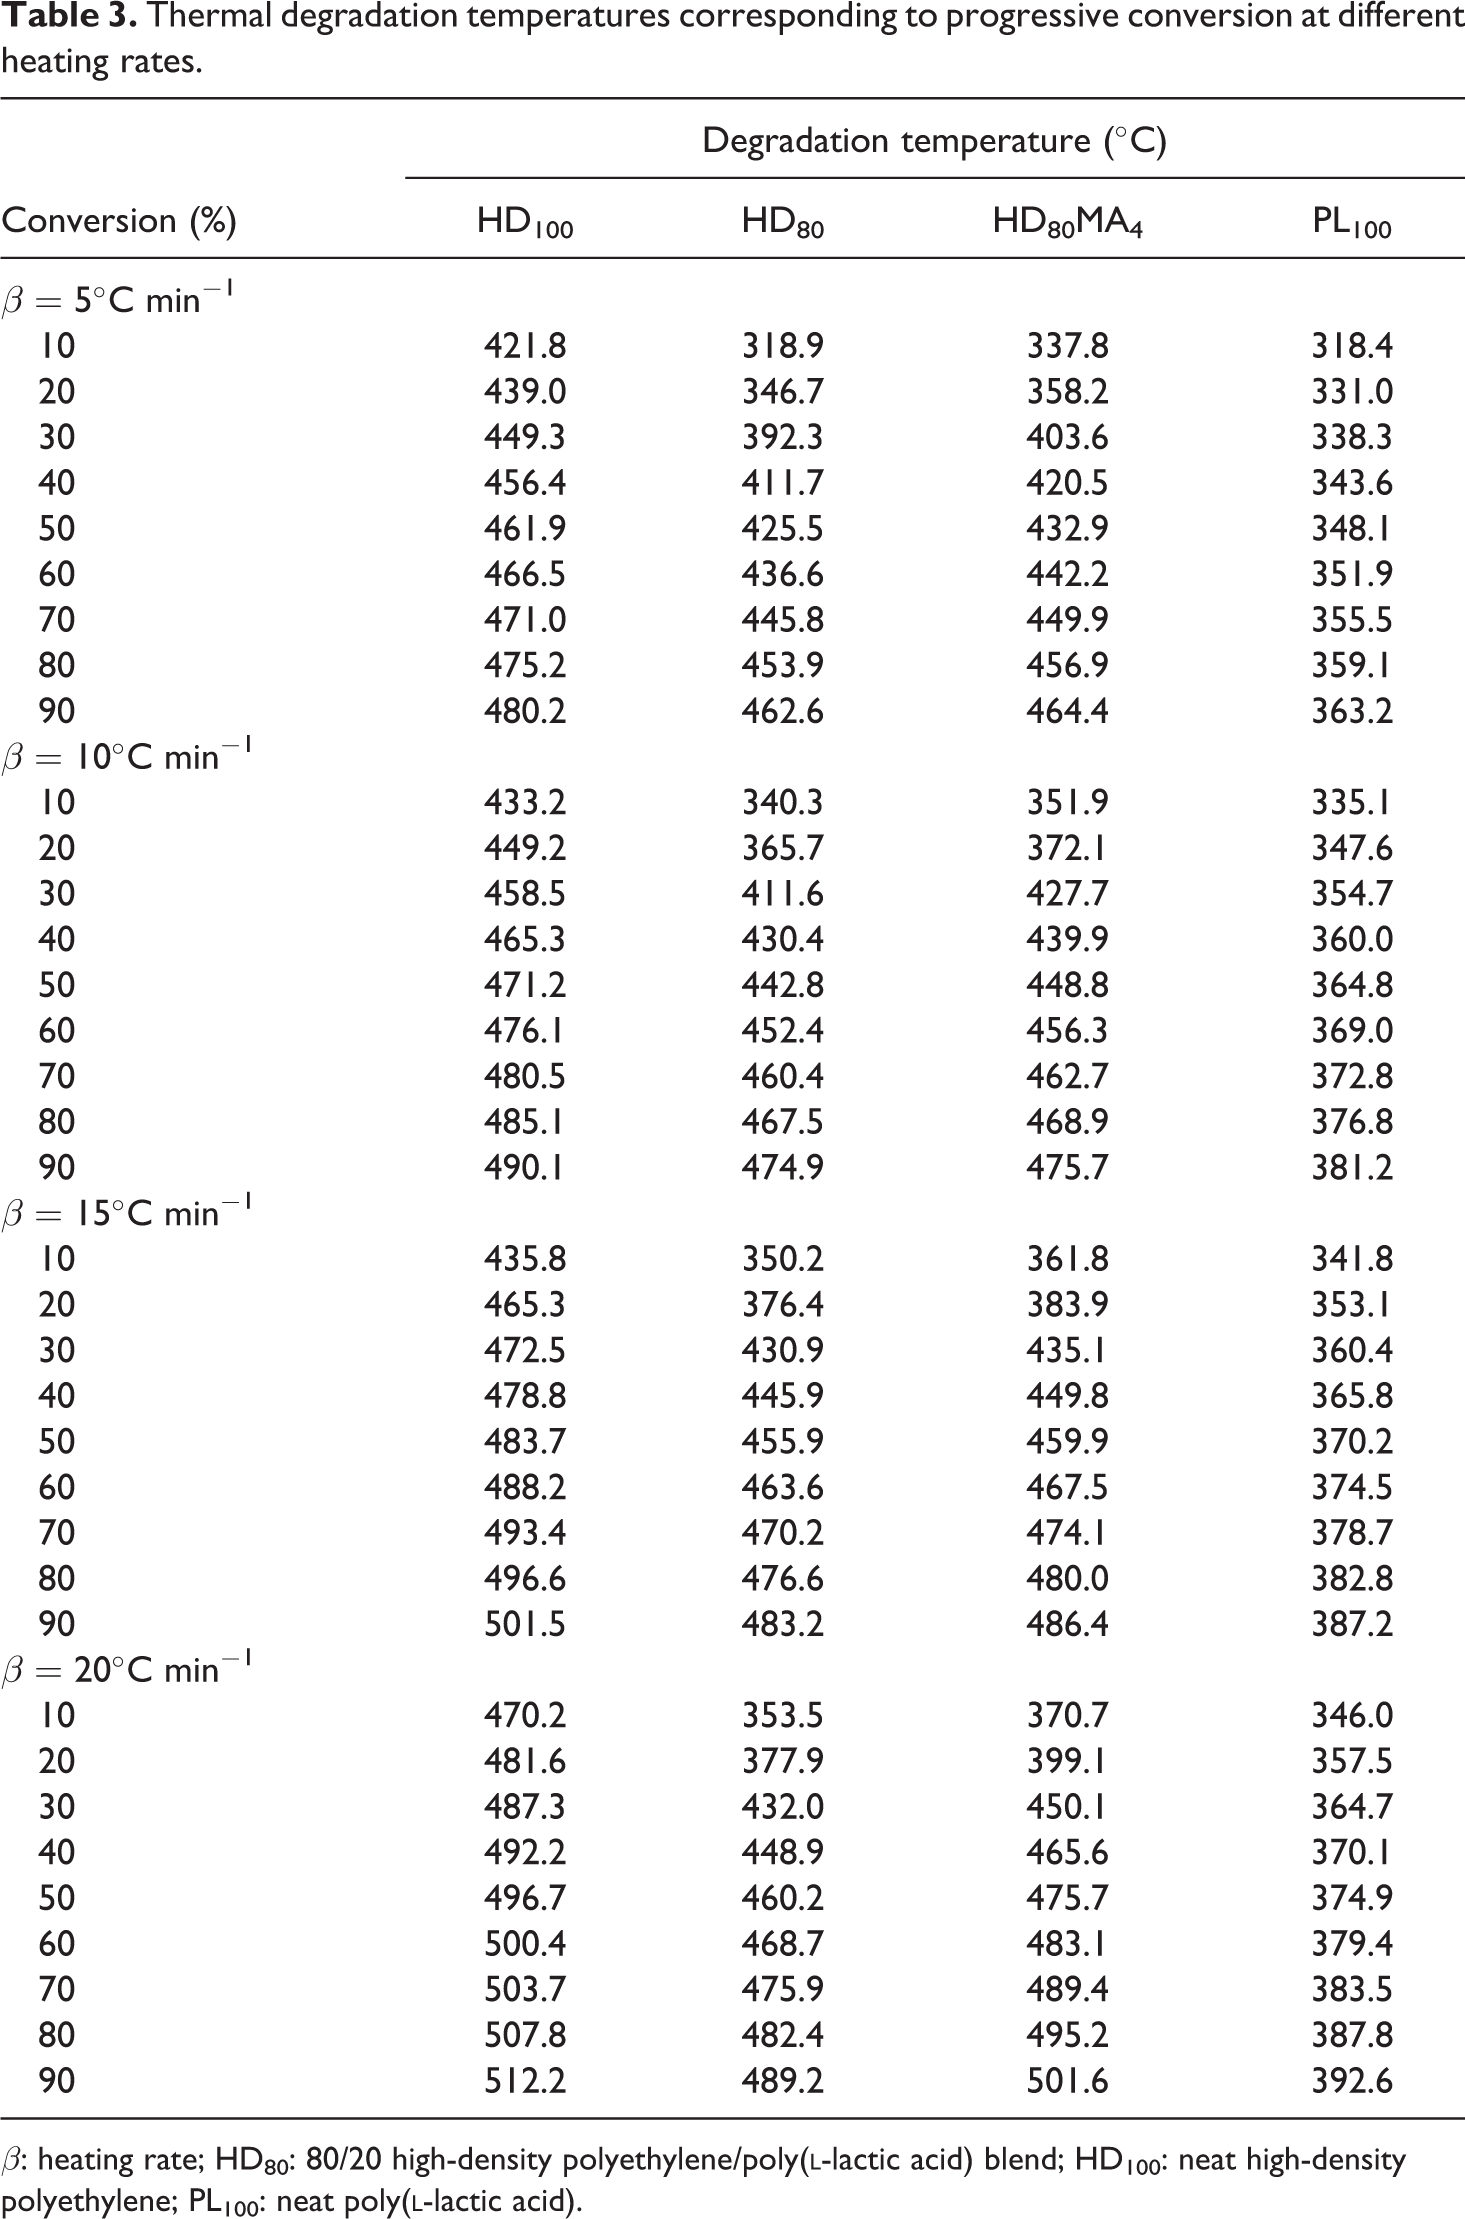
β: heating rate; HD80: 80/20 high-density polyethylene/poly(
Kinetics of thermal degradation by Friedman method
Using Friedman method, the calculated results of kinetic parameters for thermal degradation of all the samples at four heating rates are given in Table 4 and a representative plot for HD80 blend sample is shown in Figure 2. The graphs are obtained by plotting ln (dα/dt) versus (1/T) with the slope (Ea/R) for calculating the values of Ea. The linear plots of ln (1 − α) versus (1/T) give the numerical values of (Ea/(nR)), from which n is determined. With the help of Ea and n values, ln (A) is calculated using equation (8) at different heating rates. The kinetic parameters of a particular blend are different at different heating rates. The order of the reaction (n) for HD100 sample varied from 1.4 to 2.3 when the heating rate was varied from 5°C min−1 to 20°C min−1. The Ea values increased from 193.90 kJ mol−1 to 293.28 kJ mol−1 as the heating rate was increased from 5°C min−1 to 20°C min−1. For HD80, the Ea at 5°C min−1 heating rate is 140.54 kJ mol−1, which is much lower than that of HD80MA4 sample (184.43 kJ mol−1) at the same heating rate. These results show that the calculated kinetic parameters depend not only on the heating rates but also on the fraction of constituent in the blend.
Kinetic parameters of thermal degradation of HDPE/PLLA blends at different heating rates calculated by Friedman technique.
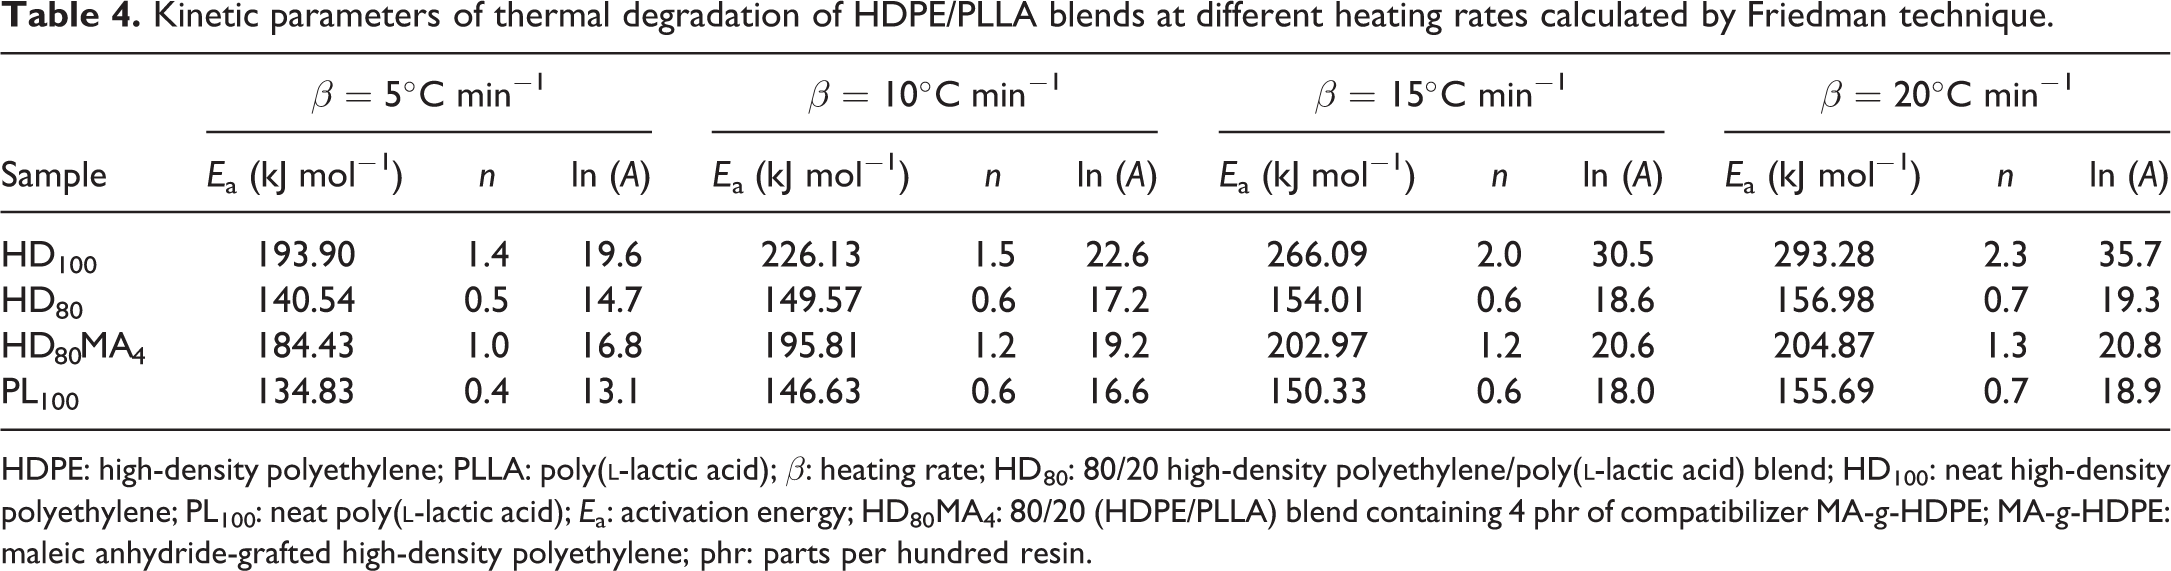
HDPE: high-density polyethylene; PLLA: poly(
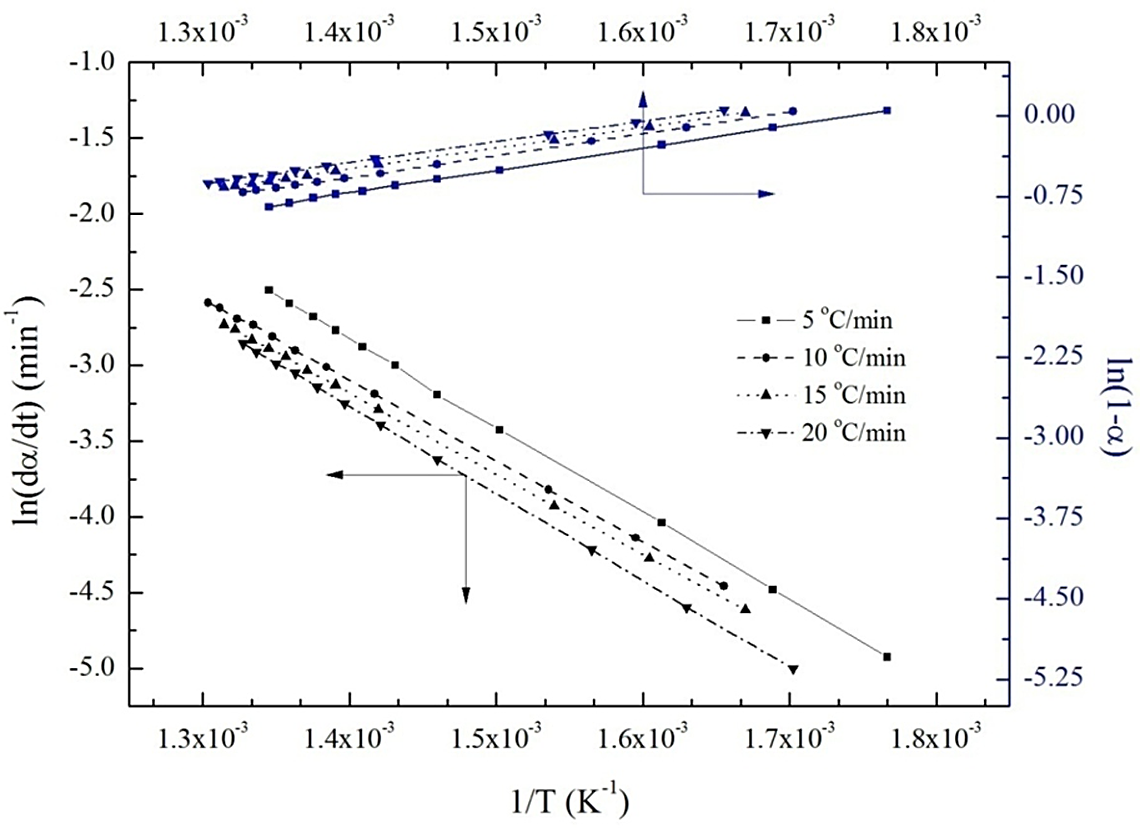
Friedman plots for calculating kinetic parameters for the thermal degradation of HD80 at four different heating rates. HD80: 80/20 high-density polyethylene/poly(
Kinetics of thermal degradation by Kissinger method
Considering the first Kissinger technique, the kinetic parameters for the thermal degradation of HDPE/PLLA blends are calculated and summarized in Table 5. The observations about Ea and ln (A) are similar to those from the previous techniques except that n remains almost equal for all the polymer samples. The Ea values for neat HDPE and neat PLLA are 222.7 and 151.2 kJ mol−1, respectively. For HDPE containing 20 wt% PLLA, the values of Ea are in between those of pure polymers. As observed in Friedman method, the Ea of 80/20 (HDPE/PLLA) blend (198.5 kJ mol−1) increases with addition of MA-g-HDPE (210.0 kJ mol−1). Figure 3 shows the plots obtained from the correlation between
Kinetic parameters for thermal degradation of HDPE/PLLA blends calculated by Kissinger technique.
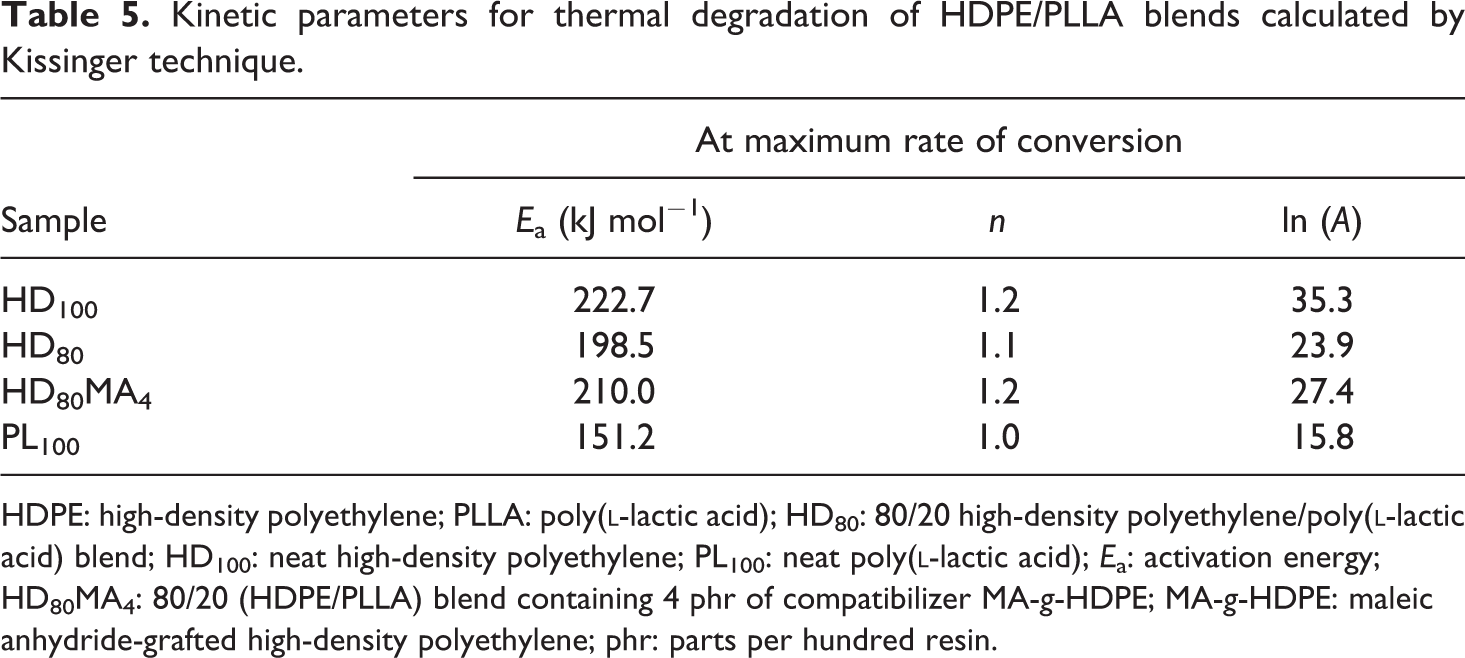
HDPE: high-density polyethylene; PLLA: poly(
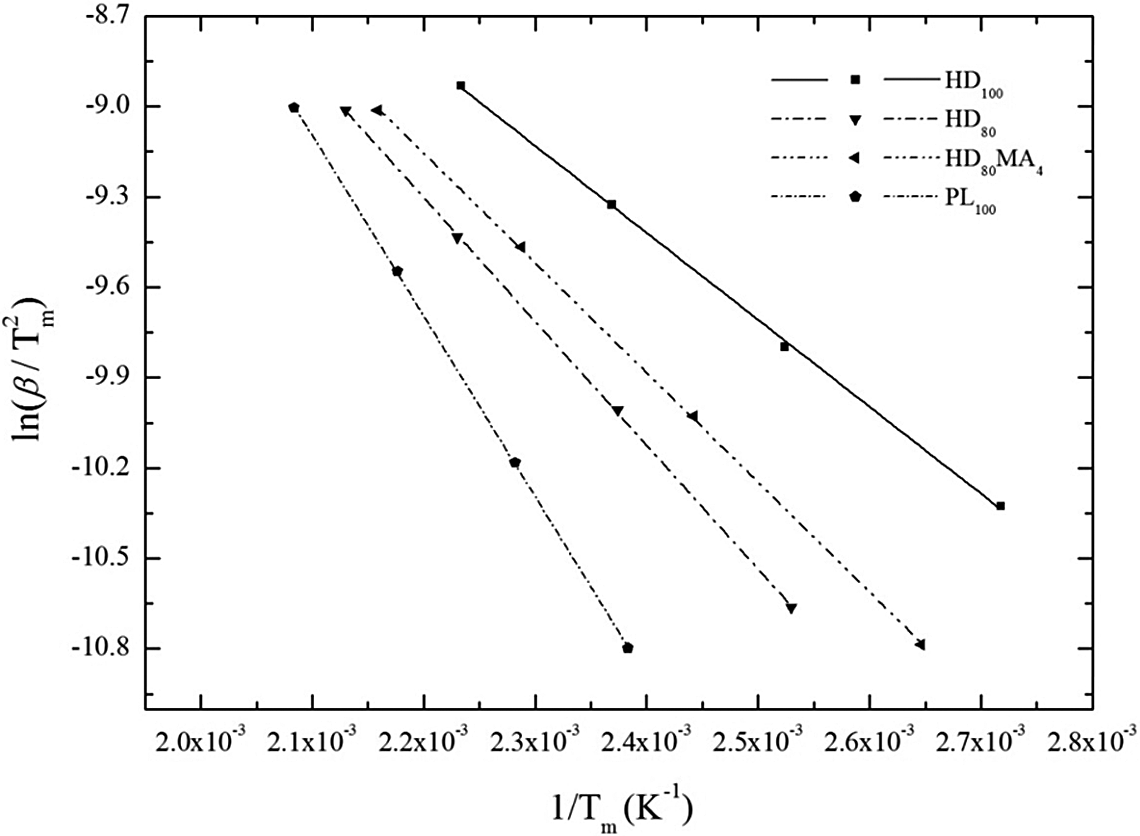
Kissinger plots for calculating kinetic parameters of all the investigated samples.
Kinetics of thermal degradation by Flynn–Wall method
The values of kinetic parameters obtained from non-isothermal isoconversional multiple heating rate Flynn–Wall method at progressive percentage of conversion (5%, 10%, 15%, 20% and 25%) are shown in Table 6. The variation of kinetic parameters at different conversion rates is quite clear. It is found that the value of Ea for HD100 increases from 195.8 kJ mol−1 (at 5% conversion) to 203.3 kJ mol−1 (at 25% conversion), whereas for PL100, the values are 148.1 and 153.2 kJ mol−1, respectively. For HD80 samples, these values are lower than HD100 but higher than PL100. HD80MA4 blend shows higher values because of the presence of MA-g-HDPE, which indicates that higher Ea is required for this blend due to increased compatibility. Figure 4 shows the plots obtained from the correlation between
Kinetic parameters for thermal degradation of HDPE/PLLA blends calculated by Flynn–Wall technique.
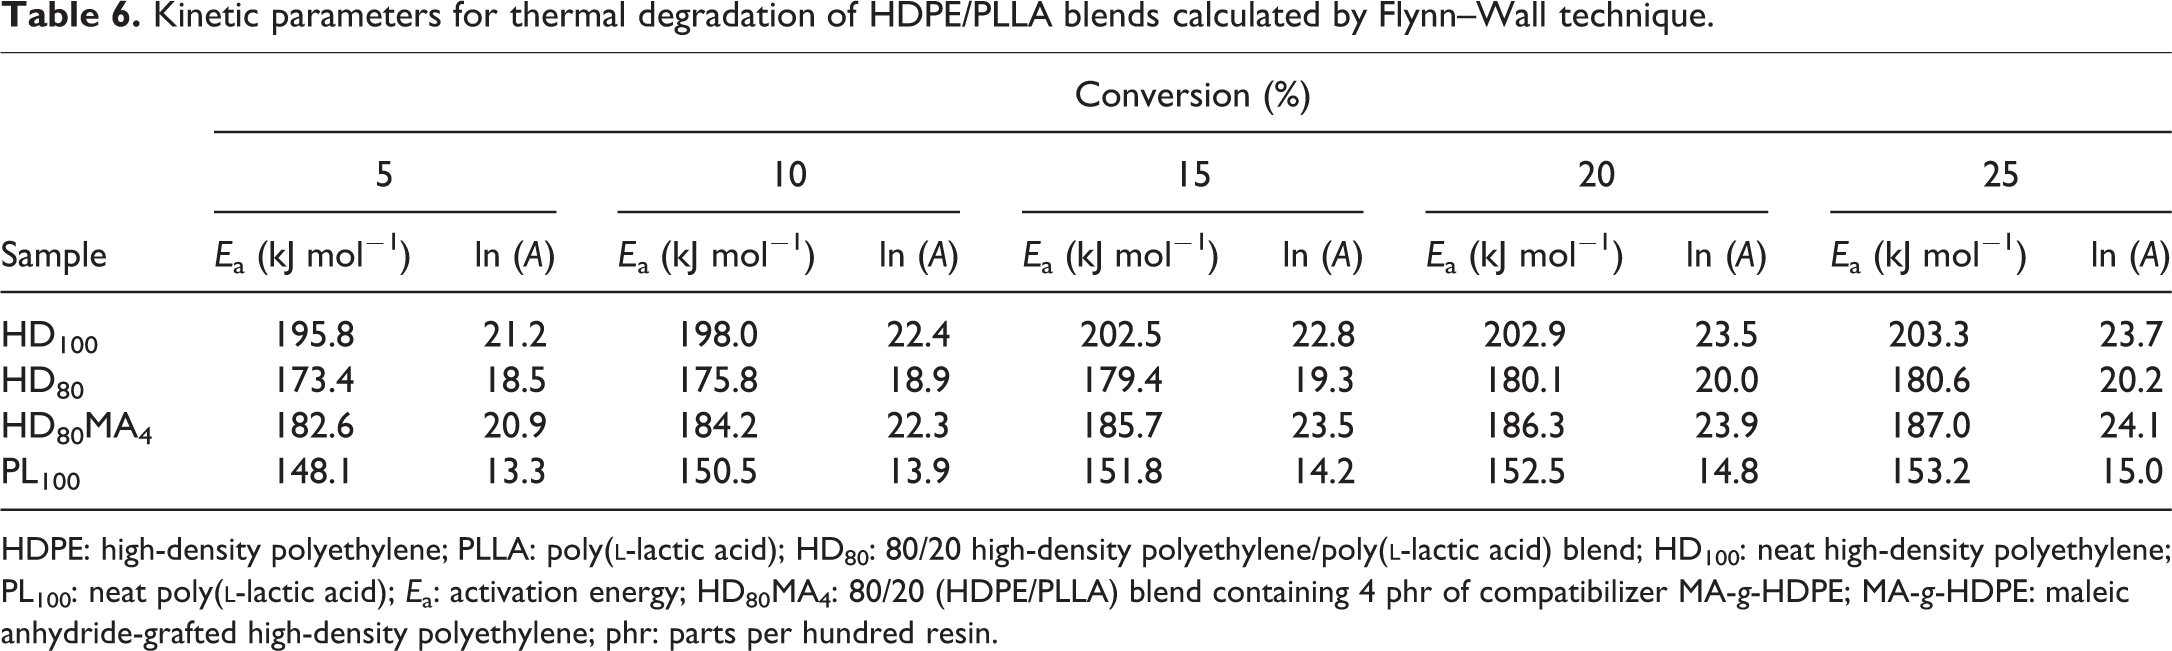
HDPE: high-density polyethylene; PLLA: poly(
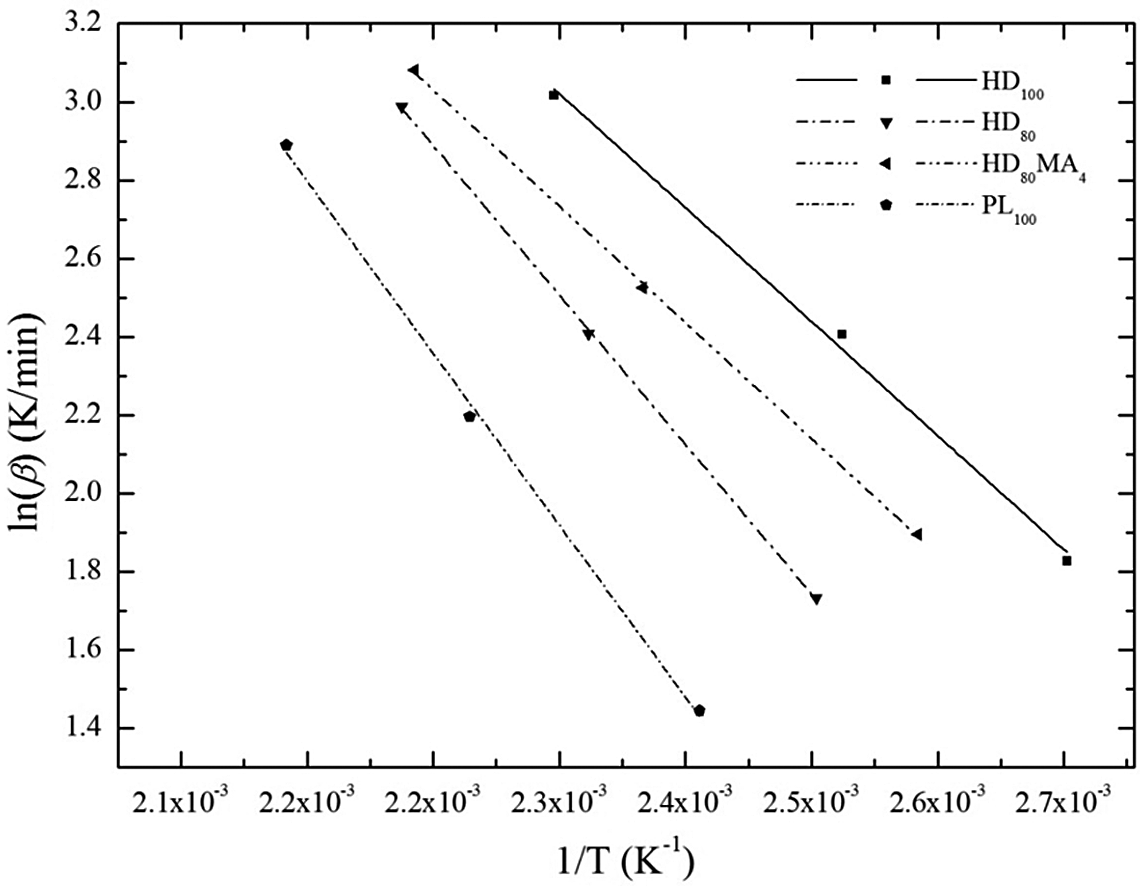
Flynn–Wall plots for all the blend samples.
The degradation kinetic parameters are affected by different mechanisms at initial and final stages, and at initial stage, the degradation occurs at comparatively weaker bonds. Therefore, low activation energies are associated with the initial decomposition stage. But, HDPE is a linear polymer containing little branches; hence, the rate-limiting step of thermal degradation of HDPE caused by random scission, which requires higher Ea. The values of Ea and A were found to decrease with addition of PLLA, which signifies that PLLA is able to catalyse the degradation process of HDPE through a different route of degradation.
The variations of rate constant with temperature for all the samples are calculated considering the kinetic parameters obtained at the conversion levels of 5%, 10%, 15%, 20% and 25% and are shown in Figure 5. At low temperatures, the rate constant values are same for all the samples, but after a particular temperature, the values increase exponentially with increase in temperature. However, the trend for all the blends is same throughout the degradation region, but the threshold value of the rate constant is different for different samples. For PL100, the exponential increase in rate constant occurs at much lower temperature than all the other samples.
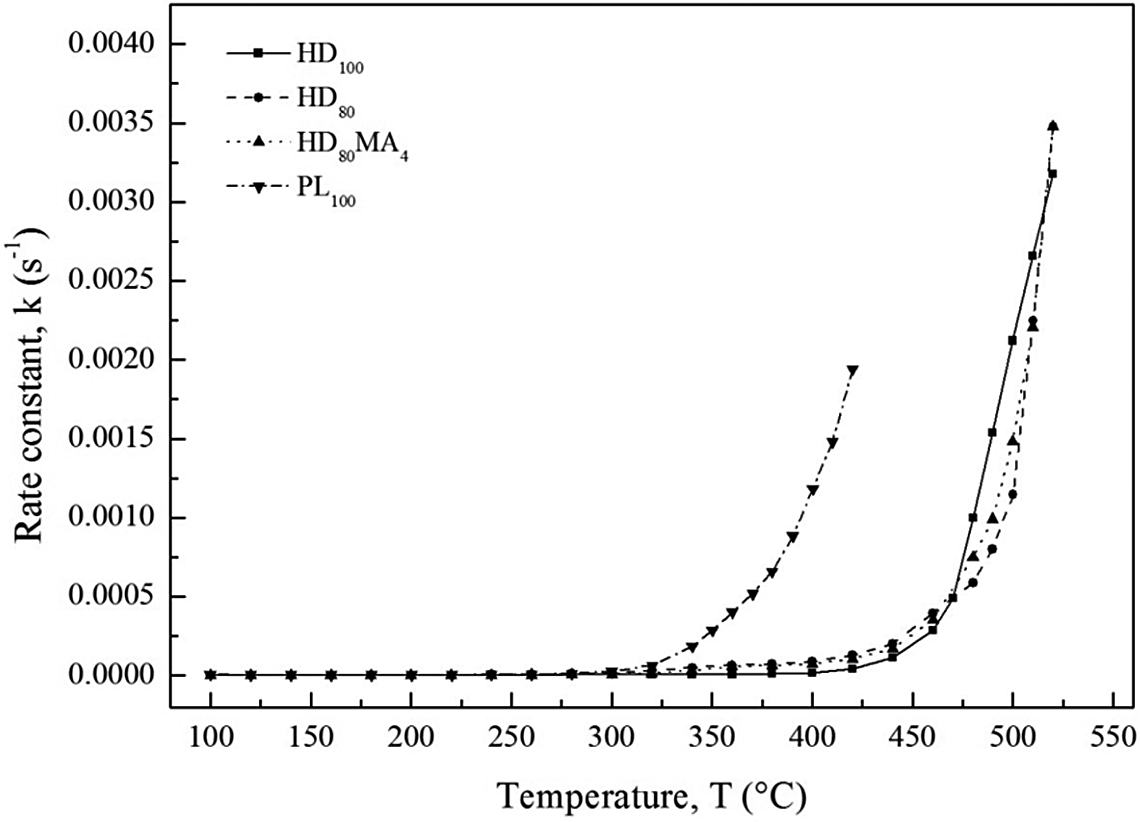
Rate constant versus temperature plot for all samples.
Further, for better understanding of degradation of HDPE and HDPE/PLLA blends, the percent conversion (α) is plotted against time at temperatures 250, 300, 350 and 400°C. Figure 6 (representative plot) shows the percent conversion versus time plots for all the blend samples at 300°C. It is shown that the pure polymers achieve complete conversion very soon after reaching their initial degradation temperature, but for HDPE/PLLA blends, it takes much longer time for complete conversion. The probable reason behind this phenomenon is immiscibility between the two polymers. Figure 6 signifies that each constituent of the blend influences the rate of degradation. The degree of conversion for HDPE/PLLA blends, at both initial and final degradation stages, depends on the rate of heating.
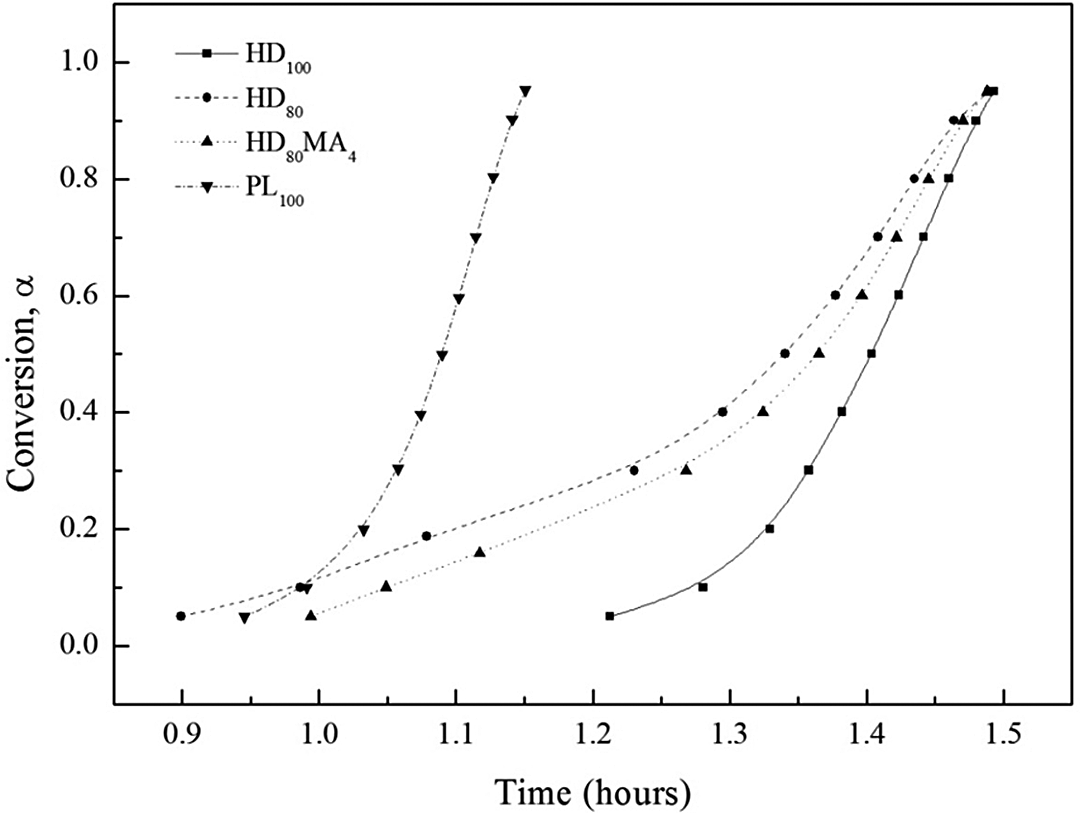
Conversion versus time plots for all samples.
Lifetime prediction
The results of lifetime prediction are shown in Figure 7. It is seen that the lifetime of all the blends depends on temperature and decreases dramatically with increase in temperature. The possible reason behind lower lifetime or environment stability of PLLA and HDPE/PLLA films is their low molecular weight as compared to HDPE.
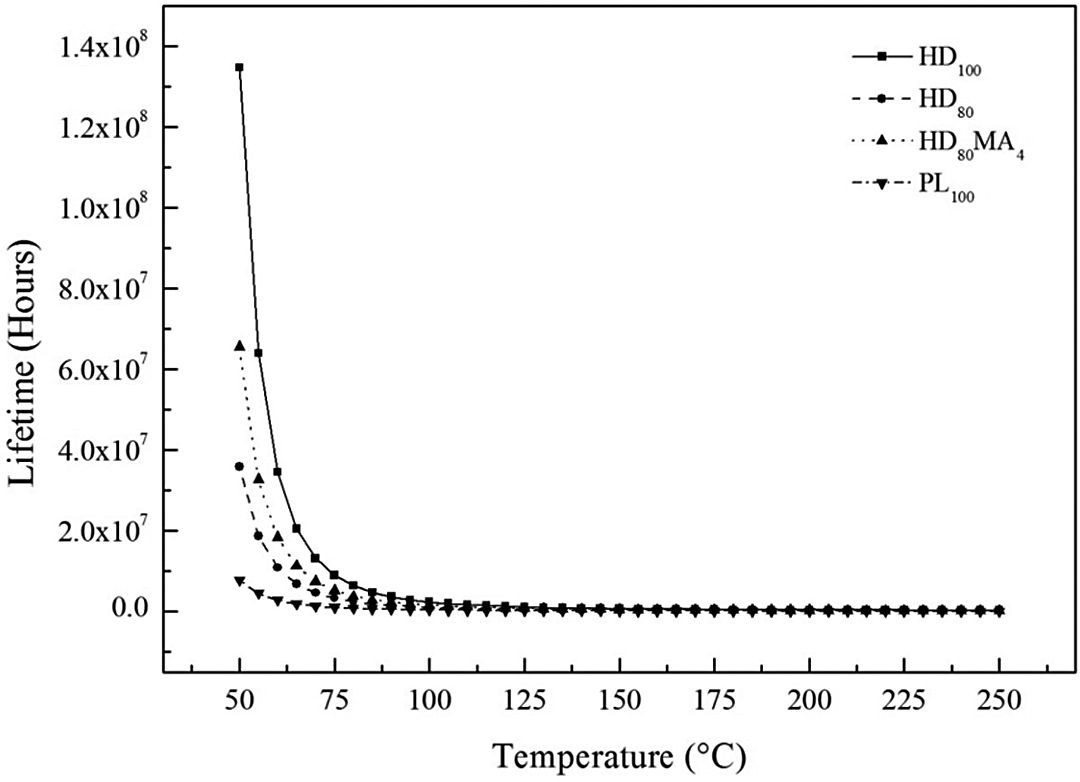
Lifetime of HDPE, PLLA and their blends with temperature. HDPE: high-density polyethylene; PLLA: poly(
Morphology
The surface morphology of the samples taken on their cryo-fractured surfaces is shown in Figure 8. It was observed from the figure that the HDPE gradually changed from a dispersed phase to a co-continuous phase with addition of 20 wt% PLLA. However, complete phase separation indicated an immiscible behaviour between the HDPE and PLLA, and the sharp phase boundary implied a weak interfacial adhesion between the two components. An in situ compatibilization was generated after the addition of the compatibilizer, where MA-g-HDPE copolymers and/or HDPE-crosslink-PLLA networks were formed at the interfaces. The morphology of the 80/20 (HDPE/PLLA) blend showed increased formation of cavities, rough surface with large holes and increased droplet radius, whereas in this blend with addition of 4 phr compatibilizer, the domain size of polymers was reduced, obviously ascribing to the in situ compatibilization. Meanwhile, the phase boundary became unclear, indicating an enhanced interfacial adhesion and improved compatibility between the HDPE and PLLA phases. Considering the improved morphology of 80/20 (HDPE/PLLA) blends, it was suggested that MA-g-HDPE (4 phr) acts as a good compatibilizer for the blends.
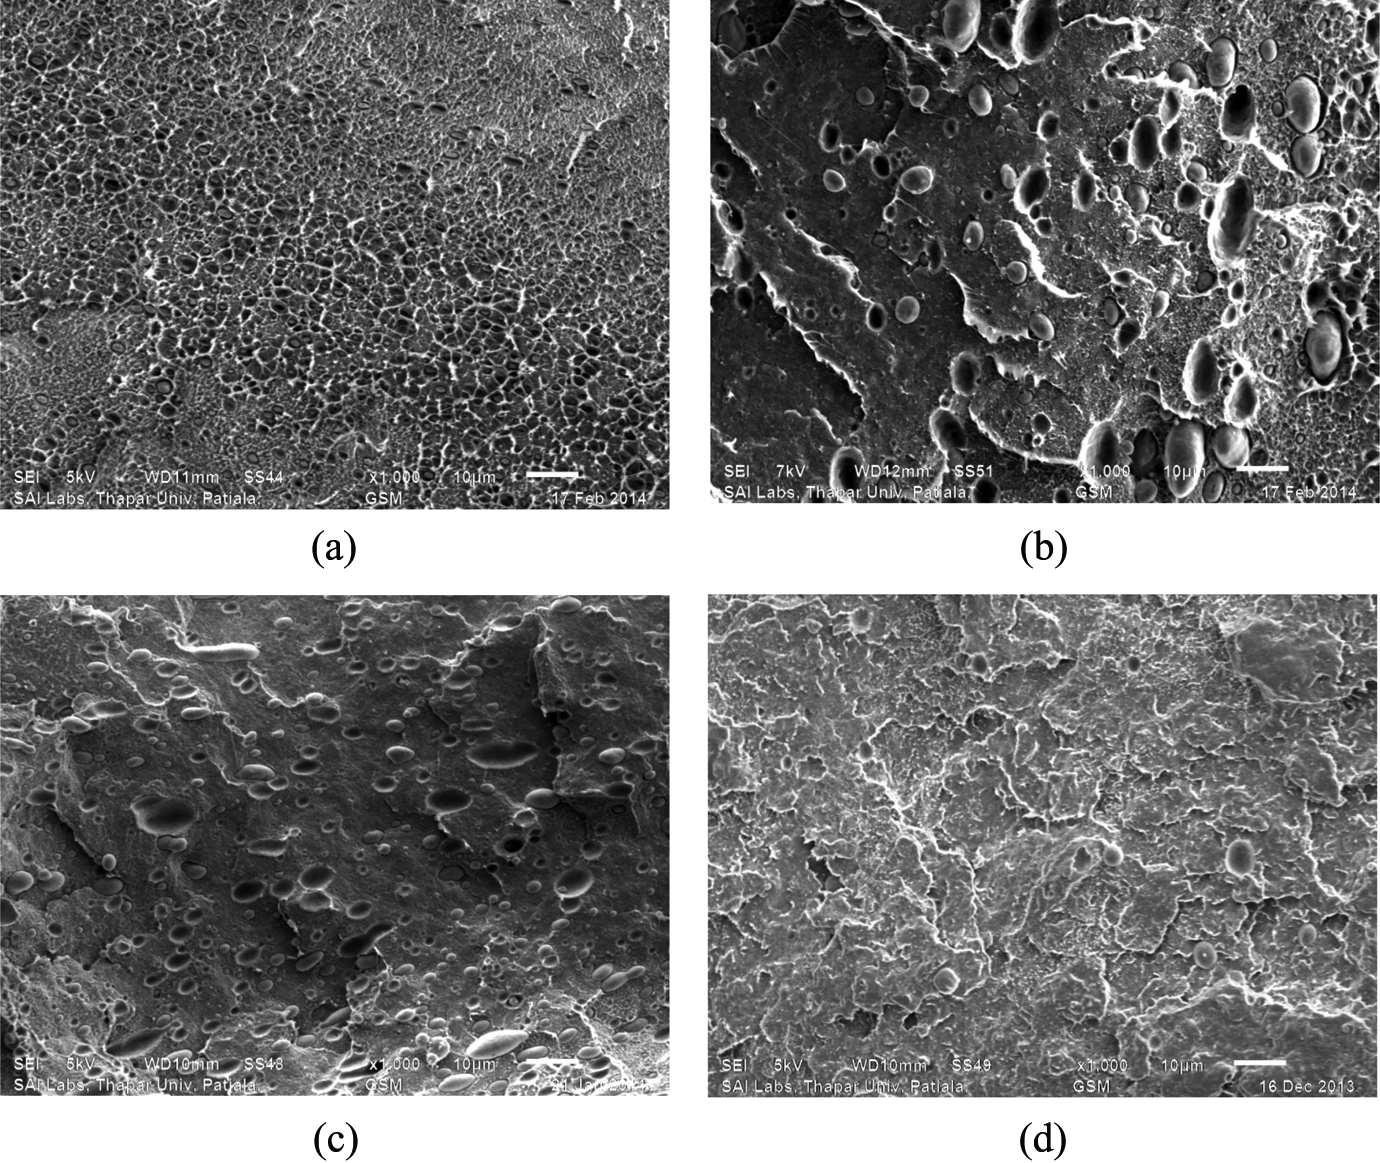
(a) SEM image of HD100. (b) SEM image of HD80. (c) SEM image of HD80MA4. (d) SEM image of PL100. SEM: scanning electron microscopy; HD100: neat high-density polyethylene; HD80: 80/20 high-density polyethylene/poly(
Conclusions
Single-step thermal degradation process is observed for pure HDPE and pure PLLA polymer samples, whereas two-step degradation is noticed for HDPE/PLLA blends. The stability of HDPE decreases upon addition of PLLA. Addition of compatibilizer MA-g-HDPE increases the thermal stability of the HDPE/PLLA blend probably due to the increased interfacial adhesion and interaction between the polymer chains of the two polymers. The variation in the degradation trends shown by the data of different samples is obviously due to the difference in degradation reaction mechanism, sample composition and the microstructural features of the polymers and polymer blends. The values of Ea for HDPE/PLLA blends are lower than those of neat HDPE, possibly due to radical character of degraded PLLA derivatives, which affects the initial thermal degradation reaction. However, the complexity of the degradation reaction mechanism is due to the practical dependence of activation energy on the extent of conversion. The values of kinetic triplet Ea, n and ln (A) of the blends are constituent dependent. Additionally, these parameters are significantly affected by the heating rates and calculation methods. The Ea values calculated by Friedman, Kissinger and Flynn–Wall techniques are in good agreement with each other. The lifetime of all the samples decreases drastically with increase in temperature. SEM analysis confirmed that HDPE gradually changed from a dispersed phase to a co-continuous phase with addition of PLLA. The morphology of HD80 blend showed cavities, rough surface with large holes and increased droplet radius, whereas in the same blend containing MA-g-HDPE, the domain size of polymers was reduced ascribing to the in situ compatibilization.
Footnotes
Acknowledgements
The authors wish to express their sincere thanks to Prof. Golok B. Nando of IIT Kharagpur, West Bengal for allowing to perform a part of the research work in his laboratory. The authors also acknowledge support from Dr Lalit Varshney and Dr KA Dubey of BARC, Mumbai, Maharashtra, India.
Declaration of Conflicting Interests
The author(s) declared no potential conflicts of interest with respect to the research, authorship, and/or publication of this article.
Funding
The author(s) disclosed receipt of the following financial support for the research, authorship, and/or publication of this article: The authors received financial support from Council of Scientific and Industrial Research (CSIR), Government of India, through scheme number 02(0035)/11/EMR-II and Department of Atomic Energy (DAE), Government of India, through Sanction No. 35/14/08/2014-BRNS.