
Abstract
Melt blending technique was used for the preparation of blends of two different polymers (polypropylene (PP) and polylactide (PLA)) with/without compatibilizer and nanoclay. The effect of nanoclay on the properties of blends and PP was investigated. Compression molding was used for the preparation of films. PP/PLA (85/15) and PP/PLA/maleic anhydride (85/15/4) were chosen as optimum blends from tensile strength test for further characterization. Tensile strength of PP/PLA (85/15) blend improved with the addition of 4 phr resin compatibilizer. The content of nanoclay was varied from 0 wt% to 5 wt% in PP. The optimized blends were characterized by Fourier transform infrared (FTIR), differential scanning calorimetry, rheological studies, X-ray diffraction, scanning electron microscopy, thermogravimetric analysis, biodegradability test, and ecotoxicology. FTIR studies indicated the presence of PLA and nanoclay in the PP matrix. The addition of compatibilizer increased the compatibility between PP and PLA. Biodegradability studies confirmed the biodegradable nature of the blends and composites. Nontoxic nature of biodegraded intermediates has been confirmed by the ecotoxicological tests.
Introduction
Polyolefins such as polypropylene (PP) and polyethylene (PE) are extensively used in commodity and packaging applications. The use of PP is continuously increasing in the plastic packaging industries due to their low cost, lightweight, high mechanical strength, water resistance, and good barrier properties. 1 PP is characteristically inert and resistant to microbial attacks; therefore, it remains in the environment for very long time and create huge waste management problem. 2 PP is a nondegradable plastic material due to hydrophobic nature and unavailability of functional groups. Recycling of PP waste produces inferior quality products. So, biodegradation is an important solution to manage the PP waste.
Polylactide (PLA) is easily degraded by microorganisms such as fungi, algae, and bacteria. It has been used for the preparation of partially degradable polymer blends with nonbiodegradable polymers. It is a biodegradable polymer derived from biomass through bioconversion and polymerization. 3 Brittleness, low shelf life, and high cost restrict the application of PLA as a replacement of synthetic polymers. Several researchers have reported on the blending of PLA with different polyolefins such as linear low-density PE, high-density PE, and PP. 4 The application of PLA and polyolefin blends is limited due to the immiscibility between two different polymers. 5 Suitable compatibilizer generally enhances the miscibility between two different polymers. Compatibilizer such as polypropylene-grafted-maleic anhydride (PP-g-MA) in the form of grafting copolymer with functional groups is used to improve the miscibility. PP-g-MA is used as an essential compatibilizer to improve the miscibility between PP and polar polymers. 6
Inorganic fillers such as montmorillonite clay are generally used to increase the mechanical properties of polymers. It also serves to enhance the growth of microorganisms by cation exchange capacity. It has been suggested that conducive level of pH is also cause of microbial growth.
There are several research studies on the degradation of nanoclay-filled PE. They confirm higher degradability rate of nanoclay-filled PE than pure PE. &&&Qin and co-workers have also reported similar results for the nanoclay-filled PE. 7 Degradation of nanoclay-filled PE increased due to the formation of acidic sites on the surface of nanoclay-filled PE.
Degradation and biodegradation of polyolefins are highly expected after the end of service life. Biodegradation can be defined as degradation caused by the microorganisms and their enzymes in aerobic or anaerobic environment. In biodegradation, microorganisms consume low-molecular-weight products and convert them into carbon dioxide (CO2), water, and biomass. In the last two decades, more investigations are concerned with degradability of PP. 8 PP can be made degradable by blending with transition metals, natural polymers, and isolation of microbes. 9 The blending of PLA with PP and the addition of nanoclay into PP are important processes to enhance the degradability. 10,11
It is very important to evaluate the toxicological effect of biodegraded intermediates. Microbial and plant growth tests are generally used for the evaluation of ecotoxicological effect of biodegradable intermediates. Plant growth test has been performed by using two different types of plants.
Several research studies have been reported for the evaluation of physical and chemical properties of PP/PLA blends. 6,12 But, rheological properties of these blends have been studied less systematically. Rheological study provides an important link between the end-use properties and the production of polymers. 13 The aim of this study is to analyze the effect of nanoclay on the biodegradation of PP/PLA blend and evaluate the toxicological effect of biodegraded intermediates. Systematic studies of rheological behavior of blends and composites have been performed.
In this work, we present a comprehensive study of mechanical, thermal, morphological, and rheological properties of nanoclay-filled PP/PLA blends and composites. Biodegradability of optimized blends has been calculated. Toxicological effect of biodegraded intermediates has been evaluated by plant growth test.
Experimental
Materials
PP in pellet form (Grade F110) was provided by Haldia Petrochemicals Ltd (Kolkata, West Bengal, India) having a melt flow index of 11 g/10 min, melting temperature (T m) of 165°C, and density of 0.9 g cm−3. 14 PLA (4032D) having a melt flow index of 7 g/10 min, T m of 175°C, and density of 1.24 g cm−3 was provided by NatureWorks LLC, (Minnetonka, Minnesota, USA). 15 Nanoclay (Cloisite 30B) was supplied by the Connell Bros. Company Pvt. Ltd (Mumbai, Maharashtra, India). Pluss Polymers Pvt. Ltd (Gurgaon, Haryana, India) supplied compatibilizer—PP-g-MA having a melt flow index of 110 g/10 min, T m of 161°C, and density of 0.908 g cm−3. S.D. Fine Chemicals Ltd (Mumbai, India) supplied the microcrystalline cellulose.
Matured compost was used as a microbial source provided by Delhi Jal Board at Okhla, Delhi, India. The properties of the compost material were determined by following the guidelines of American Public Health Association. 16 A 1-mm mesh sieve was used to separate out the stone, metal, glass, and so on. The total organic carbon and Kjeldahl nitrogen present in the compost was 34% and 2.2%, respectively. The water holding capacity of the compost was 60–65% and was calculated after overnight drying in an oven at 105°C. Total dry solids and volatile solids in the compost were 81% and 18%, respectively. The pH of the compost was 7.2.
Blend preparation
The composition of PP and PLA blends with compatibilizer and nanoclay at different concentrations is shown in Table 1. Melt blending was performed by Haake Poly Lab (Germany). Materials were weighed and manually mixed before being loaded into the mixer. The different compositions of PP/PLA blend from 100/0 to 80/20 were prepared with an increment of 5 wt%. The concentration of the compatibilizer was 2, 4, 6, and 8 phr. The concentration of the nanoclay with PP varied from 0 wt% to 5 wt%. The mixing chamber temperature and rotor speed were 180°C and 60 r min−1, respectively. Mixing time was 4 min.
PP, PLA blends with different composition and nanoclay-filled PP composite.
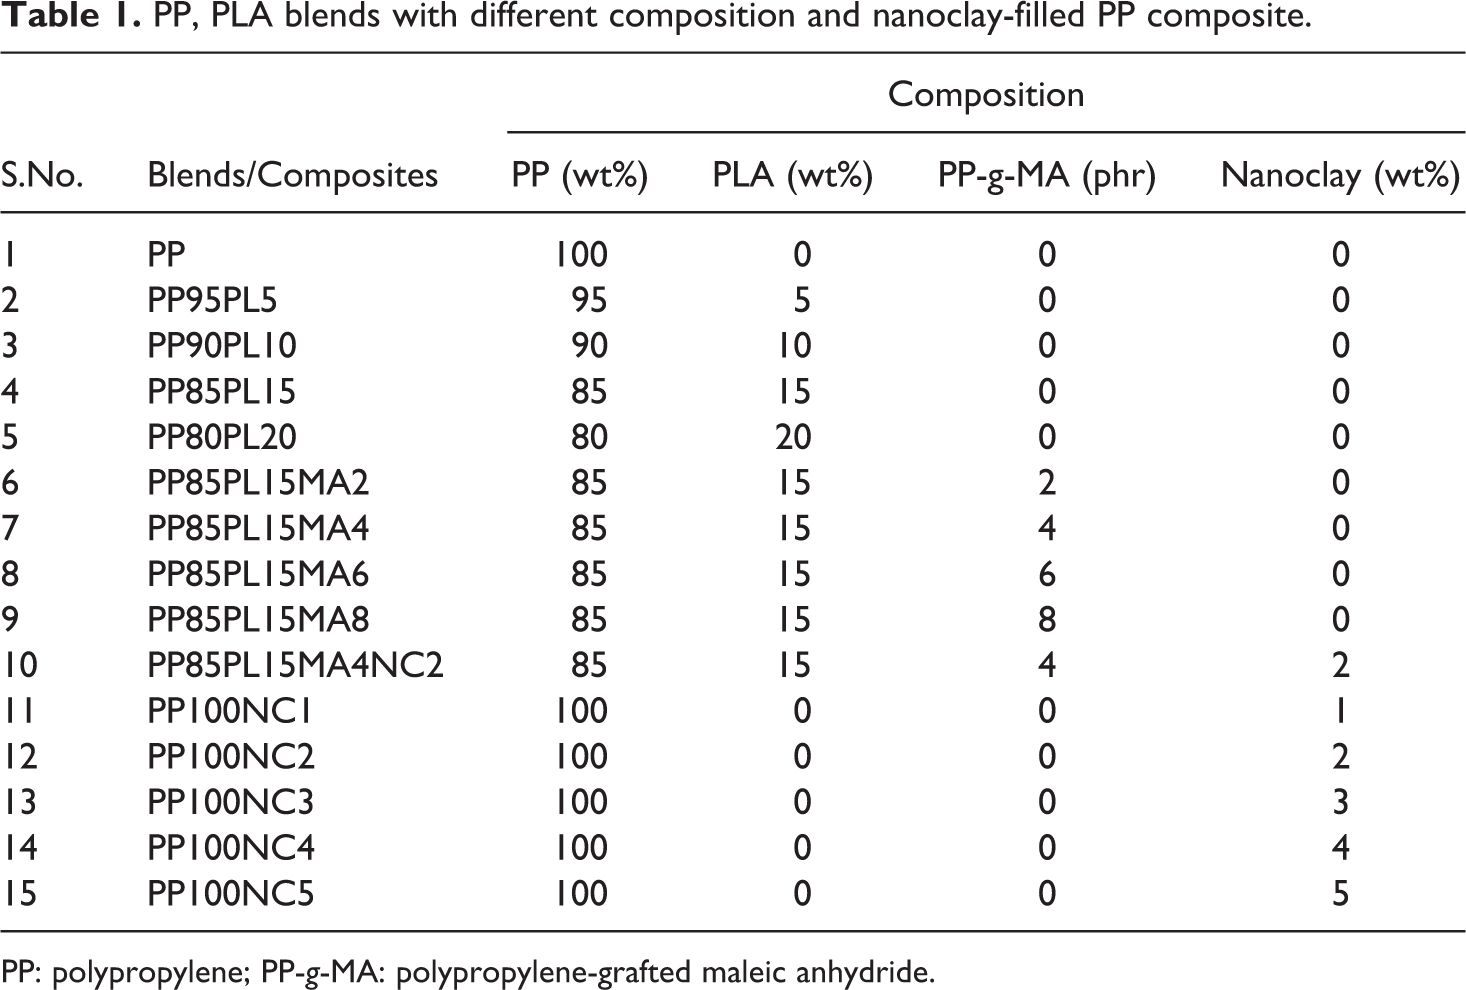
PP: polypropylene; PP-g-MA: polypropylene-grafted maleic anhydride.
Films preparation
Compression molding was used for the preparation of films. The pressure and temperature were 400 kN m−2 and 180°C, respectively, maintained during the preparation of films. The thickness and area of the films were 80–85 μm and 18 × 18 cm2, respectively. Teflon sheets were used to prevent the molten mass to stick the molds. Water was used for cooling purpose.
Mechanical testing
Mechanical properties of the films were measured according to the ASTM D 882-91 standard. Universal Testing Machine (Z010; Zwick-Roell, Germany) was used for conducting the test. The distance between the clamps and the crosshead speed was 100 mm and 12.5 mm min−1, respectively. The strip-sample cutter was used to cut the samples. The reported results are average values of five specimens.
FTIR spectroscopy
Fourier transform infrared (FTIR) measurements of all the samples were performed using an Agilent Pro Cary 660 spectrometer (California, USA). The interactions among the PP, PLA, compatibilizer, and nanoclay were studied within the range of 4000–550 cm−1.
Thermogravimetric analysis
Thermogravimetric analysis (TGA) of all the samples was conducted with a TA Instruments Q-500 TGA analyzer (Delaware, USA). The flow rate of nitrogen was 50 ml min−1. Weight of the sample was 5–10 mg. The analyses were performed in the range of 30–650°C. The heating rate of 20°C min−1 was maintained during the analysis.
Differential scanning calorimetry
Differential scanning calorimetry (DSC) was performed to know the thermal behavior of all the samples. An instrument 200F3, supplied by Netzsch-Geratebau GmbH, Germany, was used to analyze the samples. The weight of the sample measuring 5–10 mg was taken for the analysis. First, the sample was heated from room temperature to 200°C at the heating rate of 10°C min−1 and held for 1 min to remove the thermal history. Then, the sample was cooled to −30°C at the rate of 10°C min−1. Again the sample was heated up to 200°C with a heating rate of 10°C min−1 under nitrogen atmosphere. Second heating was performed for the analysis purpose. The values of T m, crystallization temperature (T c), and melting enthalpy (ΔH m) of all the films were derived from the curves. Equation (1) was used to calculate the crystallinity (X c) percentage of the samples 17 :
where ΔH m of 100% crystalline PP is 163 J g−1. 16 ΔH m of 100% crystalline PLA is 93 J g−1. 6
X-Ray diffraction
X-Ray diffraction (XRD) was performed to know the crystallographic structure of all the samples. An instrument, supplied from Philips Xpert diffractometer, Almelo, the Netherlands, was used to analyze the samples. A monochromatic copper K α radiation having a wavelength of 1.5418 Å was used for the analysis. The angle 2θ during the test was 5–60°. The speed of scanning was 5° min−1, and the instrument was operated at 20 mA and 40 kV.
Rheology testing
Dynamic oscillatory rheometer was used for the rheological studies of blend and composite films. A parallel-plate rheometer (MCR 102), Anton Paar, was used for rheological studies. The samples were evaluated at 190°C under nitrogen atmosphere. The linear viscoelastic (LVE) region was determined by a strain sweep test. Strain sweep test was performed between the strain of 0.01% and 1000% under 1 rad s−1 frequency. The frequency sweep test was performed in the LVE region (γ = 1%) with the frequency range of 0.01–500 rad s−1.
Scanning electron microscopy
Scanning electron microscopy (SEM) was used to study the fractured surface of all the samples. A JEOL SEM instrument (model JSM-6510 LV, Tokyo, Japan) was used for observation. All the samples were cryogenically brittle fractured and coated with gold (thickness 15 mm). The acceleration voltage was 20 kV during the test.
Biodegradation testing
Biodegradation of all the samples was calculated by estimating the cumulative amount of CO2 produced during incubation process. The incubation temperature was 58 ± 2°C maintained for 45 days according to the guideline of ASTM D 5338-11 standard. 18 The dimension and weight of the samples were 2 × 2 cm2 and 1 g, respectively. The flow rate of air (CO2 free) was 60–80 ml min−1. The film samples were exposed to the microbial activity by putting in municipal solid waste compost. The acid–base titration method was used to quantify the amount of CO2 released during the composting period. Only compost material was used in the blank reactor. The percent of biodegradation was estimated by the ratio of CO2 produced from the film and the theoretical CO2th by using equation (2). TOC analyzer having TOC-VCPH (solid module) from Shimadzu (Japan) was used to measure the theoretical mass of CO2th present in the samples. The TOC-VCPH analyzer utilizes 900°C heat. The CO2 was detected by a nondispersive infrared (NDIR) gas analyzer. The NDIR outputs an analog detection signal forms a peak; the peak area was measured by the TOC-Control V software, version 1.0.5.1.

where CO2t is the quantity of CO2 released from the sample containing reactor (g) and CO2b is the quantity of CO2 released from the only compost containing reactor (g).
Evaluation of ecotoxicological impact of degraded intermediates
The toxicological impact of biodegraded intermediates on the compost (after biodegradation) was evaluated by performing the microbial and plant growth test.
Microbial toxicity testing
In the microbial test, compost samples (after biodegradation) were taken for the evaluation of ecotoxicological effect of degraded intermediates. The compost sample (1 g) was immersed in autoclaved distilled water 10 ml and vortexed for 1 min. The serial dilution factor 10–3 was used for dilution. The colony-forming units (CFUs) per milliliter of the compost were calculated by 100 µl of each diluted to 10–1, 10–2, and 10–3. 19 –21 An incubator NSW-152, supplied from Narang Scientific Works Pvt. Ltd (Ambala, Haryana, India) was used for the incubation of plates for 24 h at 37°C. The CFUs per milliliter of suspension were calculated as:

Plant growth testing
A mixture of compost (after biodegradation test), perlite, and soil in the ratio of 2:1:1 was used for the preparation of medium for the tests. Plant growth test was performed according to the guideline given by the Organization of Economic Co-operation and Development (OECD 208). 22 Two plants, corn (Zea mays) and tomato (Solanum lycopersicon), were used for the tests. A total of 30 tomato and 90 corn seeds were used for the tests. Three replicates were used for all the samples. Temperature and humidity for the test were 22 ± 10°C and 70 ± 25%, respectively. The tests were performed for 3 weeks in 16-h light/8-h dark. The emerged seedlings were counted after 21 days. The weight of the plants was determined after drying at 75°C until the constant weight is achieved.
Results and discussion
Mechanical testing
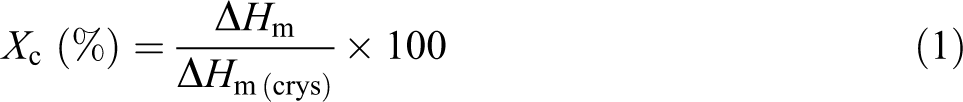
Tensile properties of PP/PLA blends with different compositions of PLA with/without compatibilizer and nanoclay are summarized in Table 2. Tensile strength of PP was 39 MPa, which decreased with an enhancement of PLA content (0–20 wt%) because of less interaction and incompatibility between PP and PLA. For highly compatiblized blend, it is expected that the strength of the blend is higher than or at least between that of neat polymers. 10 Increase in the PLA content beyond 15 wt% reduced the tensile strength drastically up to 13 MPa. PP85PL15 was considered as the optimum composition because of desirable strength. The elongation at break of PP80PL20 was lower than PP due to brittle deformation and immiscibility between two polymers.
Tensile strength of blended and composite films.
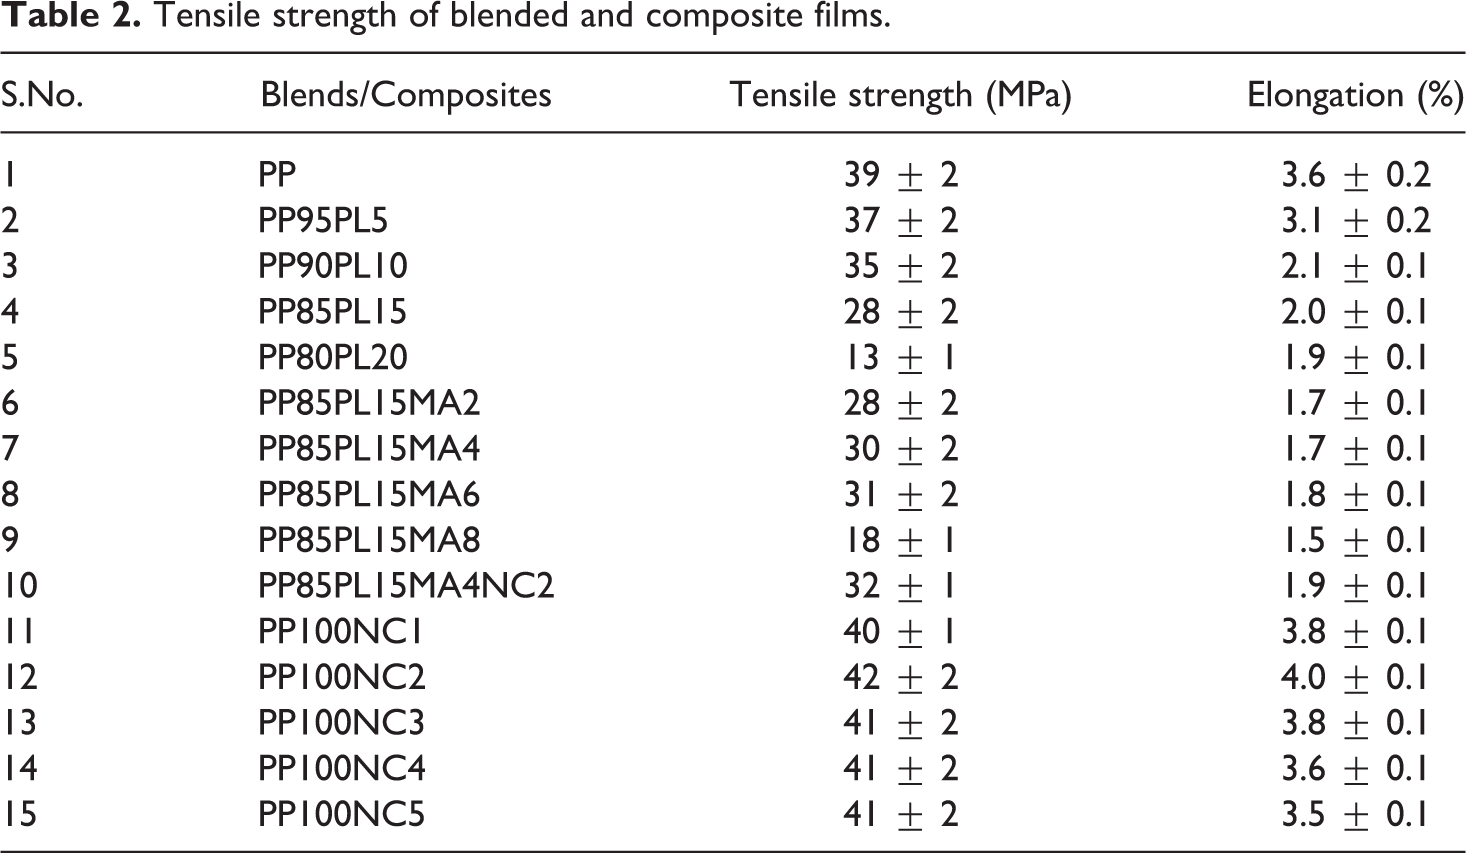
Table 2 presents the different concentration of compatibilizer with PP85PL15 blend. Compatibilizer enhanced interaction and fine bonding between two polymers, which increased the tensile strength up to 6 phr. On increasing the concentration of the compatibilizer above 6 phr, strength decreased due to heterogeneity in the system. PP85PL15MA4 was considered as the desirable blend for further studies because of favorable tensile strength.
The effect of addition of nanoclay on the strength of PP/nanoclay composite is presented in Table 2. Tensile strength of PP is 39 MPa which increased up to 42 MPa with the addition of nanoclay (2 wt%) beyond which there was not much change. The increase in tensile strength is due to strong interaction between the PP matrix and the nanoclay. 23 PP100NC2 was taken as the optimum composition for further studies. Tensile strength of PP85PL15MA4NC2 was 32 MPa. On the basis of tensile strength, PP85PL15, PP85PL15MA4, PP85PL15MA4NC2, and PP100NC2 were considered as optimum blends and composites for further studies.
FTIR spectroscopy
The FTIR spectra of all the samples are shown in Figure 1; peaks at 2949–2866, 1454, and 1375 cm–1 were assigned to C–H stretching, CH3 bending, and C–H bending, respectively, for PP. 24 In the spectrum of PLA, the peaks at 1746, 1178, and 1084 cm–1 are associated with C=O stretching, symmetric C–O–C stretching, and asymmetric CH3, respectively. 10 The peaks in PP/PLA blend (PP85PL15) were observed around 2949–2866, 1454, 1375, 1746, 1178, and 1086–1184 cm–1 corresponding to both PP and PLA, indicating the absence of chemical interactions between the two components. Addition of the compatibilizer in PP85PL15MA4 blend was confirmed by the emergence of new peak at 1757 cm–1, representing the carbonyl of ester linkage stretching. 10 The peaks in composites PP100NC2 and PP85PL15MA4NC2 between 900 cm–1 and 1100 cm–1 confirmed the presence of nanoclay in the composite samples. 25
FTIR curves of PP, PLA blended, and nanoclay-filled PP samples.
Thermogravimetric analysis
Figure 2 shows the Thermogravimetric (TG) and Derivative Thermogravimetric (DTG) curves of all the samples. Curves of neat PP and PLA show single-stage degradation, whereas the curves of PP/PLA blend show two-stage degradation due to the immiscibility between the polymers. 26 The initial (T i) and final degradation temperature (T f) of all the samples are presented in Table 3. T i corresponds to 5% weight loss of the polymer sample, and T f corresponds to 5% residual left after which no appreciable loss is possible. T i and T f of the polymers are essential for evaluating their thermal sensitivity. 6 T i of PP was 380°C, which is higher than that of PLA (335°C) confirmed higher thermally stability. Addition of PLA in the blend decreased T i of PP85PL15 up to 315°C due to the partial compatibility between the polymers. However, addition of the compatibilizer improved thermal stability up to 351°C due to the improvement in the compatibility. DTG curves show single maxima for PP and PLA and two maxima of blended films confirming the phase separation between the two polymers.
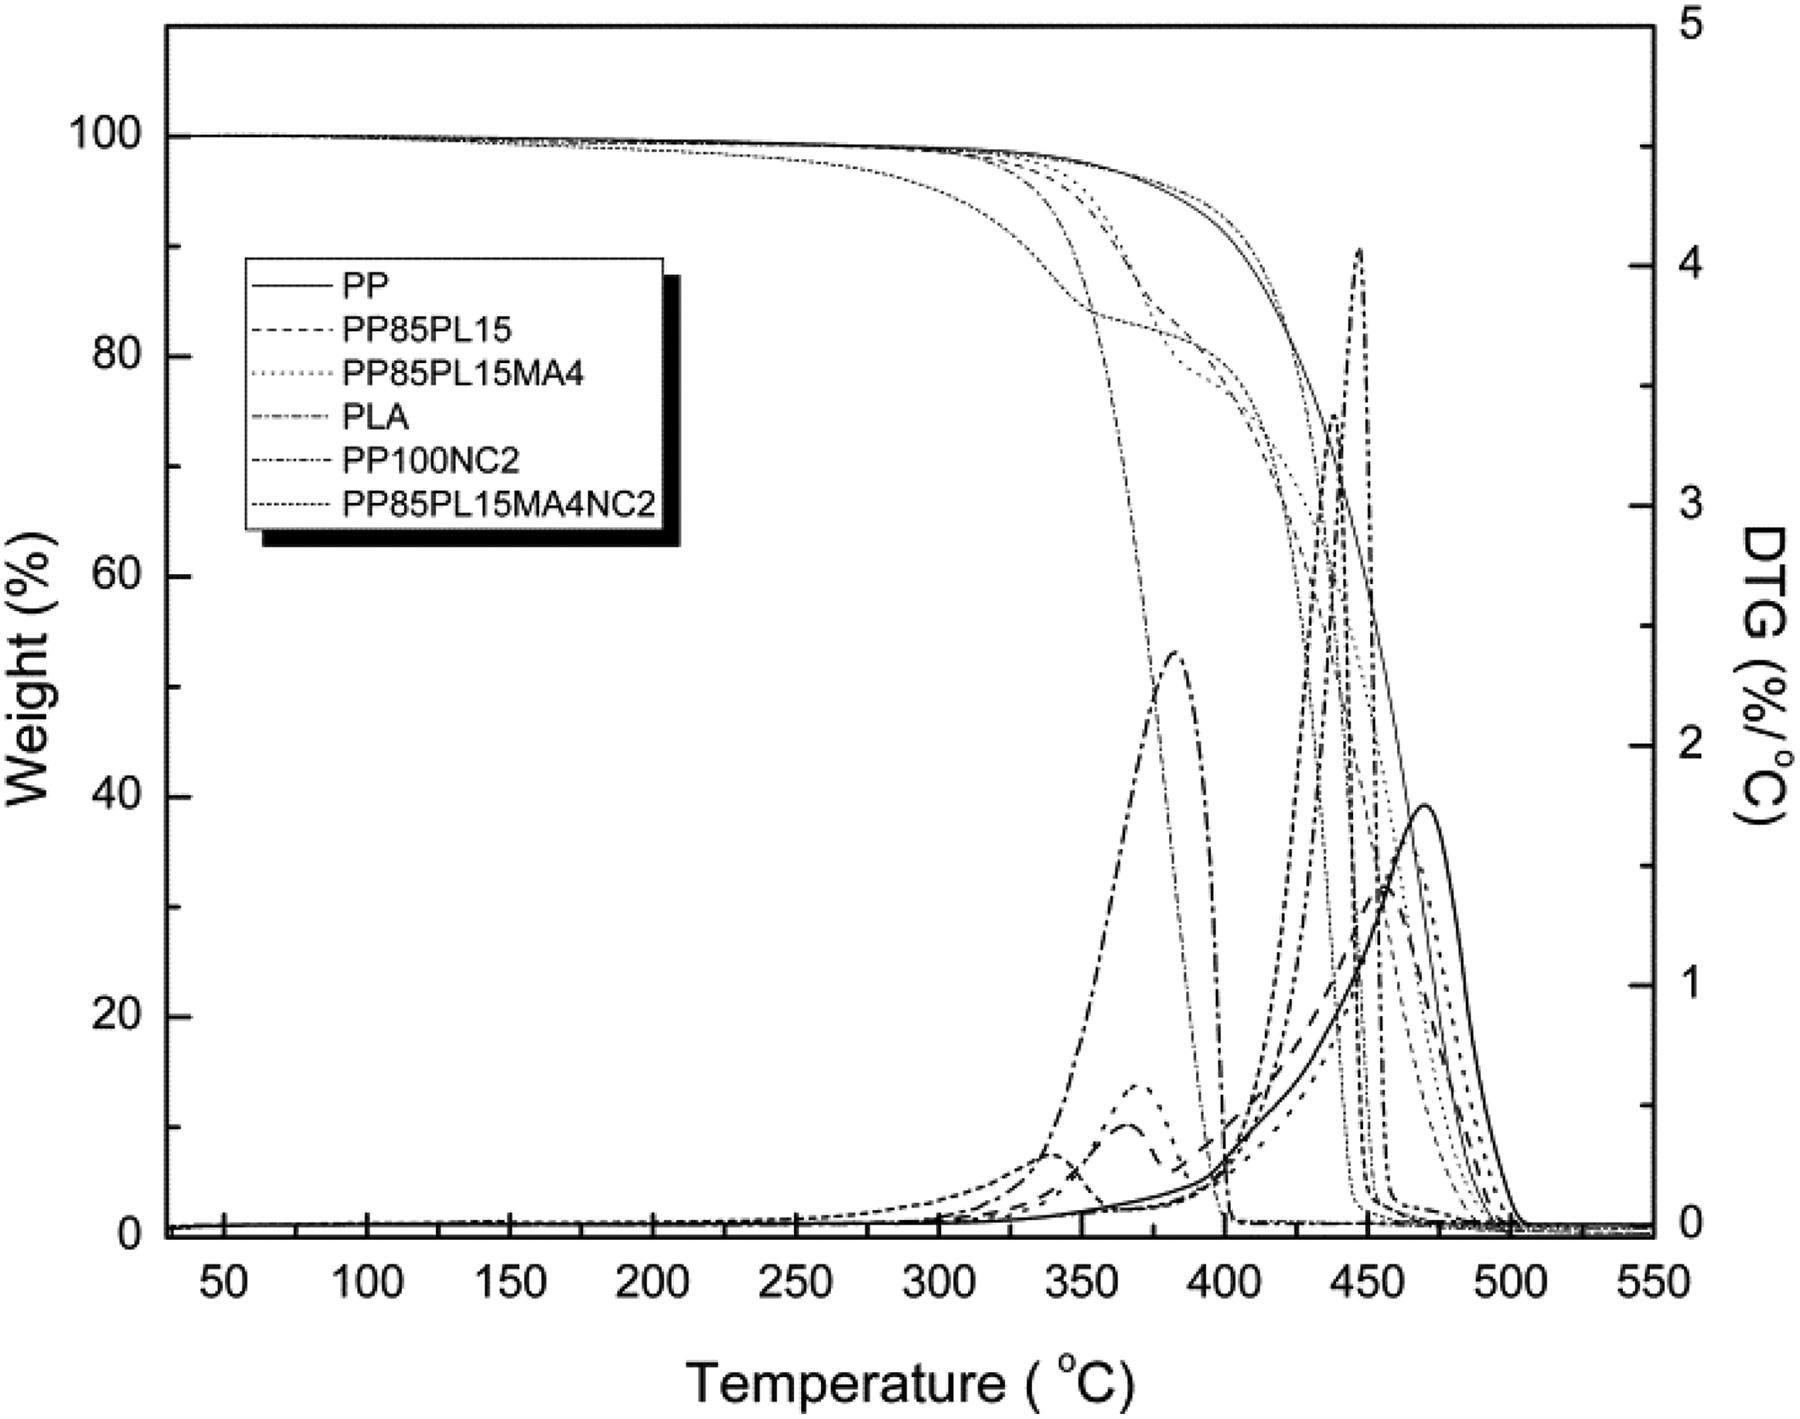
Thermogram of PP, PLA-blended, and nanoclay-filled PP samples.
TG and DTG analysis of PP, PLA-blended, and nanoclay-filled PP samples.
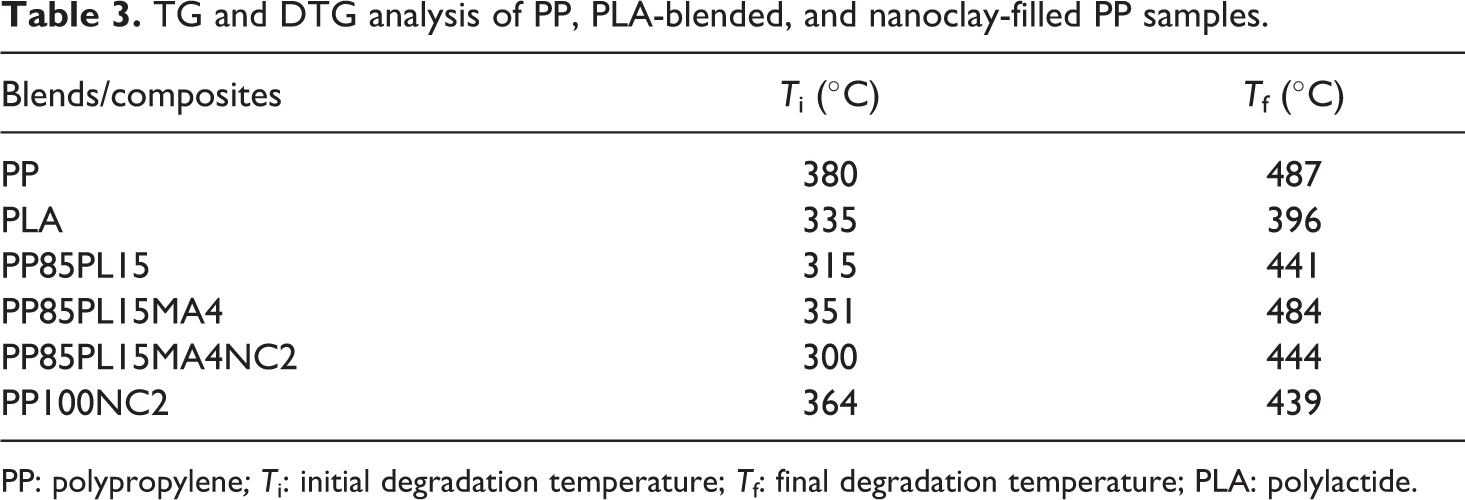
PP: polypropylene; T i: initial degradation temperature; T f: final degradation temperature; PLA: polylactide.
In the thermal degradation of PP and PP/nanoclay composite, T i of PP and PP100NC2 was 380°C and 364°C, respectively. This shows that the addition of nanoclay decreased the initiation degradation temperature due to the catalytic effect of nanoclay toward the degradation of the polymer matrix under nitrogen atmosphere, 27 whereas the nanocomposite PP85PL15MA4NC2 shows the lowest T i of 300°C due to the lowest thermal stability. The lower thermal stability of the blended and composite samples is helpful for their biodegradation.
Differential scanning calorimetry
The curves of all the blended and composite films are shown in Figure 3. The values of properties derived from these curves are represented in Table 4. The crystallinity and T m of PP are 63% and 166°C, respectively. The crystallinity and T m of the PP85PL15 blend are 48% and 162°C, respectively, due to the incompatibility between two different polymers. The addition of PLA (amorphous) in PP (crystalline) decreases the ordered structure of PP, 28 whereas the addition of PP-g-MA in PP85PL15 blend increased compatibility and shows no further change in T c. 29 Addition of the compatibilizer increases the crystallinity of the blend due to the improvement in the compatibility. T m of nanoclay-filled PP composite and nanoclay-filled compatibilized PP/PLA composite is 157°C and 155°C, respectively. 30 Nanoclay-filled PP and compatibilized PP/PLA blend show lower crystallinity than PP due to the nanoclay platelets which could hinder the motion of the polymer chain segments and retard crystal growth.
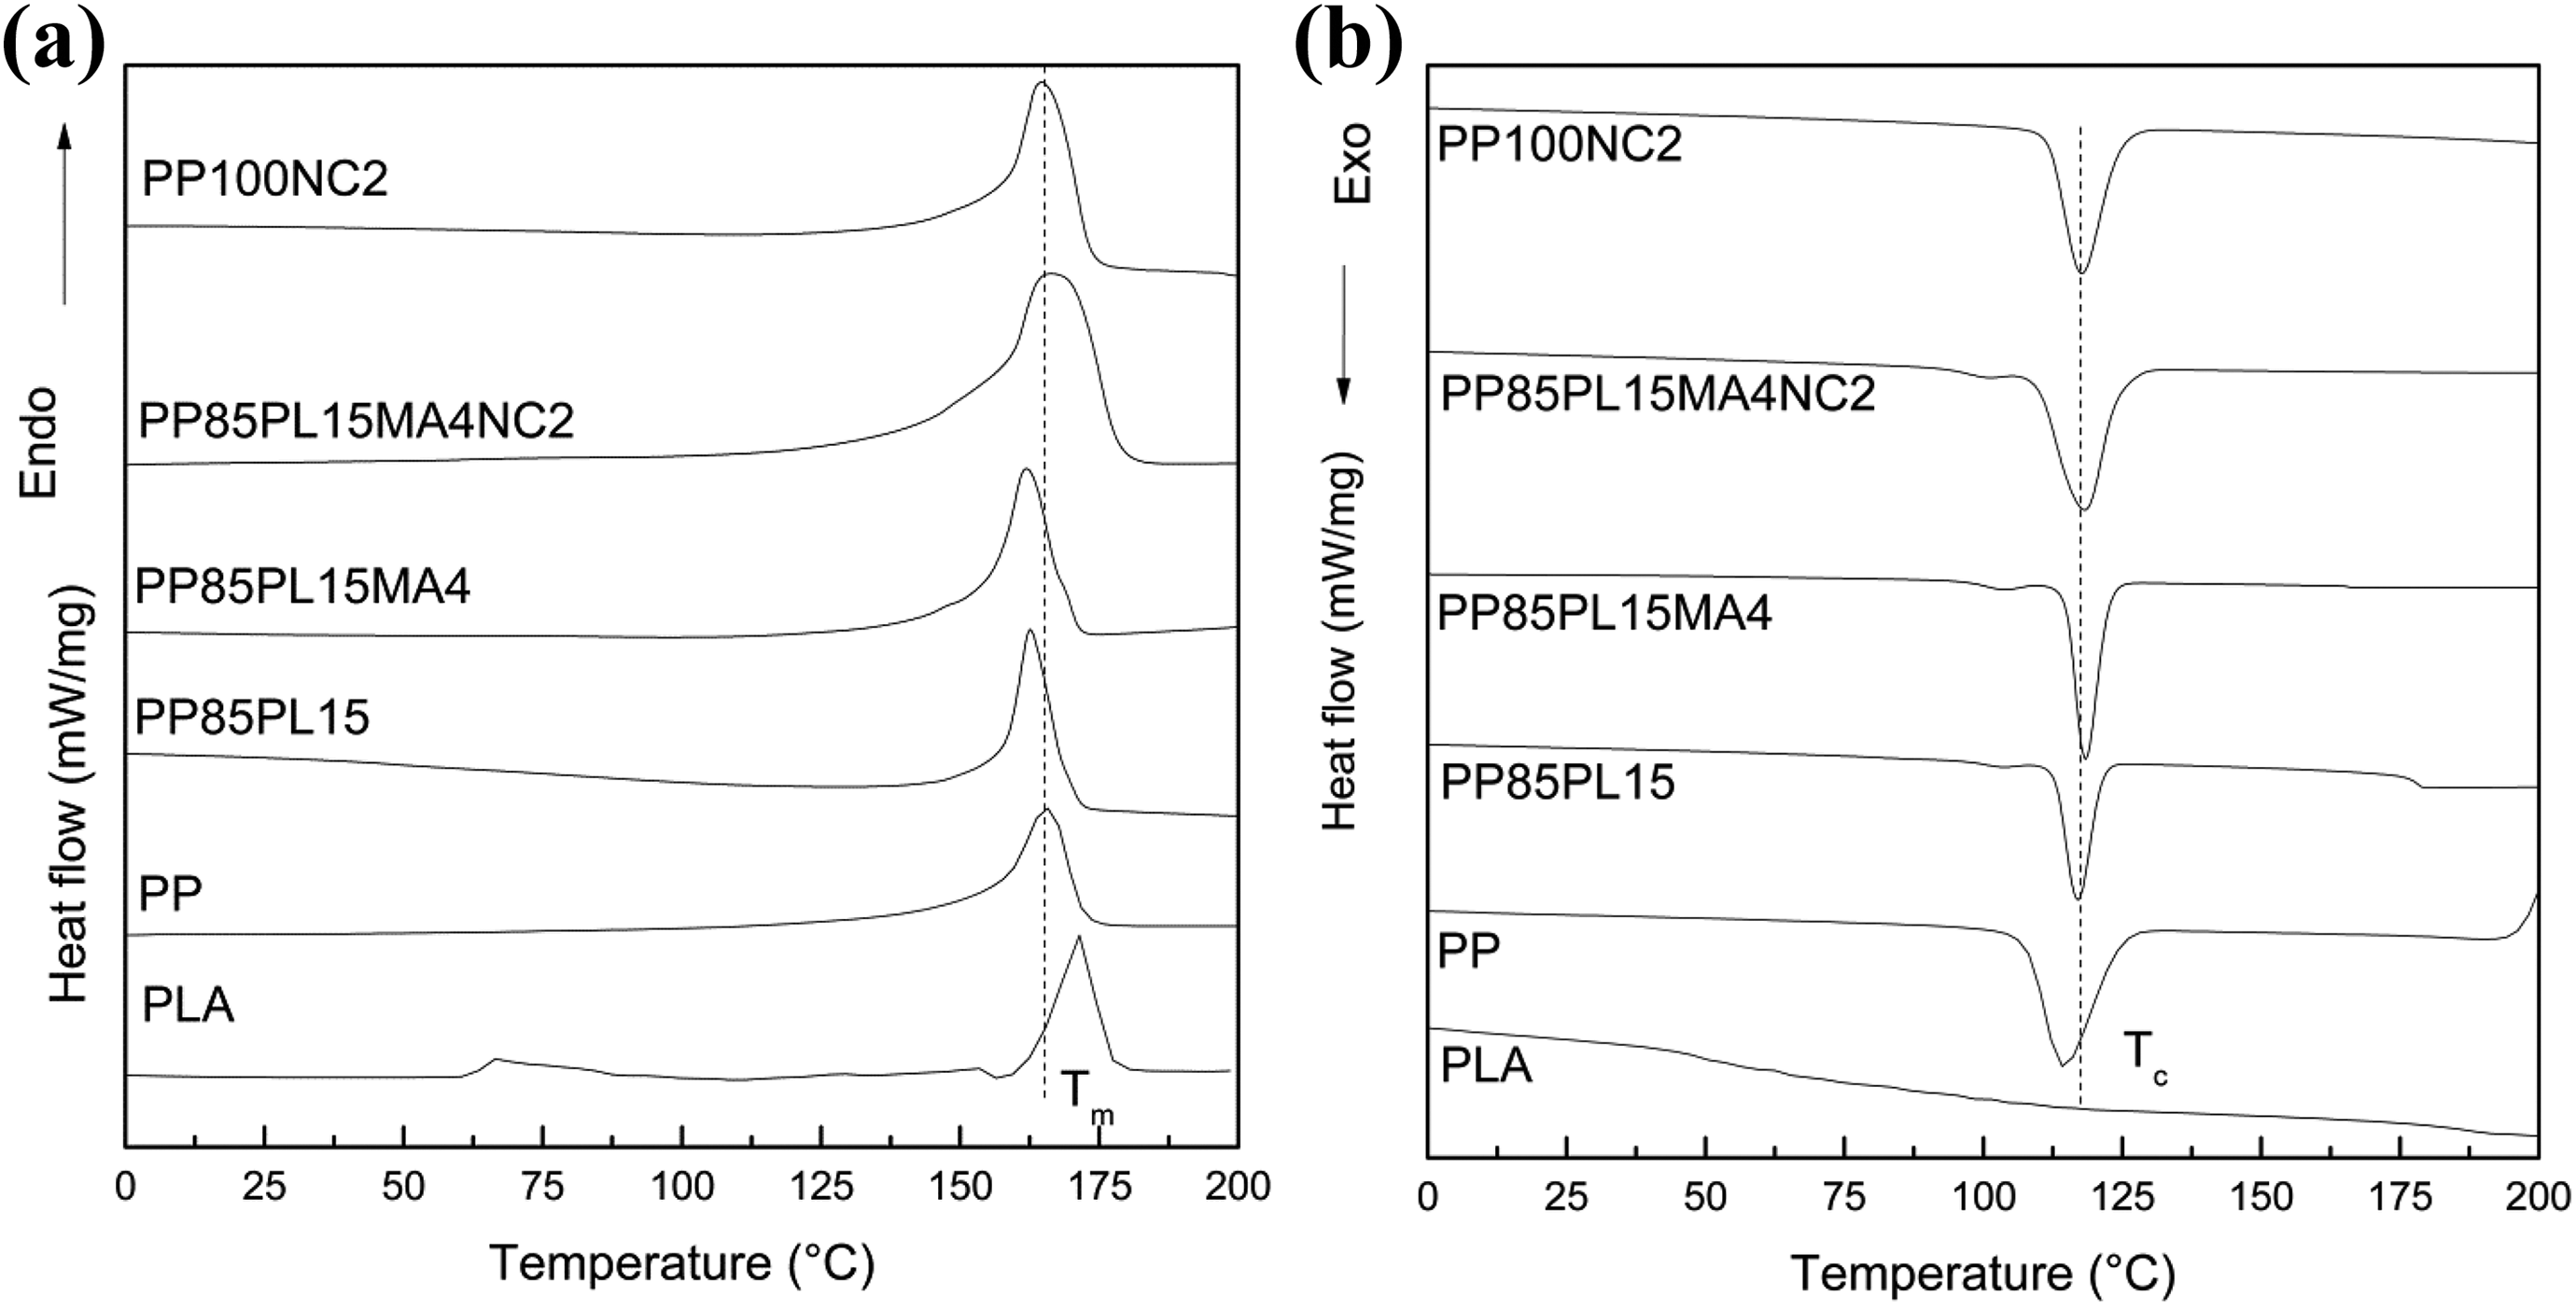
DSC showing (a) melting and (b) crystallization curves of all blended and composite films.
DSC melting and crystallization parameters of blended and composite films.
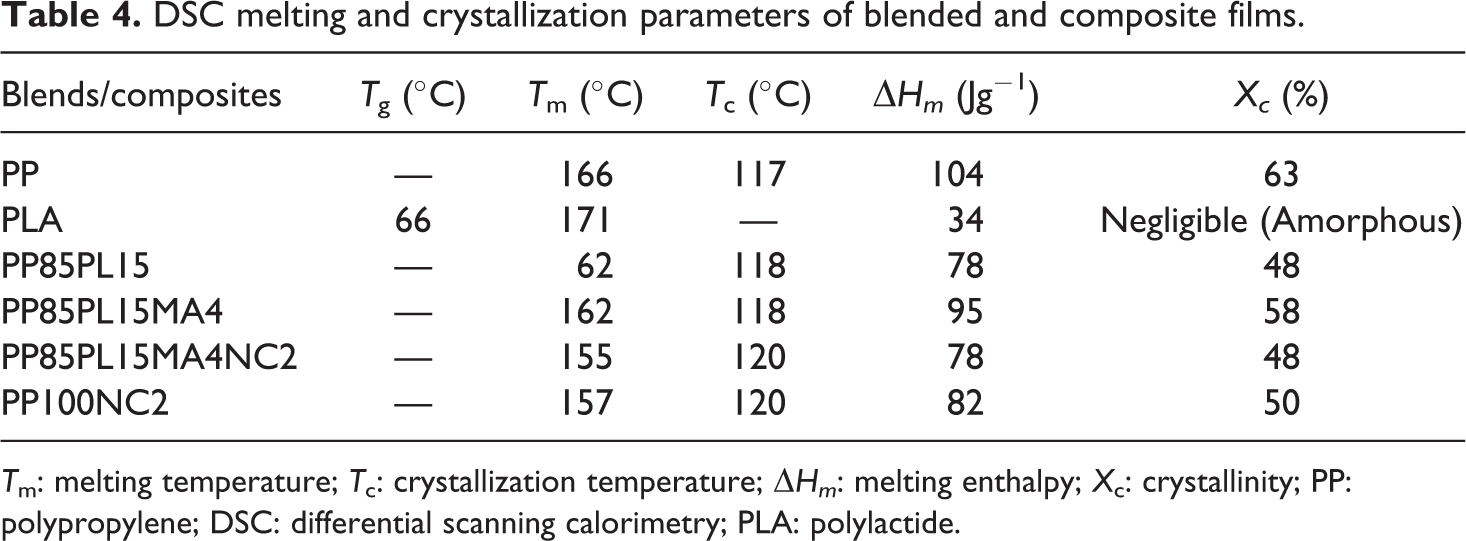
T m: melting temperature; T c: crystallization temperature; ΔHm : melting enthalpy; X c: crystallinity; PP: polypropylene; DSC: differential scanning calorimetry; PLA: polylactide.
X-Ray diffraction
Figure 4 shows the XRD patterns of blended and composite films. The peaks of the PP corresponding to the α-monoclinic form are at 2θ = 14.1°, 16.9°, 18.6°, 21.1°, and 21.9°. For the PP/PLA blends and their composites, XRD patterns are almost identical to that of the neat PP film. It confirms the domination of PP peaks in the blended and composite samples. The diffraction peaks of blended samples are similar to PP after adding PLA. There are no significant shifts in the diffraction peaks in the blended and composite samples. This shows that the nature of the crystalline lattices did not undergo a large change. For nanocomposites, a small peak is observed around 2θ = 20°. Some authors interpreted this peak as a (130) γ-reflection as a result of the confined PP crystallization in the presence of well-dispersed clay. 31 In our case, this peak in composites PP100NC2 and PP85PL15MA4NC2 confirms the presence of nanoclay.
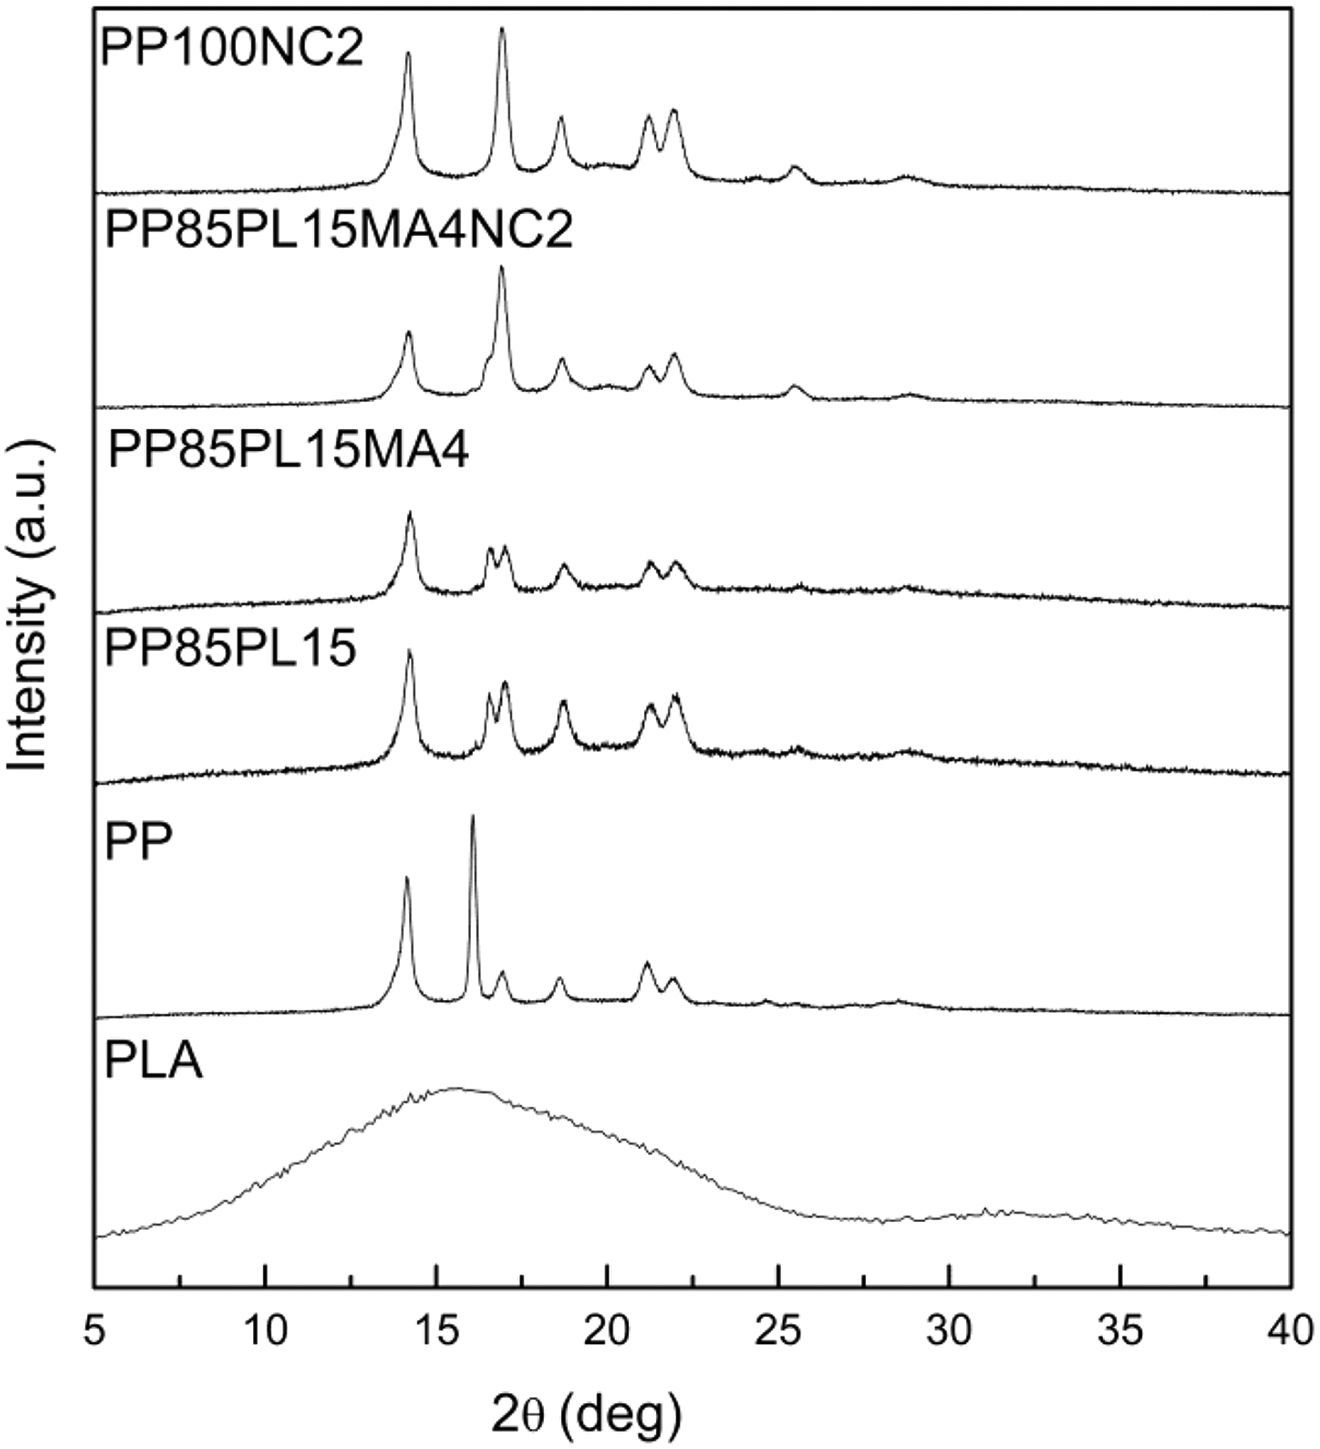
XRD patterns of PP, PLA-blended, and nanoclay-filled PP samples.
Rheology testing
It is very essential to know the relationship between rheology and structure of the polymer blends. Rheology of all the blended and composite films is shown in Figure 5. Viscoelastic region was characterized by the dynamic shear strain sweep test. The energy stored in the material is measured by the storage modulus (G′). The viscous behavior is characterized by the loss modulus (G″). Figure 5(a) and (b) shows the graph of G′ and G″ with shear strain for all the blended and composite films. All the blended and composite films show a nonlinear region at higher and a linear region at lower shear strain. Both G′ and G″ of blended films are lower than PP films.
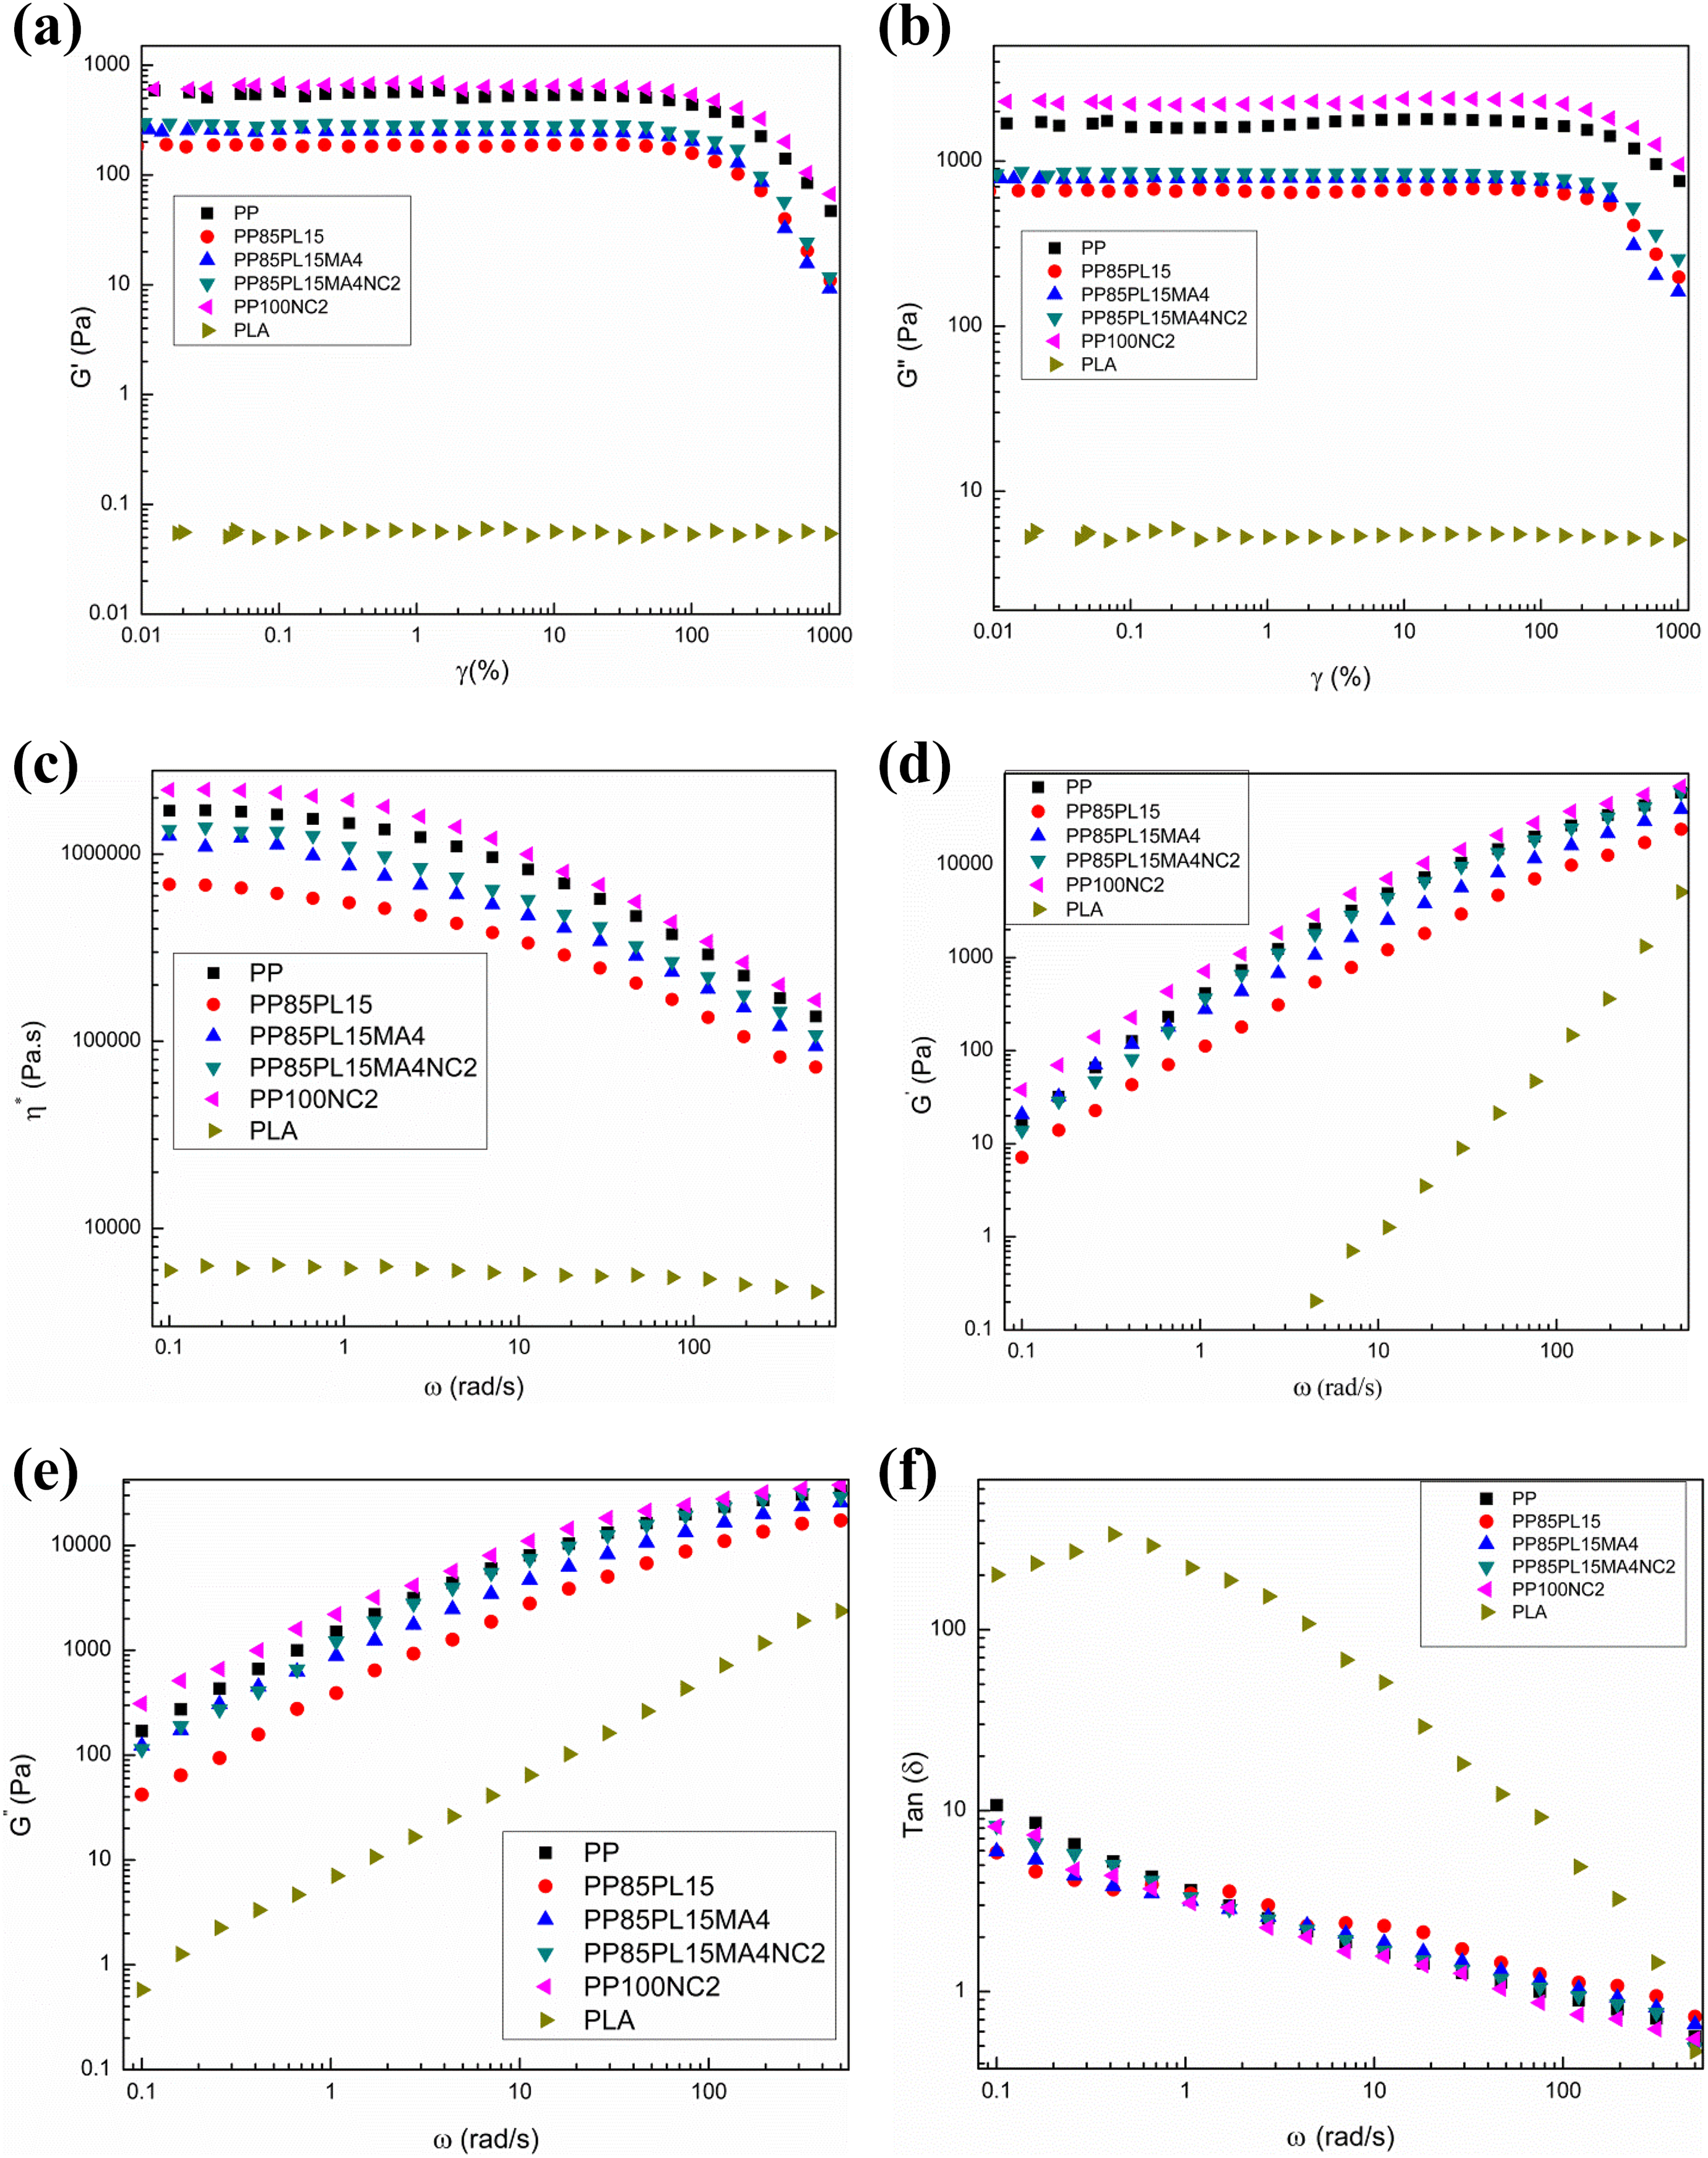
Rheological behavior (a) G′ versus γ, (b) G″ versus γ, (c) η* versus ω, (d) G′ versus ω, (e) G″ versus ω, and (f) tan (δ) versus ω of blended and composite films.
Complex viscosity (η*) parameter indicates the resistance to the flow. Figure 5(c) shows the curves between η* and ω of all blended and composite films. The shear-thinning and pseudo-plastic characteristics of all the blended and composite films are confirmed by monotonically decreasing η* with increasing ω. The decrease in viscosity with an increase in shear rate for all the blended films is as expected. Lower interaction between the PP and the PLA decreased the viscosity of the PP/PLA blend. But, addition of the compatibilizer (4 phr) in PP85PL15 blend enhances the compatibility and complex viscosity, respectively, due to the increase in interaction between the PP and the PLA. Addition of the nanoclay in PP composites PP100NC2 and PP85PL15MA4NC2 also increased the complex viscosity due to better interaction between nanoclay particles and PP that reduces the flow during the molten state.
The viscous and elastic behavior of the blended and composite films are shown in Figure 5(d) and (e). G′ and G″ versus ω gives the valuable information about the melt flow characteristics. 7 G′ of all the blended and composite films monotonically increases with an increase in frequency. G′ of PLA increases with an increase in ω. Higher elasticity of blended and composite films in comparison with PLA film is mainly due to the chain entanglement. Addition of the compatibilizer in P85PL15 blend increased G′ at all values of ω due to increase in chain entanglement between two polymers. The results of G″ are quite similar to G′.
Figure 5(f) shows the curves between loss angle (tan δ) and ω of all the blended and composite films. The loss angle is a ratio of loss to the storage moduli and confirms the viscoelastic damping behavior of polymer systems. The loss angle of all the blended and composite films decreases with an increase in ω. The slope of loss angle curve is negative for the blended and composite films.
Scanning electron microscopy
The SEM images of blended and composite films are presented in Figure 6. The morphology of PP, PLA, PP85PL15, PP85PL15MA4, PP100NC2, and PP85PL15MA4NC2 was studied on the cryofractured surface. The cryofractured surface of neat PP (Figure 6(a)) and neat PLA (Figure 6(b)) samples look smoother. In the case of PP85PL15 blend (Figure 6(c)), a phase-separated morphology was observed due to the immiscibility between PP and PLA (Figure 6(c)). This immiscibility is due to the polar nature of PLA and nonpolar nature of PP. The compatibility of blend increases with the addition of compatibilizer as confirmed by the smooth surface (Figure 6(d)). The smooth surface of PP85PL15MA4 blend is due to the improvement of facial adhesion between two polymers. In the case of PP85PL15MA4NC2 (Figure 6(e)) and PP100NC2 (Figure 6(f)) nanocomposites, nanoclay was dispersed into the compatibilized PP/PLA and PP matrix in the form of small and large aggregates.
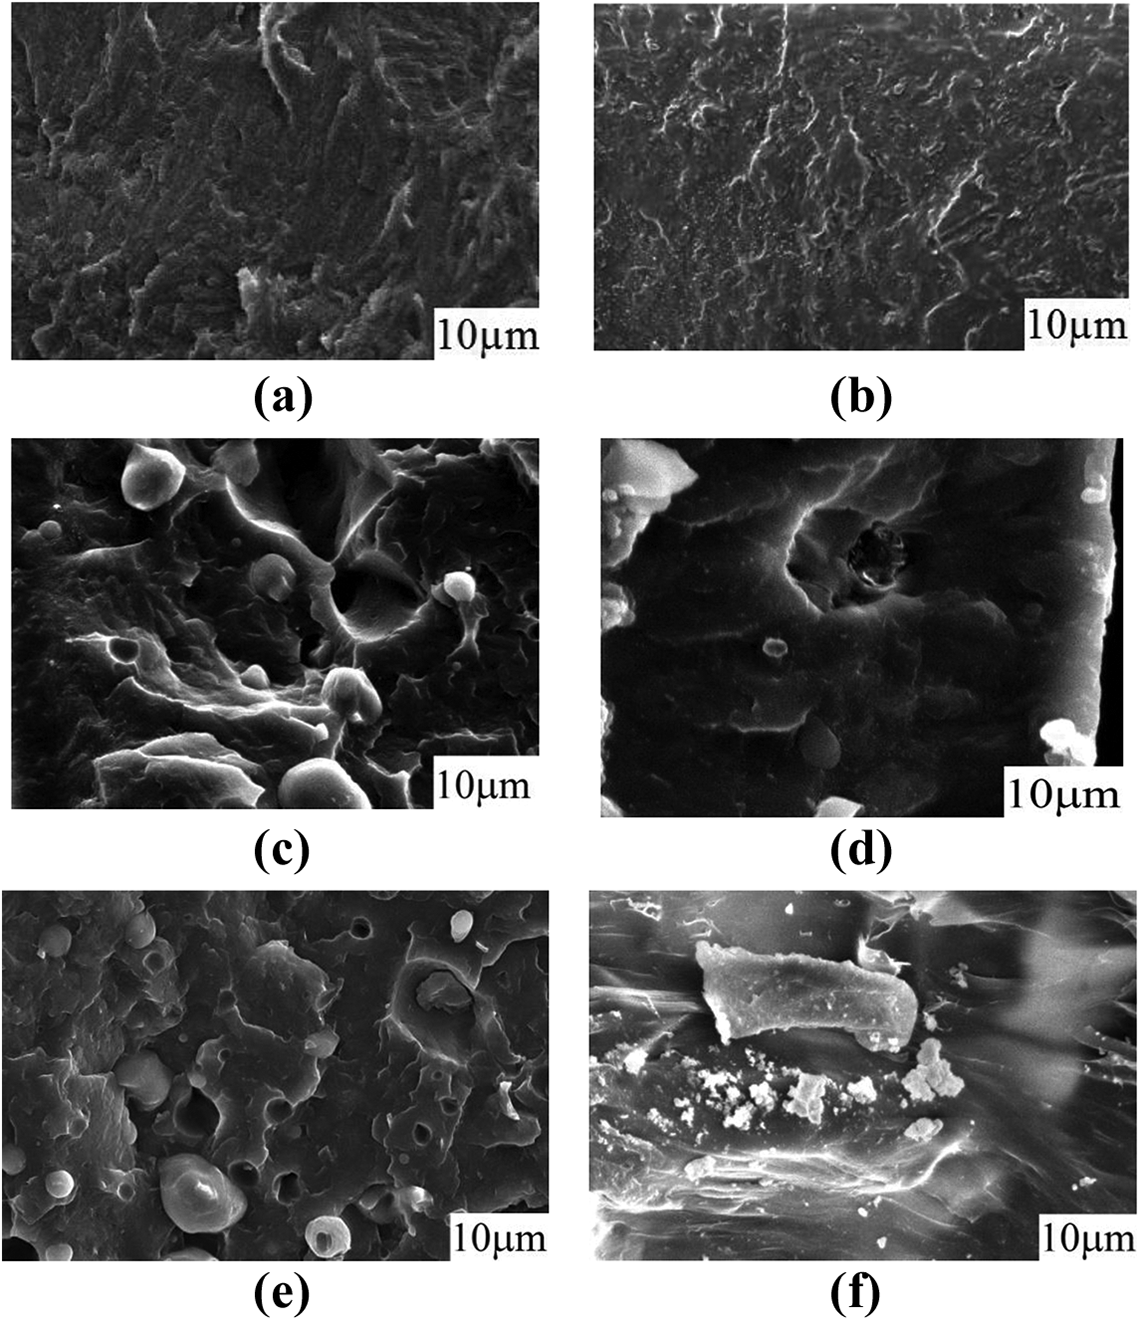
SEM of (a) PP, (b) PLA, (c) PP85PL15, (d) PP85PL15MA4, (e) PP85PL15MA4NC2, and (f) PP100NC2.
Biodegradation testing
Aerobic biodegradation test of PP and PP/PLA blends and their composites were investigated according to the guideline of ASTM D 5338-11 standard. PP and microcrystalline cellulose were used as a negative and positive sample, respectively. The biodegradation curves of all the samples are shown in Figure 7. The test was conducted for 45 days and the biodegradability was calculated from equation (2). PP confirmed the nonbiodegradable nature, whereas cellulose showed 76% biodegradability due to easily assimilation by microorganisms. The biodegradability of PP85PL15 and PP85PL15MA4 was 3.2% and 3.5%, respectively. Incorporation of PLA in PP85PL15 blend increases amorphous phase and enhances the biodegradability; the microbes easily assimilate the amorphous part of the blends. Addition of the compatibilizer in PP85PL15MA4 blend enhances the biodegradation to some extent. But, the biodegradability of PP/PLA blends is lower than 4%. PP in the blend with PLA is refraining the propensity of PLA to biodegradation under composting condition, and it slows down the degradation and biodegradation of PP/PLA blends. It takes longer time for the biodegradation of PP/PLA blend. The biodegradation of PP100NC2 and PP85PL15MA4NC2 composite was enhanced to 1.2% and 4.6%, respectively. Nanoclay maintains the pH level of the environment at conducive levels, which is helpful in microbial growth. 32 Some researchers have found that exchange of cation and increase in surface area due to the presence of clay are the main reasons for microbial growth. 33,34 Microorganisms convert low-molecular-weight product into CO2, water, and biomass, which is helpful in the biodegradation of the composite films.
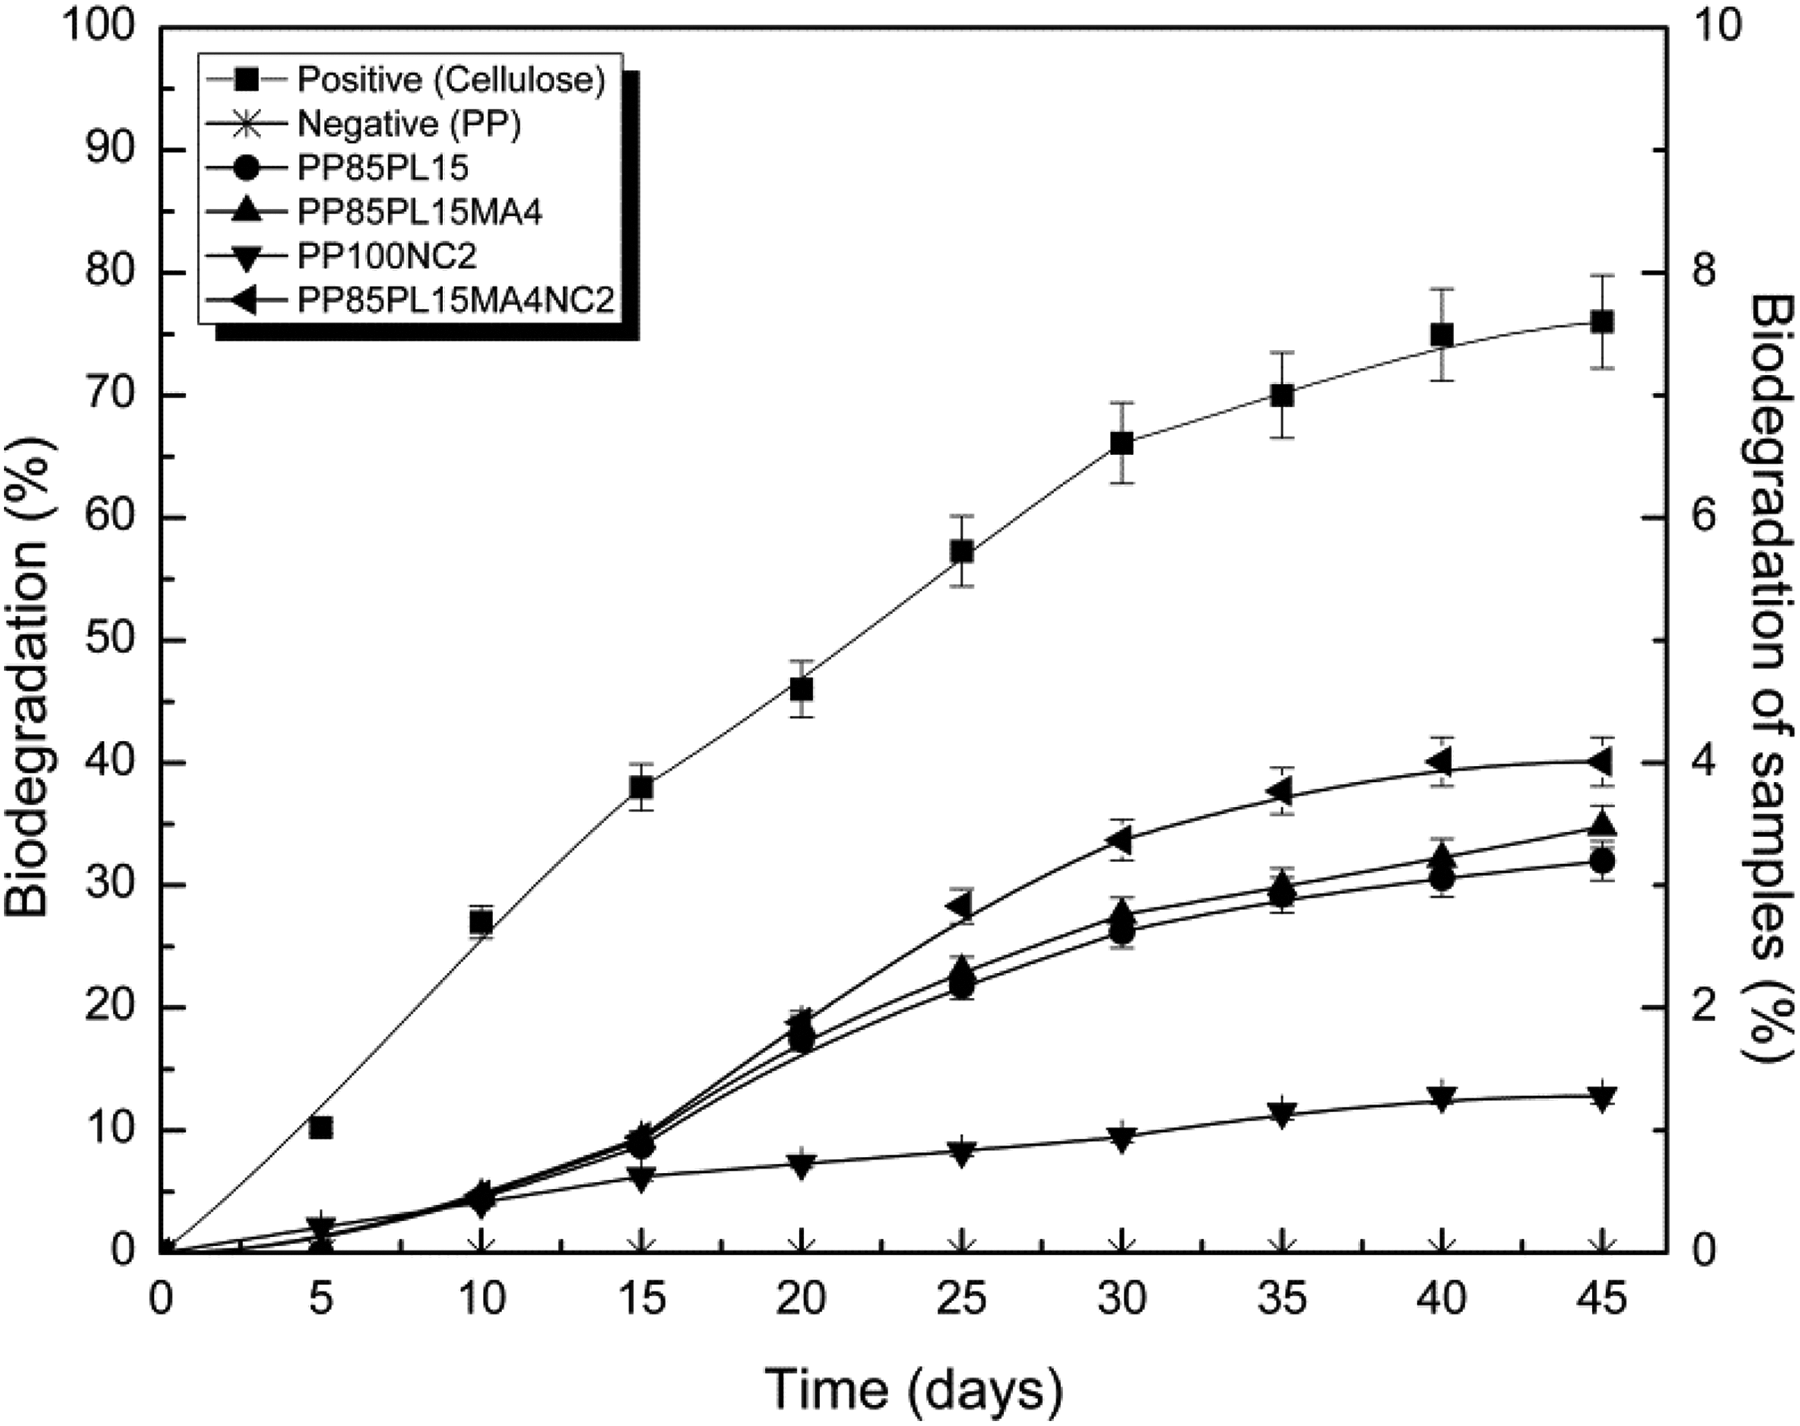
Biodegradability of all blended and composite samples.
Microbial toxicity testing
Table 5 shows the CFU count from the soil extracts. Cellulose resulted in highest number (Bacterial lawn) of CFU count and blank sample has lowest number (0.2 × 10⁴) of CFU count. In Table 5, CFU count of all the soil extracts is similar to or more than the blank, which confirmed the bacterial growth and nontoxic nature of biodegradation intermediates.
The CFU count from the soil extracts of compost.
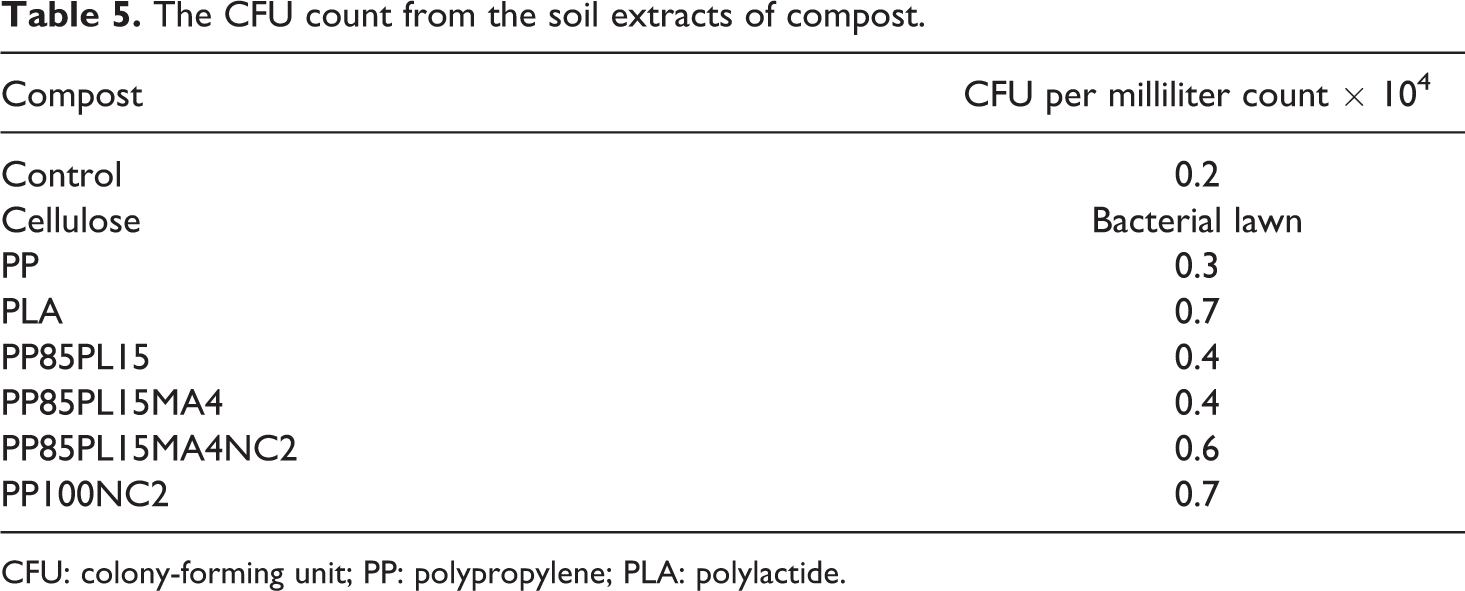
CFU: colony-forming unit; PP: polypropylene; PLA: polylactide.
Plant growth toxicity testing
pH of medium was checked before the test to confirm the suitability of medium. The suggested pH of medium was 5.5 for the plant growth toxicity test. 35 Medium pH was 5.8–6.0, very close to suggested pH.
Plant growth test was performed with two types of plants to investigate the effect of biodegradation intermediates on the medium. 22 Visual evaluation shows 100% emergence of plant in the medium, which confirms nontoxic nature of biodegradation intermediates (Figures 8 and 9). Moreover, weight of plants was measured after drying in oven at 75°C. Figure S1 shows the weight percentage in comparison with control that was close to 100%.
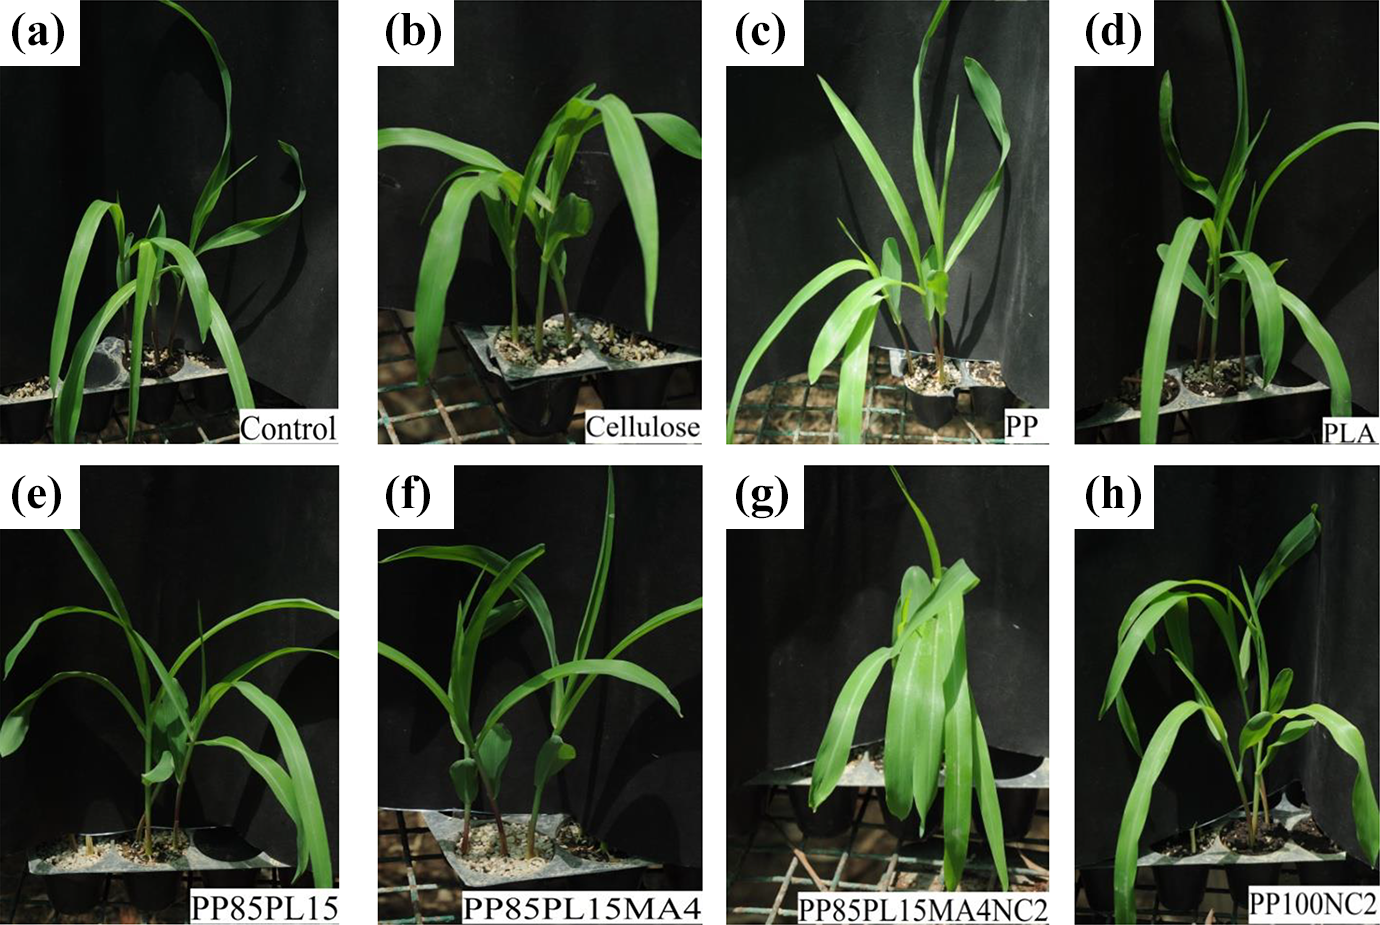
Corn growth in medium (a) control, (b) cellulose, (c) PP, (d) PLA, (e) PP85PL15, (f) PP85PL15MA4, (g) PP85PL15MA4NC2, and (h) PP100NC2.
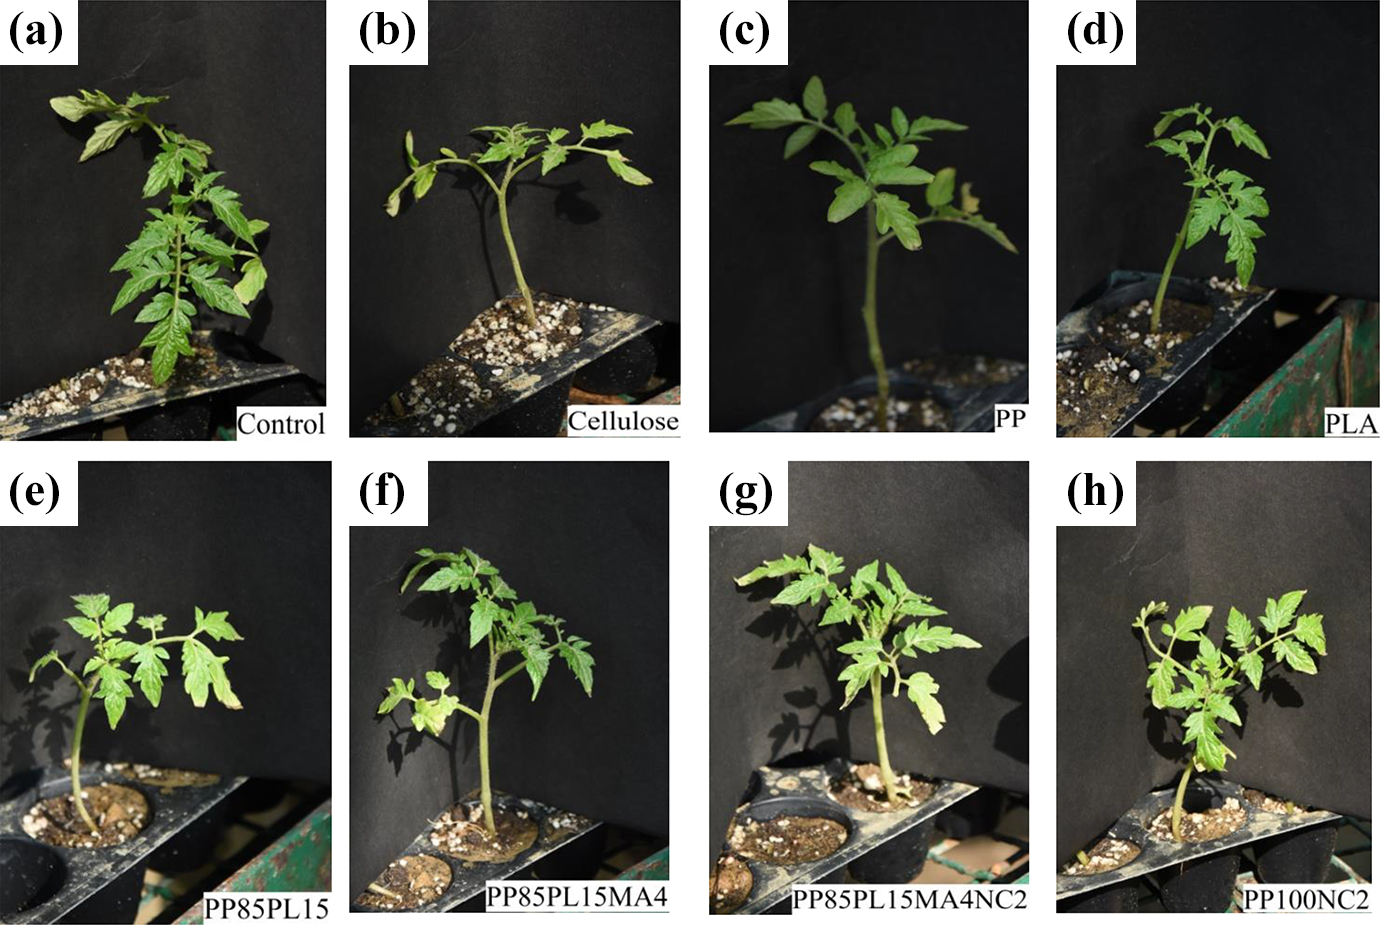
Tomato growth in medium (a) control, (b) cellulose, (c) PP, (d) PLA, (e) PP85PL15, (f) PP85PL15MA4, (g) PP85PL15MA4NC2, and (h) PP100NC2.
Conclusions
PP85PL15, PP85PL15MA4, PP85PL15MA4NC2, and PP100NC2 were the optimum blends and composites, which were chosen on the basis of tensile properties for further studies. TGA studies show that PP and PLA form immiscible blend due to poor interaction and different polarity. This was also supported by SEM analysis which showed an increase in roughness and void with increasing amount of PLA. By adding compatibilizer into the blend, improvement in compatibility and thermal stability was observed. DSC studies confirmed the decrease in crystallinity and increase in amorphous nature with the addition of PLA in blends. Rheological studies show the shear thinning behavior of PP and PP/PLA blends. Nanoclay also increased the amorphous nature of composites, which was helpful in the biodegradation. Rheological studies confirmed an increase in complex viscosity and storage modulus with the addition of compatibilizer and nanoclay in blends and composites. Addition of the compatibilizer enhanced the compatibility between two polymers. The addition of nanoclay enhanced biodegradability. Growth of both plants confirms nontoxic nature of biodegradation intermediates.
Supplemental material
Supplemental Material, Figure_S1 - Preparation and characterization of polypropylene/polylactide blends and nanocomposites and their biodegradation study
Supplemental Material, Figure_S1 for Preparation and characterization of polypropylene/polylactide blends and nanocomposites and their biodegradation study by Dev K Mandal, Haripada Bhunia, Pramod K Bajpai, Chandrasekhar V Chaudhari, Kumar A Dubey, Lalit Varshney and Anil Kumar in Journal of Thermoplastic Composite Materials
Footnotes
Acknowledgement
The authors wish to express their sincere thanks to Department of Atomic Energy, Board of Research in Nuclear Sciences, Bhabha Atomic Research Centre, Mumbai, Maharashtra, India, for providing the facilities for experimentation.
Funding
The author(s) disclosed receipt of the following financial support for the research, authorship, and/or publication of this article: This work was supported by Council of Scientific and Industrial Research, Government of India through scheme number 22(00745)/17/EMR-II.
Supplemental material
The supplemental material is available online.
References
Supplementary Material
Please find the following supplemental material available below.
For Open Access articles published under a Creative Commons License, all supplemental material carries the same license as the article it is associated with.
For non-Open Access articles published, all supplemental material carries a non-exclusive license, and permission requests for re-use of supplemental material or any part of supplemental material shall be sent directly to the copyright owner as specified in the copyright notice associated with the article.