
Abstract
This study reports experimental and numerical behaviors of both dry and silicon-coated twill-weave Kevlar fabrics under low-velocity impact. Initially, the fabrics are augmented in silicon aqueous suspension with various particle concentrations, and then, increase in the weight and friction coefficient are studied. The low-velocity impact test results show that the best particle concentration to meet the mentioned requirements is about 10 wt%. The experiments indicate high-impact resistance of the target by increase in the number of fabric plies. It is found that silicon-coated fabrics under drop-weight test show more time duration of impact and better performance than dry fabrics. Furthermore, the tests show that in the dry fabrics, broader region stretches due to impact, while in silicon-coated fabrics, the damage is limited to the impact point. The numerical simulation is performed for the coated fabric, and the effect of fabric augmentation with silicon is introduced as yarn friction. The numerical results are in good agreement with the experimental results.
Introduction
Kevlar fabrics with high-strength and high-modulus fibers were developed in 1960s. The use of these materials improved and enhanced body armors to protect against various harms and damages. 1 Kevlar fibers have exceptional engineering properties, such as high modulus, high strength, low weight, high chemical resistance, and thermal stability. 2 Nowadays, Kevlar fabrics are widely applied in armors, aeronautics, and automobile industries due to higher impact performance. 3 Many researchers studied the impact performance of these materials experimentally and numerically, and they devised analytical formulations. 4
Various factors influence the impact performance of the fabric. These factors include studying the role of friction, 5 fabric clamping conditions, 6 velocity and geometry of the projectile, 7 fabric target shape and size, 8 number of plies, 9 and yarn material properties. 10
Inter-yarn coefficient of friction is one of the most effective factors in enhancing the impact performance and energy absorption capacity of Kevlar fabrics. Inter-yarn friction causes effective yarn interlocking, and more energy is required for yarn pullout. In fact, warp–weft close interlocking causes delay in fabric yarn breakage, and this enhances energy-absorbing potential of the fabric.
By working experimentally on Kevlar fabrics, Briscoe et al. 11 mentioned that energy absorption capacity of fabrics against projectile impact decreased by reduction in the inter-yarn coefficient of friction. Duan et al. 5 performed numerical simulation for the fabric with zylon yarns, and they showed that by increasing the coefficient of friction between the zylon yarns, impact performance of the fabric increased against the projectile impact, that is, it resulted in lower residual velocity of the projectile after the impact.
Nowadays, most research studies concerning improvement in the impact performance of the fabrics are associated with increasing the coefficient of friction of yarn. These studies include fabric augmentation with various materials and estimation of impact performance. The materials with lubricious properties, that is, greasy, reduce the inter-yarn friction and, consequently, the impact performance of the fabric, or vice versa. Bazhenov 12 studied the ballistic performance of wet fabric against spherical bullet impact. He concluded that water reduced the impact performance of the fabric due to reduction in friction between the bullet and the yarns. He showed that dry laminates resisted against the projectile impact, while wet laminates were perforated by that impact. Lee et al. 13 showed that shear thickening fluid (STF)-impregnated fabric had higher impact performance than the neat fabric, and the results exhibited that four layers of Kevlar fabric impregnated with 8-mm-thick STF absorbed the same amount of impact energy as 14 layers of neat Kevlar fabric did. Dischler et al. 14 studied the energy absorption capacity of yarns coated with various powders. For example, two layers of fabric coated by potassium chloride displayed 23% improvement in energy absorption, due to friction enhancement, with 5% of weight increase. LaBarre et al. 15 studied the ballistic performance of carbon nanotube (CNT)-augmented Kevlar fabric. The authors concluded that the ballistic resistance was doubled due to fabric augmentation. They also performed numerical simulation for CNT-augmented Kevlar and introduced the effect of CNT as inter-yarn coefficient of friction, and finally, they found good agreement between the numerical and the experimental results.
Problem description
In this study, low-velocity impact performance of twill-weave Kevlar fabric has been reported to provide protection against damage. This study also compares the impact performance of neat Kevlar fabric with silicon suspension-augmented fabric experimentally. The test is performed with a cylindrical flat-end–shaped drop-weight impactor. The test specimens are made of single-, two-, and four-ply fabrics. The criteria for comparing the impact performance of the results include time history diagram of force and acceleration for various targets, with time duration of impact as quantitative parameters and yarn crimp and yarn breakage of the fabrics as qualitative indicators. Furthermore, the practical clamping condition is presented so as to achieve the most efficient clamping and to avoid test result deviations.
Numerical simulation is performed with shell elements for modeling cross section of fabric yarns. A yarn level of resolution is used in this model. The linear stress–strain behavior of the Kevlar fabric is modeled according to the material model given by Khodadadi et al. 16 Finally, the coated fabric yarns are introduced in the form of inter-yarn coefficient of friction in LS-DYNA.
The final goal of this research is to present a low-weight and high-performance fabric to be used against impact damage.
Materials and experiments
Materials
Kevlar fabrics used for the impact test are made by Kevlan Company, Australia. The as-received Kevlar fabric is twill-woven. The weight per unit area is 400 g/m2, and the thickness is 0.38 mm. The yarns are 1.6 mm wide and 0.19 mm thick. Complete detailed properties and product data of Kevlar fabrics are given in Table 1.
Product data of Kevlar fabrics.
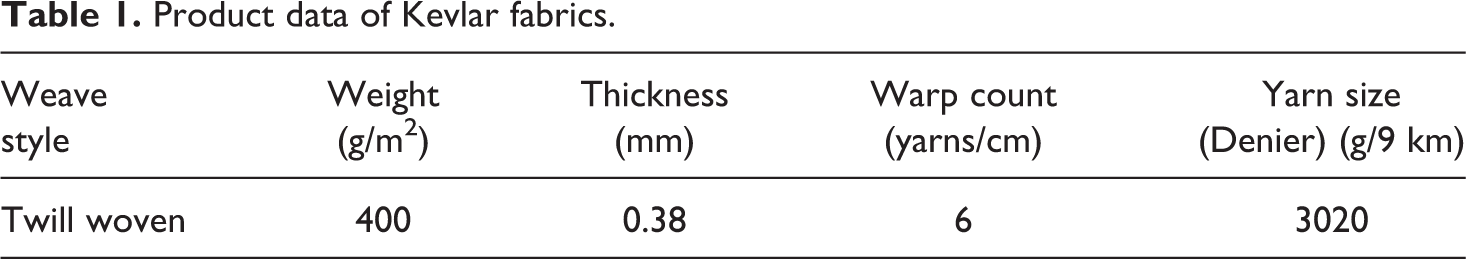
The fabrics are cut into 15 × 15 cm2 pieces, and the weight is measured up to three decimals accuracy before augmentation (Figure 1).
Cutting the Kevlar fabric to prepare for augmentation with silicon suspension.
The silicon used for coating purposes is made in a German company “Wacker Chemical” with the “ELASTOSIL® LR 3003/40” brand. The silicon belongs to the group of polydimethylsiloxane with (C2H6OSi) n chemical formula with two types A and B, that is, it contains platinum catalyst and a cross-linker, respectively, with equal density of 1.13 g/cm3. To prepare silicon suspension with an arbitrary particle concentration, 50% of each type A and B is solved with the presence of N-hexane solvent at room temperature. Hexane (C6H14) is a colorless, transparent, and volatile liquid with a density of 0.65 g/ml, and it is widely used in various products such as adhesives, paints, plastics, and rubber.
The coefficient of friction for silicon-coated fabric is measured according to the model proposed by Dong and Sun. 2 Initially, the fabrics are augmented with silicon suspension with 5%, 10%, and 20 wt% concentration. By comparing the coefficient of friction enhancement relative to increase in weight, the optimum suspension concentration is chosen to augment the remaining Kevlar fabrics.
To prepare the desired silicon concentration, an arbitrary amount of solvent is poured into the graduated cylinder, then the mass is measured, and finally the required mass of silicon to reach 5, 10, and 20 wt% concentration is calculated. Half of the required silicon mass, types A and B with equal mass, that is, 50% of each, is added to the solvent. Finally, the suspension is completely mixed up with the mechanical disperser machine.
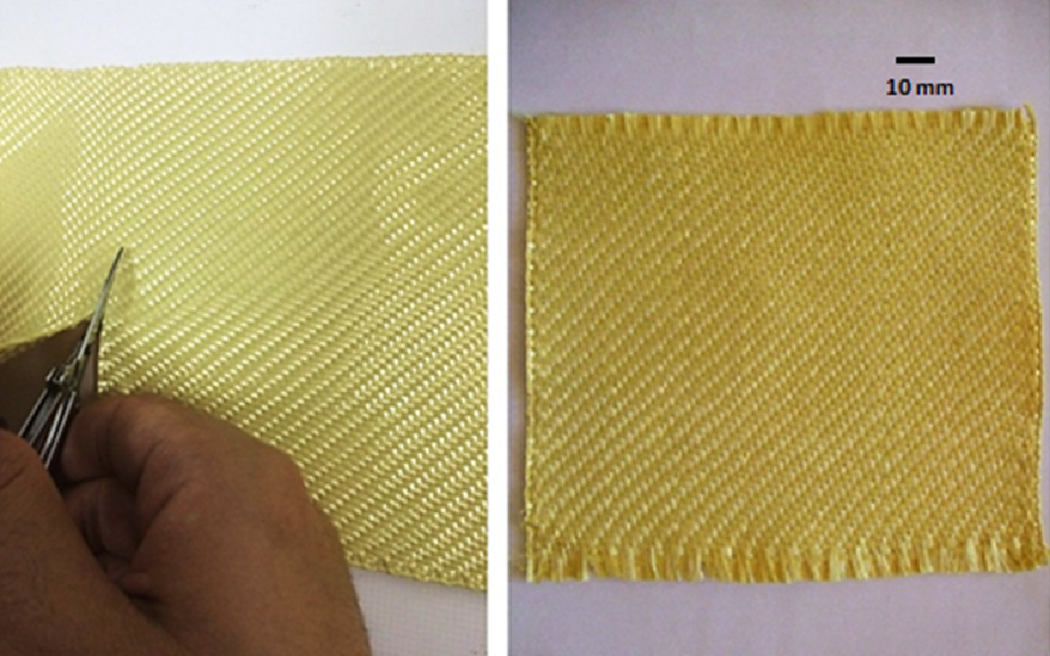
The dip coating method is a common method to coat fabrics with liquids, suspensions, and so on. This method may be applied using a dip coater machine with an arbitrary infinitesimal coating thickness. Figure 2 displays the common procedure of dip coating method.
Schematic procedure of dip coating method.
According to Figure 2, at the first stage, the sample is submerged into the suspension, and it is augmented with silicon. In this experimental procedure, the speed of the dip coating machine is 6 mm/min. At the second stage, the sample is pulled out of suspension with the same speed. At the third stage, a thin layer of coating is visible on the sample, and the layer thickness depends on various factors such as dip coating speed, density, and viscosity of the suspension. At the final stage, the sample is placed in a convection oven for the extra solvent to evaporate.
Inter-fiber friction test
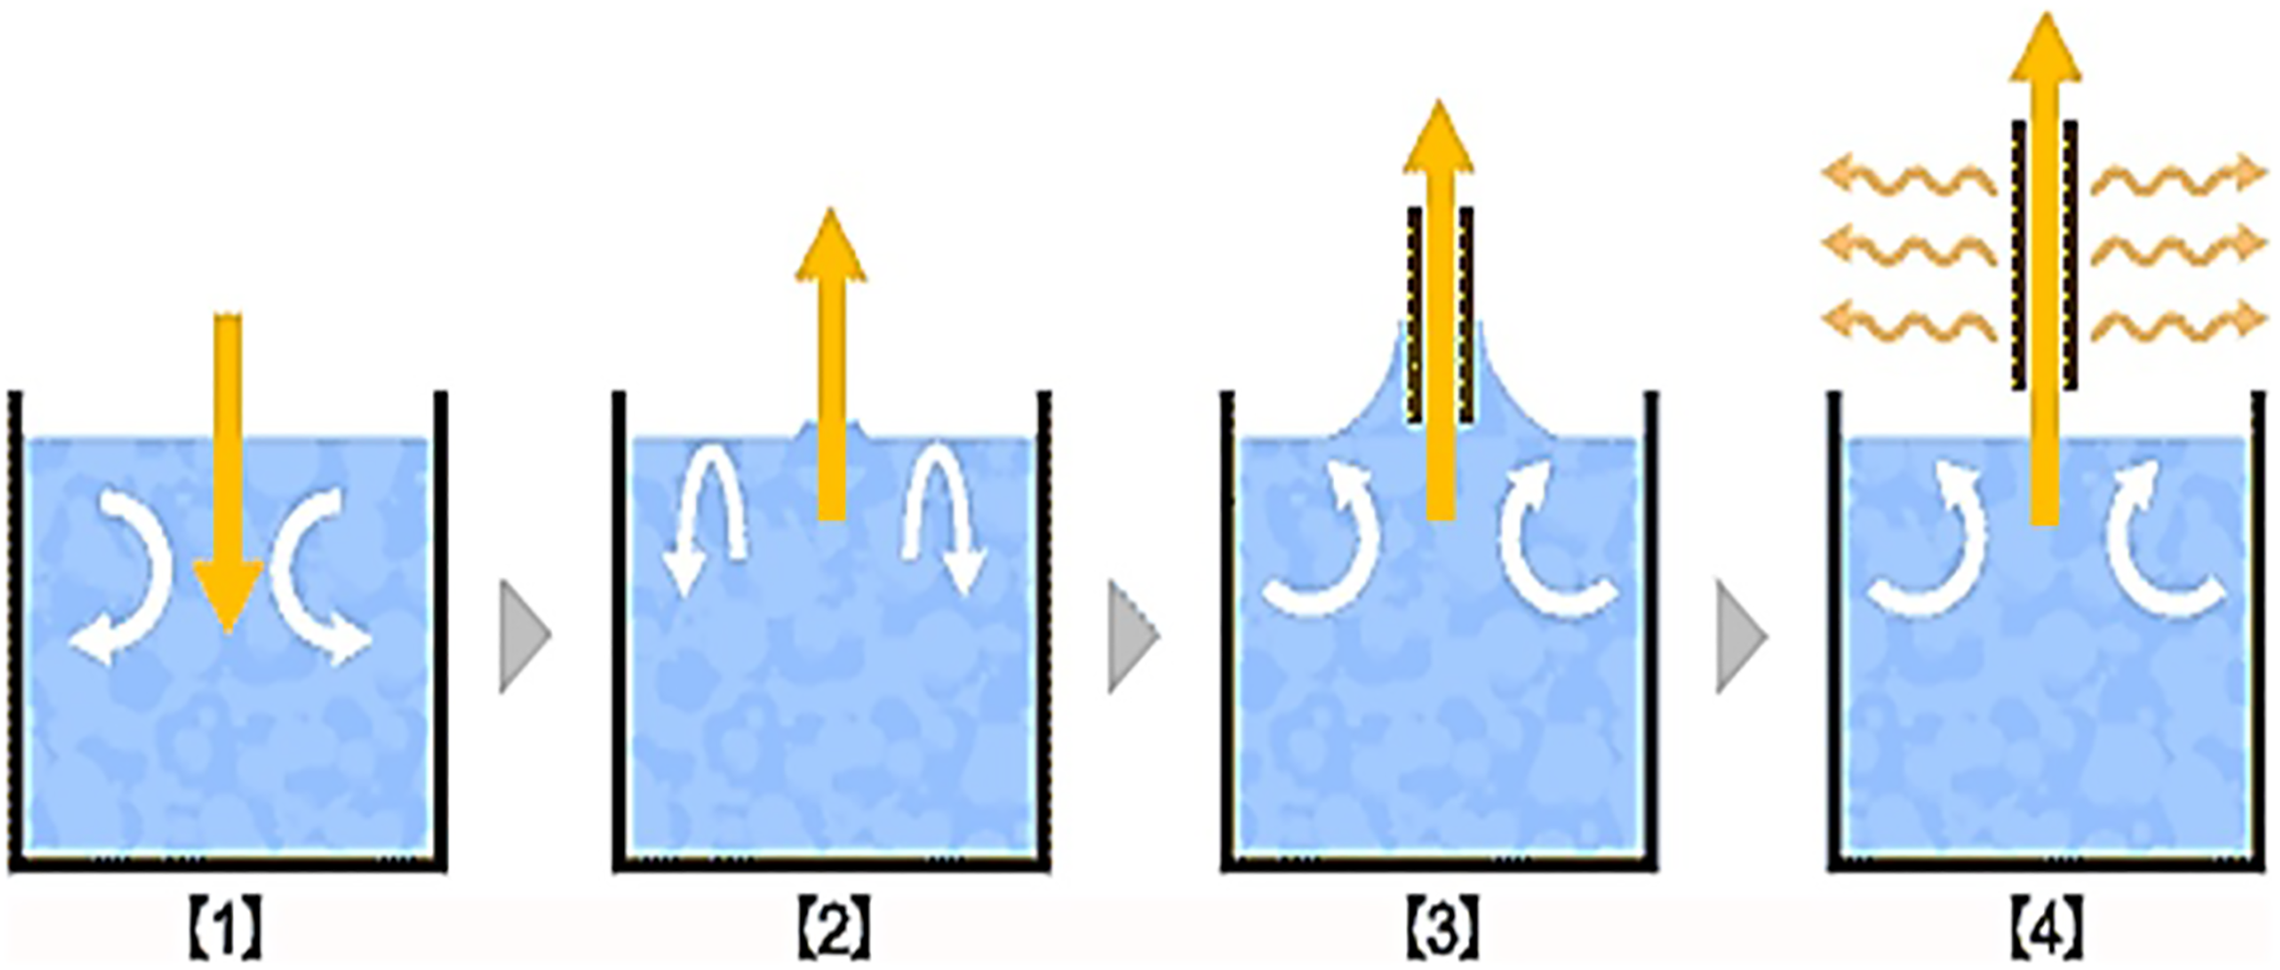
The model proposed by Dong and Sun 2 is presented in this study to measure the coefficient of friction of yarn. The drum is made by attaching two small plastic gears to a solid cylinder. For a fabric under consideration, the Kevlar yarn is removed from the fabric first and then wrapped onto the drum. The yarns are wrapped along the drum axial direction and the Kevlar yarns are held in position by gear teeth (Figure 3).
Schematic experimental setup for measuring the cross-yarn friction. 2
During the test, the drum is fixed by fixing drum’s shaft. A weight with a definite mass M 1 is kept constant during the test. The second weight M 2 is a container with sand. Its weight is increased by adding sand to the container until it exceeds the balance and starts to move downward.
The coefficient of friction is calculated using the following equation:
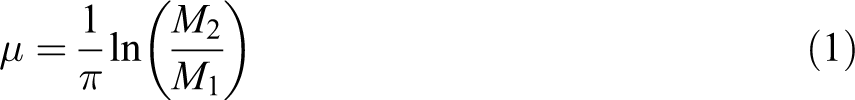
According to Dong and Sun 2 , two gears with a similar diameter of 77.7 mm and 60 gear teeth are used to perform the friction test. The yarns are separately wrapped between the gear teeth along drum axis, and they are fastened to the shafts. As half of the gear teeth are subjected to perform yarn sliding on another yarn, 30 yarns are wrapped between 30 teeth. The last yarn is wrapped around perpendicular to previous yarns with similar weights hung over both sides. Finally, the coefficient of friction of yarns is measured.
Impact test
Impact test experiment is performed with drop-weight impact test machine. The 4-m high pneumatic impact device is composed of support fixture, impactor, latch mechanism, crosshead, electromotor, impactor accelerometer, two guide rails, two 4-m high screws, two springs above the end of the guide rails to increase kinetic energy of the impactor, and finally four springs to stop the impactor. The device is connected to a computer; furthermore, it can be controlled manually.
The target is supported by 30 × 30 cm2 support plates. The plates can support a cylindrical-shaped target with a diameter of 15 cm, and the plates have holes centered with a diameter of 8 cm, the region that exposes the target to impact load (Figure 4(a) and (c)).
The impact test machine setup: (a) impactor assembly, (b) striker, (c) fixture, and support plates.
In this research, targets are cut into blocks with 10 × 10 cm2 dimensions, and they are put between the support plates that are clamped by screws around plates inside the fixture. The impactor used for the test is given in Figure 4(b). The impactor assembly has a mass of 5.9 kg with a flat-end striker. The impact test machine has an accelerometer located on the impactor, and it measures the acceleration of the impactor from the beginning of the release of the latch mechanism, that is, free falling of the impactor, until the end of the impact event. The output is the time history of acceleration of the impactor.
According to the fundamentals of physics, 17 the initiation time of impact event during free falling of the impactor is calculated from the following equation:
In equation (2), t is the time during the impactor drop, g is acceleration due to gravity, and h is the impactor drop height. Accordingly, drop-weight impact test machine approximates the initial contact time of the impactor with the target, and it filters the initial response of acceleration. In the next step, the data are smoothed and curve-fitted by machine.
Yarn pullout from the clamps is one of the major problems occurring through the experiments. The reason is that the impactor is too heavy. Different methods are performed to avoid this problem. One of the methods applied is the use of a file to make a rough surface finish around the fabric for strict clamping of the target (Figure 5).
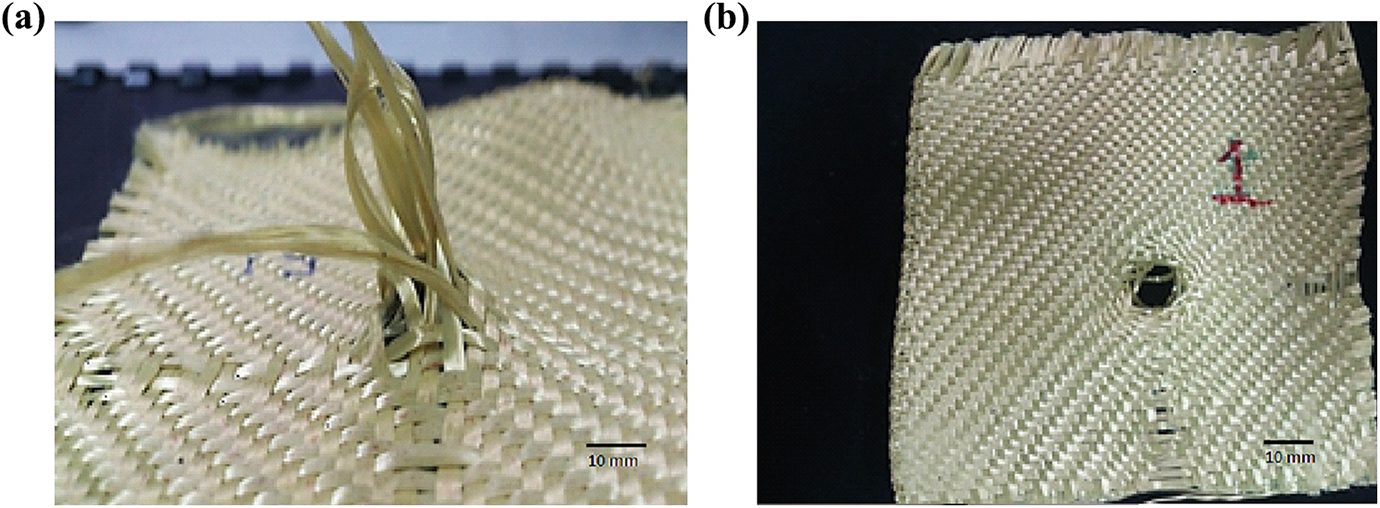
Yarn pullout through the clamps under drop-weight impact due to improper clamping in the (a) front side (b) back side of the fabric.
This is not so much helpful. Another method applied is the fastening of yarns with stitches inside the clamp, but this method fails too (Figure 6). Other procedure used to stop yarn pullout is to apply various adhesives, but they are not supportive.
Yarn pullout of the fabric stitched to the clamps under drop-weight impact.
The final solution for suitable clamping is to apply resin epoxy. A resin epoxy with proper proportionality of hardener is applied carefully around the fabric as it prevents the flow of the resin inside the impact region (Figure 17), and no yarn pullout occurs through the impact event, and the impactor penetration results in yarn breakage.
Numerical simulation
In this study, Ansys software is used to model and mesh yarns, fabric, and the impactor. For analyzing purposes, LS-DYNA software is used to simulate the impact event.
In this research, fabric yarns are modeled explicitly, and inter-yarn friction, impactor–yarn interaction, and impactor penetration through warp/fill tows are considered in the modeling procedure. The fabric experimentally tested in this research is a twill-woven fabric. Plain weave is a base style. Thus, the fabric is initially modeled in plain style, and then twill weave is created from the base style. 18
In this research, fabric yarns and the impactor are modeled with shell 163 elements for lower time processing purposes in Ansys software. A yarn level of resolution is used in this model. Each yarn in contact with other yarns takes elliptically shaped cross-section throughout the fabric. To model the curved shape of the yarn cross-section, six elements are used across the yarn width as mentioned by Nilakantan et al. 19 Shell elements have nonuniform nodal thicknesses as given in Figure 7.
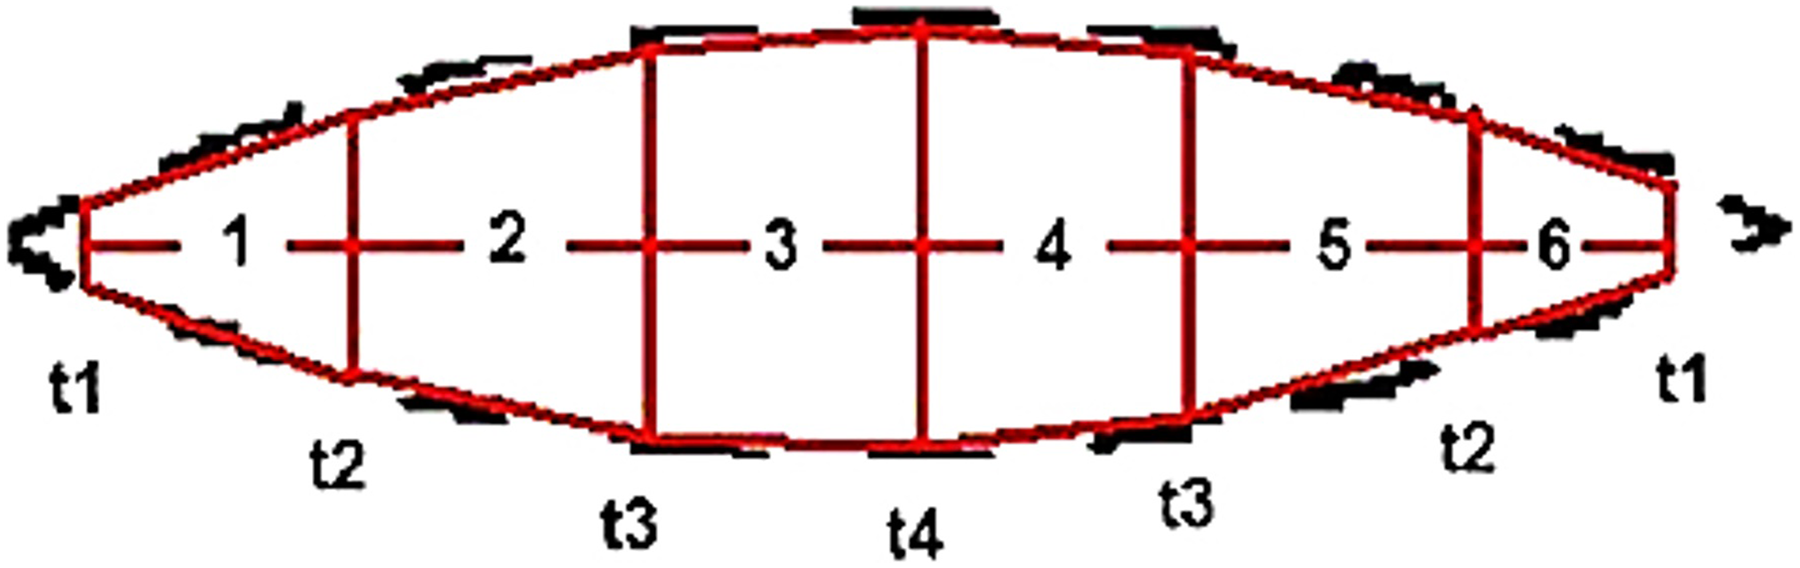
Yarn cross section using shell element with non-uniform nodal thicknesses. 19
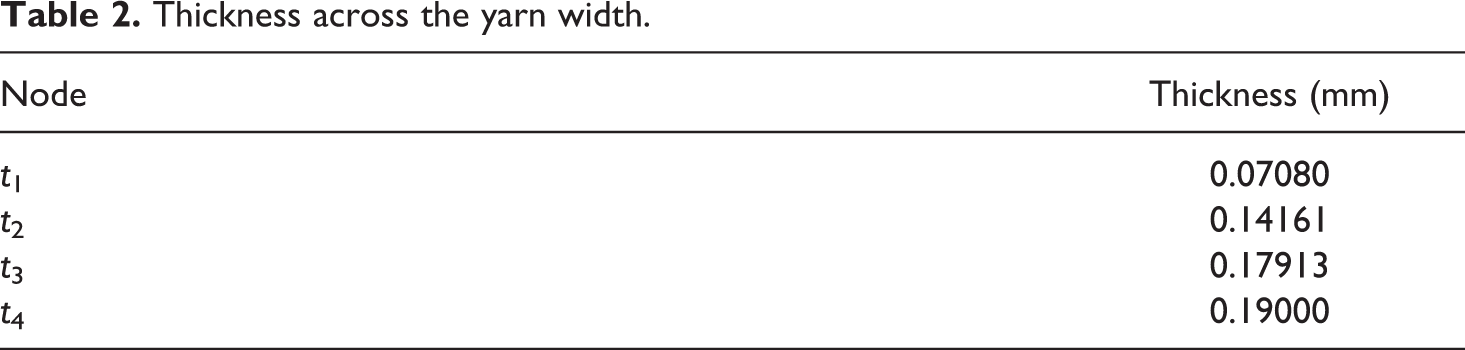
The thickness across the yarn width is given in Table 2.
Thickness across the yarn width.
The tows in fabric are undulated, and they take sinusoidal form, so the curve modeling of yarn undulation for plain-weave fabric may be as follows 20 :

In the above equation, t is thickness of the yarn along Y direction, s is yarn span, and the yarn length is along z direction (Figure 8).
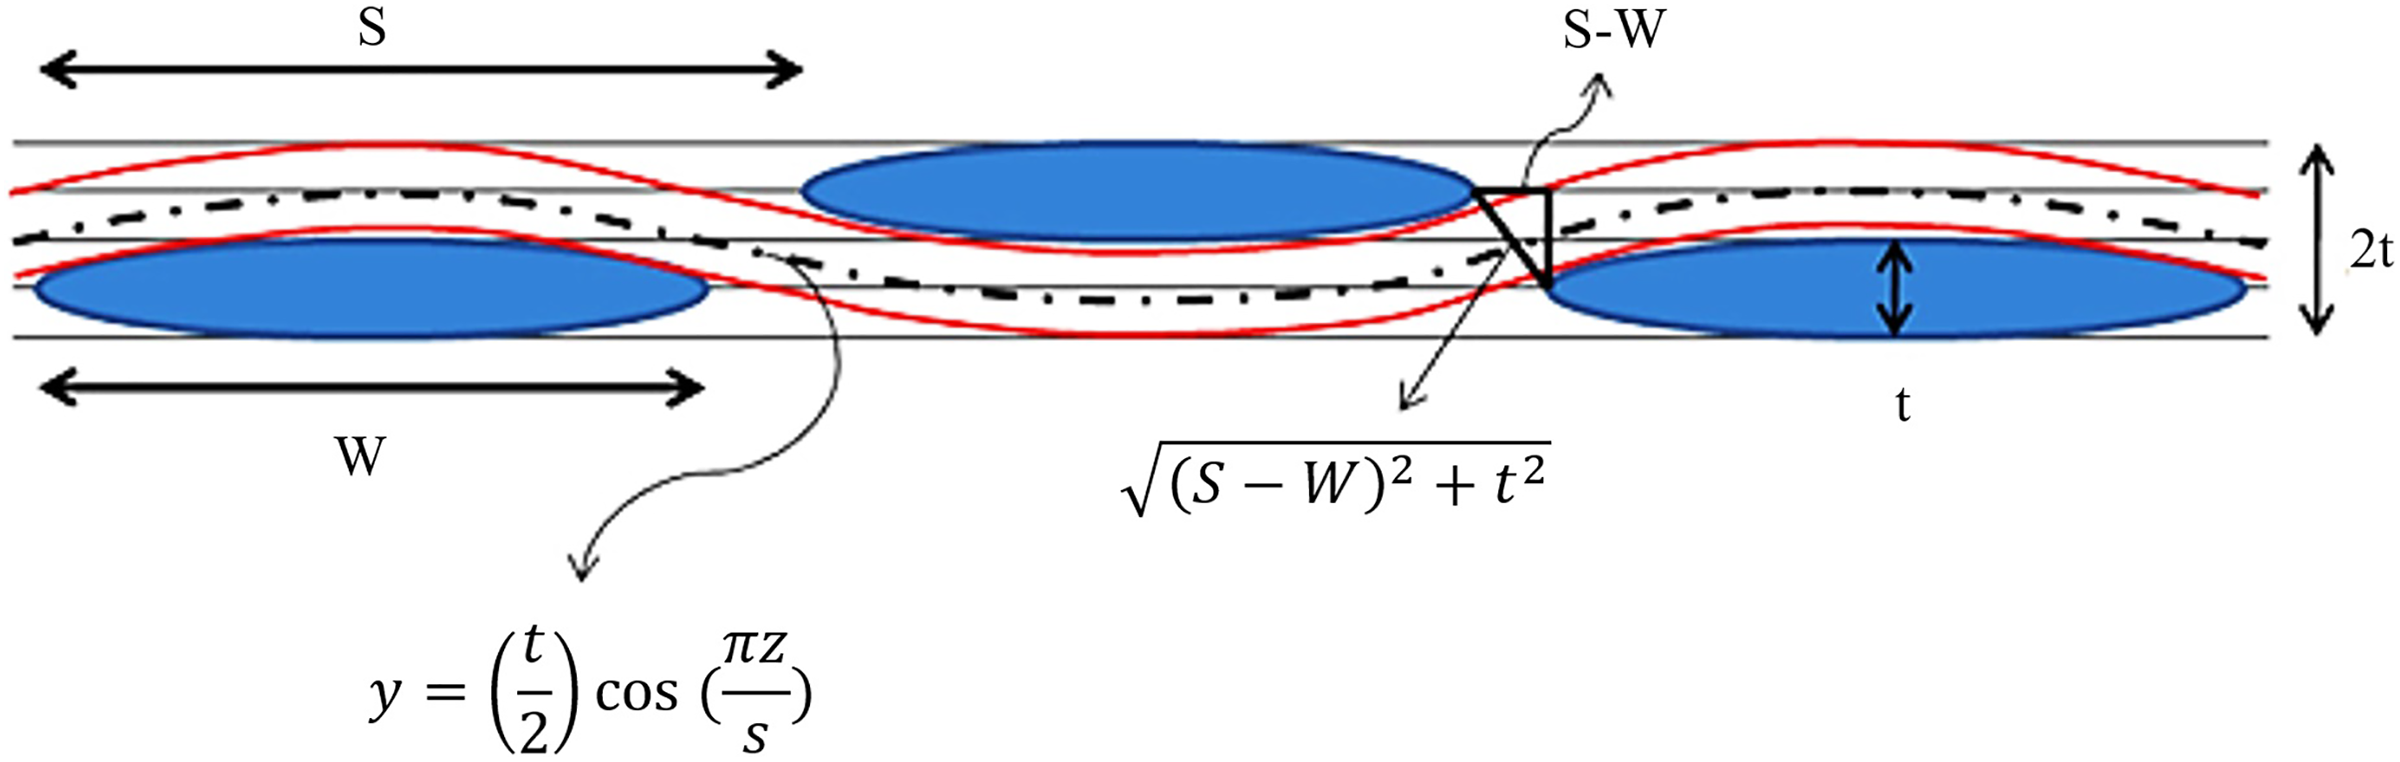
Yarn schematic geometry. 20
The number of elements should be chosen very carefully so that the undulation is maintained with no sharp step creation along the elements. Twill-weave fabric yarns are composed of undulating and straight parts. To simplify the modeling, equation (3) is used for modeling sinusoidal part, so the repetitive unit cell of the twill-weave fabric is generated according to Figure 9. Numerical analysis of single-ply fabric is performed with 92,628 elements.
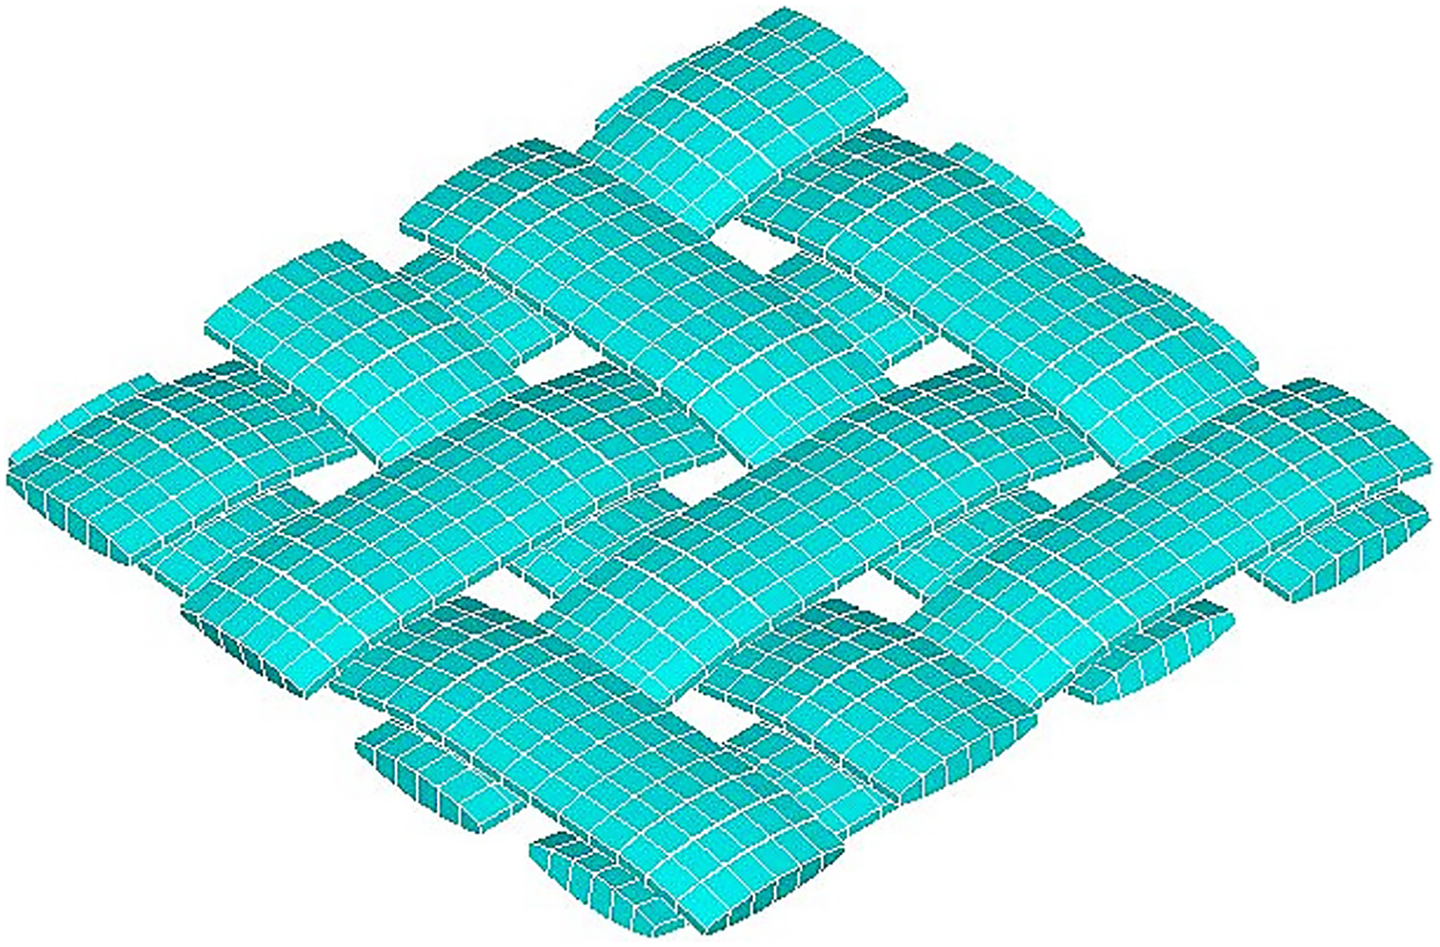
Repetitive unit cell of twill-weave fabric.
The drop-weight impact test for the fabric is performed by clamping support plates. As mentioned before, the plates support a cylindrically shaped target with a diameter of 15 cm and a hole centered inside with a diameter of 8 cm. In other words, just the circular region of the fabric with 8 cm diameter is exposed to the impact event. To perform the similar numerical analysis, the outside of the circular boundary condition with 8 cm diameter is clamped as shown in Figure 10(a).
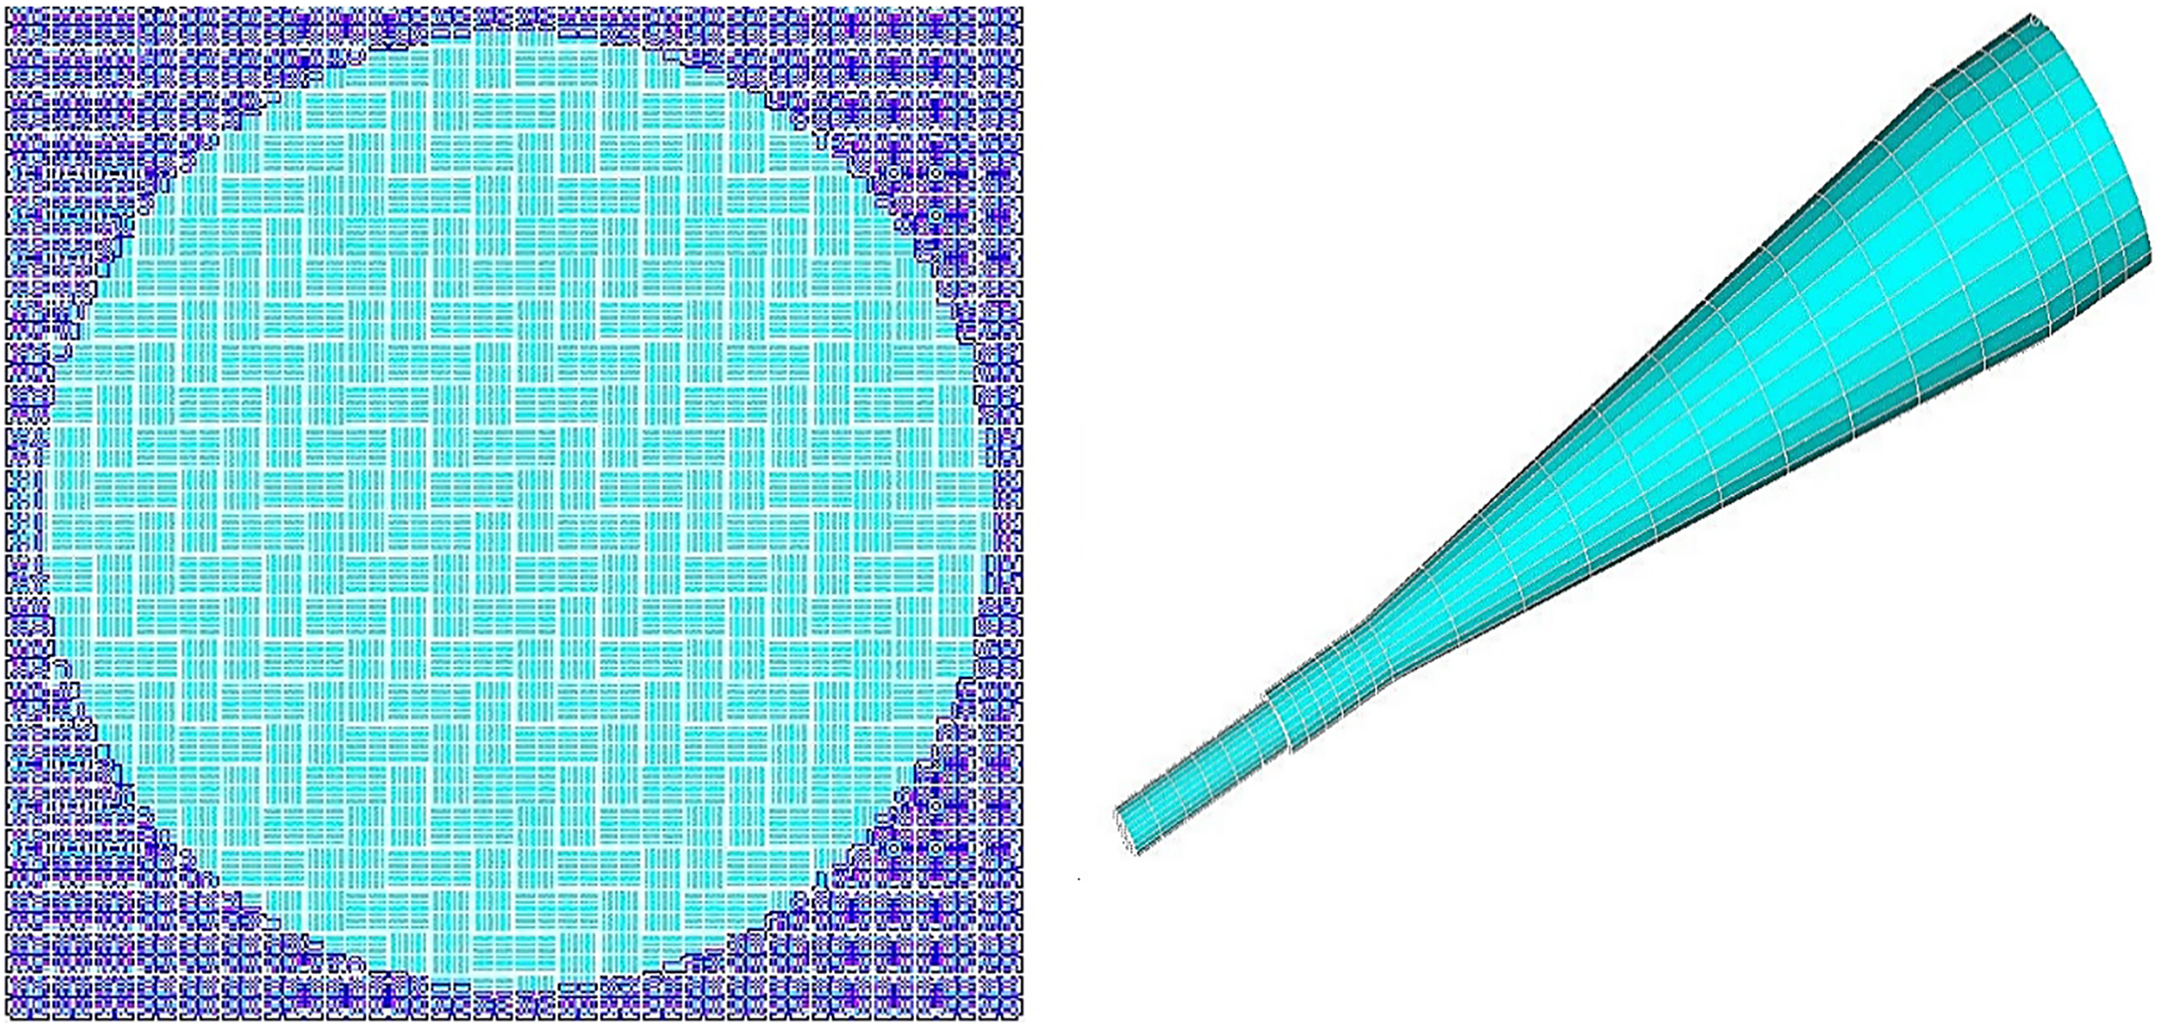
Model of (a) fabric with circularly clamped boundary condition (b) impactor.
The mechanical properties of the yarn is according to the reported values by Nilakantan et al. 21
The impactor used in experiments is made up of two parts: a striker and crosshead-mounted impactor. The striker is made up of three geometrical shapes as shown in Figure 10(b): a cylindrical tip with diameter of 8 mm and length of 30 mm, cylindrical extension with diameter of 10 mm and length of 20 mm, and finally, partial conic tail with the base diameter of 40 mm. The crosshead has a mass of 5.2 kg, and it is simulated as a cylindrical mass with a rectified density to maintain 5.2 kg mass. This crosshead geometry has no effect on impact event results, and just the mass should be accounted to maintain the initial kinetic energy. The striker has the mass of 0.7 kg, so the total mass of the weight is 5.9 kg. The element used in the impactor modeling is shell element.
The impact event consists of free falling of the weight with gravitational acceleration. This phenomenon is simplified as a weight with initial impact velocity in the model. The impact velocity is calculated according to the principle of energy conservation. Before fall, the impactor has potential energy (equation (4)). After falling of the impactor and getting contact with the target, the potential energy is converted to kinetic energy (equation (5)). The impact velocity of the impactor (equation (6)) is obtained from the equality of equations (4) and (5).


In the above equations, m is the mass of the impactor, h is free falling height, U is the potential energy, v is the impactor velocity, and K is the kinetic energy. 17 For each test, to simulate the impact event, the impactor height is measured, and then from equation (6), the impact velocity is calculated and introduced in LS-DYNA.
In this research, the impactor and Kevlar target models are according to Khodadadi et al. 16 They considered that Kevlar has a linear stress–strain behavior.
The contacts used in yarn-level interaction and impactor–fabric interaction for single-ply twill-weave fabrics are both CASS and CAG, that is, Contact_Automatic_Surface_To_Surface and Contact_Automatic_General, algorithms, otherwise the initial penetration of elements is inevitable. For multiple-ply twill-weave fabrics, CAG contact algorithm is used for yarn-level interaction, fabric plies, and impactor–fabric interaction. For shell elements with CASS contact algorithm, badly shaped elements make the solution unstable, so CAG contact algorithm along with CONTROL-CONTACT best suits for multiple-ply fabric modeling. Using CONTROL-CONTACT, contact stiffness parameters can be increased, and it results in premature failure of elements under the projectile, while the stress quickly reaches the ultimate strength. The yarn-level and projectile-fabric contact are introduced by defining coefficient of friction obtained from the current experimental data for both dry and silicon-coated fabrics.
Results and discussion
The coefficient of friction obtained for dry fabric according to the experiments given by Dong and Sun 2 is 0.228.
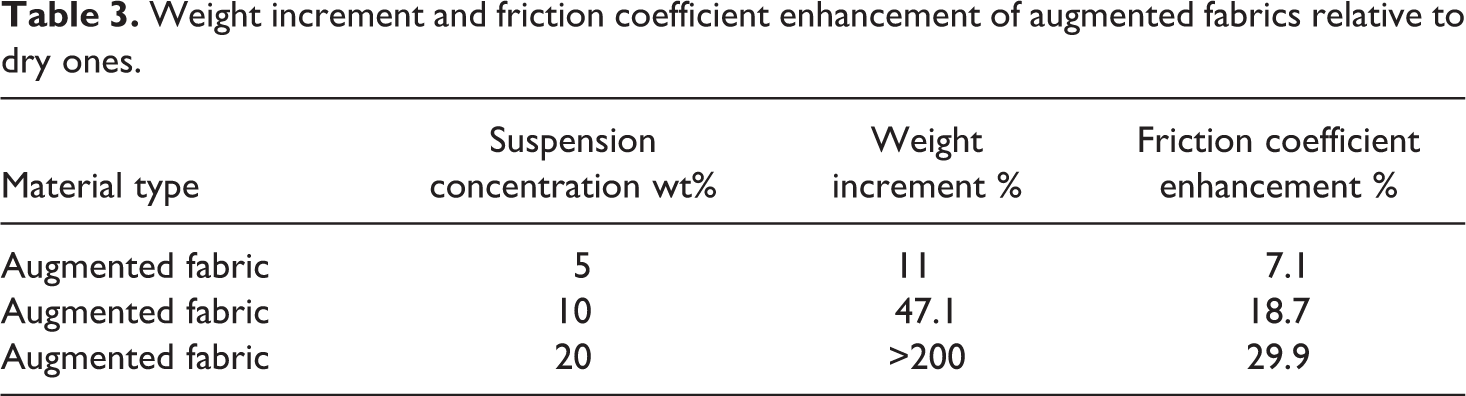
The weight increment and coefficient of friction enhancement due to augmentation of yarns are given in Table 3.
Weight increment and friction coefficient enhancement of augmented fabrics relative to dry ones.
Numerical results of single-ply dry and coated fabric at 30 J impact energy.
Due to the reasonable relation between friction coefficient enhancement and weight increment in 10% augmented fabric, the fabrics suit this level of augmentation concentration. Despite the low-weight increment for 5% concentration coating of fabric, the friction coefficient is low, and it is not suitable for the fabric coating. On the other hand, 20% concentration coating of fabric increases its weight about 210%, and it is not suitable for low-weight armors.
Impact test on dry fabrics
For the experimental impact test, single-, two-, and four-ply fabrics are used with three samples from each. An extra three-ply sample for making comparison with four-ply fabric is tested.
Three samples of single-ply fabrics are tested with drop-weight impact machine, and the acceleration data are recorded. One of the samples experienced yarn pullout with unusual acceleration data, so the tests including samples no yarn pullout or just yarn breakage at the impact region were accepted as the right impact test.
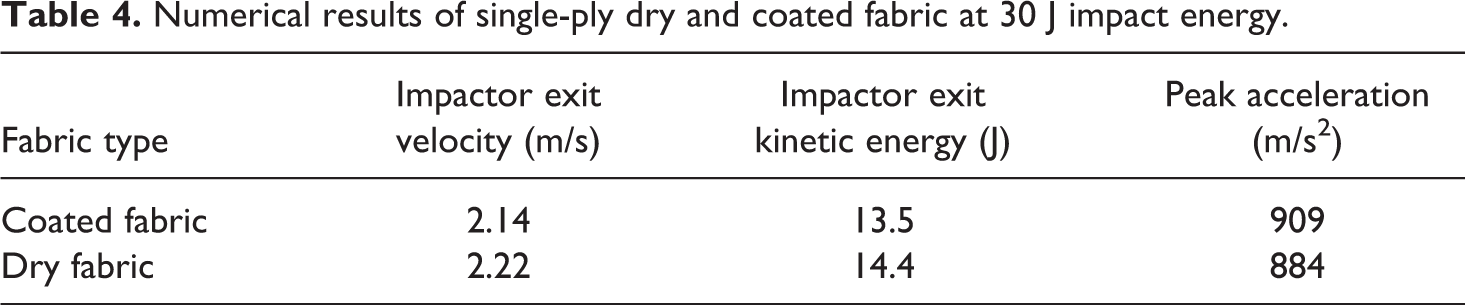
Figure 11 displays the time history diagram of force for two samples of single-ply dry fabrics with 30 J initial kinetic energy of the impactor. The diagram of the third sample is not displayed here due to yarn pullout of the fabric. As mentioned before, the accelerometer on the impactor measures the time history of acceleration for drop-weight impactor, and the force exerted by is calculated from Newton’s second law:
Time history diagram of force for two samples of single-ply dry fabrics at 30 J impact energy.

In the above equation, M is the mass of the impactor, a is the measured acceleration, and F is the force exerted by impactor. 17
Figure 11 shows that the time history diagram of force for similar targets is in agreement with one another. The impact event includes loading condition from 0 to 6 kN and unloading condition from peak force to zero within 4 ms. This long period of the impact event is due to flexibility of the fabric target, and the test results in perforation of dry fabrics.
In addition to the impactor drop height, the time during the impactor drop depends on some other parameters. One of the parameters is time delay in latch mechanism release. This mechanism is pneumatic, and it may differ infinitesimally in the time that it releases the piston and consequently the crosshead. In addition, the crosshead is mounted on two guide rails, and the friction between rails and crosshead bearings may raise the time of free falling condition. Therefore, time during the impactor drop may differ for two similar drop heights. To achieve better comparison of the results, toe compensation of the data is required. In other words, the initial time of impact is equalized for all tests, and the lowest time of start of impact is set as the base data for all tests; Therefore, time during the impact condition, that is, final time of impact event subtracted from the initial time, is the main parameter to be compared with neglect of the start time of the impact event.
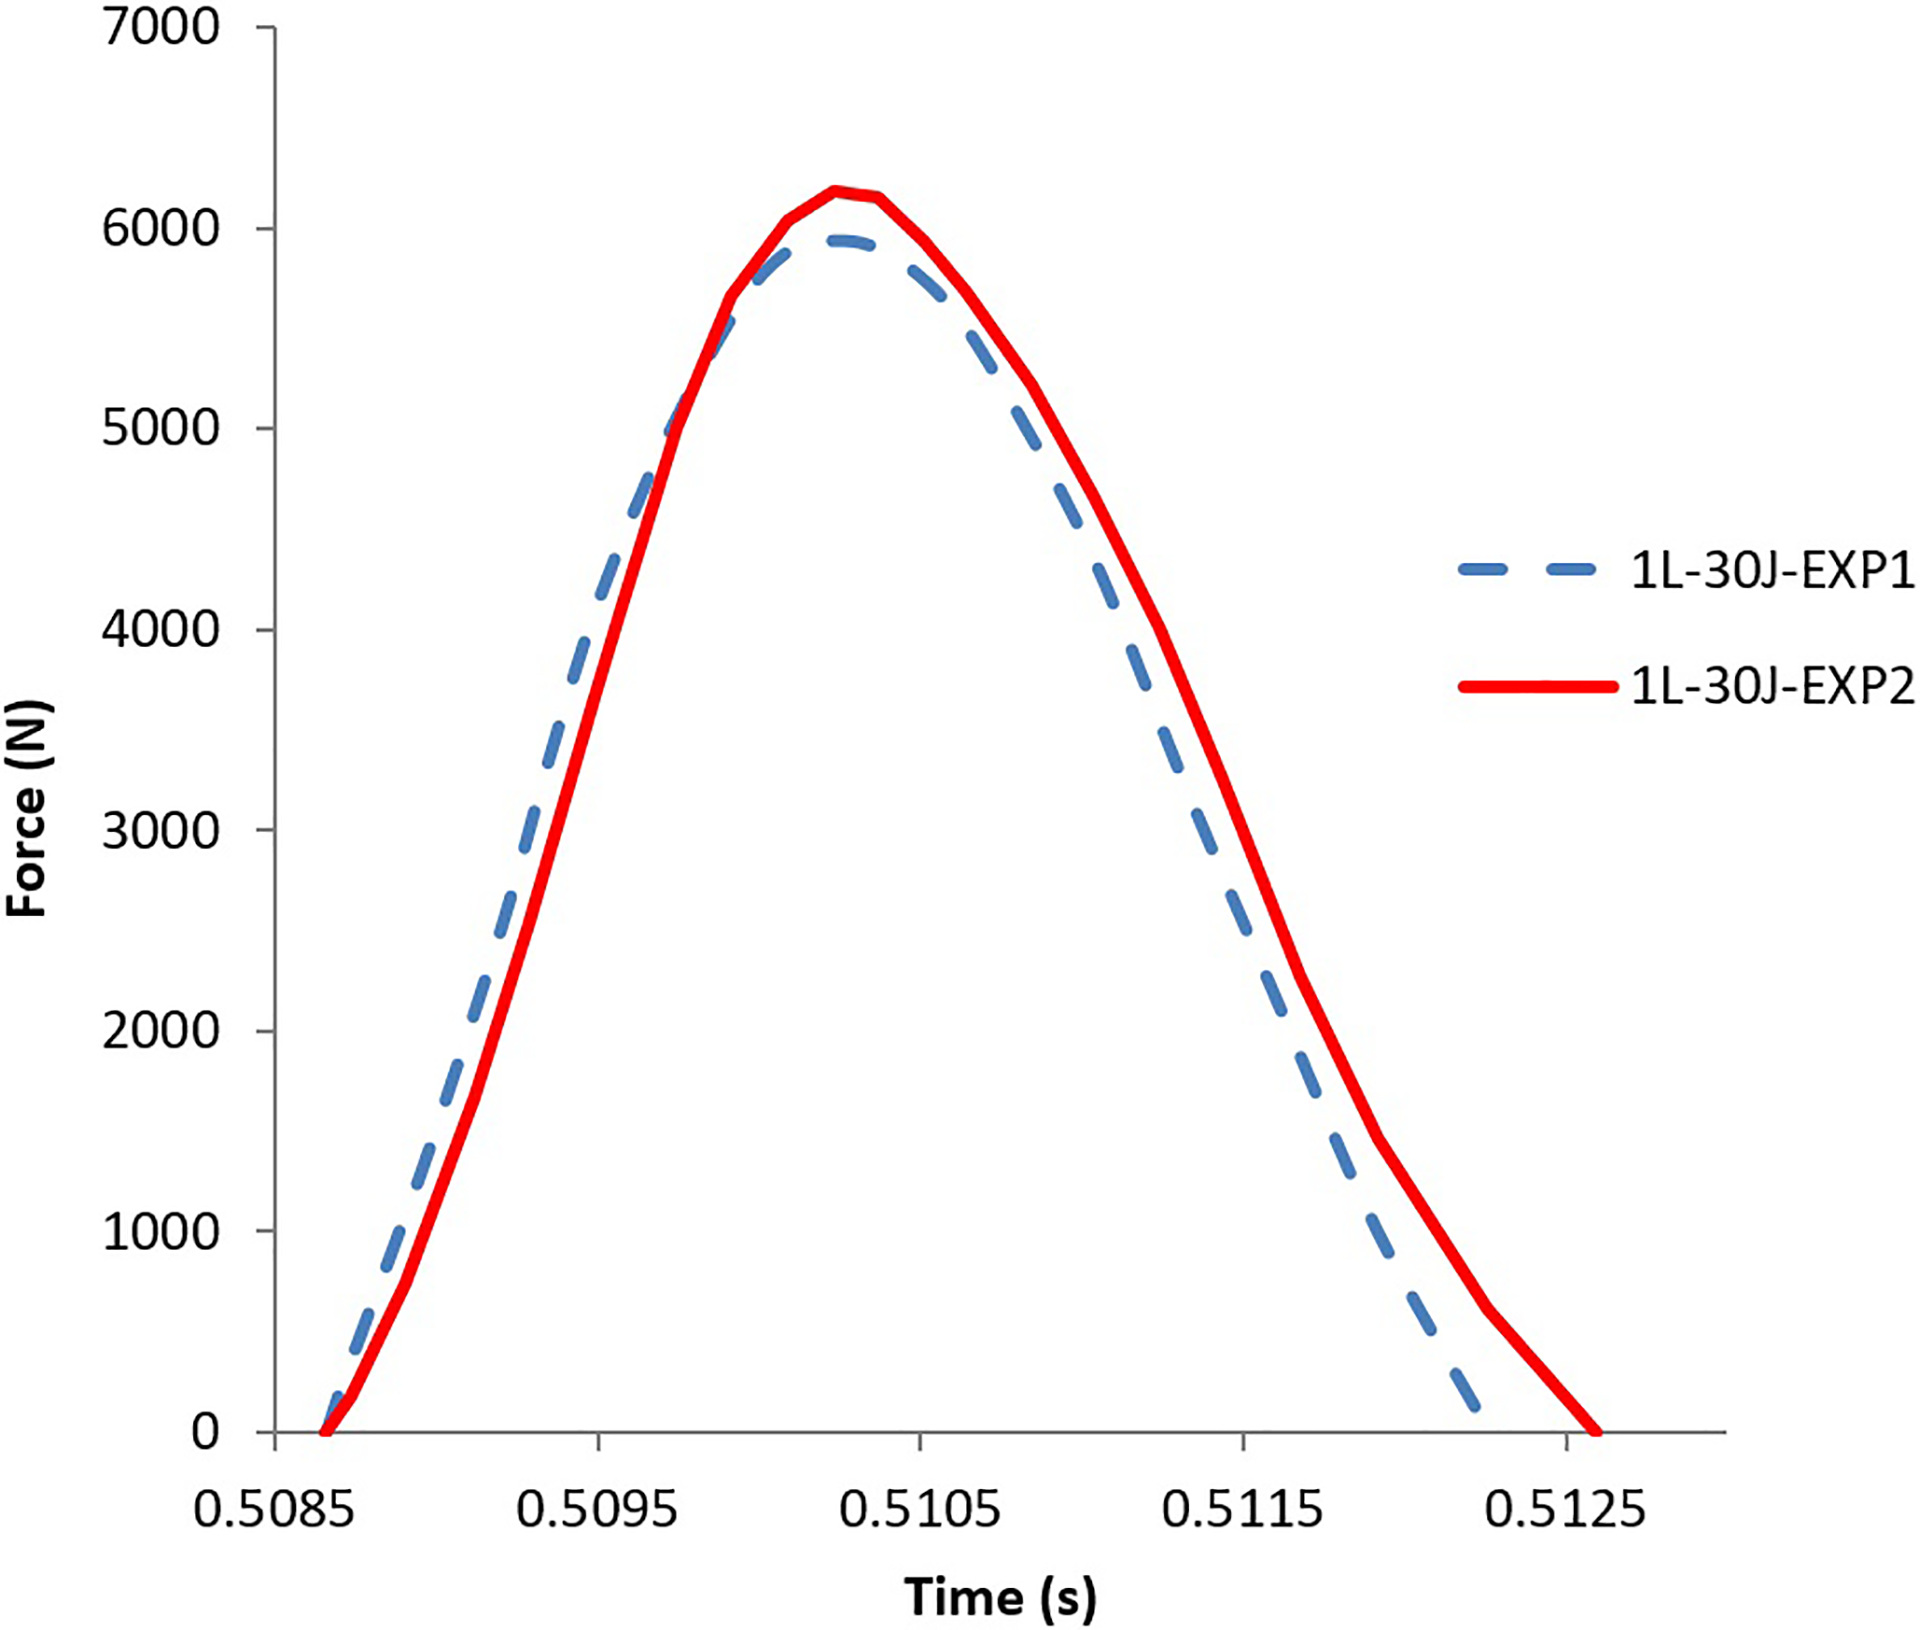
Figure 12 displays the time history diagram of force for three samples of two-ply dry fabric targets at 30 J, 40 J, and 70 J impact conditions. Unlike the single-ply fabric, the two-ply fabric is not perforated at 30 J impact energy, and no yarn breakage is visible after the impact event. The 40-J impact energy breaks upper yarns of the fabric with no perforation occurrence. Finally, the impact energy of 70 J perforates both layers of the fabric.
Time history diagram of force for two-ply dry fabrics.
As given in Figure 12, for 30-J impact energy, the fabric stops the impactor with 3800 N force exerted on, while for the 40-J impact energy, the fabric exerts 4500 N force on the projectile, and the curve peak data shifts left. The increase in the impact energy to 70 J makes perforation in the fabric target with similar peak force duration compared with 40 J impact energy. A similar trend is shown in the time history diagram of force for 40 J and 70 J impact energies, and the fact that the 40-J impact energy breaks some of the upper yarns of the fabric reveals that the threshold impact energy is 40 J for the two-ply dry fabric. Thus, by increasing the impact force energy over 40 J, it makes no change in the peak force duration exerted by the fabric.
As it is shown in Figures 11 and 12, the peak force obtained for 30 J impact energy in single- and two-ply dry fabrics equal to 6000 N and 3800 N, respectively. This decrease in force value with respect to increase in the number of plies is due to greater damping behavior of the two-ply fabric. As damping rises, the loss of impact energy increases, and the impact performance of the fabric is improved. It is concluded that increase in the number of plies of the fabric will better protect against damage.
As shown in Figure 12, the initial trend of the curve is ascending to some extent, then the curve becomes horizontal, and finally it starts to ascend again. This is because of the resistance of two layers of the fabric one after another during the impact event. Initially, the upper layer of the fabric resists against the impactor, and it stretches through the impact event. The resistance is apparent as the force increases in the curve. In the second stage, while stretching, the first layer comes in contact with the second layer, and the second layers gets involved in resisting against the impactor energy. Due to flexibility of the Kevlar fabric, the second layer does not resist immediately after contact. This layer stretches to some extent, and then it gets involved in resisting against the impactor.
The stage between the first and the second layer in which the layers resist includes sliding of layers on each other. While the impactor pushes the first layer along the impact direction, the second layer contacts with the first layer so they slide on each other until they become interlocked, and then they resist together against the impact. The stage in which sliding occurs explains the horizontal trend of the force history curve. As impact energy increases, the sliding duration of layers decreases, and the interlocking occurs quickly, so the horizontal trend of the curve shortens quickly. Furthermore, while the impact energy increases from 30 J to 40 J, the interlocking of the two layers occurs quickly, and the peak force duration shifts to the left in the diagram.
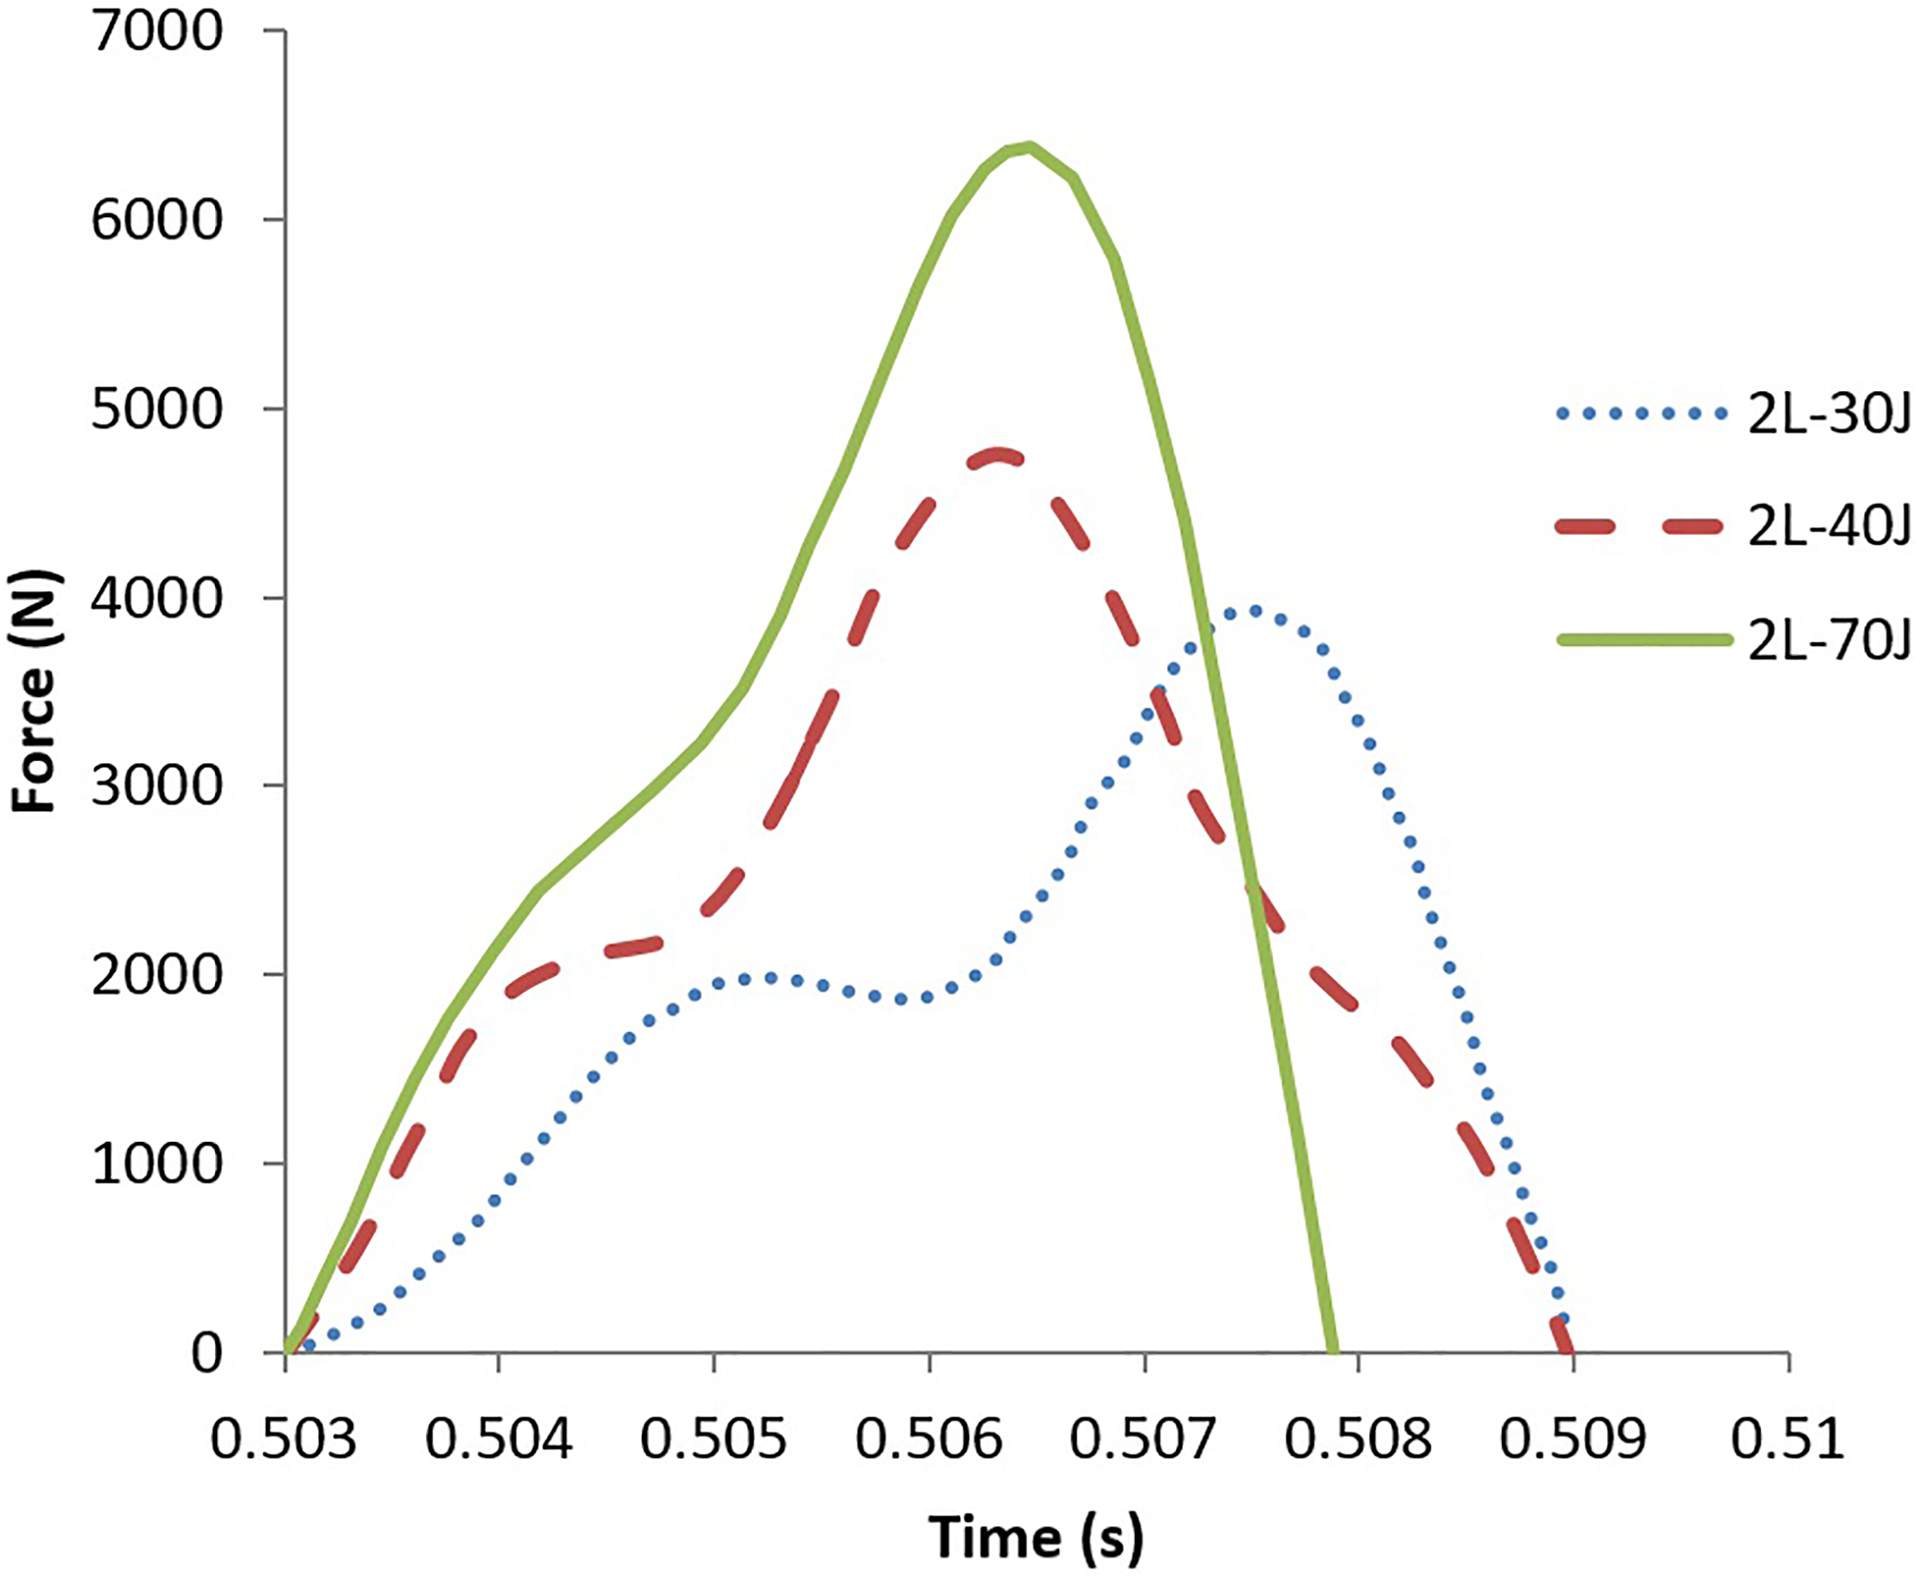
In four-ply dry fabric samples, a sample is tested at 100 J impact energy with no perforation occurrence. Two other samples are tested against the 140-J impact energy. Figure 13 displays the time history of force for two samples. Both targets are tested by an impact velocity of 6.89 m/s, that is, 140 J energy. In the first sample shown with dashed line, the impactor penetrates the fabric, but in the second sample shown with solid line, no penetration occurs. The time history of force for the two samples is similar, and the peak force is nearly the same. The only difference between the two diagrams is the time duration of the impact event. This time duration is larger for nonperforated sample than the other because the sample stretches much to resist against the impactor. Although no perforation occurs in the second sample, there are signs of yarn breakage at the impact region, and it can be mentioned that 140 J impact energy is the energy threshold to perforate four-ply dry fabric.
Time history diagram of force for two samples of four-ply dry fabrics at 140 J impact energy.
Impact test on coated fabrics
To perform the impact tests on coated fabrics, 15 fabric samples are prepared and coated with silicon. The samples include three single-ply fabrics, two double-ply fabrics, and two four-ply fabrics. Due to yarn pullout, resin epoxy adhesive is applied on all fabric edges as described before. Among the three samples of single-ply fabric, just one of the samples passed the impact test with no yarn pullout condition. Figure 14 displays the force history diagram of dry and coated single-ply fabrics. The impact energy exerted equals 30 J, and both targets are perforated. The coated fabric displays more time during the impact than the dry fabric. As shown in Figure 14, time during the impact for coated and dry fabric are 4.5 and 3.6 ms, respectively, and the peak forces exerted to coated and dry fabrics are 5335 N and 5933 N, respectively.
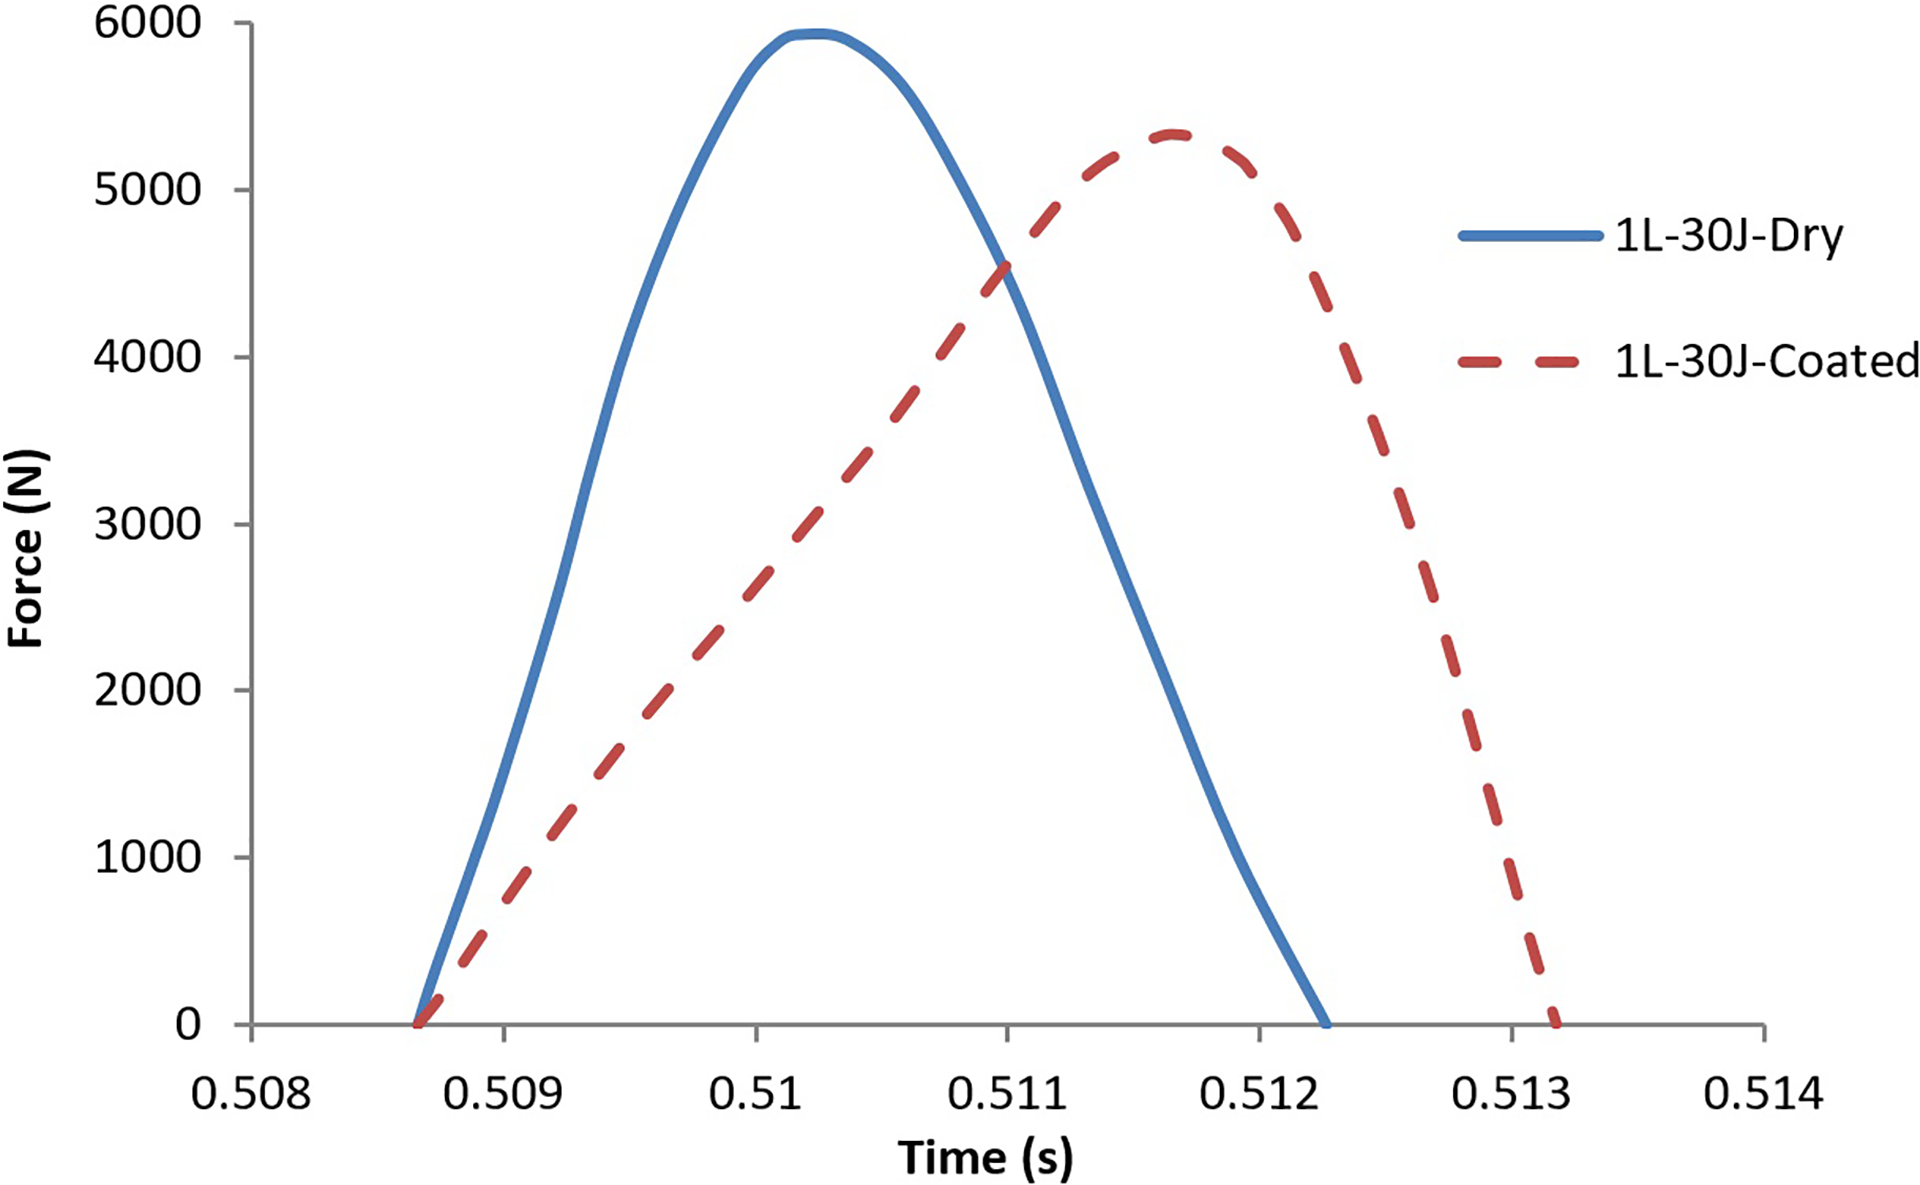
Comparison of force history diagram for dry and coated single-ply fabrics at 30 J impact energy.
In two-ply fabrics, yarn pullout results in windowing mode at 70 J impact energy. This phenomenon occurs due to partial yarn pullout, and consequently, the impactor passes through the yarns. Figure 15 displays the windowing phenomenon for two-ply silicon-coated fabric at 70 J impact energy. This phenomenon reduces the impact performance of the fabric.
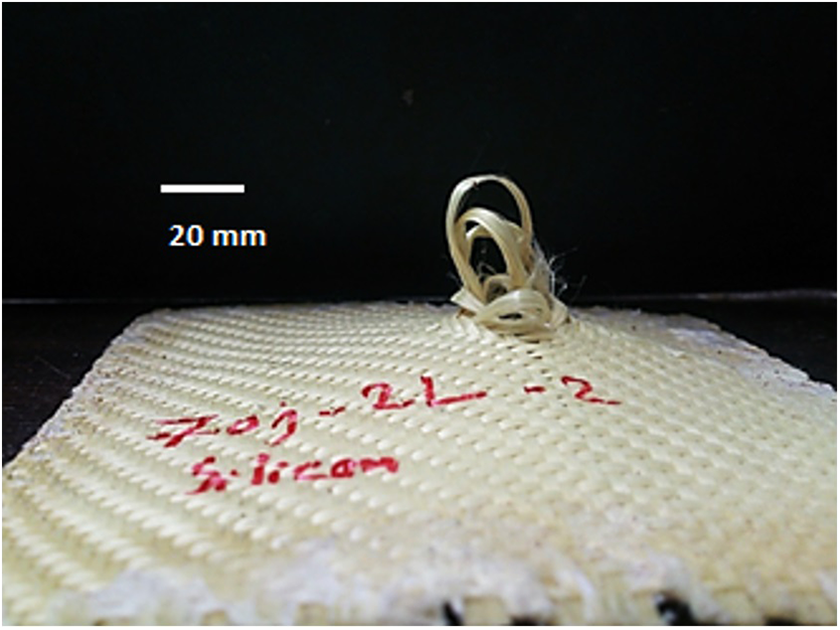
Windowing phenomenon for two-ply coated fabric at 70 J impact energy (back side).
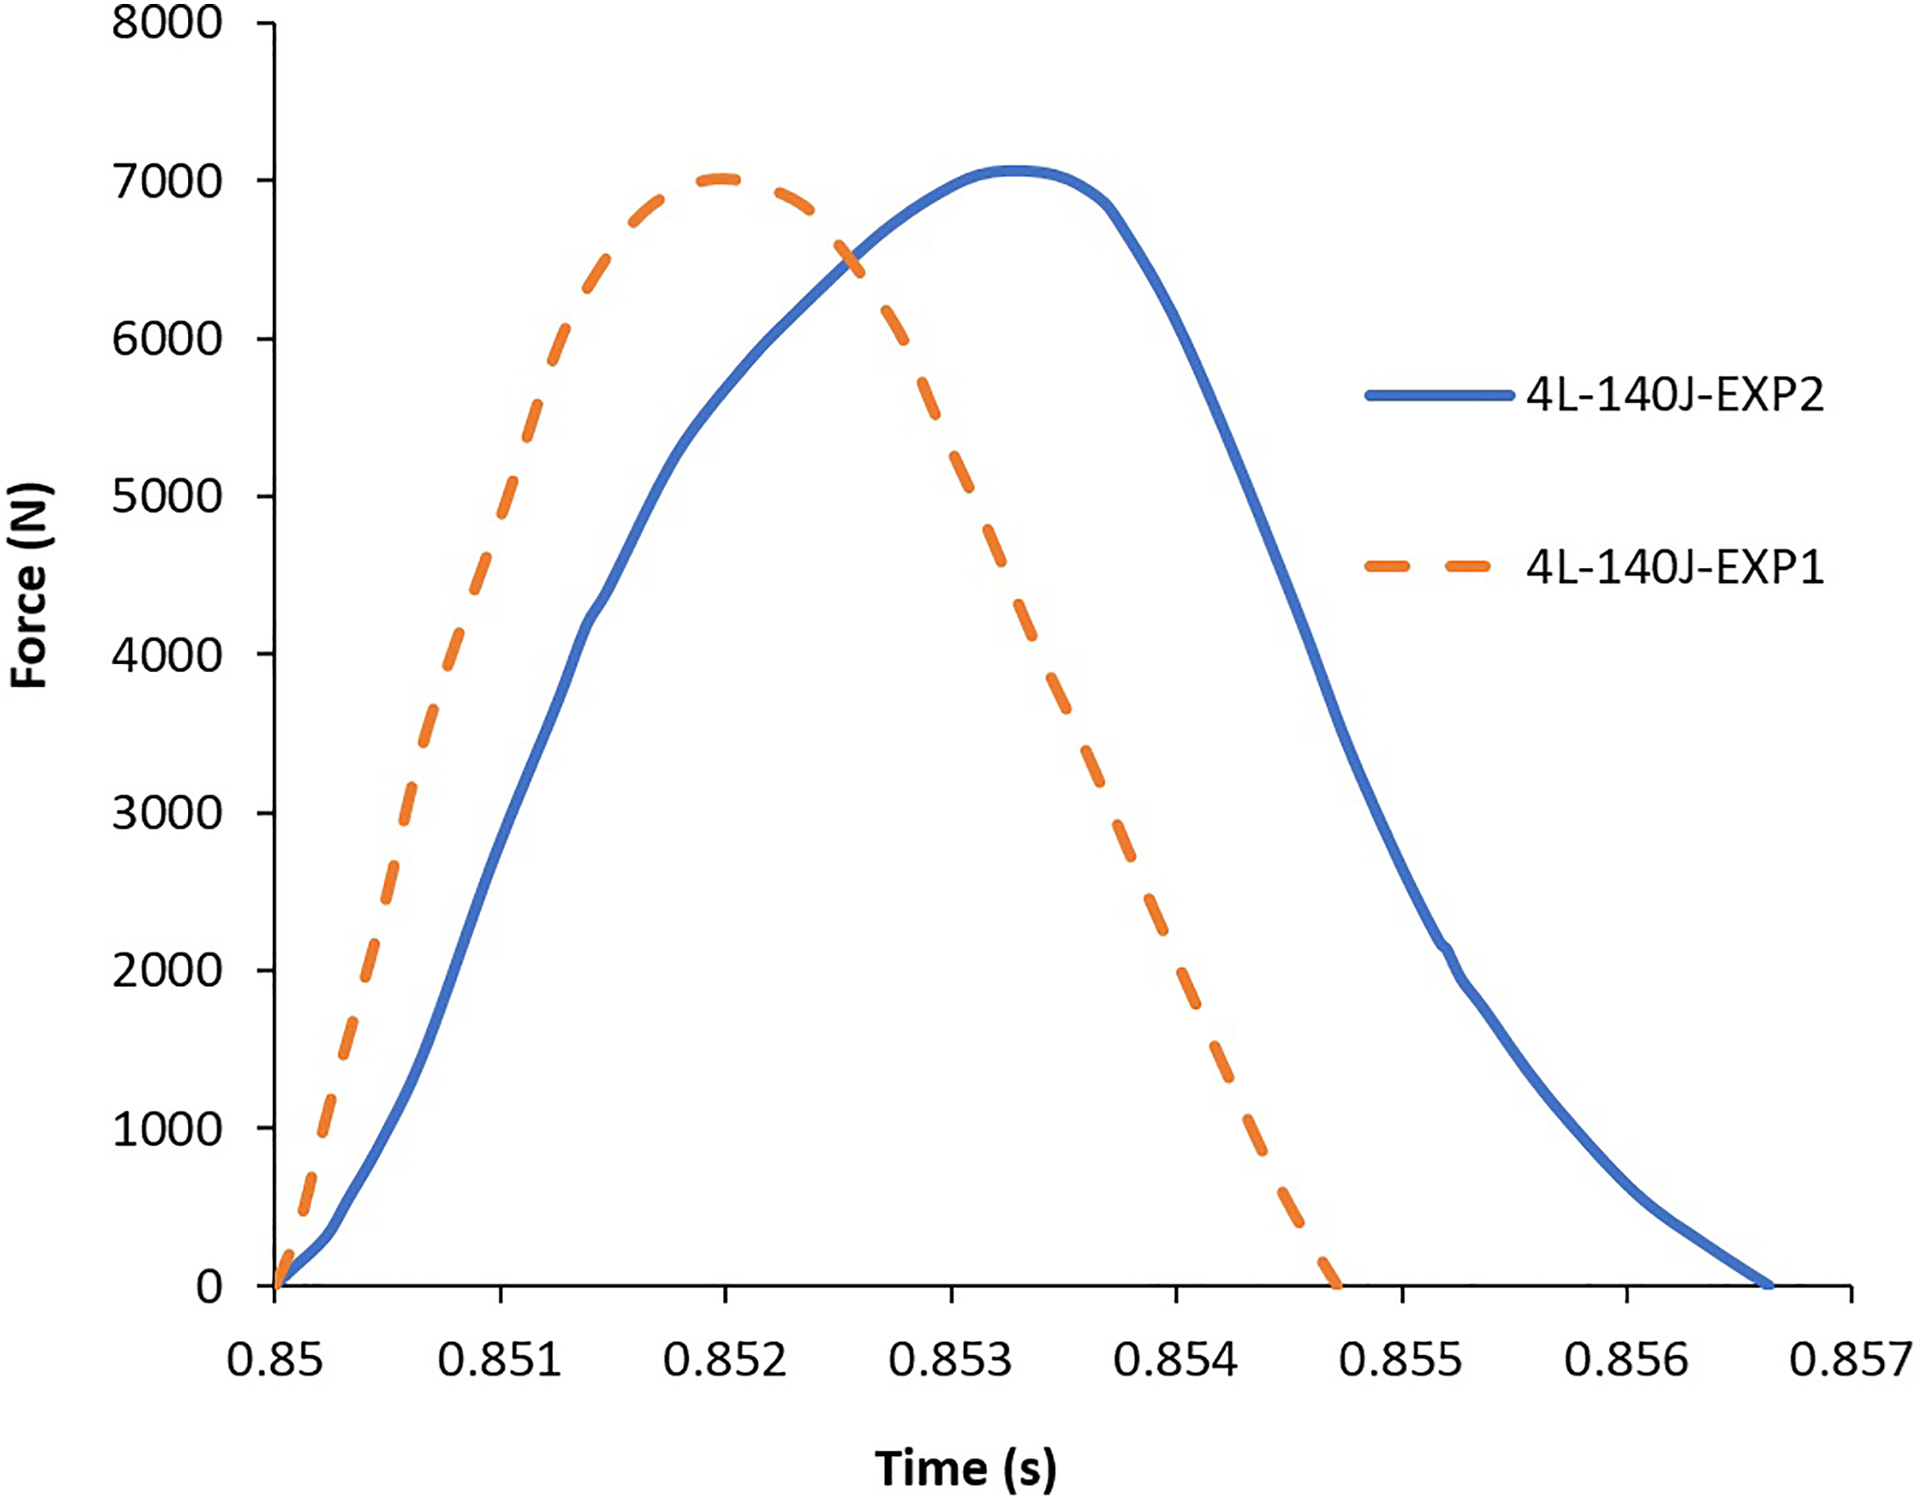
Among four-ply fabrics, windowing occurs in one of the two samples. Four-ply silicon-coated fabrics at 140 J impact energy are compared with dry fabrics. The coated fabric with no yarn pullout resists against the impactor and stops it. Figure 16 displays time history diagram of force for dry and coated four-ply fabrics. In both targets, the impactor is stopped with no perforation occurrence.
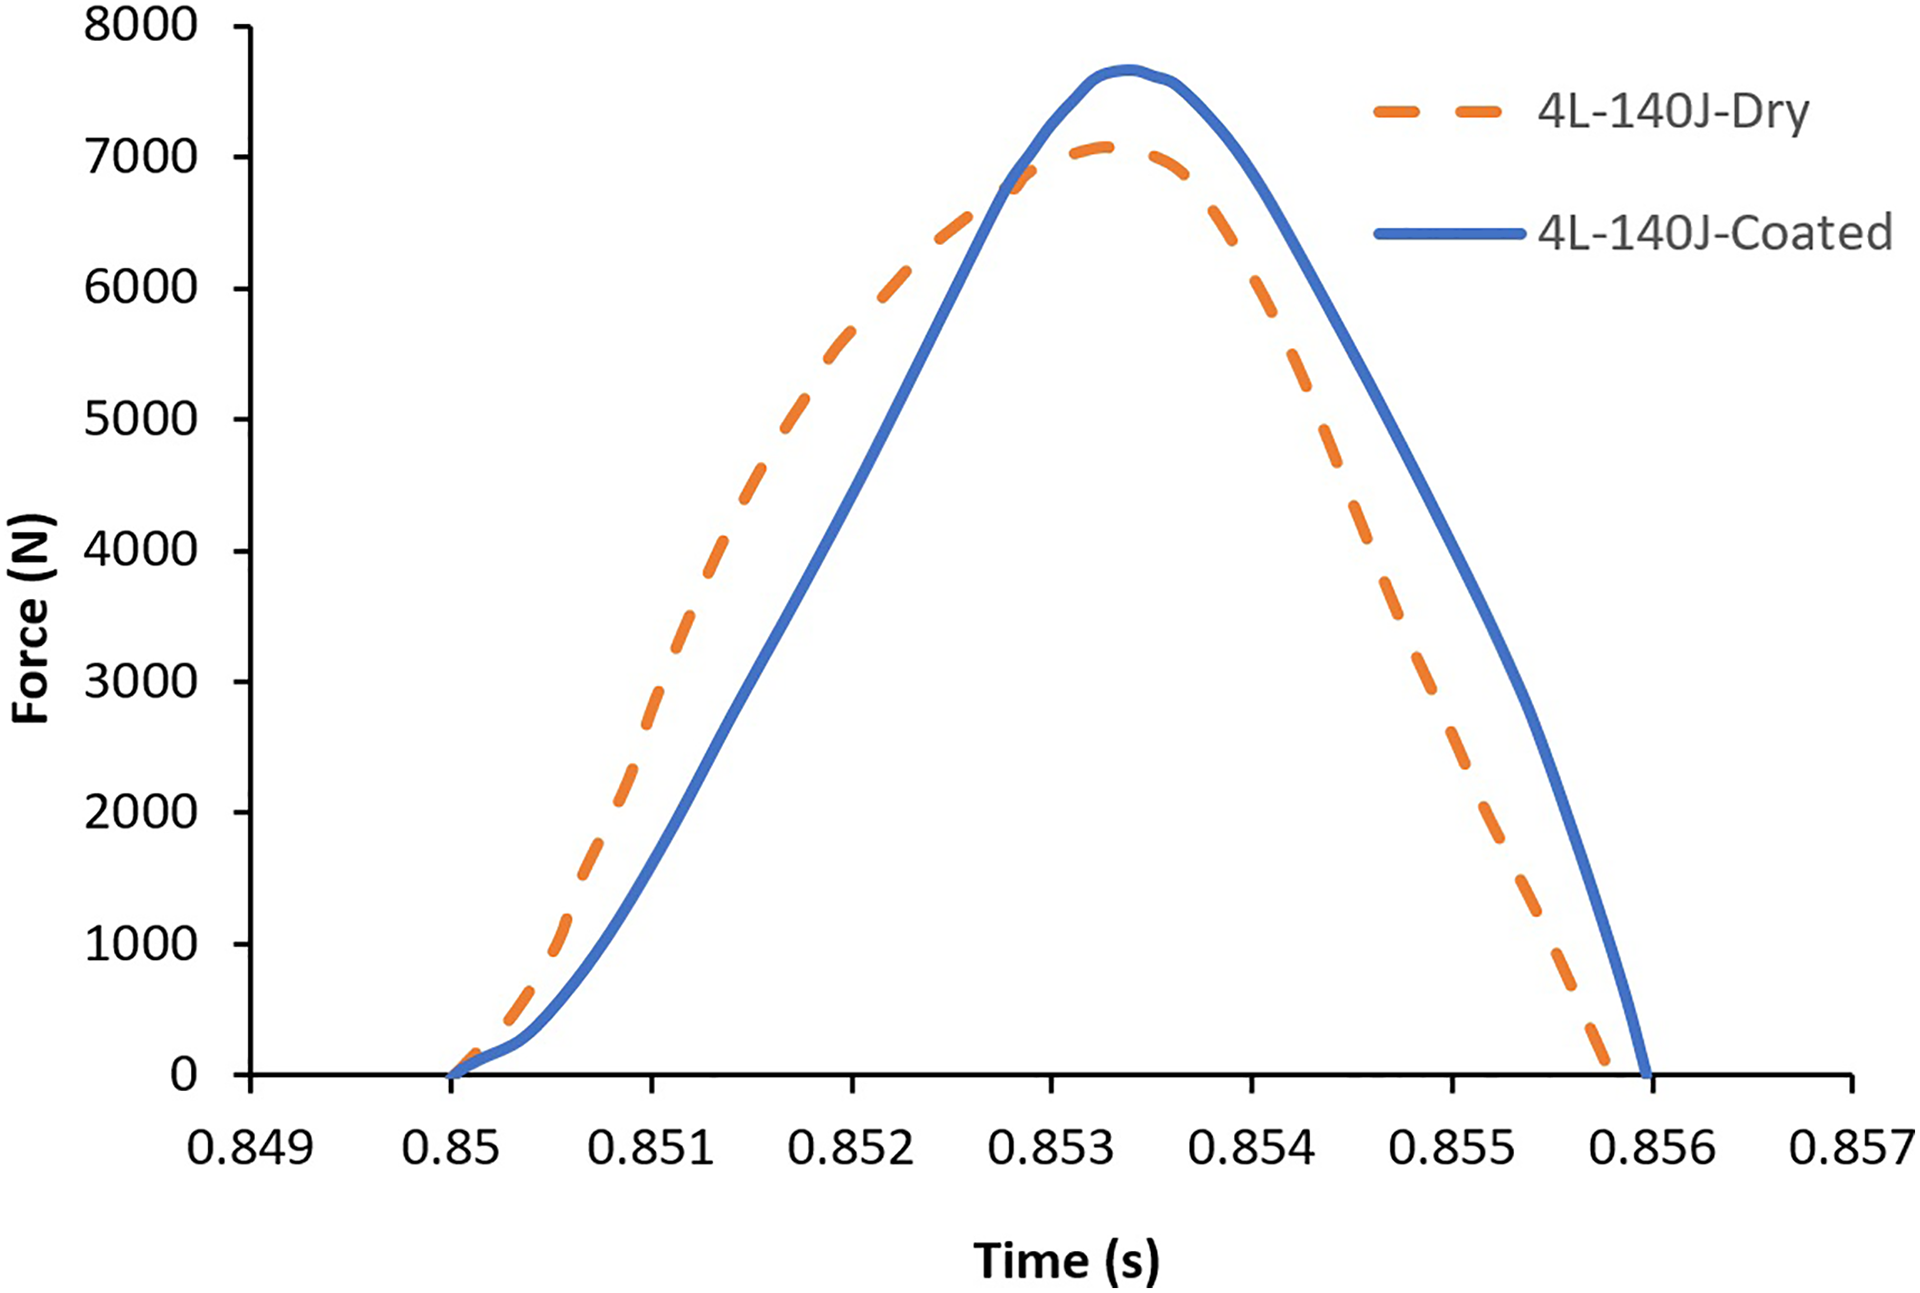
Comparison of force history diagram of dry and coated four-ply fabrics at 140 J impact energy.
According to Figure 16, the peak force history diagram of the coated fabric is higher than the dry one. Similar to single-ply fabric (Figure 14), the time history diagram of force for coated four-ply fabric has more gradual slope and more time duration of impact than the one for dry fabric.
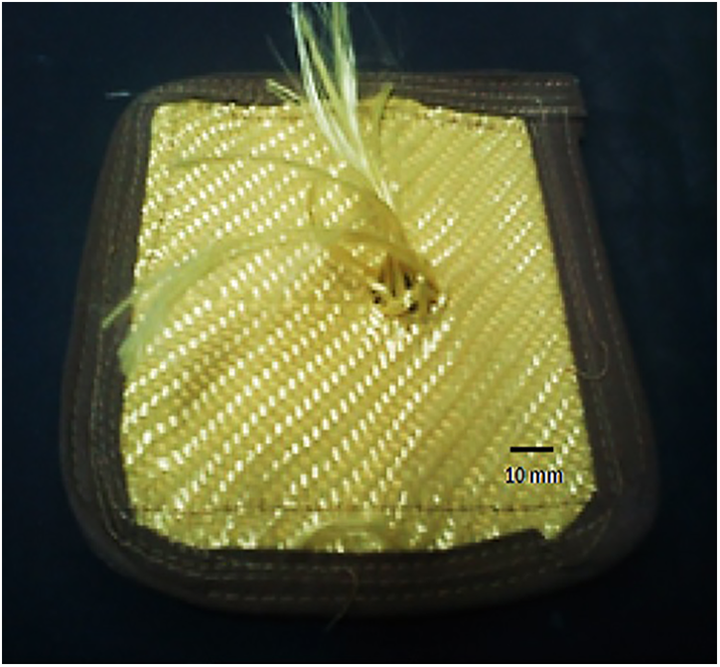
Figure 17 displays the final status of dry and coated four-ply fabric after the 140-J impact energy. Despite the fact that both dry and coated fabrics resist against impact energy, that is, no perforation occurrence, yarn crimp is visible in the mid-side of the edges of dry fabric, and yarn breakage happens at the impact point, but in the coated fabric, neither yarn breakage at the impact point nor yarn crimp take place.
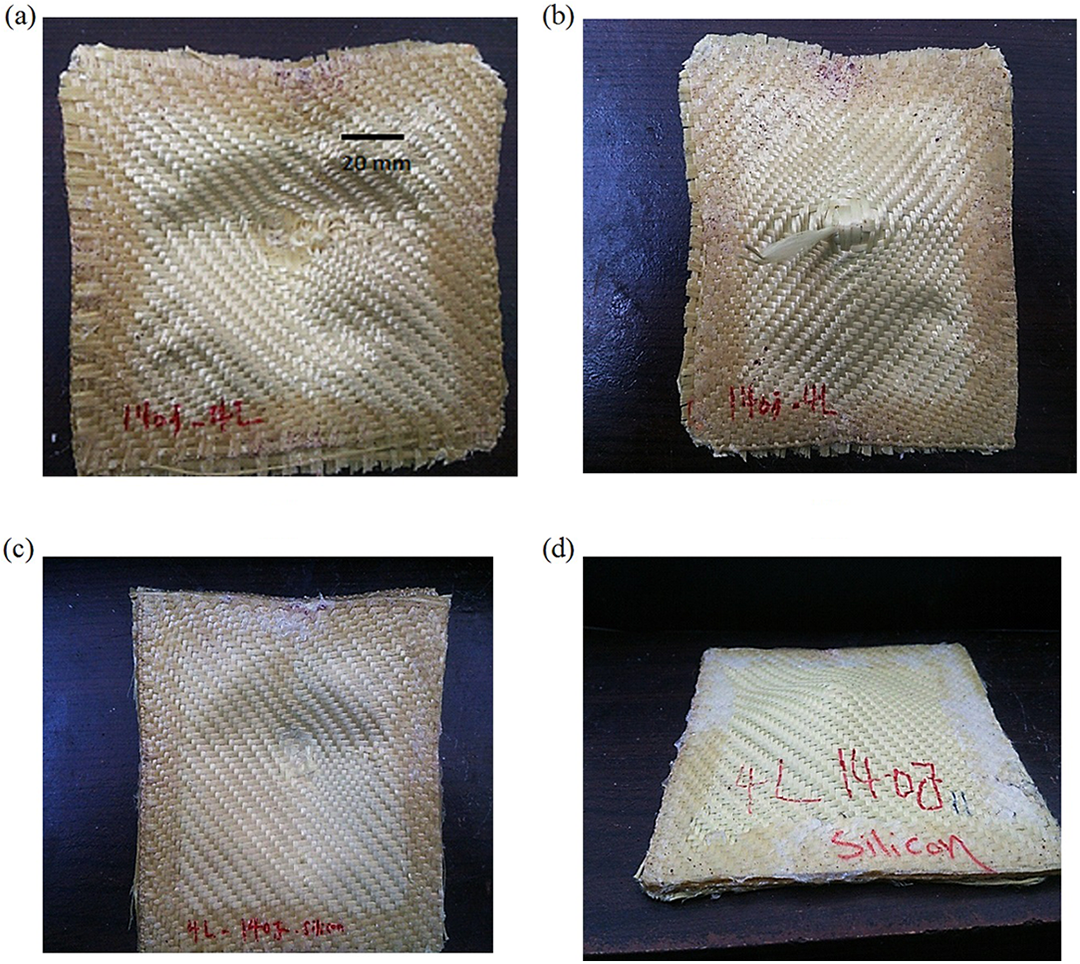
Comparison of fabric target after impact: (a) front side of dry four-ply fabric, (b) back side of dry four-ply fabric, (c) front side of coated four-ply fabric, and (d) back side of coated four-ply fabric.
Numerical results
In numerical simulations, the initial impact energy is defined as impact velocity. Figure 18 displays the numerical and experimental time history of acceleration for single-ply dry fabric at 30 J impact energy. The toe compensation is made to have similar starting time of impact event for better comparison of the results.
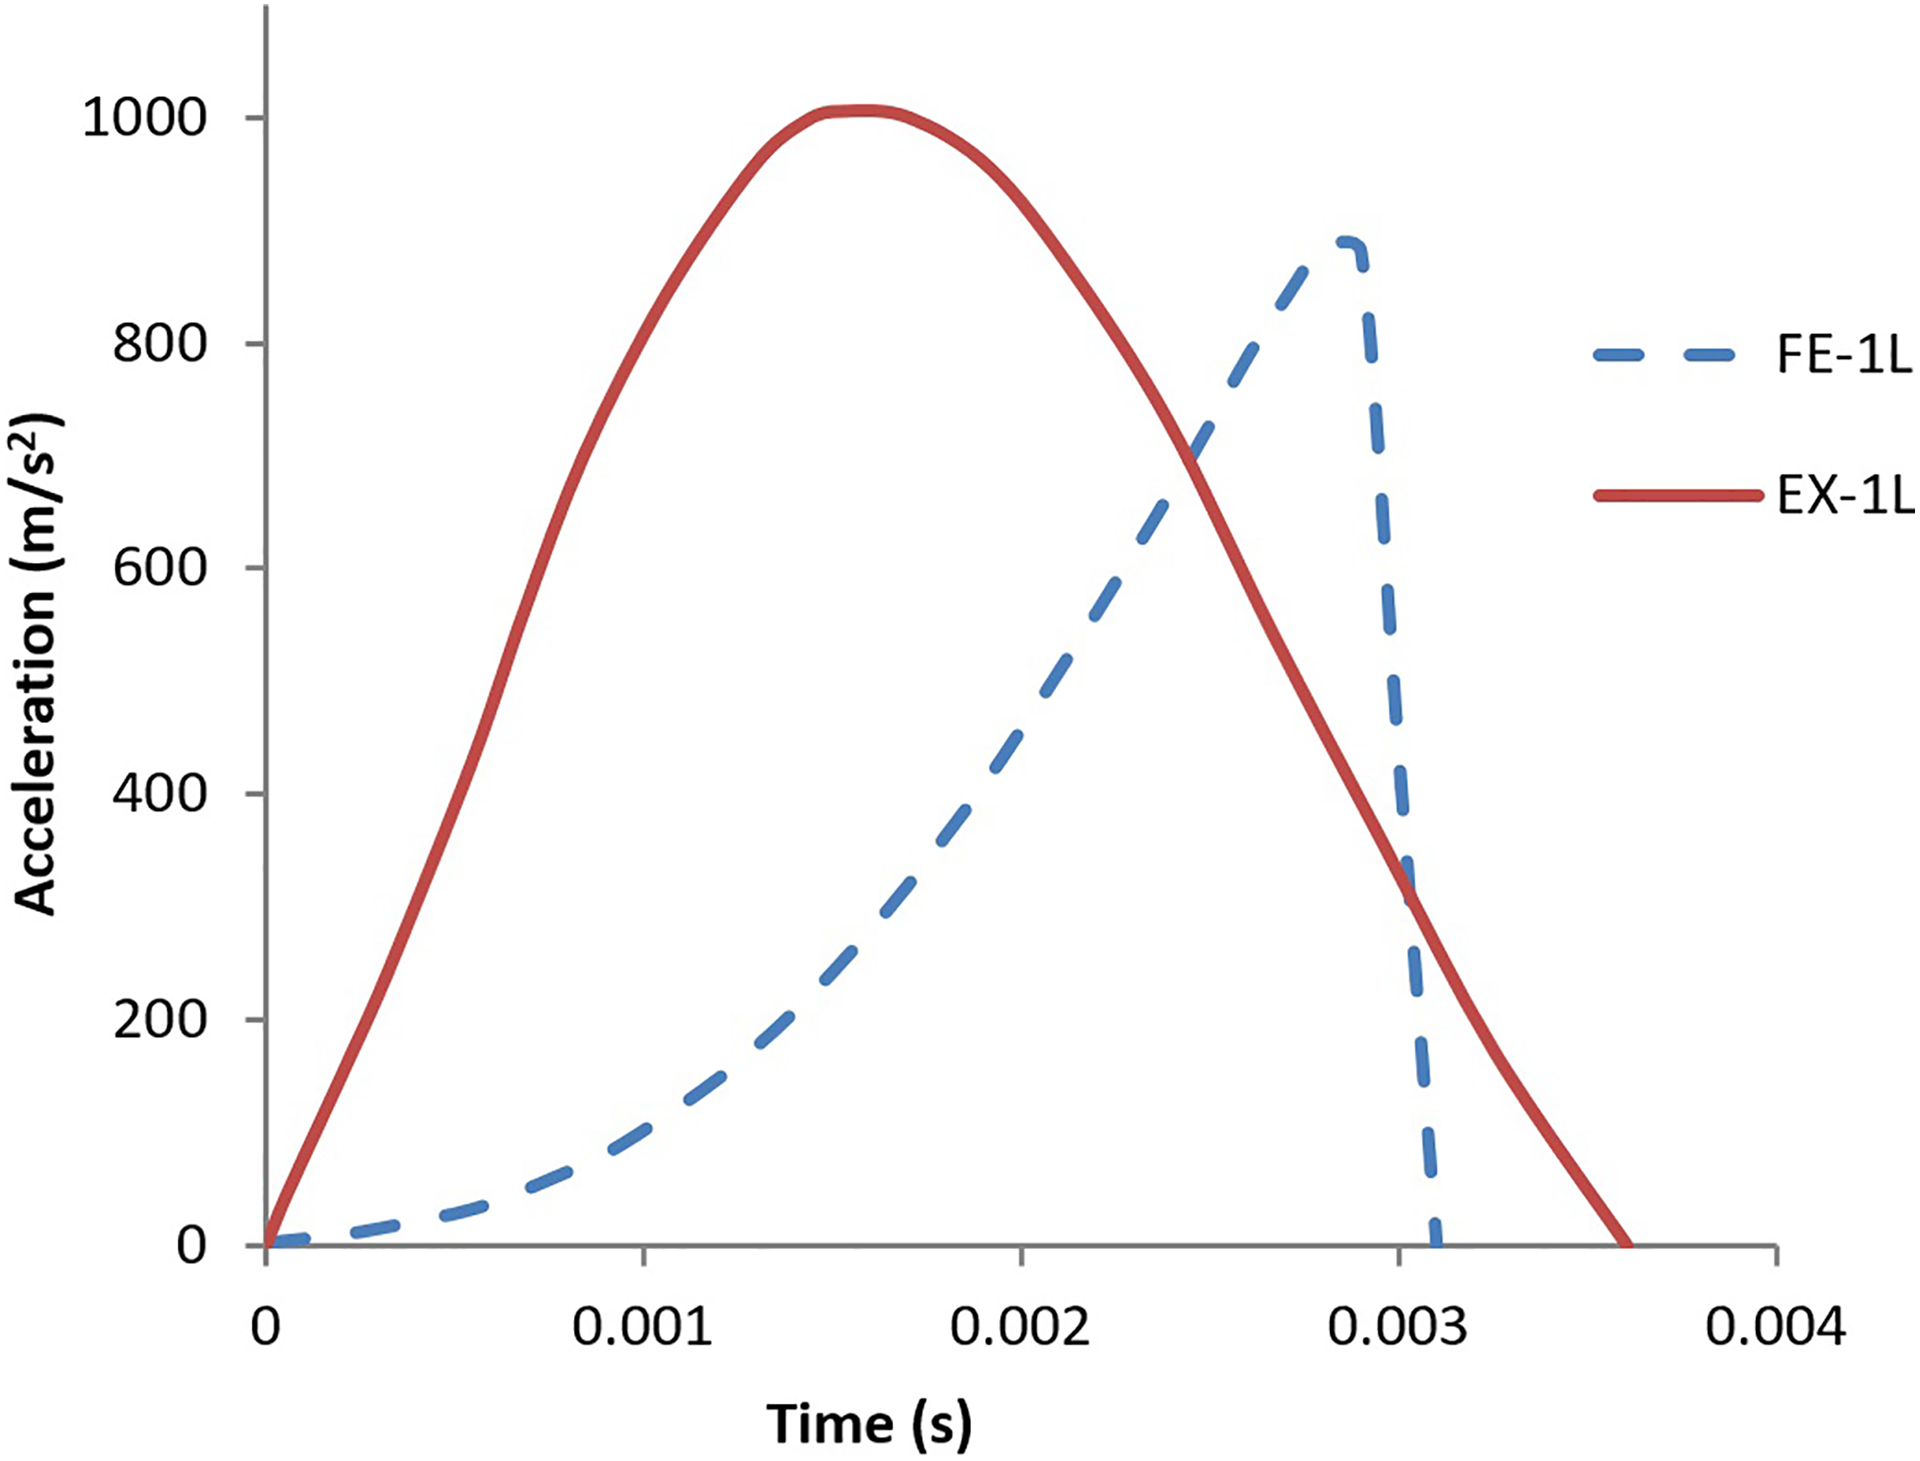
Finite element simulation and experimental time history of acceleration for single-ply dry fabric at 30 J impact energy.
Figure 18 shows that the peak acceleration for experimental test equals 1050 m/s2 with 3.6 ms duration of impact. In finite element simulation, the peak acceleration is 884 m/s2 with 3.1 ms duration of impact. Although the numerically simulated and experimental time history curve have some differences, the time duration of impact and peak acceleration values have little deviations that equal 13.8% and 16%, respectively. The curve shape differences may be due to the use of shell elements for warp/fill yarns and the impactor in 2D simulation.
Figure 19 displays numerical simulation results of acceleration history for single-ply silicon-coated fabric compared with experimental results at 30 J impact energy. For numerical simulation purposes, the effect of coating in the fabric is introduced as the coefficient of friction. So, for 10 wt% suspension concentration, the coefficient of friction introduced equals 0.271. Figure 19 shows that time during the impact for numerical simulation is less than the experimental one. It is shown that numerical and experimental time during the impact are 3.3 and 4.5 ms, respectively, and the simulated projectile perforates the target after the mentioned time with 26% deviation from the experimental results. The peak accelerations for numerical and experimental results are 909 m/s2 and 904 m/s2, respectively, with good agreement.
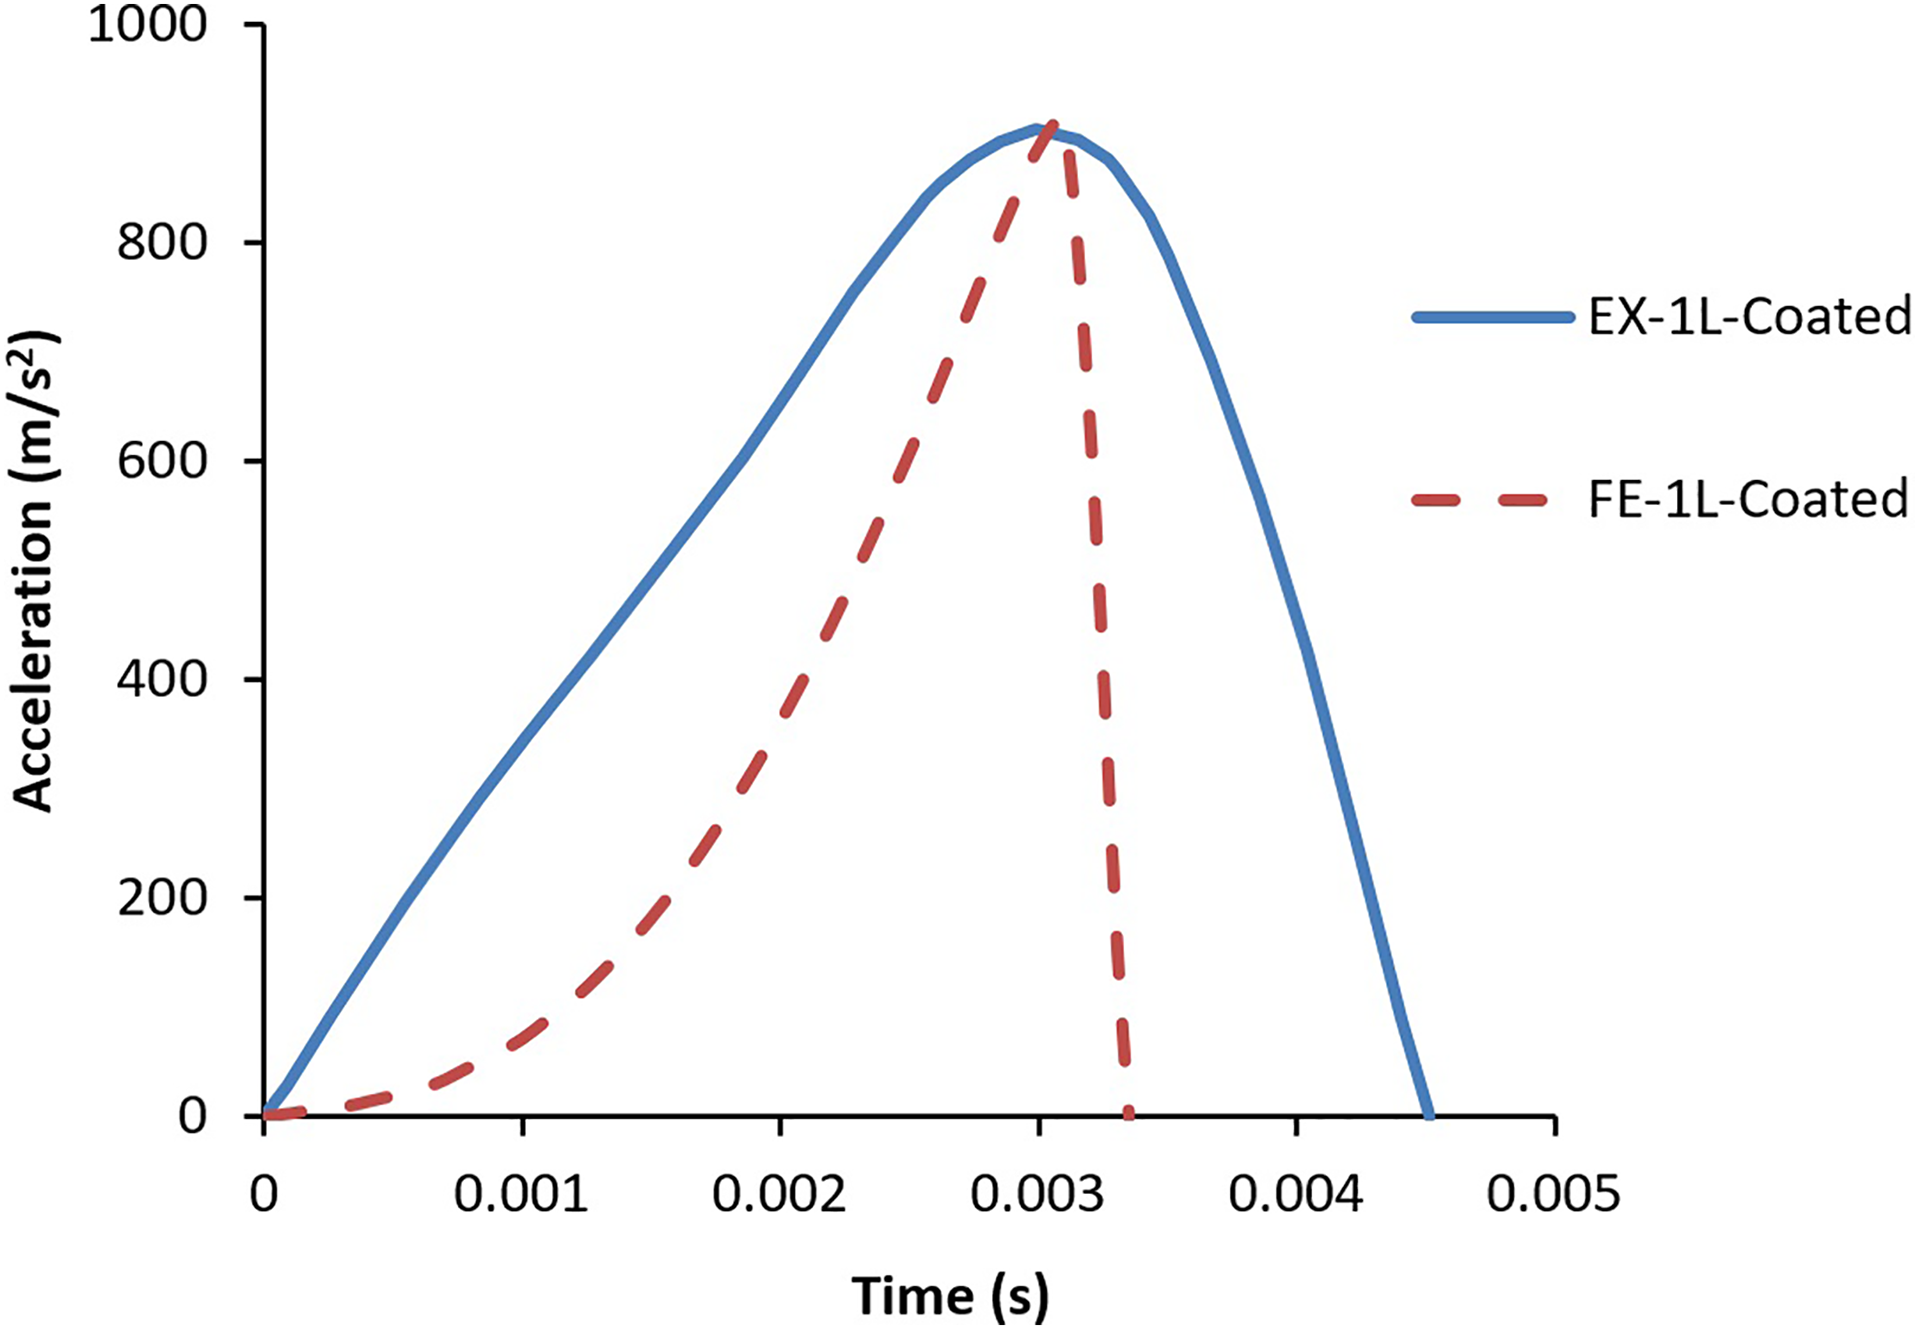
Numerical and experimental time history diagram of acceleration for single-ply silicon-coated fabric at 30 J impact energy.
Figure 20 shows the numerical simulation of the single-ply dry fabric and deformation mechanism of the yarns and perforation of the fabric.
Deformation mechanism of numerically simulated single-ply fabric at 30 J impact energy (a) weight at the impact point with fabric, (b) stretching of yarns, and (c) perforation of the fabric and failure of the yarns.
As the fabric is perforated, or it resists against the impact, the boundary condition with the weakest clamping condition, due to circular clamping, affects the yarn crimp in the connecting path to the impact point. This phenomenon is visible in both experimental tests and numerical simulation as shown in Figure 21.
Yarn crimp in middle sides and fabric perforation in both (a) numerical simulation and (b) experimental test of single-ply fabric at 30 J impact energy.
Table 4 lists the numerical results of single-ply dry and coated fabric at 30 J impact energy. Comparison of the exit velocity for both targets reveals that the silicon-coated fabric has higher impact performance than the dry fabric due to 3.6% lower residual velocity of the impactor.
In silicon-coated fabric with 10 wt% concentration, the coefficient of friction is 0.271, 18.7% higher than the dry fabric, and the increase in weight is 3.9%, but the coated fabric reduces the projectile velocity just 3.6% more than the dry fabric. This shows little performance improvement of silicon-coated fabric. The fact that the friction coefficient of the coated fabric is high, and the impact performance is not significantly improved can be supported by the research performed by Zeng et al. 22 They concluded that the friction coefficient above the 0.2 value might increase stress concentration in fabric yarns at the impact point, thus it reduced the impact performance of the target; therefore, the coated fabric with 0.271 friction coefficient does not have enhanced impact performance.
Summary and conclusions
In this article, the low-velocity impact performance of dry and silicon-coated twill-weave fabric is studied experimentally and numerically. To find out a proper method to coat the fabrics, they are augmented in various suspension concentrations, and the weight increase and friction coefficient enhancement are measured. The best coating concentration by considering lower weight increase relative to friction enhancement is chosen. In the next step, the impact test is performed for the selected fabric. In this study, 10 wt% suspension concentration is found to be the best choice with 18.7% friction enhancement, 47.1% fabric yarn weight increase compared with the dry fabric. The impact test performed for both coated and dry fabrics shows impact performance enhancement by increasing the number of plies. As the number of plies increases, the damping of the fabric rises, and it leads to higher impact performance of the fabric and higher impact energy loss. The silicon-coated fabrics have more time duration of impact and better impact performance compared with dry fabrics. Unlike the broader region of dry fabric subjected to yarn stretch, the damage in silicon-coated fabric is limited to the impact point. The impact test is numerically simulated in LS-DYNA software, and the effect of coating is introduced as the coefficient of friction. The numerical results for single-ply dry and coated fabrics at 30 J impact energy reveal that the coated fabric reduces the residual velocity of the impactor 3.6% more, resulting in higher impact performance of the coated fabric.
Footnotes
Declaration of Conflicting Interests
The author(s) declared no potential conflicts of interest with respect to the research, authorship, and/or publication of this article.
Funding
The author(s) received no financial support for the research, authorship, and/or publication of this article.