
Abstract
In this research, the effects of foaming and of nanoclay on foam morphology and soundproofing of wood flour/low-density polyethylene (LDPE) composites were investigated. For this purpose, LDPE, wood flour, foaming agent, and nanoclay were mixed in an internal mixer to produce test samples. The standard circular samples were made using compression molding method in a hot press machine. Sound transmission loss (STL) was measured by an impedance tube. Results showed that foaming and nanoclay increase the STL of the composites at frequencies above 2000 Hz. The biggest increase in STL has been found for the foamed composites containing nanoclay. The addition of nanoclay decreased the average cell size and increased the cell density of foamed composites.
Keywords
Introduction
Nowadays, undesirable and unwanted sounds are one of the most important problems in human life that have great effects on people health. 1,2 Generally, excessive noises influence on people by fatigue, reduced working efficiency, and health system disorders. 3 In order to prevent problems caused by industrial and nonindustrial abnormal sound, using a variety of methods to control the voices seem very necessary.
One of the most effective ways to control noise pollution is to use of sound-absorbing materials. 4 Various materials such as wood, plastic, and composites are used as barrier materials to reduce the noise levels. Generally, viscoelastic materials exhibit good potential for sound and vibration dampening. 5 Although polymers are viscoelastic materials, they have lower surface density and elastic modulus which lead to weak sound insulating performances when solely used as sound barriers. 5,6 Significant works have recently investigated the acoustic properties of filled plastic composites.
Wood-plastic composites (WPCs) as viscoelastic materials are relatively new category of polymer materials reinforced with lignocellulosic fiber/flour that are rapidly developing. 7,8 Compared to unreinforced polymer, these materials have a higher modulus of elasticity. 9,10 Regarding some valuable properties of WPCs (such as high strength-to-weight ratio, chemical and corrosion resistance, low energy consumption during manufacturing, excellent and easy recyclability after design and service life, and lightweight), these composites can be considered as sound barriers or absorbing materials.
A variety of formulations and methods are used for manufacturing WPCs. For example, different polymeric materials with different type, grade, and content are compounded with different lignocellulosic materials with different shape (flour or fiber), content, and particle size to produce WPCs. In addition, variety of additives (such as coupling agents, nanoparticles, and foaming agents) is used to improve the physical and mechanical properties of WPCs or to enhance the desirable applications. The effects of such variations on physical and mechanical properties of WPCs are well known, but there are few references about the soundproofing behavior of these composites. 5 It is obvious that the better understanding the sound properties of WPCs will lead to expand their application range. Previous studies showed that foaming and the use of nanoparticles such as nanoclay improve the soundproofing properties of different composites 11,12 ; therefore, it was expected to improve the sound properties of WPCs as well. Hence, the aim of this study was to evaluate the influence of foaming and using nanoclay on soundproofing properties of WPCs. In addition, the mechanical properties and microstructures of the composites were evaluated by different techniques to establish a micro-mechanism for improvement in sound properties.
Materials and methods
Materials
The polymer matrix, low-density polyethylene (LDPE), was grade LF0200 and supplied from by Iran’s petrochemical and Polymer Institute. The melt flow index (MFI; temperature = 190°C, load = 2.160 kg) of LDPE was 2 g/10 min. Wood flour as filler was obtained by screening industrial sawdust of Iranian beech (Fagus orientalis) collected from local mills to a +60/−40 mesh particle size. The wood flour was dried at 85°C for 24 h to reach moisture content level less than 3%. Maleic anhydride grafted polyethylene (MA-g-PE) provided by Krangin Co. (Karaj, Iran), Iran, with an MFI of 7 g/10 min and 1.5% coupled maleic anhydride was used as coupling agent. The exothermic chemical foaming agent, azodicarbonamide (Anhui Huishang Co. [Anhui, China]), was used to foam WPCs. The nanoclay particles were on base of Cloisite 20A which were supplied from Southern Clay Products Inc. (TX, USA)
Compounding and preparing the composites
The LDPE, wood flour, coupling agent, and foaming agent were compounded in a Brabender internal mixer (model WHT 55, Duisburg, Germany) and melt processed at 140°C while the rotor speed was set at 60 r/min. The composition of the mixtures is listed in Table 1.
Composition of evaluated formulations (wt%).
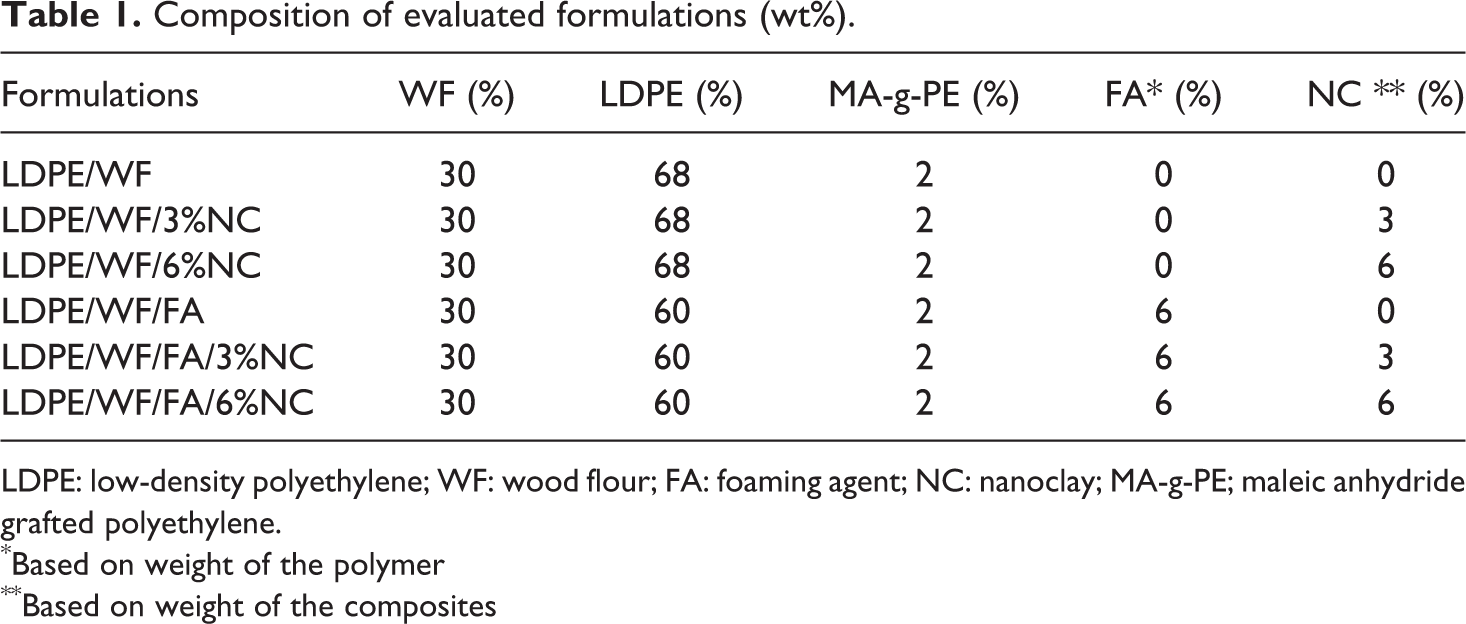
LDPE: low-density polyethylene; WF: wood flour; FA: foaming agent; NC: nanoclay; MA-g-PE; maleic anhydride grafted polyethylene.
*Based on weight of the polymer
**Based on weight of the composites
The molten compounds were removed from the internal mixer and cooled to room temperature and were then granulated. The chopped materials were compression molded using a hot press (Toyo Seiki Press) to produce acoustic test samples with a target size of 100 (diameter) × 2 (thickness) mm. A constant pressure of 25 MPa was applied to composite plates at 180°C for 10 min. After 15 min, the press temperature was decreased to below 60°C under the same pressure. Then, the thermodynamic instability was induced by rapidly decreasing pressure to the atmospheric pressure, and the foamed composites were formed. 13
Mechanical property
Three-point flexural tests were performed at a crosshead speed of 2 mm/min according to ASTM D790-04 to determine the flexural modulus and strength of the samples. The flexural samples with a size of 80 (length) × 15 (width) × 2 (thickness) mm were prepared from the circular acoustic samples. Unnotched impact tests were also carried out according to ASTM D 256-90 with a Santam Izod testing machine (Tehran, Iran). At least three replicates for each test were performed.
Foam morphological characterization
The morphology of the foams was described by three parameters: foam density, average cell size, and cell density. Apparent density of the foams was obtained by the ratio of weight over volume of each sample. The dimensions of the samples were measured with a micrometer to 0.01 mm, and weights were carefully measured to 0.1 mg. At least three replicates for each type of composites were used.
Cell sizes were determined using the average diameter function of Image-Pro Plus. It represents the average of 90 diameters taken every 2° from the geometric center of the cell area. Cell size and cell density were characterized using scanning electron microscopy (SEM; KYKY-EM3200). The void fraction (Vf ) and the cell population density per unit volume of the original non-foamed polymer (N) were determined from the SEM micrographs using the equations (1) and (2), respectively. 14


where n is the number of bubbles in the micrograph, A and M are the area and the magnification factor of the micrograph, and ρf and ρp are the densities of foamed and non-foamed samples, respectively. The cell size and cell-size distribution were determined by taking average diameters of cells from the data of SEM observation.
X-ray diffraction
X-ray diffraction (XRD) analysis was performed on samples containing nanoclay using XPert MPD diffractometer (Philips Co. [Amsterdam, Netherlands]) that uses Cu K
α radiation (λ = 1.78901°A). Measurements were done at 50 kV and 35 mA. The data were recorded in the reflection mode in the range 2θ = 1.0–11 using the scan method. The step size was 0.01° and the scanning rate was 2°/s. The distance between silicate platelets was calculated using Bragg

where d is the distance between crystallographic planes, θ is half of the angle of diffraction, n is an integer, and λ is the wavelength of the X-ray radiation.
Sound transmission loss
The soundproofing property of the foamed and non-foamed WPCs was gauged using sound transmission loss (STL) measurement. STLs of the WPCs were measured in decibels (dB) according to equation (4), where Ii and It are the incident and transmitted acoustic power, respectively.
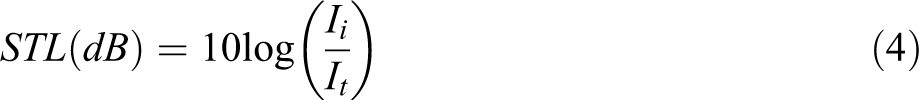
To measure STL values of acoustic samples, a Brüel & Kjær impedance tube instrument (Type 4206 T) was used. Figure 1 shows the setup used for STL measurement. The impedance tube is made of a 100-mm-diameter tube for 50–1600 Hz range and a 29-mm-diameter tube for 500–6400 Hz range. Four microphones in the fixed locations (two positioned between the sound source and the specimen and two positioned on the opposing side of the specimen) record the sound pressures during the test. Final sample dimensions and weight were measured and used to calculate sample area density. Prior to testing, around the perimeter of circular test samples were sanded to fit them into the test tube without much lateral force from the tube wall. Petroleum jelly (Vaseline) was also applied to the sample edges to prevent sound pressure leaks. To obtain a better STL curves without noise fluctuations, FFT curves were smoothed by 1/3 octave band width. Three replicates were tested for STL measurements.
Schematic diagram of the impedance tube for measuring the sound transmission loss (STL).15
Results and discussion
Density and foam characterization
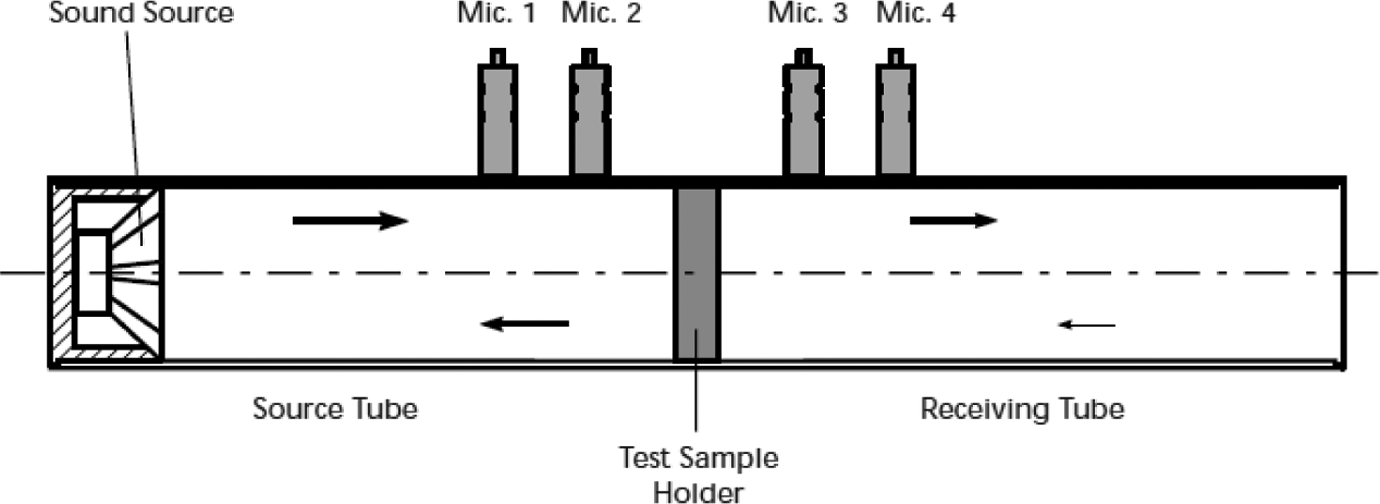
The apparent densities of foamed and non-foamed wood flour/LDPE composites are illustrated in Figure 2. Statistical tests showed that the density of foamed composites significantly is lower than density of non-foamed composite. Use of nanoclay significantly decreased the density of foamed composites. The minimum density was obtained for foamed composites containing 3% nanoclay.
Influence of nanoclay content on density of composites.
Figure 3 shows SEM micrographs of foamed and non-foamed WPCs. The foam structure is clearly visible in foamed WPC (Figure 3(b)). The presence of nonspherical and nonuniform cells, open and closed cells, and deformed cells causes a complexity in cell morphology of foamed WPCs. This complexity can be related to high concentration of wood flour and its chemical and physical influence on the cell formation. 16 –18
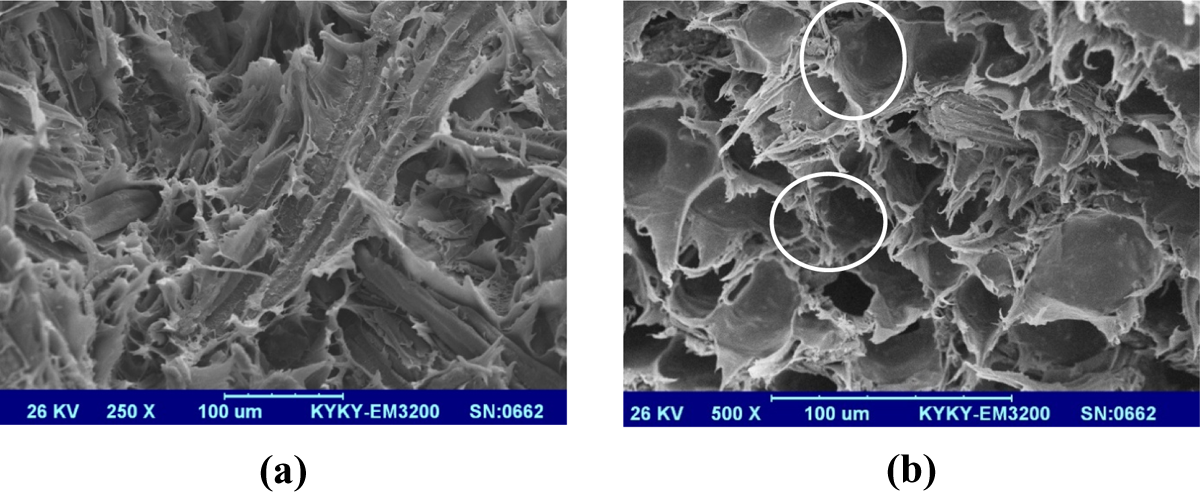
Scanning electron microscopy (SEM) micrographs of wood-plastic composites (WPCs): (a) non-foamed; (b) foamed.
The effect of nanoclay on cell size and cell density of foamed composites is presented in Table 2. Figure 4 shows the SEM micrograph of the foamed WPCs with and without nanoclay. The use of nanoclay changed the cell size and density of the foamed WPCs. In general, the cell size was decreased and the cell density was increased with the increase in nanoclay content for all composites. Nanoclay may act as a nucleating agent during foaming process and, in this way, influence on cell formation and foam cell morphology; and as a result, due to the small amount of gas to produce bubbles in the polymer help to reduce cell size and increase cell density. On the other hand, by increasing the nanoclay content, melt viscosity of matrix increases and the foaming process leads to cell growth. 16 –22
Cell size and cell density of composites foams.
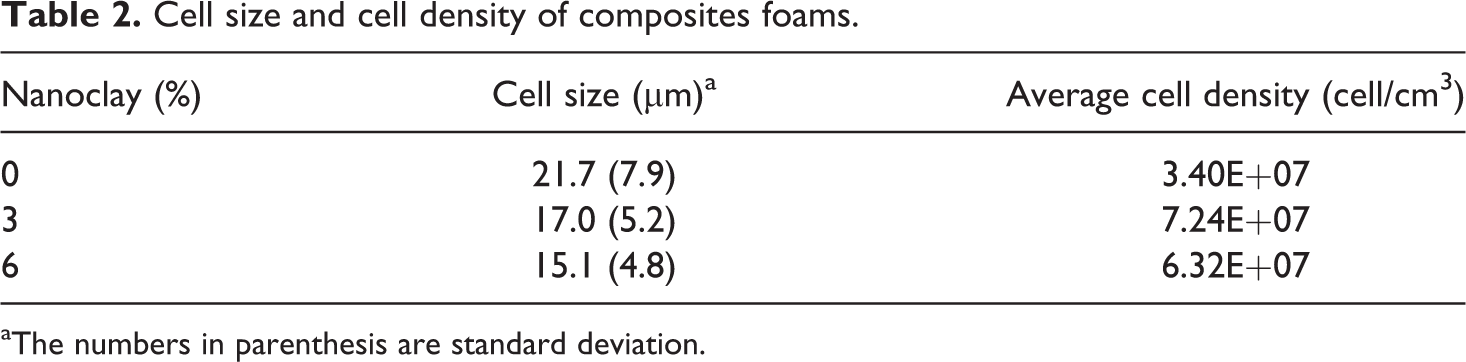
aThe numbers in parenthesis are standard deviation.
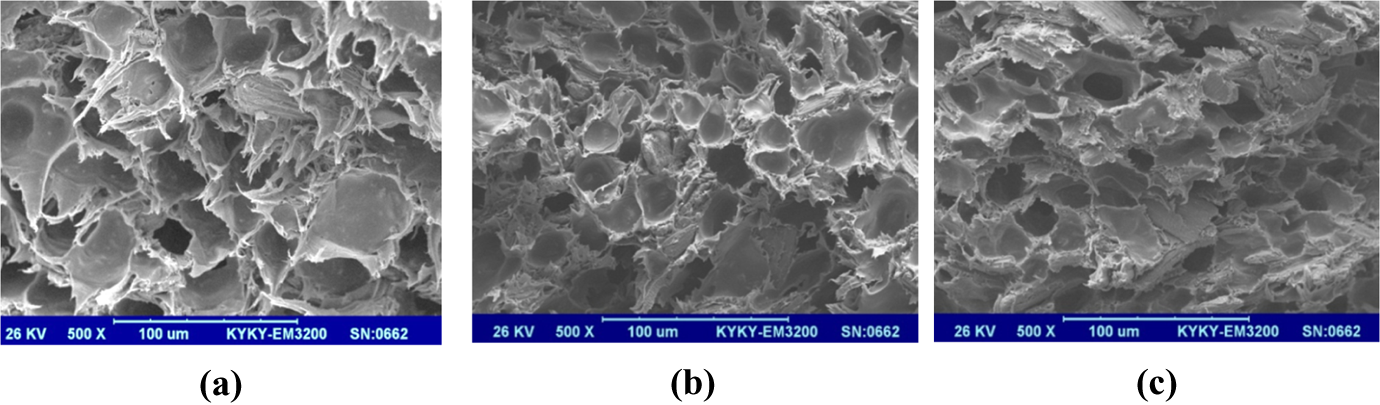
SEM micrograph of composite foams with different nanoclay content (a) 0%, (b) 3%, and (c) 6%.
In addition to average cell size and cell density, the cell-size distribution is very important to foam morphology. Figure 5 shows the cell-size distribution of foam cells in composites acquired from SEM images. It can be observed that the foamed composites containing 6% nanoclay exhibit the narrowest distribution (cells with smaller and more uniform size).
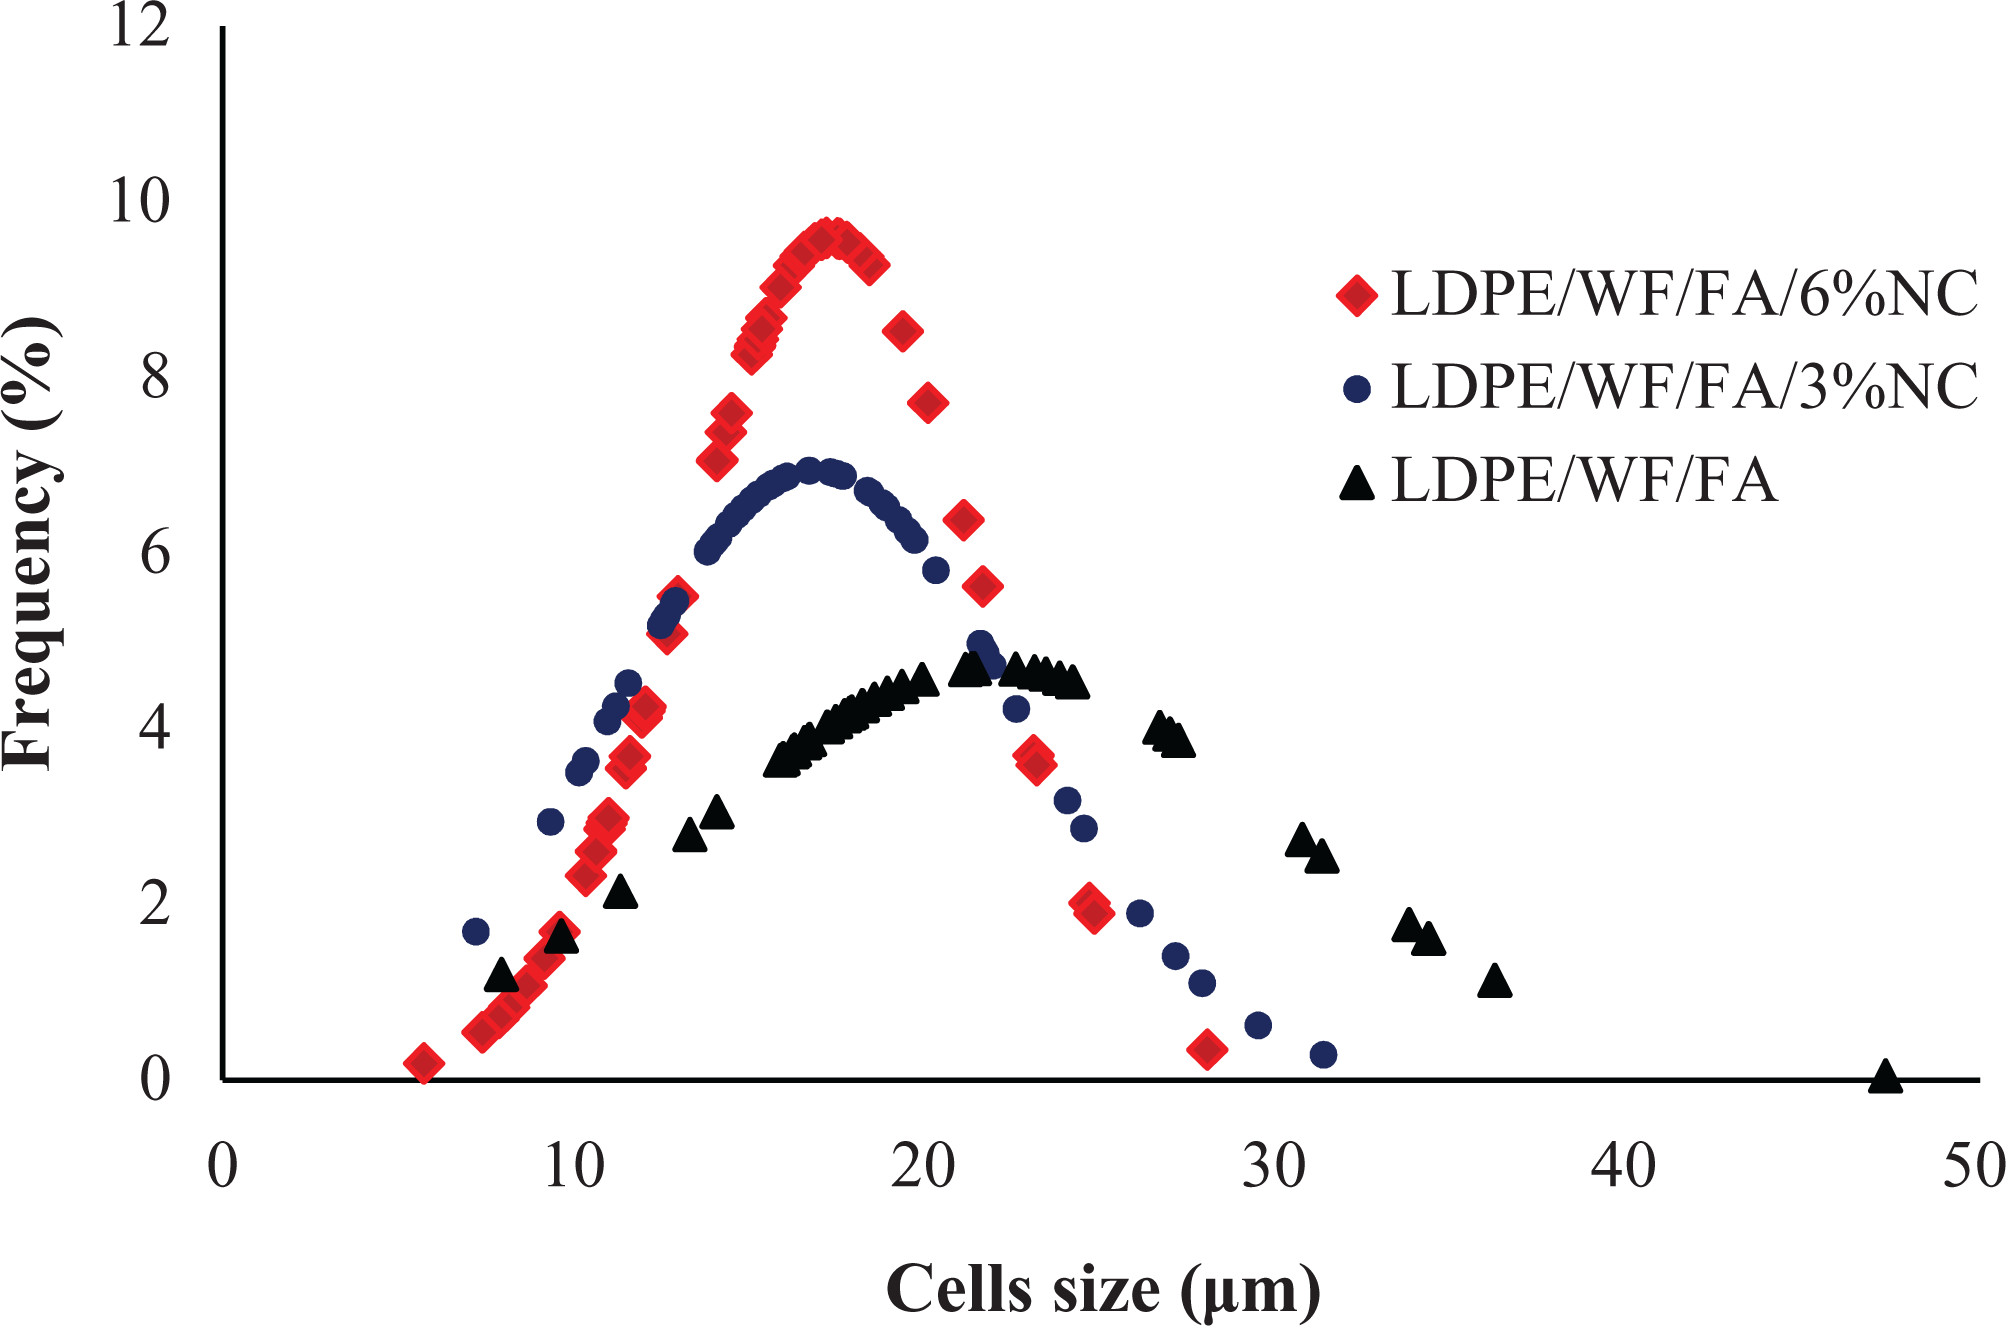
Cell-size distribution in foamed composites.
X-ray diffraction
Figure 6 illustrates the XRD patterns of pure nanoclay and wood flour/LDPE/nanoclay composites. A strong peak is present at the position of at 2θ = 4.1° for pure nanoclay which corresponds to the layer spacing of 2.5 nm. For the composites (foamed and non-foamed), XRD peaks of all the composites are shifted to lower angles (2.6–2.93°), indicating an increase in interlayer spacing (3.5–3.9 nm) by the intercalation of polymer; and the nanoclay still retains an ordered structure after melt compounding.
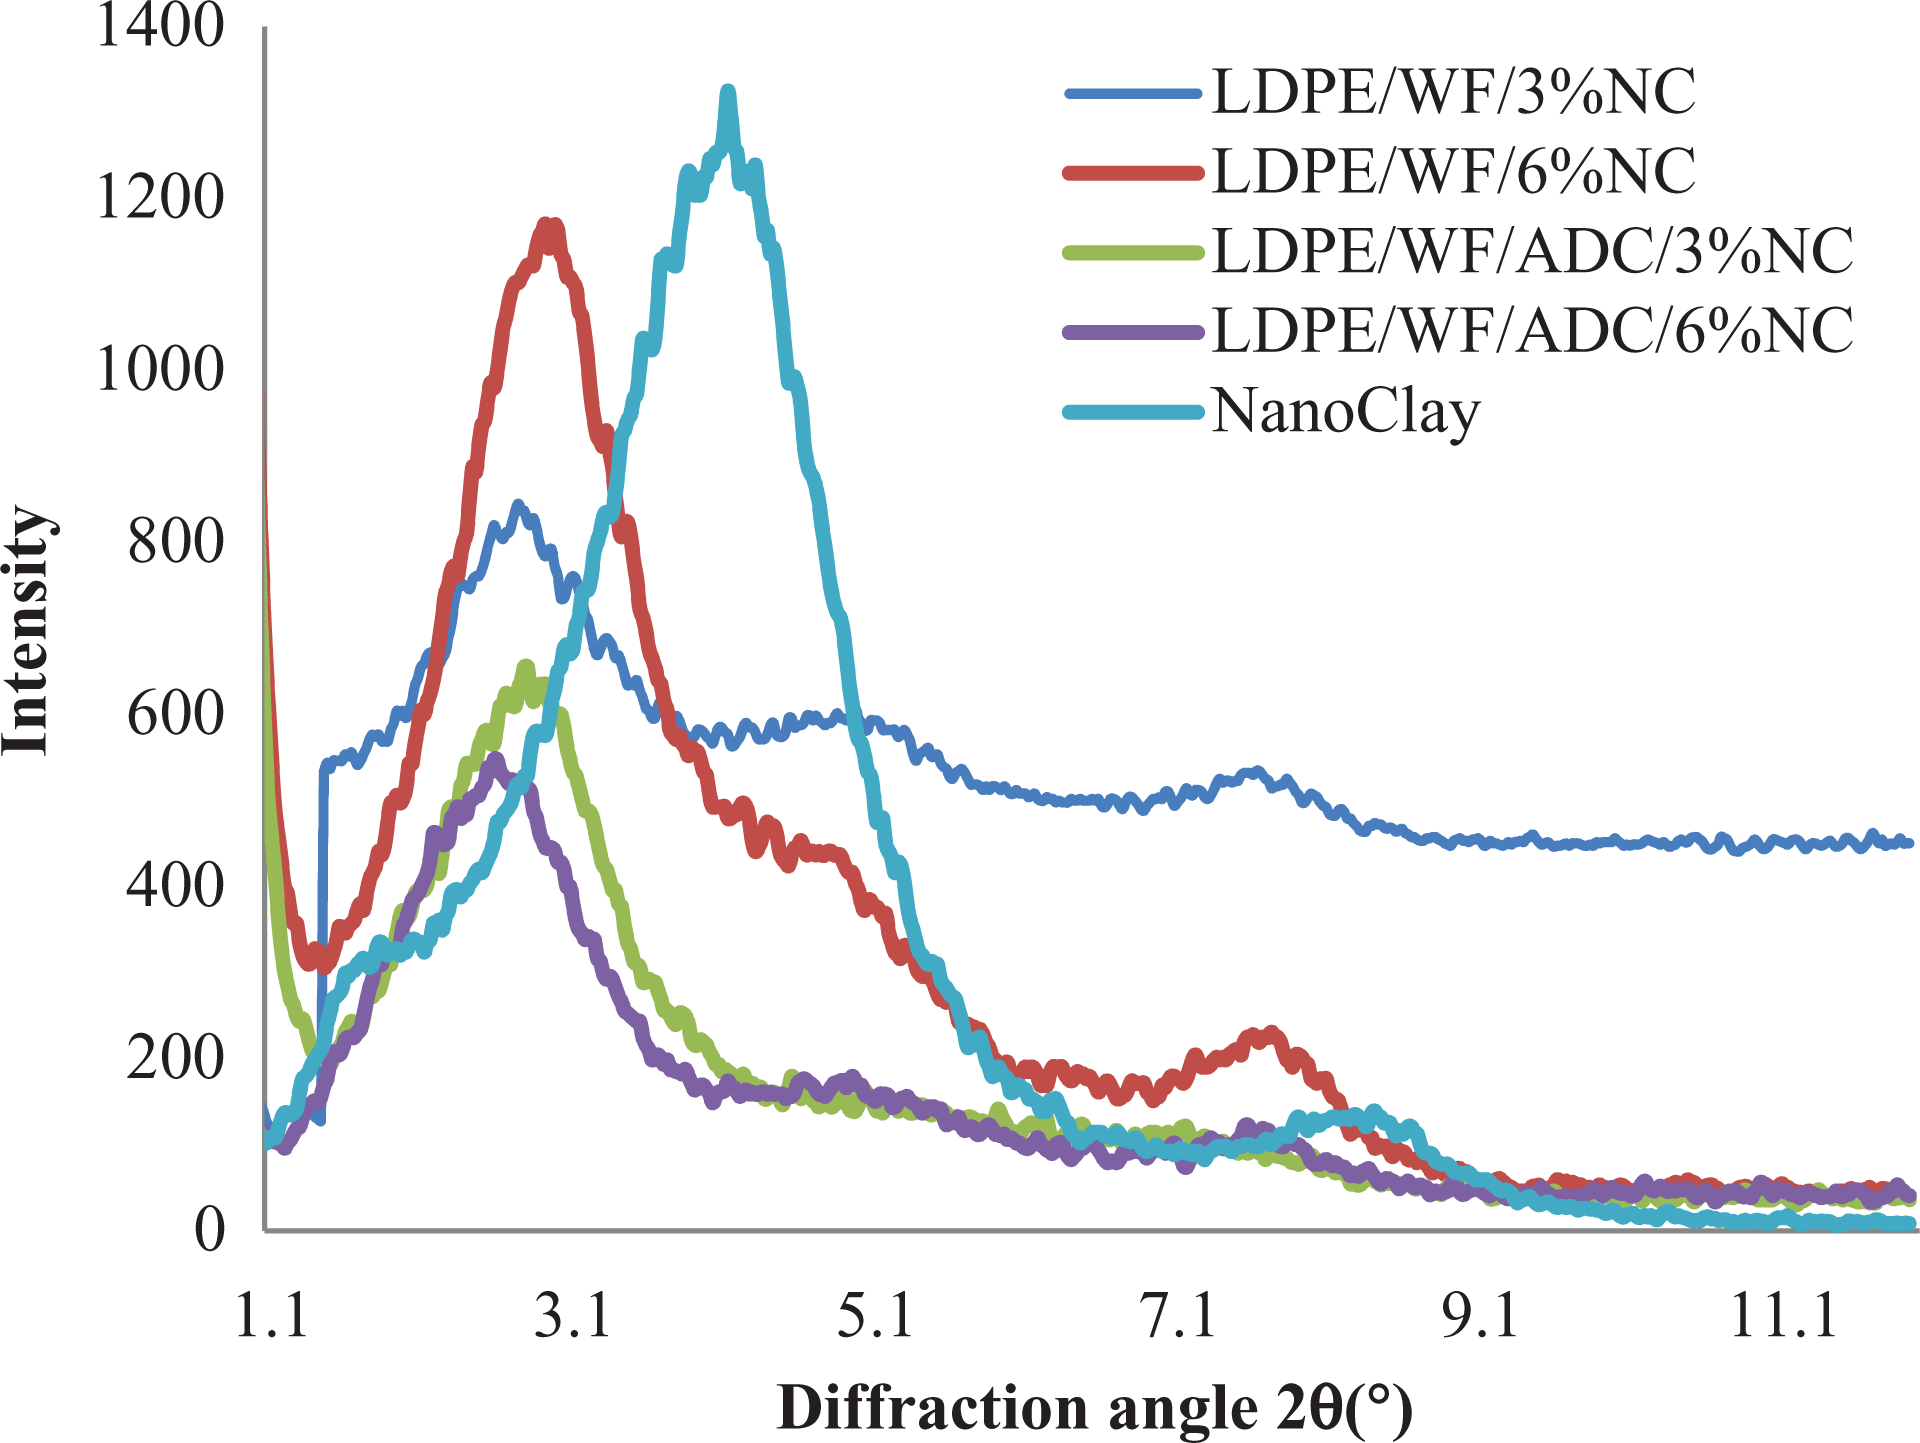
X-ray diffraction patterns of non-foamed and foamed composites.
In non-foamed LDPE/wood flour composites containing 3% and 6% nanoclay, the nanoclay characteristic peak shifted to 2θ = 2.8° and 2θ = 2.9° corresponded to the layer spacing of 3.7 nm and 3.5 nm in the nanocomposites, respectively. In foamed LDPE/wood flour composites, with the addition of 3% and 6% nanoclay, the peak shifted to 2θ = 2.8° and 2θ = 2.6° corresponded to the layer spacing of 3.7 nm and 3.9 nm, respectively. However, the nanoclay was not exfoliated since the XRD peak still obviously existed. The highest interlayer distance was obtained for foamed composites containing 6% nanoclay.
Mechanical properties
The mechanical properties of foamed and non-foamed WPCs are listed in Table 3. The foamed composites exhibited higher flexural modulus than non-foamed composites. As shown in Table 3, for non-foamed WPCs, the highest flexural modulus was obtained at 6% nanoclay, while the foamed WPCs containing 6% nanoclay exhibited the lowest flexural modulus. The severe reduction in flexural modulus of the 6% nanoclay-filled foamed WPCs can probably be attributed to poor distribution of nanoclay in foamed LDPE matrix. The statistical analysis shows that the effect of nanoclay on flexural modulus of non-foamed composites is significant, and the highest flexural modulus was obtained at 3% nanoclay. From Table 2 and in WPCs without nanoclay, the flexural strength of foamed composites is slightly lower than non-foamed composites. Flexural strength of WPCs is affected by adhesion between polymer matrix and wood flour. Foaming creates bubbles in polymer matrix. These bubbles probably weaken the interface adhesion between matrix and filler. 23,24 Statistical analysis shows that the decrease in the flexural strength of WPCs (foamed and non-foamed) in the presence of nanoclay was significant in comparison to WPCs without nanoclay. In foamed WPCs, the presence of nanoclay improves the nucleation sites and the growth of cells in the foam process, and as a result, flexural strength decreases. 16,28
Mechanical properties of the foamed and non-foamed wood-plastic composites.a
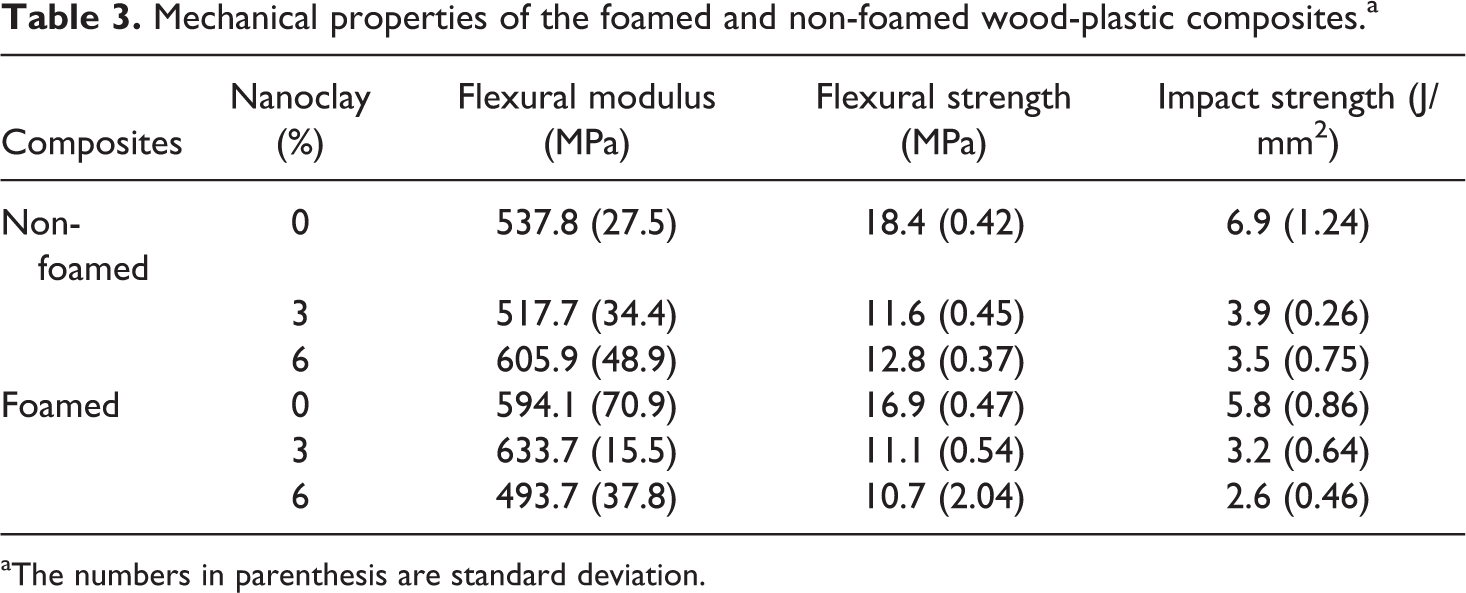
aThe numbers in parenthesis are standard deviation.
Table 3 also shows that the impact strength of foamed WPCs is lower than non-foamed WPCs. This difference can be attributed to greater flexural modulus of foamed WPCs. Statistical analysis showed that the addition of nanoclay significantly decreased the impact strength of both foamed and non-foamed WPCs, and the lowest impact strength was observed in 6% nanoclay-filled WPCs. Significant decrease in flexural and impact strengths in nanoclay-filled WPCs indicates that the nanoclay particles have no good dispersion in LDPE matrix.
Sound transmission loss
Figures 7 and 8 illustrate the STL-frequency curves of foamed and non-foamed WPCs with and without nanoclay, respectively. All curves have similar trends and three regions can be identified in each curve: AB, BC, and CD regions. In AB region, stiffness-controlled region, the STL decreases to a minimum value when frequency increases. The frequency at point B is designated as experimental resonance frequency. 5 In BC region, with increase in frequency, STL significantly increases to a maximum value. In CD region, the STL slightly decreases by increasing frequency. At frequencies higher than resonance frequency, STL is controlled by mass law. Some parameters which were extracted from STL curves are presented in Table 4.
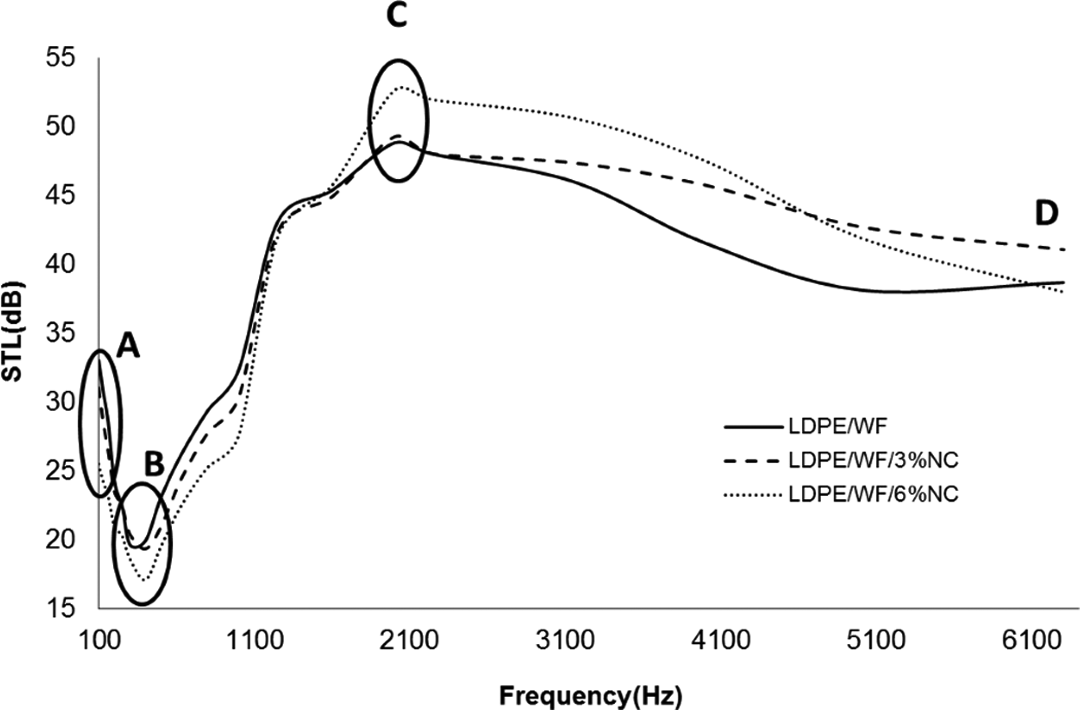
Effect of nanoclay on STL curves of non-foamed WPCs.
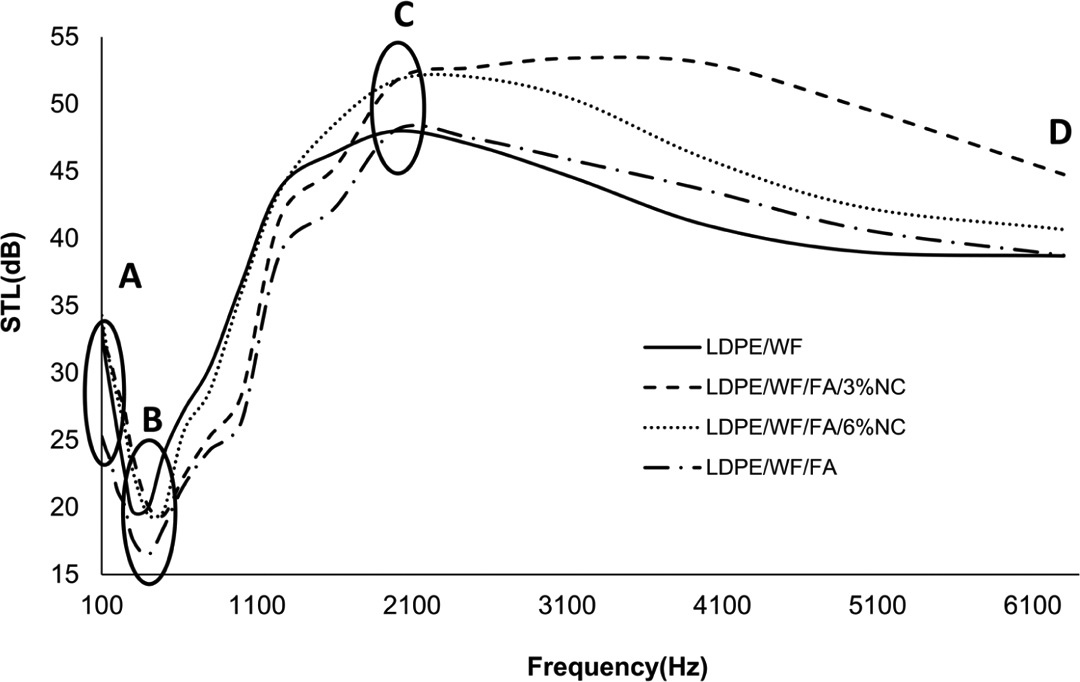
Effect of foaming and nanoclay on STL curves of WPCs.
Resonance frequency and maximum reduction of sound transmission in WPC foam has been foamed with 3% nanoclay.
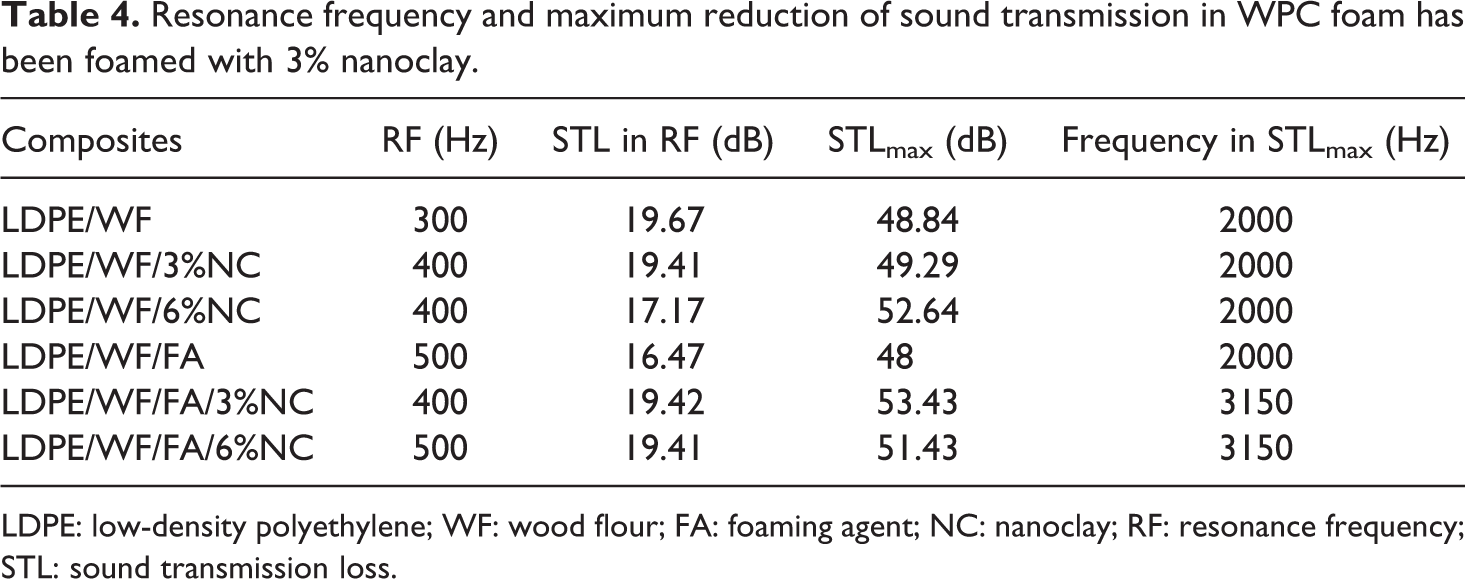
LDPE: low-density polyethylene; WF: wood flour; FA: foaming agent; NC: nanoclay; RF: resonance frequency; STL: sound transmission loss.
In non-foamed WPCs (Figure 7), the addition of nanoclay led to the increases of resonance frequencies. As it was mentioned before, the highest stiffness was observed for WPCs with 6% nanoclay; so it was expectable that they exhibit the highest STL in AB region, but the inverse result was obtained. Yan et al. 28 also reported similar results for polypropylene reinforced with nanoclay. It seems other factor or factors were effective on STL in this region. The composites containing nanoclay exhibited lower STL in frequencies less than 1100 Hz. After 1100 Hz, the nanoclay-filled WPCs showed higher STL than those without nanoclay. The maximum STL has been observed for WPCs filled with 6% nanoclay. It can be concluded that nanoclay is more effective on STL of WPCs at medium and higher frequencies.
Figure 8 compares the STL curves of foamed WPCs containing nanoclay with non-foamed WPCs. According to Table 4, higher resonance frequencies were obtained for foamed WPCs compared to non-foamed WPC. In AB region, the STL of the composites does not follow the stiffness law. In this region, the foamed WPC without nanoclay exhibited the lowest STL. After resonance frequency to about 1600 Hz, all foamed WPCs (with and without nanoclay) exhibited lower STL than non-foamed WPC which can be attributed to higher density of surface layer in non-foamed WPC. The WPC samples were made by hot press.
The composites made by hot press exhibit density profile in their thicknesses. It means they have a denser layer in surface and density gradually decreases to central layer. The surface density is an important factor influencing on STL properties. STL increases with the increase in surface density. 5 –29 After frequency 1600 Hz, a reverse trend is observed for STL of foamed WPCs (especially nanoclay-filled WPCs), and the STL of nanoclay-filled foamed WPCs is higher than non-foamed WPCs. It seems at frequencies higher than 1600 Hz, STL is affected by internal damping of sound wave in composites. Porosity converts the energy of sound waves to heat energy through hysteresis loss behavior. 5 On the other hand, nanoclay improves the density and morphology of the cells in foamed composites. For this reason, the greatest decrease in STL was obtained for foamed WPCs filled with 3% nanoclay.
Conclusions
In this research, the effects of foaming and nanoclay on acoustic, mechanical, and morphological properties of wood flour/LDPE composites were investigated and results showed as follows:
The use of nanoclay decreased the average size of the cells and increased the cell density of the foamed composites.
The minimum density was observed for foamed composites filled with nanoclay.
Nanoclay decreased the flexural and impact strengths of foamed and non-foamed composites.
All composites exhibited STL-frequency curves with similar trends.
Foaming decreased the STL of WPCs especially in frequencies less than 2000 Hz.
Nanoclay is more effective on STL of WPCs at medium and higher frequencies.
Footnotes
Declaration of Conflicting Interests
The author(s) declared no potential conflicts of interest with respect to the research, authorship, and/or publication of this article.
Funding
The author(s) disclosed receipt of the following financial support for the research, authorship, and/or publication of this article: Authors would like to thank Iran National Science Foundation (INSF) for supporting this project by Grant No. 92034390.