
Abstract
Industrial lime sludge (LS) waste is an environmental hazard which is usually disposed in dump yards or used in disorganized land filling, thus causing pollution. The aim of the present work is to investigate whether the functionality and commercial viability of this industrial waste can be enhanced by utilizing the calcium carbonate (CaCO3)-rich LS waste as reinforcement in high-density polyethylene (HDPE) matrix. Mechanical, thermal, and morphological properties are studied by blending LS with HDPE in various weight fractions. It is observed that the flexural strength, tensile modulus, and flexural modulus increased significantly with the addition of LS in the polymeric matrix indicating effective reinforcement by rigid particulate filler. The onset thermal degradation temperature is also increased significantly upon LS addition, thus raising the thermal stability of the composites. Hence, the development of LS-reinforced HDPE composites can be considered as an effective way to enhance the properties of polymeric composites as well as to reduce pollution by recycling an industrial waste.
Introduction
Rapid industrialization has uplifted the rate of urbanization from traditionally rural economies to modern sophisticated ones. Although it is a sign of development, it is imperative to note that our society is facing a grave ecological situation as a result of the large quantities of toxic industrial wastes generated on a daily basis due to this development. One such potentially hazardous waste material is lime sludge (LS) which accounts for approximately 4.5 million tons per annum in India.
1
The LS waste, produced primarily from paper, fertilizer, sugar, carbide, and soda ash industries, consists of lime in the form of calcium carbonate (CaCO3) as the major constituent.
1
Presently, sizable percentage of industrial LS generated is disposed in open or closed dump yards or used in disorganized land filling which are environmental hazards creating the following types of pollution in and around its dumping areas: air pollution (sludge becomes powdery on drying and adds to the suspended particulate matter in air), water pollution (leaching during rain or near water bodies and contamination of ground water), and soil pollution (poor quality of soil, excess contaminants in soil, lack of aesthetics, and scar on terrain).
However, triggered by the urgent need to develop environmental friendly waste utilization methods, some unconventional methods of LS waste utilization have been developed over the years, such as, recovery of raw materials from sludge, production of bricks, ceramics and building materials from sludge, sludge pelletization for alternative fuel, feedstock for ethanol production, masonry construction, and even as potential fertilizers and composts. 2 –5
On the other side, polymers and polymeric composites constitute the building blocks of almost every item surrounding us due to their various inherent features such as lightweight, functional and structural flexibility, low cost, and ease of manufacturing, to name a few. Thermoplastic polymers are often supplemented with mineral fillers not only to improve their mechanical, thermal, and electrical properties but also to reduce the product cost, thereby increasing their commercial viability.
Earlier, the main objective of adding mineral fillers was cost reduction. 6 –9 However, fillers such as (CaCO3) have been used increasingly nowadays, in order to accomplish the following added functionalities: (i) as reinforcing fillers in thermoplastic industry, 8 (ii) for increasing the viscosity of thermoplastics, 10 (iii) for toughening (Izod impact toughness) high-density polyethylene (HDPE) and polypropylene (PP), 6,9 (iv) to improve Young’s modulus of polymers and increasing mechanical properties such as impact strength and hardness 7,9 , and (v) decreasing dielectric loss or increasing absorption of infrared radiation. 11
In similar lines of work, numerous researches have been conducted till date to reuse various industrial wastes as fillers/reinforcing agents in polymeric composites, as a process of sustainable waste management. Industrial wastes viz. biochar, 12 postconsumer recycled wood, 13 electronic wastes, 14 nonmetals recycled from waste printed circuit boards, 15 waste from electricity distribution networks, 16 industrial fly ash cenospheres, 17 residual cellulose fibers of agricultural wastes, 18 discarded nylon carpets, 19 paper mill sludge waste, 20 –23 and so on are being used as fillers or reinforcing agents in a polymeric matrix in order to increase their functionality and decrease pollution. Paper sludge waste was used earlier as filler in polymeric and rubber composites. 20 –23 However, paper sludge consists of only 70% inorganic matter along with 30% cellulosic fibers in it which has its own disadvantages. 20,23 It is observed that cellulose in natural fibers hinders bonding between the filler and matrix due to hydrophilic fiber and hydrophobic polymer. Hence, most natural fibers are pretreated with a coupling agent before their use as reinforcing agent in polymeric composites. 20,23 Since the main objective behind using industrial wastes as filler is cost reduction, the pretreatment of paper sludge adds to additional expenditures when done on industrial scale. Moreover, particle size of paper sludge is usually much high (up to 5 mm) due to the presence of cellulosic fibres. 23 This increases stress concentration sites in composites leading to decreased mechanical properties. Additionally, low temperature resistance of organic fibers poses another problem of degradation/decomposition at extrusion/molding temperatures around 200°C during the processing of thermoplastic composites. 24 On the contrary, LS waste from various Indian industries mainly consists of 35–70% lime as CaCO3 in addition to very small amounts of magnesium oxide (MgO), aluminium oxide (Al2O3), silicon dioxide (SiO2), iron(III) oxide (Fe2O3), and traces of alkali oxides. Additionally, particle size of raw LS varies from 30 μm to 45 μm, and it is stable at higher processing temperatures due to the absence of any organic matter. 1
In this research, LS waste (particle size of 10–45 μm) from the paper industry is chosen which contains CaCO3 in the form of calcite. 1 LS upon further compounding yields particle size in the range of 1–2 μm (refer Figure 1). Moreover, LS is quite stable at higher processing temperatures (refer Figure 3) due to the absence of any organic (cellulosic fiber) matter. Reutilization of industrial waste, low particle size (low stress concentration sites), thermal stability at higher processing temperatures, chemical composition similar to CaCO3 (highest used filler material), and cost reduction are the various motivating factors for fabricating LS HDPE composites.
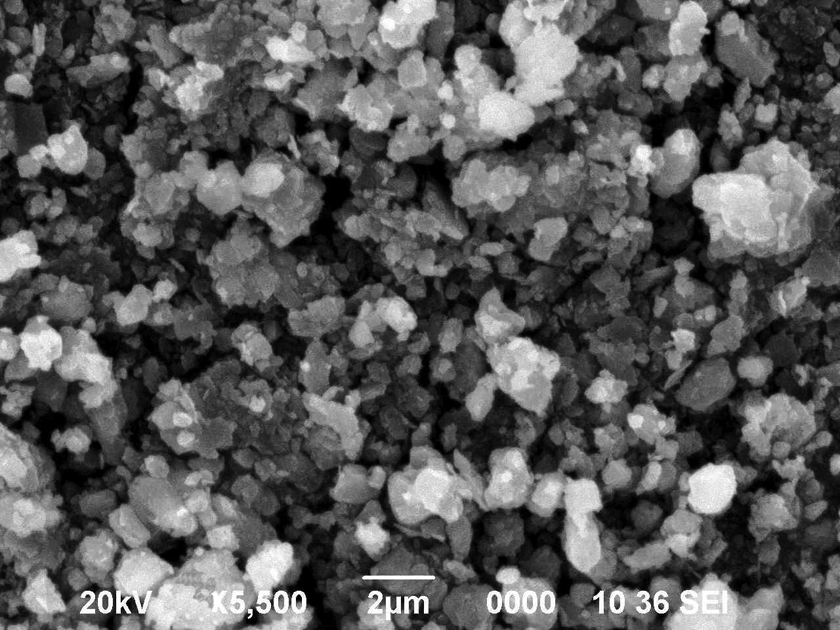
The SEM micrograph lime sludge powder after compounding. SEM: scanning electron microscopy.
Hence, this study explores the feasibility of using LS as reinforcing filler in HDPE composites, thus integrating (i) the scientific value—utilization of industrial LS waste thereby decreasing pollution, and (ii) commercial value—reducing the manufacturing cost of polymeric composites and increasing the viability of the industrial waste. The aim of the present contribution is to fabricate HDPE composites with increasing weight fraction of LS in a polymeric matrix and study the effects of LS on the mechanical, thermal, and morphological properties of the composite is studied in comparison with pure HDPE. It is observed that mechanical properties, such as tensile modulus, flexure modulus, and flexural strength, and thermal properties, such thermal degradation temperature and stability, are enhanced as a result of the addition of LS in HDPE composites.
Experimental
Material
The HDPE grade 5108L, supplied by Haldia Petrochemicals Ltd. (West Bengal, India) with a melt flow index of 1.9 g/min (at 190°C, 2.16 kg) and density of 0.95 g/cm 3 , is used as the polymeric matrix. Raw LS powder is collected from the dump yard of the Hindustan Paper Corporation Limited (HPCL) paper mill at Jagiroad, Assam (India). The LS is heated at 110°C for 2 h to remove any residual moisture content in a hot air oven (model: 114/14, make: Reico, (West Bengal, India)) before blending. The LS is characterized using X-ray diffraction (XRD), inductively coupled plasma optical emission spectrometry (ICP-OES), scanning electron microscopy (SEM), and thermogravimetric (TG) analyses in order to determine the structure, composition, morphology, and thermal properties of LS.
Sample preparation
The HDPE in form of granules and LS with various weight percent values (5, 10, 15, 20, 25, and 30 wt%) are blended together in a co-rotating twin-screw extruder (model: EX100, make: Voltam, (Kolkata, India)) thereby fabricating LS–HDPE composites of 5, 10, 15, 20, 25, and 30 wt% LS dispersed in a polymeric matrix. Finally, the tensile, flexure, and impact test specimens are molded, using an injection molding machine (model: IM100, make: Voltam) at an injection pressure and temperature of 2.45 N/mm2 and 200°C, respectively.
Mechanical testing
The tensile and flexural properties are measured using a universal testing machine (model: H100K-S, make: Hounsfield, Italy) at a crosshead speed of 1 mm/min. The notched Izod impact test is conducted using a digital pendulum impact testing machine (model: P/N0963.000, make: CEAST Spa, Italy). Tensile, flexure, and impact tests are conducted according to ASTM D638 (specimen V), ASTM D7264, and ASTM D256 standards, respectively.
Differential scanning calorimetry analysis
A differential scanning calorimeter (DSC; model: Q20, make: TA instruments, USA) is used in obtaining the DSC thermograms at heating and cooling rates of 10°C/min with nitrogen as a sweeping gas. Approximately 10 mg of sample is loaded without further treatment, heated from 20°C to 200°C, held isothermally at 200°C for 1 min, and subsequently cooled to 30°C. The DSC thermograms are plotted for 10 wt% (10LS HDPE), 20 wt% (20 LS HDPE), and 30 wt% (30 LS HDPE) LS-filled HDPE composites and pure HDPE, respectively.
The TG analysis
The TGA is done by a thermogravimetric analyzer, TG50 (Shimadzu, Japan). Thermal analysis is studied from 25°C to 600°C at a heating rate of 10°C/min. The TGA and derivative thermogravimetric analysis (DTG) thermograms are plotted for the samples 10 LS HDPE, 20 LS HDPE, 30 LS HDPE, and pure HDPE, respectively.
X-ray diffraction
X-ray diffraction (XRD) study of LS powder sample is conducted at room temperature (27°C) using a Miniflex 200 (Miniflex, UK) Rigaku X-ray diffractometer with Cu K α radiation (λ = 1.5418 Å). Peak positions are indexed according to JCPDS 5-586 of the International Center for Diffraction Data to search for the presence of CaCO3 in LS in its crystalline structure.
The ICP-OES analysis
The elemental contents in LS are estimated using an ICP-OES (model: 2100 DV, make: Optima Bridgeport, USA) following the methods of Naozuka et al. 25 . One gram of powdered LS sample is added to 30 mL of concentrated nitric acid and 5 mL of concentrated hydrochloric acid. The solution is digested inside a hot air oven at 100°C. Upon digestion of the LS sample, it is cooled and diluted up to 100 mL with distilled water.
The SEM analysis
Morphological studies on the LS powder and the fractured surfaces of the tensile specimens of 10 LS HDPE, 20 LS HDPE, and 30 LS HDPE composites are done using a SEM (model: JSM6390LV, make: JEOL, Japan) under the secondary electron mode. The samples are sputter-coated with platinum before being examined.
Results and discussion
Characterization of LS
Figure 1 shows the SEM micrograph of LS powder after compounding, which depicts the particle size of LS powder. It is observed from the micrograph that the average size of a LS powder particle is approximately 2 μm.
The XRD analysis
The crystal structure of the LS powder is shown in Figure 2. It is observed that the main diffraction peaks of the crystalline phases present in LS are in the range of 20–60°. It is a known fact that CaCO3 is characterized by three crystalline phases: calcite, aragonite, and vaterite. 26 The experimental XRD data of LS obtained in the present study showed striking resemblance with the diffraction peaks of calcite obtained from JCPDS card 5-586. The most prominent peak of calcite observed in the XRD pattern is located at 29.4° corresponding to the (1 0 4) reflections from the calcite crystals structure. Additionally, calcite peaks are observed at 23.05, 36, 39.4, 43.15, 47.5, 48.55, 56.6, and 57.45°. These peaks conformed well to the diffraction data of calcite in terms of locations of peaks and their relative intensities. Hence, the observed diffraction data showed the presence of CaCO3 in LS in the form of calcite. However, the presence of certain other peaks in different locations of the diffraction pattern is due to the fact that LS contains other inorganic compounds in small quantities. Therefore, XRD validates that CaCO3 in LS is mainly present in the form of calcite crystals, and this makes LS an ideal material to be used as filler in polymer matrices.
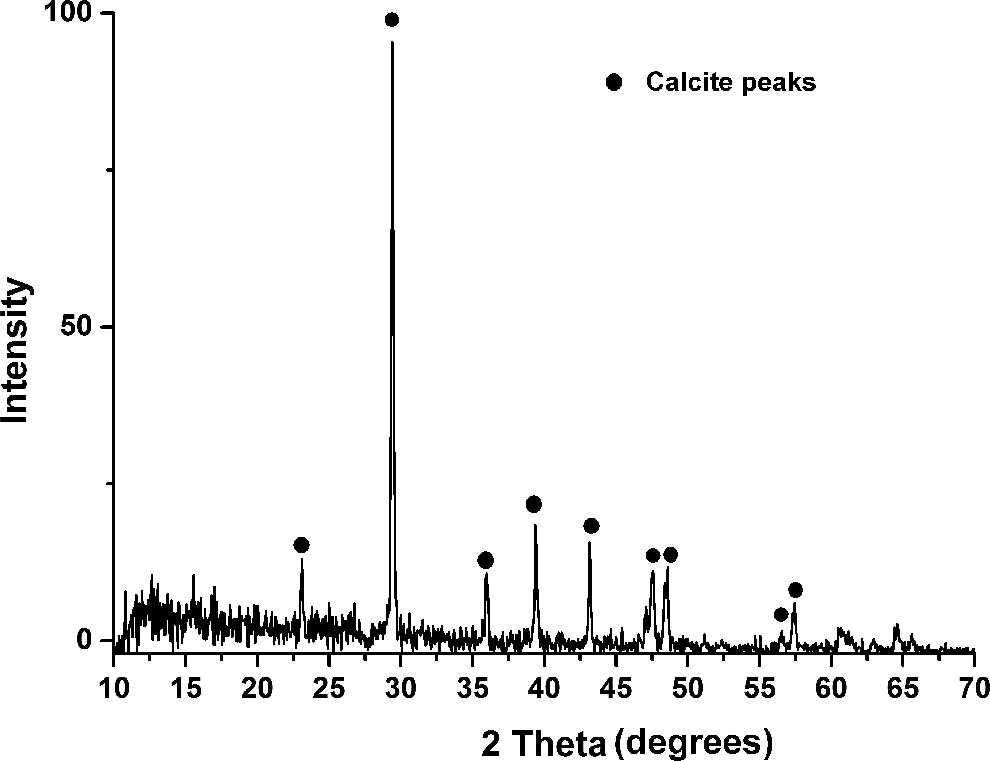
The XRD data of lime sludge showing calcite peaks. XRD: X-ray diffraction.
The ICP-OES analysis
Elemental analysis done by ICP-OES is shown in Table 1. Elemental analysis showed a calcium concentration of 514.5 ppm which is in close conformation with that obtained by Deka and Yasmin 27 in an earlier study on LS obtained from same Jagiroad Paper Mill, Assam (India). Additionally, they also reported that the percentage of CaCO3 in the LS to be 66.5% with a water-holding capacity of 70.4% along with a few other trace elements. From this analysis, it is evident that LS mainly consists of CaCO3 as the main constituent with traces of a few other compounds.
The ICP-OES analysis of LS showing elemental concentrations in ppm.
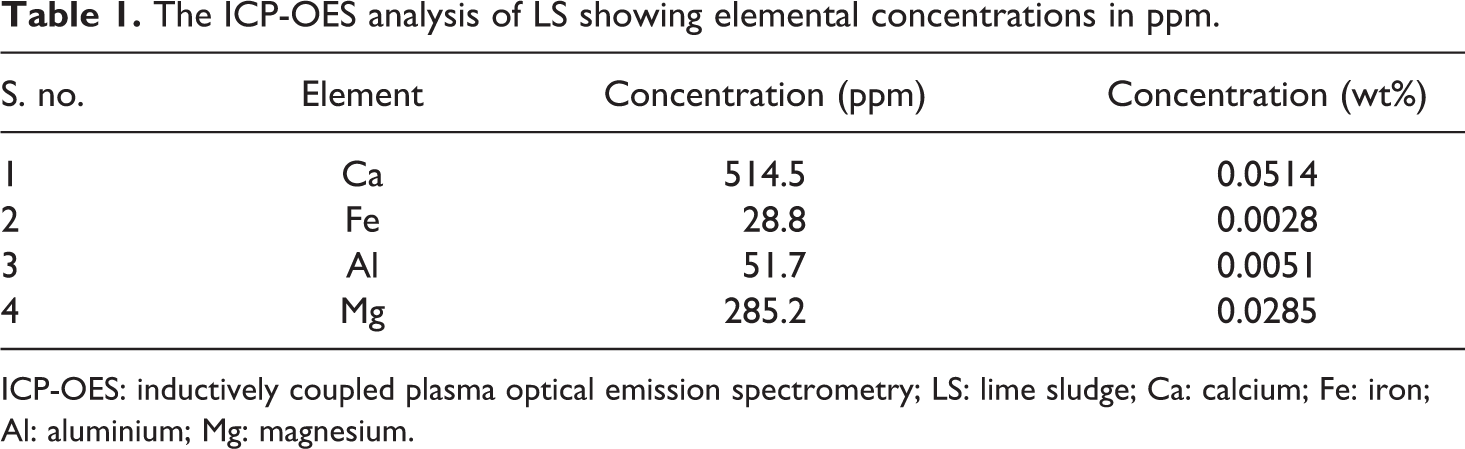
ICP-OES: inductively coupled plasma optical emission spectrometry; LS: lime sludge; Ca: calcium; Fe: iron; Al: aluminium; Mg: magnesium.
The TG analysis
Thermal degradation of LS is studied using TGA up to a temperature of 600°C. The weight loss (in wt%) of LS with increase in the temperature is shown in Figure 3. It is observed that there is hardly any loss in the weight percent of the LS sample up to 600°C. A small loss of 7.8 wt% is detected which may be attributed to loss of strongly physically adsorbed water between 40°C and 110°C and loss of water associated with magnesium hydroxide between 200°C and 400°C. 28 This is in stark difference with the thermal analysis of paper sludge done by Son et al., 21 which showed the degradation of cellulosic fibers from paper sludge at higher temperatures, thus leaving behind only the inorganic contents. Hence, the TGA plot of LS with only a small weight loss of 7.82% indicates the absence of any organic matter (cellulosic fibers) in the LS. It is also provided in the technical report by Baker et al. 28 that upon further heating, the loss between 650°C and 800°C is due to carbon dioxide being driven off as CaCO3 is decomposed.
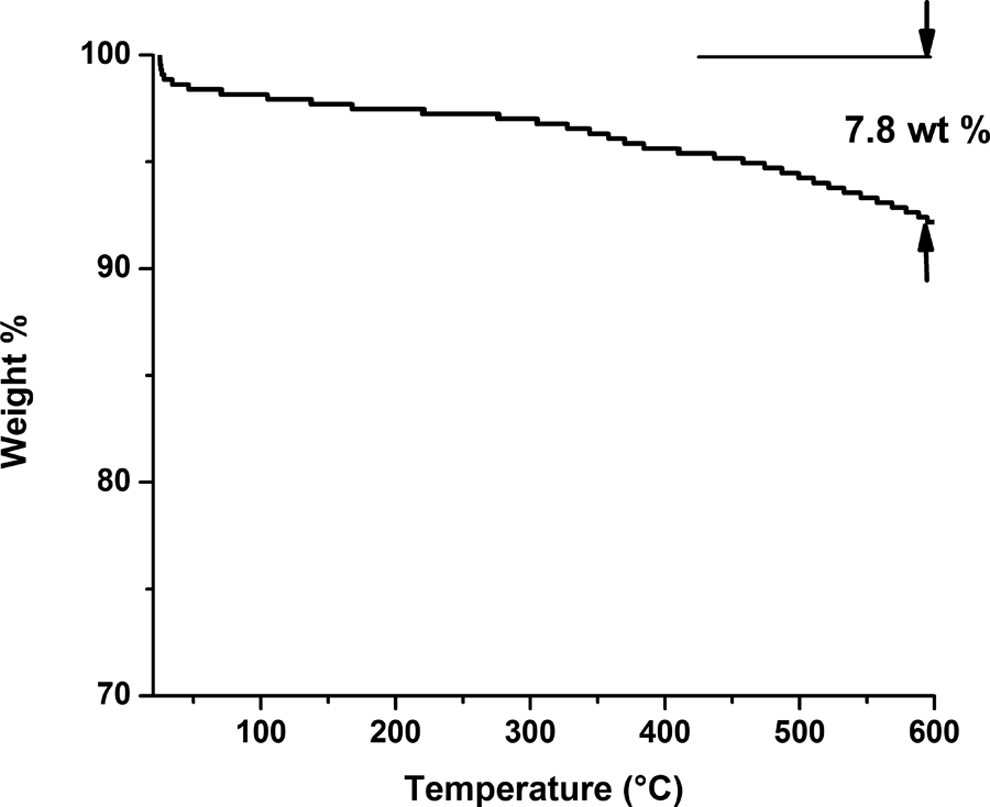
The TGA curve showing the degradation process of lime sludge up to 600°C. TGA: thermogravimetric analysis.
Mechanical properties of the composites
Tensile, flexure, and Izod impact tests are conducted for pure HDPE and LS-filled HDPE composites (5, 10, 15, 20, 25, and 30 wt% LS in polymer matrix) in order to determine the mechanical properties of the newly fabricated composites with increasing LS additive in conjunction with the pure polymer. The results observed were compared with previously reported studies on the mechanical properties of pure CaCO3-filled polymeric composites.
Tensile strength
The variation in tensile strength with increasing filler loading is shown in Figure 4(a). It is found that the tensile strength of pure HDPE is higher than that obtained for all LS–HDPE polymeric composites. There is a moderate drop in the tensile strength with increasing LS filler loading. This is in conformation with the results obtained by Atikler et al. 29 for pure CaCO3-filled HDPE composites. This is attributed to filler–matrix interfacial dewetting, LS particles acting as stress concentration sites under tensile loading and crazing due to the presence of CaCO3 in LS. 30 CaCO3 is known to promote craze formation in deformed polymers before fracture. 31 However, about 9% of an increase in the tensile strength was observed as the filler loading increased from 5 wt% to 10 wt% (11.9–13.7 MPa) after which the tensile strength decreases again up to 30 wt% filler loading. Hence, LS proves to be a better reinforcement as its content increases up to 10 wt%, indicating better particle dispersion and filler–matrix bonding compared to those composites with above 10 wt% filler content. This is evident from the SEM micrographs shown in Figure 4(b) and (c) at the fractured surface of the composites for 10 and 30 wt% LS additions, respectively. In Figure 4(b), LS particles remain embedded in the matrix depicting better filler–matrix bonding and particle dispersion. However, LS particles tend to drop out of the matrix at the fractured surface of 30 wt% LS added composites as seen in Figure 4(c) due to their poor interfacial bonding with the matrix. Additionally, there is also evidence of particle agglomeration in 30 wt% LS composites where the sizes of particles (denoted by the circles) are larger than that at 10 wt % LS added composites. Larger particle sizes due to particle agglomeration at higher concentrations of LS lead to higher stress concentration sites. Hence, poor filler–matrix bonding and particle agglomeration (higher stress concentration sites) can be attributed to the gradual decrease in the tensile strength at higher concentrations of LS in the composites, that is, at LS weight fractions >10%.
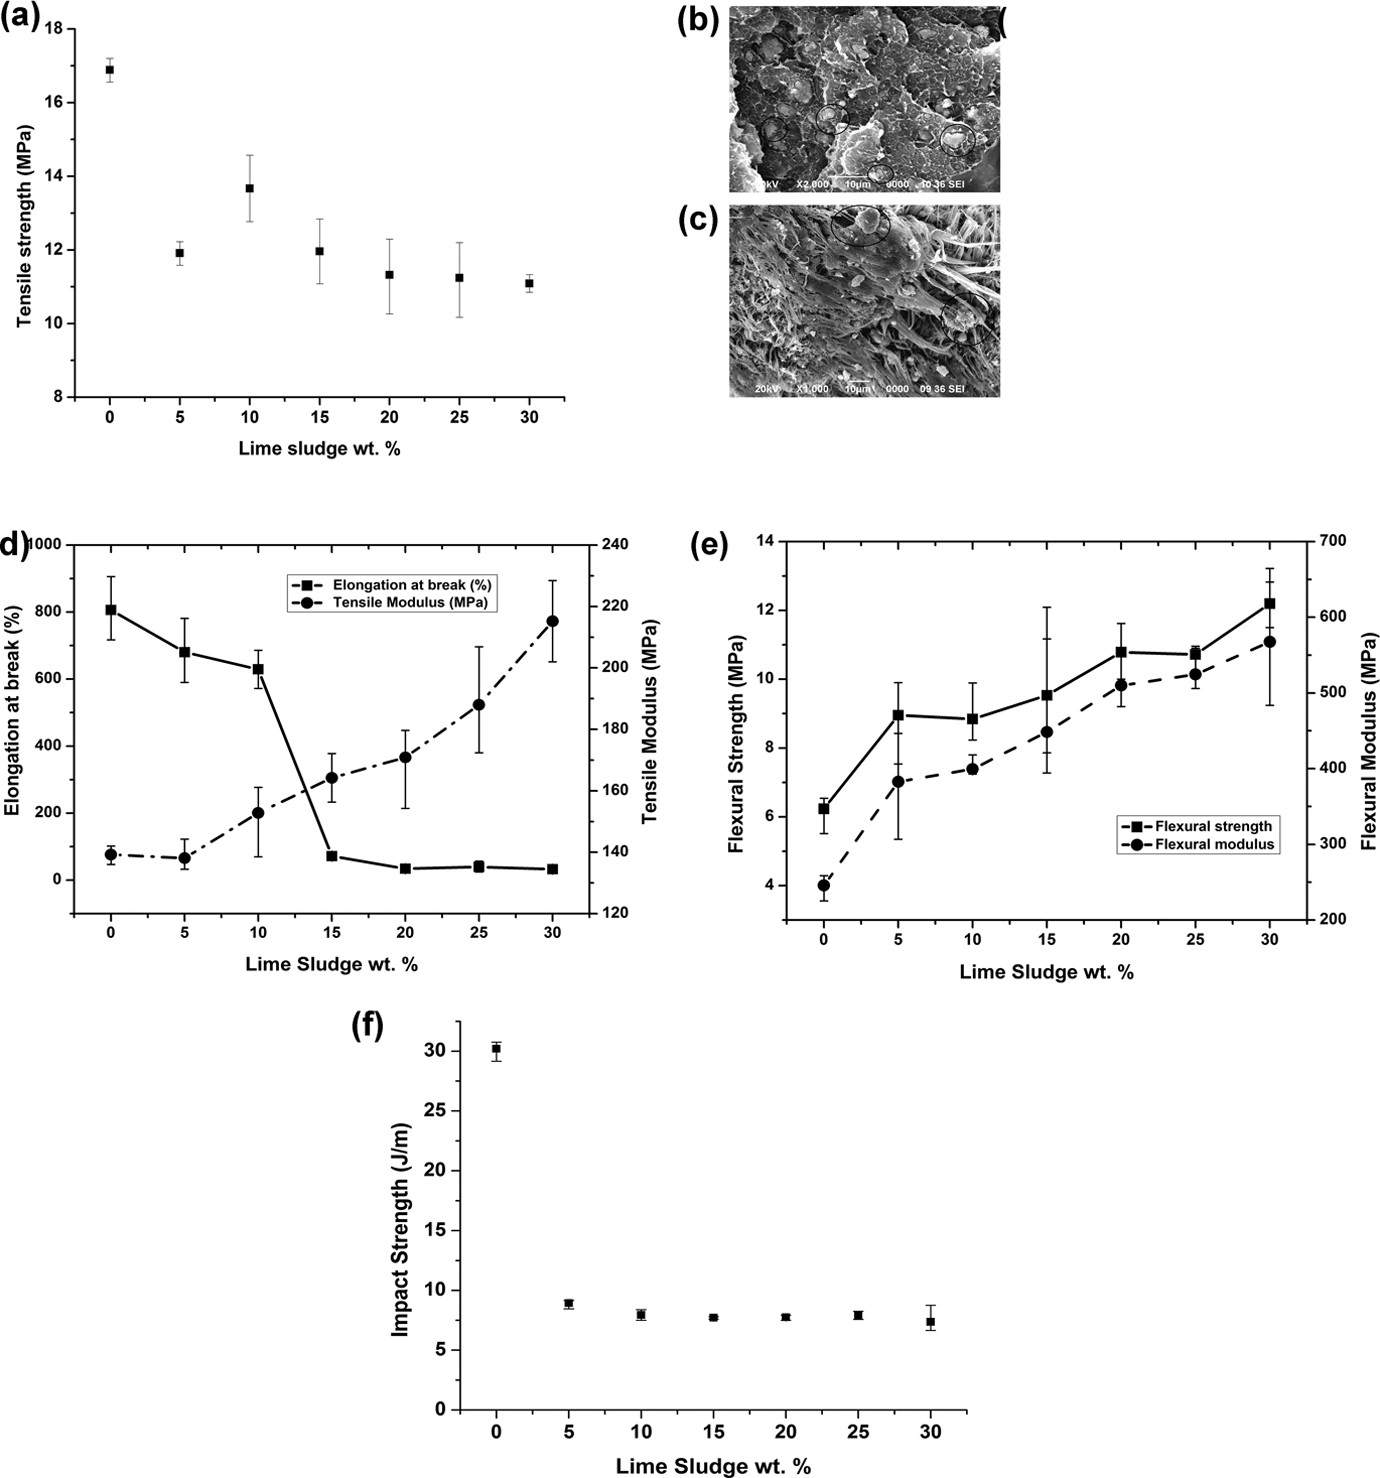
(a) Variation in tensile strength of composites with increasing LS filler loading, (b) fractured surface of 10 wt% LS–HDPE composite, (c) fractured surface of 30 wt% LS–HDPE composite, (d) variation in tensile modulus and elongation at break, (e) flexural strength and modulus, and (f) impact strength with increasing LS filler loading. LS: lime sludge; HDPE: high-density polyethylene.
Tensile modulus
A significant increment in the elastic modulus of composites with increasing filler content is observed, as compared to the lower modulus of pure HDPE. The variation in tensile modulus with increasing filler loading is shown in Figure 4(d). There is a rise in the elastic modulus from 139.6 MPa for pure polymer to 215.2 MPa for 30 wt% LS-filled HDPE composite. This increasing trend is similar to that obtained by Atikler et al. 29 which revealed that Young’s modulus for 30 wt% pure CaCO3-filled HDPE increased significantly when compared that that of HDPE alone. In the present case, the increase in Young’s modulus for 30 wt% LS-filled HDPE composite is about 1.5 times the value for pure HDPE, thus indicating that LS particles provide more rigidity to the composites than pure CaCO3. Since the modulus is measured before any significant plastic deformation took place, it is independent of the filler–matrix interactions, thereby making the effects of particulate shape and specific surface area immaterial in the measurement of elastic modulus. The rise in the elastic modulus is largely attributed due to the following reasons—(a) replacement of the fully polymeric HDPE matrix with parts of rigid particulate fillers and (b) introduction of a mechanical restraint due to the restriction in deformation provided by the addition of particulate filler.
Elongation at break
It is observed that the elongation at break decreased significantly with increasing filler content which is characteristic of particulate-reinforced thermoplastic composites as shown in Figure 4(d). The decrement in the elongation at break (806% for pure polymer to 32.8% for 30 wt% LS-filled HDPE composite) is due to the low elongation of filler that restricts the flow of polymer molecules past one another. This indicates that the mode of failure changes from ductile to brittle behavior. Rigidity of particulate fillers, filler agglomeration at 30 wt% LS-filled composite, and deformation at selected stress concentration sites at filler–matrix boundary may be attributed to lower elongation at break. Atikler et al. 29 also obtained a similar trend in the elongation % for CaCO3-filled HDPE composite, wherein the elongation at break % decreased from a value greater than 1000% for pure HDPE to that less than 100% for 30 wt% CaCO3-filled HDPE composite.
Flexural strength
Figure 4(e) shows increasing order of flexure strength with increasing filler loading (6.2 MPa for pure polymer to 12.2 MPa for 30 wt% LS-filled HDPE composite) which confirms that LS acts as a better reinforcement under flexure loading conditions. This indicates better stress transfer between the matrix and filler particles under bending stresses. The increment in flexure strength also indicated better surface properties for LS-filled composites since the flexural properties are sensitive to the surface of specimens. This is in conformation with the observed literature that the flexural properties of composites increase with increasing loading of rigid particulate fillers in a polymeric matrix. 11,32
Flexural modulus
As shown in Figure 4(e), incorporation of rigid particulate filler such as LS improved the stiffness of the polymeric composites which resulted in an almost linear increment of flexural modulus (245.7 MPa for pure polymer to 567.5 MPa for 30 wt% LS-filled HDPE composite) similar to the tensile modulus. Higher concentration of rigid particulate materials demands higher stress for the same amount of deformation and hence the increase in the flexural modulus. Additionally, flexural modulus of composites is found to be lower than its tensile counterparts, the reason being the presence of excess polymer on the surface as a result of the restriction imposed by the mold walls during molding of the composites. Since the surface of specimens is at maximum stress during flexural analysis, the properties of the surfaces are emphasized more in this case, unlike tensile testing, where the bulk properties of the specimen in the tensile direction are exposed.
Izod impact strength
Parameters such as toughness properties of reinforcement, the nature of the interfacial region, and the matrix fracture highly influence the impact strength of a composite. 33 As shown in Figure 4(f), it is observed that the impact properties decreased with the introduction of filler materials as compared to the pure HDPE samples. It is a well-known fact that the highest stiffness composites (high modulus of elasticity) exhibit the lowest impact resistance since high stress is transferred from the polymeric matrix to the filler particles. 34,35 The particulate fillers act as points of stress concentration and anisotropic particle orientation throughout the composite restricts plastic deformation, thereby causing embrittlement of the composite. Upon impact, the crack propagates to the interfacial regions and the material fails in a manner brittle as it cannot plastically deform. However, a very low variation of impact strength was observed with increasing filler weight fractions.
It is observed that industrial LS waste used as filler in HDPE provides comparable mechanical properties to pure CaCO3-filled HDPE composites. Additionally, the rigid LS particles provide better rigidity within the elastic limit than pure CaCO3 thus increasing the Young’s modulus even more. Increment in tensile modulus, flexural strength, and modulus justifies LS as not only filler but also as a reinforcing agent in HDPE composites. Hence, industrial LS waste may be used in a polymeric matrix which would increase the viability of an industrial waste and decrease the cost of the composites without much compromise in the mechanical properties.
Thermal properties of the composites
The thermal properties of three composites (10 LS HDPE, 20 LS HDPE, and 30 LS HDPE) are studied in comparison with pure HDPE samples.
The DSC analysis
The DSC measurements are conducted in order to determine the thermal properties such as melting temperature (T m), onset melting temperature (T on), heat of fusion (H m), heat of crystallization (H c), degree of crystallinity, onset crystallization temperature (T con), and peak crystallization temperature (T c). From the recorded heating and cooling curves for these composites as shown in Figure 5(a) and (b), respectively, the thermal properties are calculated and tabulated as shown in Table 2. The percentage of crystallinity (χc) in pure HDPE and its composites is calculated based on the formula provided by Liu et al. 36 as shown in Equation (1):
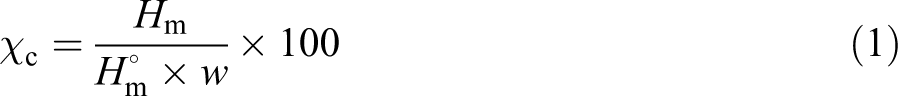
where
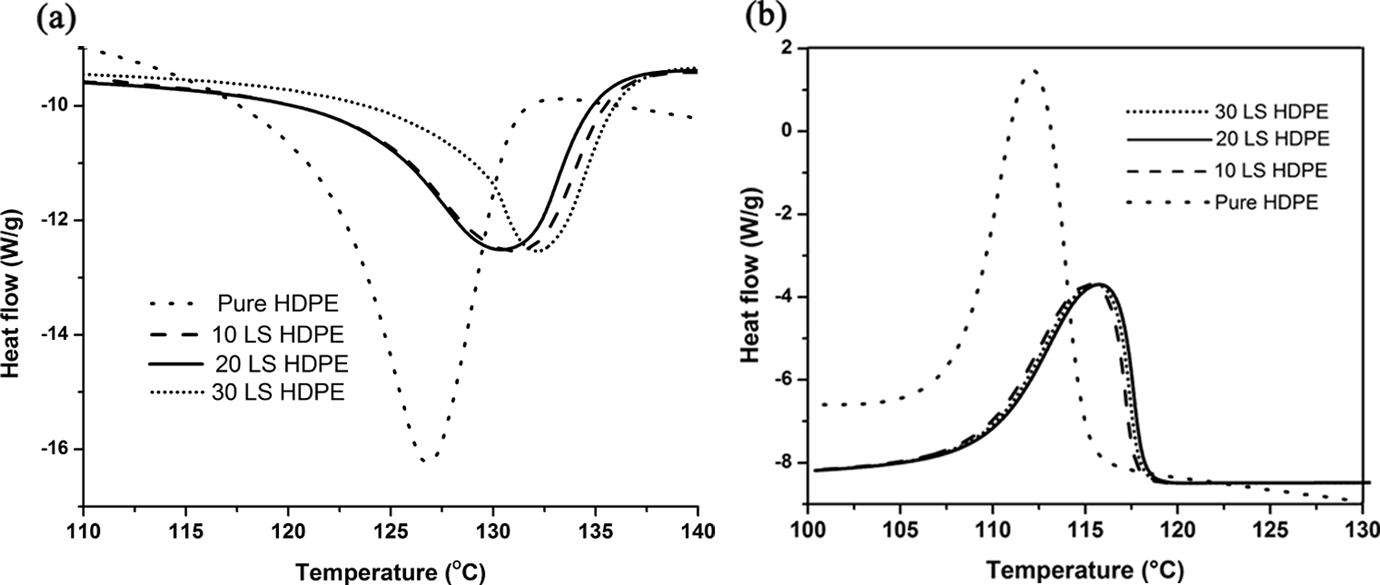
(a) The DSC thermogram during heating cycle for LS–HDPE composites and pure HDPE. (b) The DSC thermogram during cooling cycle for LS–HDPE composites and pure HDPE. DSC: differential scanning calorimetry; LS: lime sludge; HDPE: high-density polyethylene.
The DSC results (heating and cooling) of pure HDPE and LS–HDPE composites.
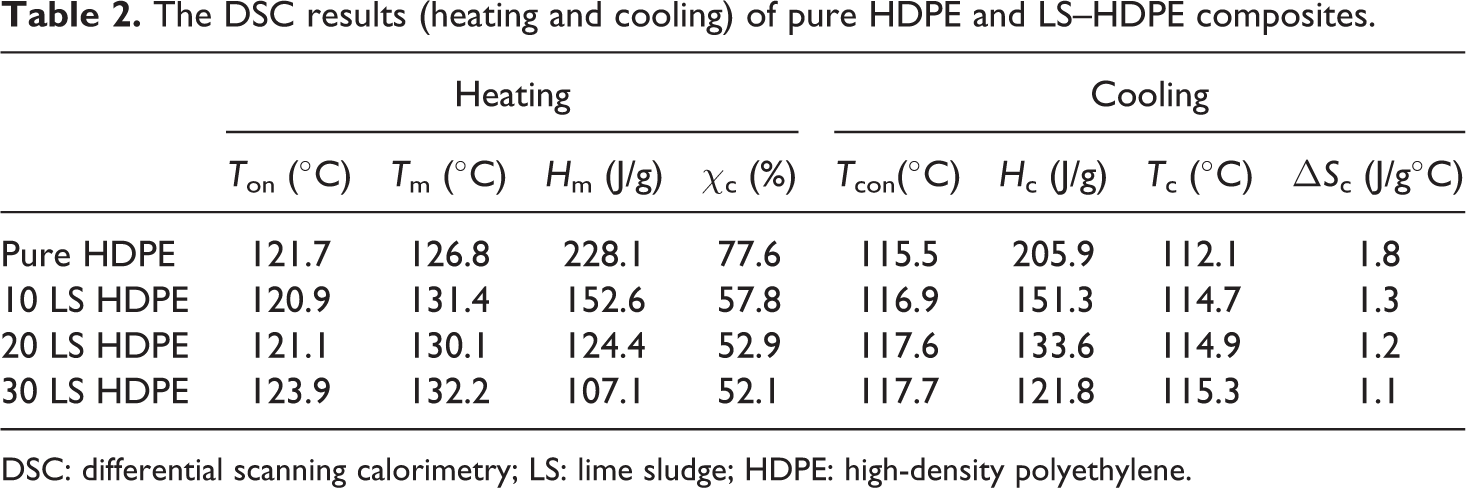
DSC: differential scanning calorimetry; LS: lime sludge; HDPE: high-density polyethylene.
It is observed that there is a slight increment in the melting temperatures and the onset melting temperatures of the composites with the addition of the LS filler in the composites. The onset melting temperature increased from 121.7°C to 123.9°C and the melting temperature increased from 126.8°C to 132.2°C with the addition of filler. The melting enthalpy decreased with the increasing loading of filler content indicating the required heat to melt the polymeric composite decreased. This translates into money and power savings during extrusion and molding of polymeric composite fabrication. 38 It is also observed that the crystallization peak temperatures also increased with the increasing addition of LS filler (from 113.3°C to 115.3°C) indicating that LS could act as a nucleating agent, thus increasing the crystallization temperature of HDPE. It is a well-known fact that one of the significant effects of particulate fillers on the crystallinity of semi-crystalline polymers is their capability to act as nucleating agents. 32,39,40 However, calculation of the percentage crystallinity of pure HDPE and each of the composites (10, 20, and 30 wt% filled LS) reveals that percentage crystallinity decreased with the addition of increasing filler loading. Hence, it is evident that in the present case, LS particles reduce the conformational changes available to the polymer macromolecules during crystallization. CaCO3 present in LS restricts the macromolecular ability, thereby reducing the spaces available for the polymeric macromolecules to arrange themselves according to statistical thermodynamics. 38,41
The LS-induced restriction in the movement of polymer chain segments and depletion of the free spaces available for the macromolecules to occupy them retards crystal growth. 42 This reduction in the conformational changes can be attributed to the decrease in the entropy of crystallization (ΔS c) given in equation 2:
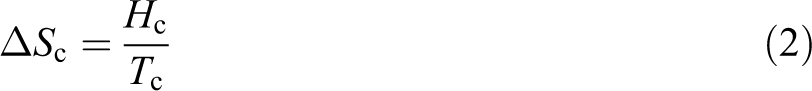
where H c is the crystallization enthalpy and T c is the peak crystallization temperature. As seen in Table 2, it is evident that ΔS c decreased with increasing LS filler loading which may be attributed to the high content of CaCO3 present in the LS which reduces the free volume/freedom available to the macromolecules (retarding crystal growth). 29 –31 The decrease in crystallinity index also indicates lesser heat required for melting during extrusion and molding, thus contributing to power saving and financial benefits. Herein, values of ΔS c denote the reduction in the degree of freedom available for the movement of macromolecules contributing to crystal growth. From the thermal analysis, it is evident that there are two contrasting properties exhibited by the polymeric composites due to the addition of CaCO3-rich LS—(a) acting as nucleating agent and (b) crystal growth retarders. 42 In this case, it is evident that the effect of LS as a crystal growth retarder far surpasses its ability to act as nucleating agent. Hence, a decrease in the degree of crystallinity with increasing filler loading is observed.
The TG analysis
Thermal parameters such as thermal degradation, onset temperature, temperature at the maximum rate of weight loss, and % residual weight left at 600°C are used in order to conduct comparative analysis of thermal decomposition between LS and HDPE composites and pure HDPE.
The TG analysis is conducted in order to study the thermal stability of LS-filled HDPE composites in comparison with pure HDPE. The TGA (wt% vs. temperature) and DTG (derivative of wt% vs. temperature) thermograms are plotted as shown in Figure 6(a) and (b), respectively. The results calculated from the thermograms for each composition of composites and pure HDPE are tabulated as shown in Table 3. From the thermograms, it is observed that the thermal stability of the composites increased with increasing weight percentage of LS in the HDPE matrix. This is evident from the fact that the onset temperature for thermal degradation (T on) increased from 429.4°C for pure HDPE to 448.3°C for 30 wt% LS-filled HDPE composites. Additionally, the temperature at which maximum weight loss % (T max) also increased with increasing LS percentage in the composites indicating that the initial degradation product is the polymer, while further degradation in the composites are absorbed by the LS, thus increasing the temperature of the point of maximum degradation. This is also confirmed by the amount of residual weight percent of material left at 600°C which increased from 0.7 for pure HDPE to 21.6 for 30 LS HDPE.
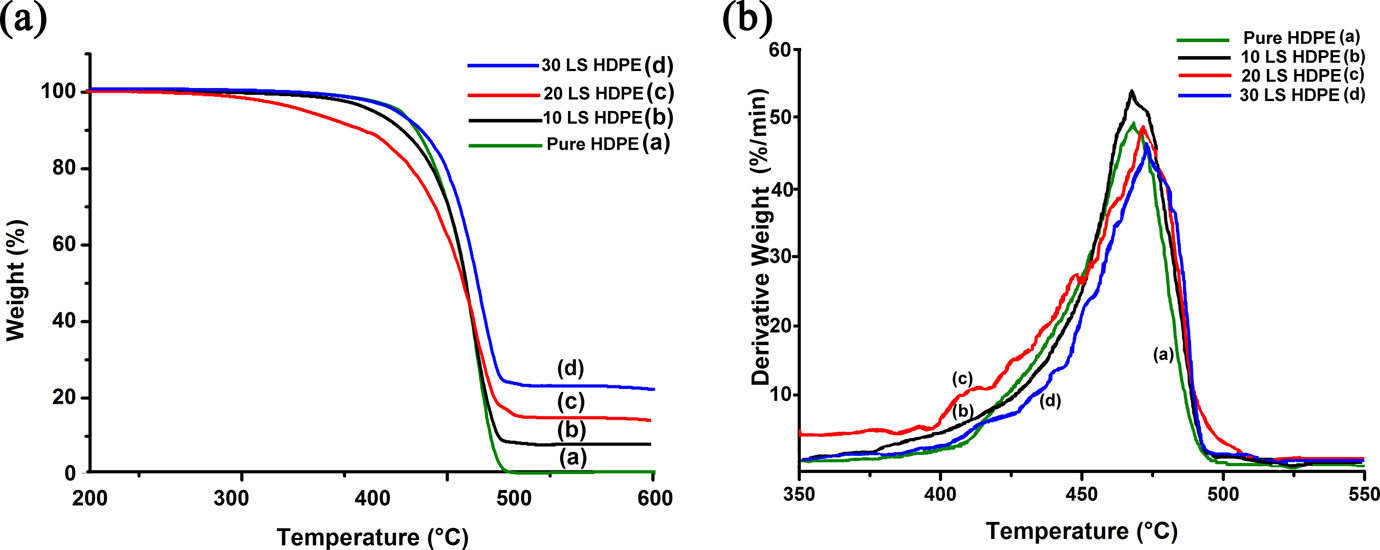
(a) The TGA plot for lime sludge–HDPE composites and pure HDPE. (b) The SEM micrograph of 10 LS HDPE sample at the fractured portion of the tensile test specimen. TGA: thermogravimetric analysis; LS: lime sludge; HDPE: high-density polyethylene; SEM: scanning electron microscopy.
The TGA results of pure HDPE and LS–HDPE composites.
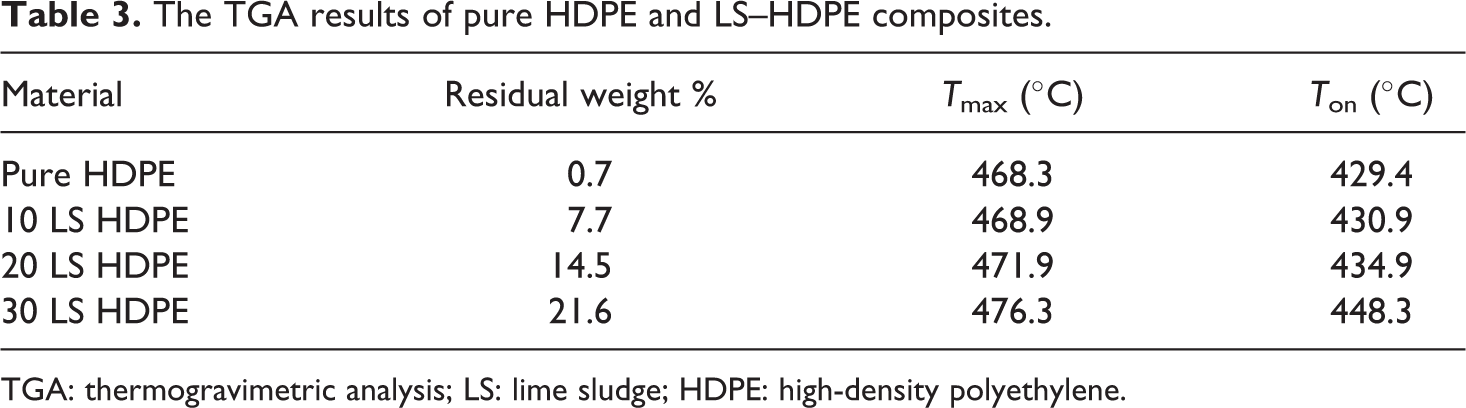
TGA: thermogravimetric analysis; LS: lime sludge; HDPE: high-density polyethylene.
Morphological analysis of the composites
Effective dispersion of the filler in a polymeric matrix and bonding at the filler–matrix interface are two prime parameters affecting the mechanical properties of polymeric composites. As observed from the micrograph of LS particles in Figure 1, the average size of a LS powder particle is approximately 2 μm. Figure 7(a)–(c) shows the secondary electron micrographs of the three composites—10 LS HDPE, 20 LS HDPE, and 30 LS HDPE, respectively, obtained at the elongated fractured portion of the respective tensile test specimens. It is observed that with increasing amount of LS in the composite, the tendency of the filler particles to agglomerate also increased. The particle dispersion and size are uniform in 10 LS HDPE and 20 LS HDPE composites when compared with 30 LS HDPE (Figure 7(c)) where particle agglomeration is observed. Figure 7(c) shows that for 30 wt% LS-filled HDPE composite, the LS particle size is approximately 10 μm which indicates agglomeration of particles. This is in conformation with the fact that the tensile strength decreased for 30 LS HDPE composite due to poor particle dispersion and higher filler particle size which increased the stress concentrations at localized regions causing embrittlement of the composite. Dewetting due to debonding of the filler and matrix at the interface is clearly evident from the micrographs. It is also observed that LS particles fell out of the matrix at isolated locations creating voids. This condition of poor adhesion between the filler and matrix is in correlation with the fact that the tensile strength of pure polymer was higher than that of the composites as debonding occurred due to the nonadherence of filler particles to the matrix. Thus, the filler particles are unable to handle the stress upon loading leading to lower tensile strength observed in polymeric composites.
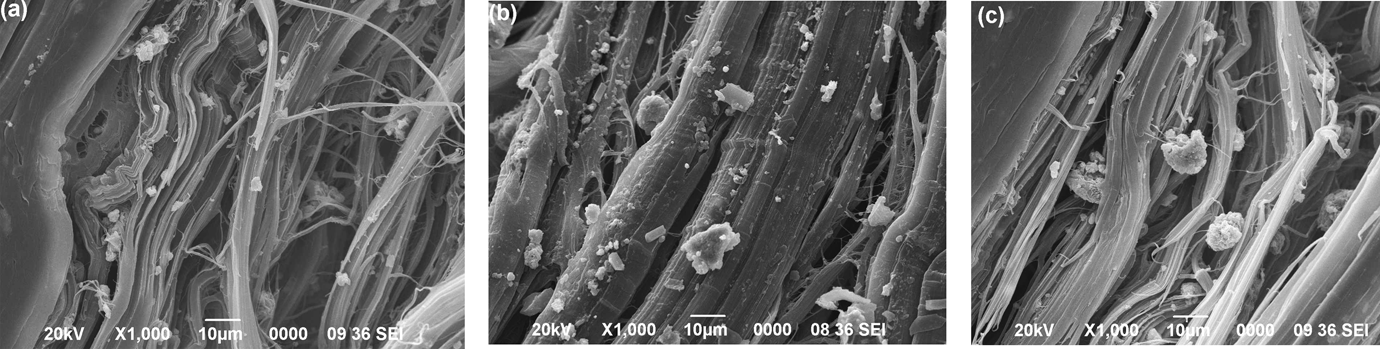
(a) The SEM micrograph of 20 LS HDPE sample at the fractured portion of the tensile test specimen. (b) The SEM micrograph of 30 LS HDPE sample at the fractured portion of the tensile test specimen. (c) The SEM micrograph of 30 LS HDPE sample at the fractured portion of the tensile test specimen. LS: lime sludge; HDPE: high-density polyethylene; SEM: scanning electron microscopy.
Conclusion
This study revealed that LS industrial waste is an attractive option to be used as reinforcing filler in polymeric composites. This will enhance the functionality and commercial viability of both the filler and the polymer by (a) usage of LS waste as filler and (b) decreasing the manufacturing cost of polymer composites. Low particle size, higher thermal stability, and mechanical rigidity provided by LS in a polymeric composite in addition to its wide scale availability makes it an ideal filler to produce elastically rigid composites with superior thermal properties and flexural properties at a reduced cost. Results revealed that addition of LS in HDPE matrix significantly increased the tensile and flexural modulus which can be attributed to increased stiffness due to the addition of rigid particulate fillers providing mechanical restraint to deformation. Additionally, the flexural strength also increased indicating better stress transfer between filler and matrix under bending stresses. Thermal stability of the composites increased with the addition LS filler which can be attributed to the increase in onset temperature of thermal degradation, melting temperature, and residual weight percent with the increase in filler content in the composites. Thus, the use of LS filler in HDPE matrix can enhance various mechanical and thermal properties, in addition to decreasing the cost of polymeric composite, reduce pollution, and increase the functionality of an industrial waste.
Footnotes
Acknowledgements
The first author would like to thank the Department of Science and Technology Scientific and Engineering Research Board (DST-SERB), Govt. of India, for providing the funding for this research vide SERB Project No: SB/FTP/ETA-88/2013.
Declaration of Conflicting Interests
The author(s) declared no potential conflict of interest with respect to the research, authorship, and/or publication of this article.
Funding
The author(s) received no financial support for the research, authorship, and/or publication of this article.