
Abstract
Polypropylene (PP) and polylactic acid were blended in the ratio 80:20 by weight and compatibilized with 3 wt% of maleic anhydride-grafted-PP. The compatibilized blend was chosen as the base matrix for reinforcement with halloysite nanotubes (HNTs). The nanotube content varied from 0 to 10 wt%. Blend and the nanocomposites were prepared by melt mixing technique. Dielectric analysis of the base matrix and the nanocomposites was carried out using interdigitated electrode sensor in a DEA 288 Epsilon-dielectric analyser. The dielectric properties of the composites were measured at temperatures from 30 to 120°C at various frequencies ranging from 1 Hz to 1 kHz. Permittivity values slightly decreased as the HNT content increased from 0 to 2 wt%. It increased at 4 wt% of HNT and again slightly decreased at 6 wt% of HNT, and with further increase in HNT (HNT 8 and HNT 10) led to increase in permittivity values. Loss factor values decreased slightly as the HNT content in the composites increased from 0 to 4 wt%; but with further increase in HNT, the loss factor showed a sharp increase. Loss tangent (tan δ) values decreased up to 4 wt% of HNT (HNT 4) and then increased up to 8 wt% (HNT 8) of HNT and then decreased slightly (for HNT 10). Analysing the different dielectric properties, consistent properties were shown by 6 wt% of HNT similar to static and dynamic mechanical properties. The analysis showed that the composites can be utilized in microelectronic devices or in microelectronic packaging applications.
Introduction
Halloysite nanotubes (HNTs)-reinforced polymer nanocomposites are gaining extensive popularity both from academic and industrial sectors due to their improved mechanical, thermal, electrical and fire-retardant properties. 1 The unique features of HNTs such as nanoscale lumens, high length to diameter (L/D) ratio, low hydroxyl group density on the surface and high-temperature resistance are some of the reasons behind its widespread usage in various application sectors. 2 Moreover, HNTs are abundantly available in the nature; they are environmental friendly and biocompatible, and hence find applications in the biomedical field, alone as well as with various polymer matrices. 3,4 Structurally HNTs are very similar to kaolin type of clay with an empirical chemical formula Al2Si2O5(OH)4·H2O and possess a tubular structure. 3 The length of individual HNT ranges from 0.2 to 2 μm. The inner and outer diameters of individual tube are of the order of 10–40 nm and 40–70 nm, respectively, which give them a unique feature of very high aspect ratio of 10 to 50. 4,5 HNTs were used as a reinforcing filler for almost all commercial polymer matrices, resulting in improvements in their performance properties. 6 –17
Various characterization techniques such as infrared and Raman spectroscopy, differential scanning calorimetry, thermogravimetric analysis, dynamic mechanical analysis (DMA), mechanical properties, rheological properties, X-ray diffraction analysis, scanning electron microscopy (SEM), transmission electron microscopy and atomic force microscopy are utilized for exploring the properties of nanofiller–polymer interactions in polymer nanocomposites. 18 However, there are only very few reported literature on the characterization of nanocomposites by dielectric analysis (DEA). 19 –24 DEA provides valuable insights about the dielectric properties of materials such as ion conductivity; loss factor; permittivity and tan δ as a function of time, temperature and frequency. Here, a material is subjected to an oscillating electrical field, and the information regarding capacitive and conductive properties is elucidated from the response of the material. The dielectric permittivity, also known as dielectric constant refers to the ability of the material to store electrical charge. It indicates the easiness of aligning dipoles present in the material under the applied electric field. 25,26 Loss factor indicates the energy required to align the dipoles and move the ions present in the material when the material is in the glassy state (below glass transition temperature (T g)). 25 Above T g, the loss factor of the material is related to the ionic conductivity of the applied frequency. Ionic conductivity is related to the viscosity of the material and particularly important in monitoring the curing behaviour of thermosets. The dissipation factor, tan δ, is the ratio of loss factor to permittivity and is analogous to mechanical tan δ obtained from DMA. 25 Dielectric properties arise due to the response of dipoles present in the materials towards the applied electromagnetic field. 27 These properties can be correlated to the chemical structure, polarity, conformation, packing and interaction of molecules within the material on a molecular level. 28 As a result of this, the rheological properties and molecular relaxations happening in polymer blends and composites can be easily explored. 28,29 Also, these studies provide valuable information about the processing aspects and morphological development in polymer nanocomposites. 27 Exploring the dielectric properties of materials is also important in the research and development activities related to manufacture of electrodes for batteries, fuel cells, sensors, super capacitors, microelectronic packaging materials for high-frequency devices and so on. 30
In the present investigation, polypropylene (PP) was blended with polylactic acid (PLA) in the ratio 80:20 and compatibilized by the addition of 3 wt% of maleic anhydride-grafted-PP (MA-g-PP) as a compatibilizer. A detailed description of the preparation of this compatibilized blend can be seen elsewhere. 31 This blend was selected as the matrix for reinforcement by the addition of HNTs. Mechanical and dynamical mechanical analyses of the composites were carried out. The DEA of the nanocomposites was carried out to find the effect on permittivity, loss factor and tan δ as a function of temperature and frequency. To the best of our knowledge, the dielectric properties of HNT-reinforced nanocomposites of PP and PLA are reported for the first time.
Materials and experimental methods
Materials
PP (PP 500P, SABIC, Melt Flow Rate (MFR) – 3 g/10 min, 230°C, 2.16 kg load) was provided by SABIC (YANSAB; http://www.yansab.com.sa/en/), Yanbu, Kingdom of Saudi Arabia. PLA (PLA, PURAPOL L100IXS, MFR – 50 g/10 min, 210°C, 2.16 kg load) used in the study, a homopolymer of
Composite preparation
The nanocomposites were prepared by melt mixing technique using Haake Polylab Rheomix 600P (ThermoFisher, USA) equipped with roller rotors. The temperature for mixing was set as 190°C and the rotor speed was 60 r/min. PP and PLA were introduced first to the chamber, melted and mixed well for 1 min, and then the compatibilizer (MA-g-PP) was added followed by HNTs and mixed thoroughly. The total mixing time was 5 min for the blends and 7 min for the nanocomposites. HNT content in the composite varied from 0 to 10 wt%, and the resulting composites were designated as mentioned in Table 1.
Designation of nanocomposites.
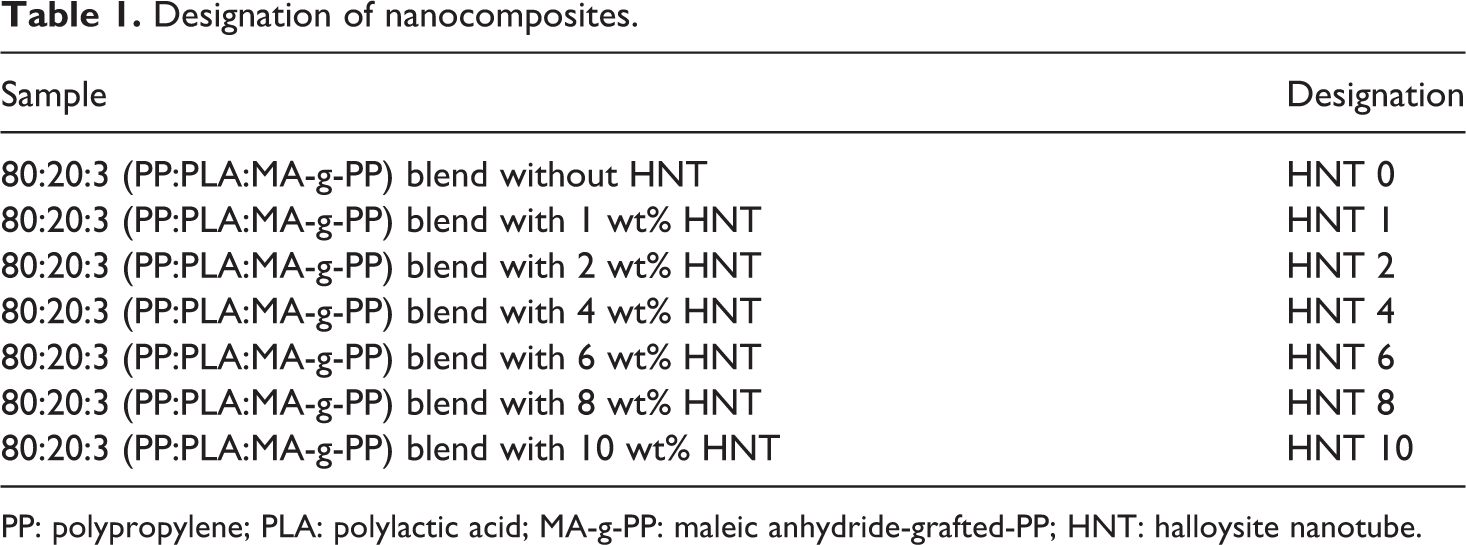
PP: polypropylene; PLA: polylactic acid; MA-g-PP: maleic anhydride-grafted-PP; HNT: halloysite nanotube.
Mechanical properties
The mechanical properties were obtained using universal testing machine (Zwick ProLine Z010TN, ThermoFisher, USA) at 25 ± 20°C according to American Society for Testing Materials (ASTM) D638. Five specimens were tested for each sample and the average values of tensile strength, tensile modulus and elongation at break were reported.
Dynamic mechanical analysis
The dynamic mechanical properties (viscoelastic properties) of the composites were measured using a Triton Technology-Dynamic Mechanical Analysis (TTDMA) (Triton Technology Ltd, UK). Rectangular samples of dimension 15 × 10 × 4 (length × width × thickness) were tested in three-point bending mode at a constant frequency of 1 Hz. The temperature varied from −40°C to +12°C at a rate of 3°C/min. The viscoelastic properties such as storage modulus, loss modulus and loss tangent (tan δ) were obtained against the temperature.
Dielectric analysis
DEA of the composite samples was performed using DEA 288 Epsilon (Netzsch-GMBH) dielectric analyser equipped with a DEA furnace. The sensor used was interdigitated comb-type electrode sensor. Rectangular sample of dimension 25 mm × 12.5 mm × 3 mm was placed on the sensor surface and kept inside the furnace. The sample was fastened tight on the sensor surface using Kapton adhesive tape. This step ensured excellent contact of the sample with the sensor surface. The test was carried out at 1 Hz to 1 kHz over a temperature range of 30–120°C.
Results and discussion
Static mechanical properties
Blends of PP and PLA in the ratio 80:20 compatibilized with 3 wt% of compatibilizer (MA-g-PP) were chosen as the matrix for reinforcement with HNT based on their optimum set of mechanical properties. The mechanical properties of the nanocomposites with varying amounts of HNT are given in Table 2. The incorporation of HNT did not result in an improvement in tensile strength of the resulting nanocomposite up to an HNT wt% of 4, as evident from their tensile strength values. When the HNT content reached 6 wt%, the tensile strength showed an appreciable increase from 39 MPa to 43 MPa of the base matrix. Further increase in HNT addition (8 and 10 wt %) resulted in a decrease in the tensile strength values. Tensile modulus showed a slight decrease with 1 wt% of HNT addition to the base matrix but showed a steady improvement with a further increase in HNT content up to 6 wt% of HNT. The value increased to 1992 MPa of the base matrix, compared with 1865 MPa. Further increase in HNT addition (8 and 10 wt %) resulted in a decrease in the modulus values. Elongation at break values remains more or less same throughout the entire compositions, whereas at 6 wt% of HNT, its value was same as that of the base matrix. This indicates that the flexibility of the matrix is unchanged even with 6 wt% of nanofiller loading. From these results, it can be concluded that 6 wt% of HNT is sufficient to improve the mechanical properties and it can be considered as the optimum loading of nanofiller to the base matrix.
Mechanical properties of nanocomposites.a
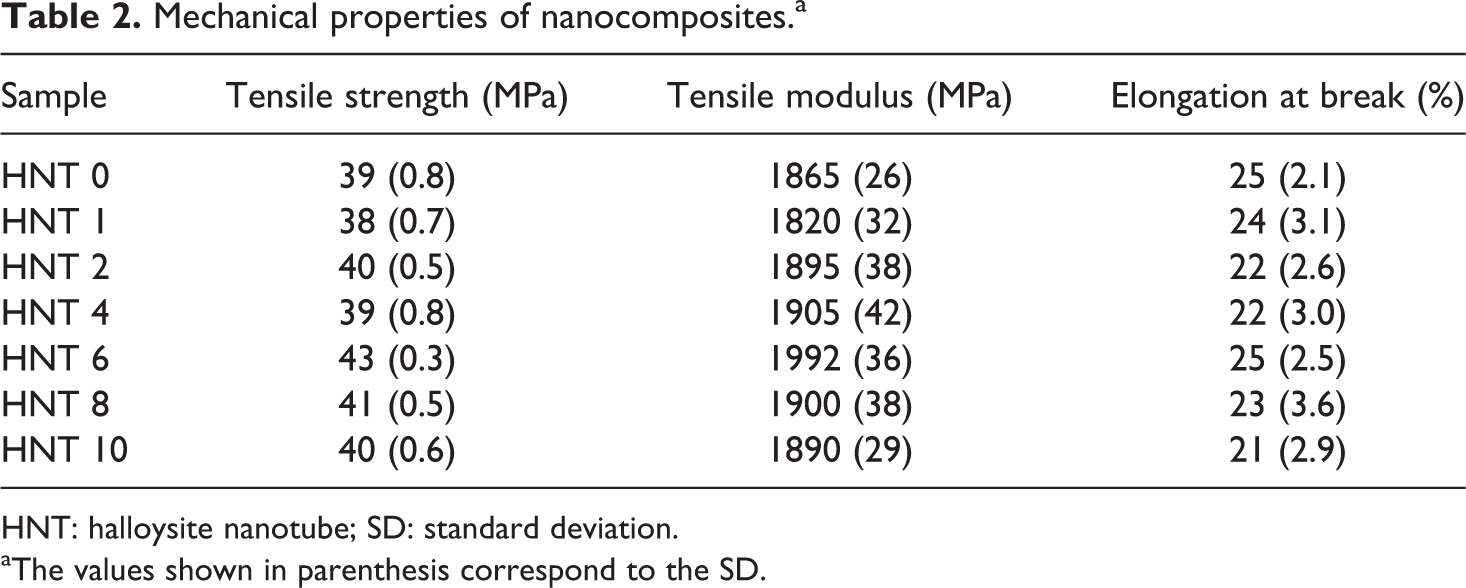
HNT: halloysite nanotube; SD: standard deviation.
aThe values shown in parenthesis correspond to the SD.
DMA of nanocomposites
The storage modulus traces of the nanocomposites are shown in Figure 1. From the curves, it is clear that the highest modulus is exhibited by HNT 6 (with 6 wt% of HNT). The tan δ traces for the nanocomposites (Figure 2) clearly showed two peaks corresponding to PP and PLA. The parameters obtained from these figures are summarized in Table 3. From Table 3, it can be clearly seen that the T g of PP remained almost same in the entire composition range, whereas the T g of PLA showed a step-wise increment with an increase in the wt% of HNT. It reached a maximum value of 74.55°C for HNT 6 (6 wt% of HNT). The increase in T g of PLA with the addition of HNT was reported by Liu et al. 11 and it was attributed to the hydrogen bonding interactions between HNT and PLA. The modulus value for HNT 6 was 1773 MPa, which is also the highest among all the nanocomposites investigated. Hence, the optimum loading of HNT for improving the mechanical properties of the blend matrix is 6 wt%.
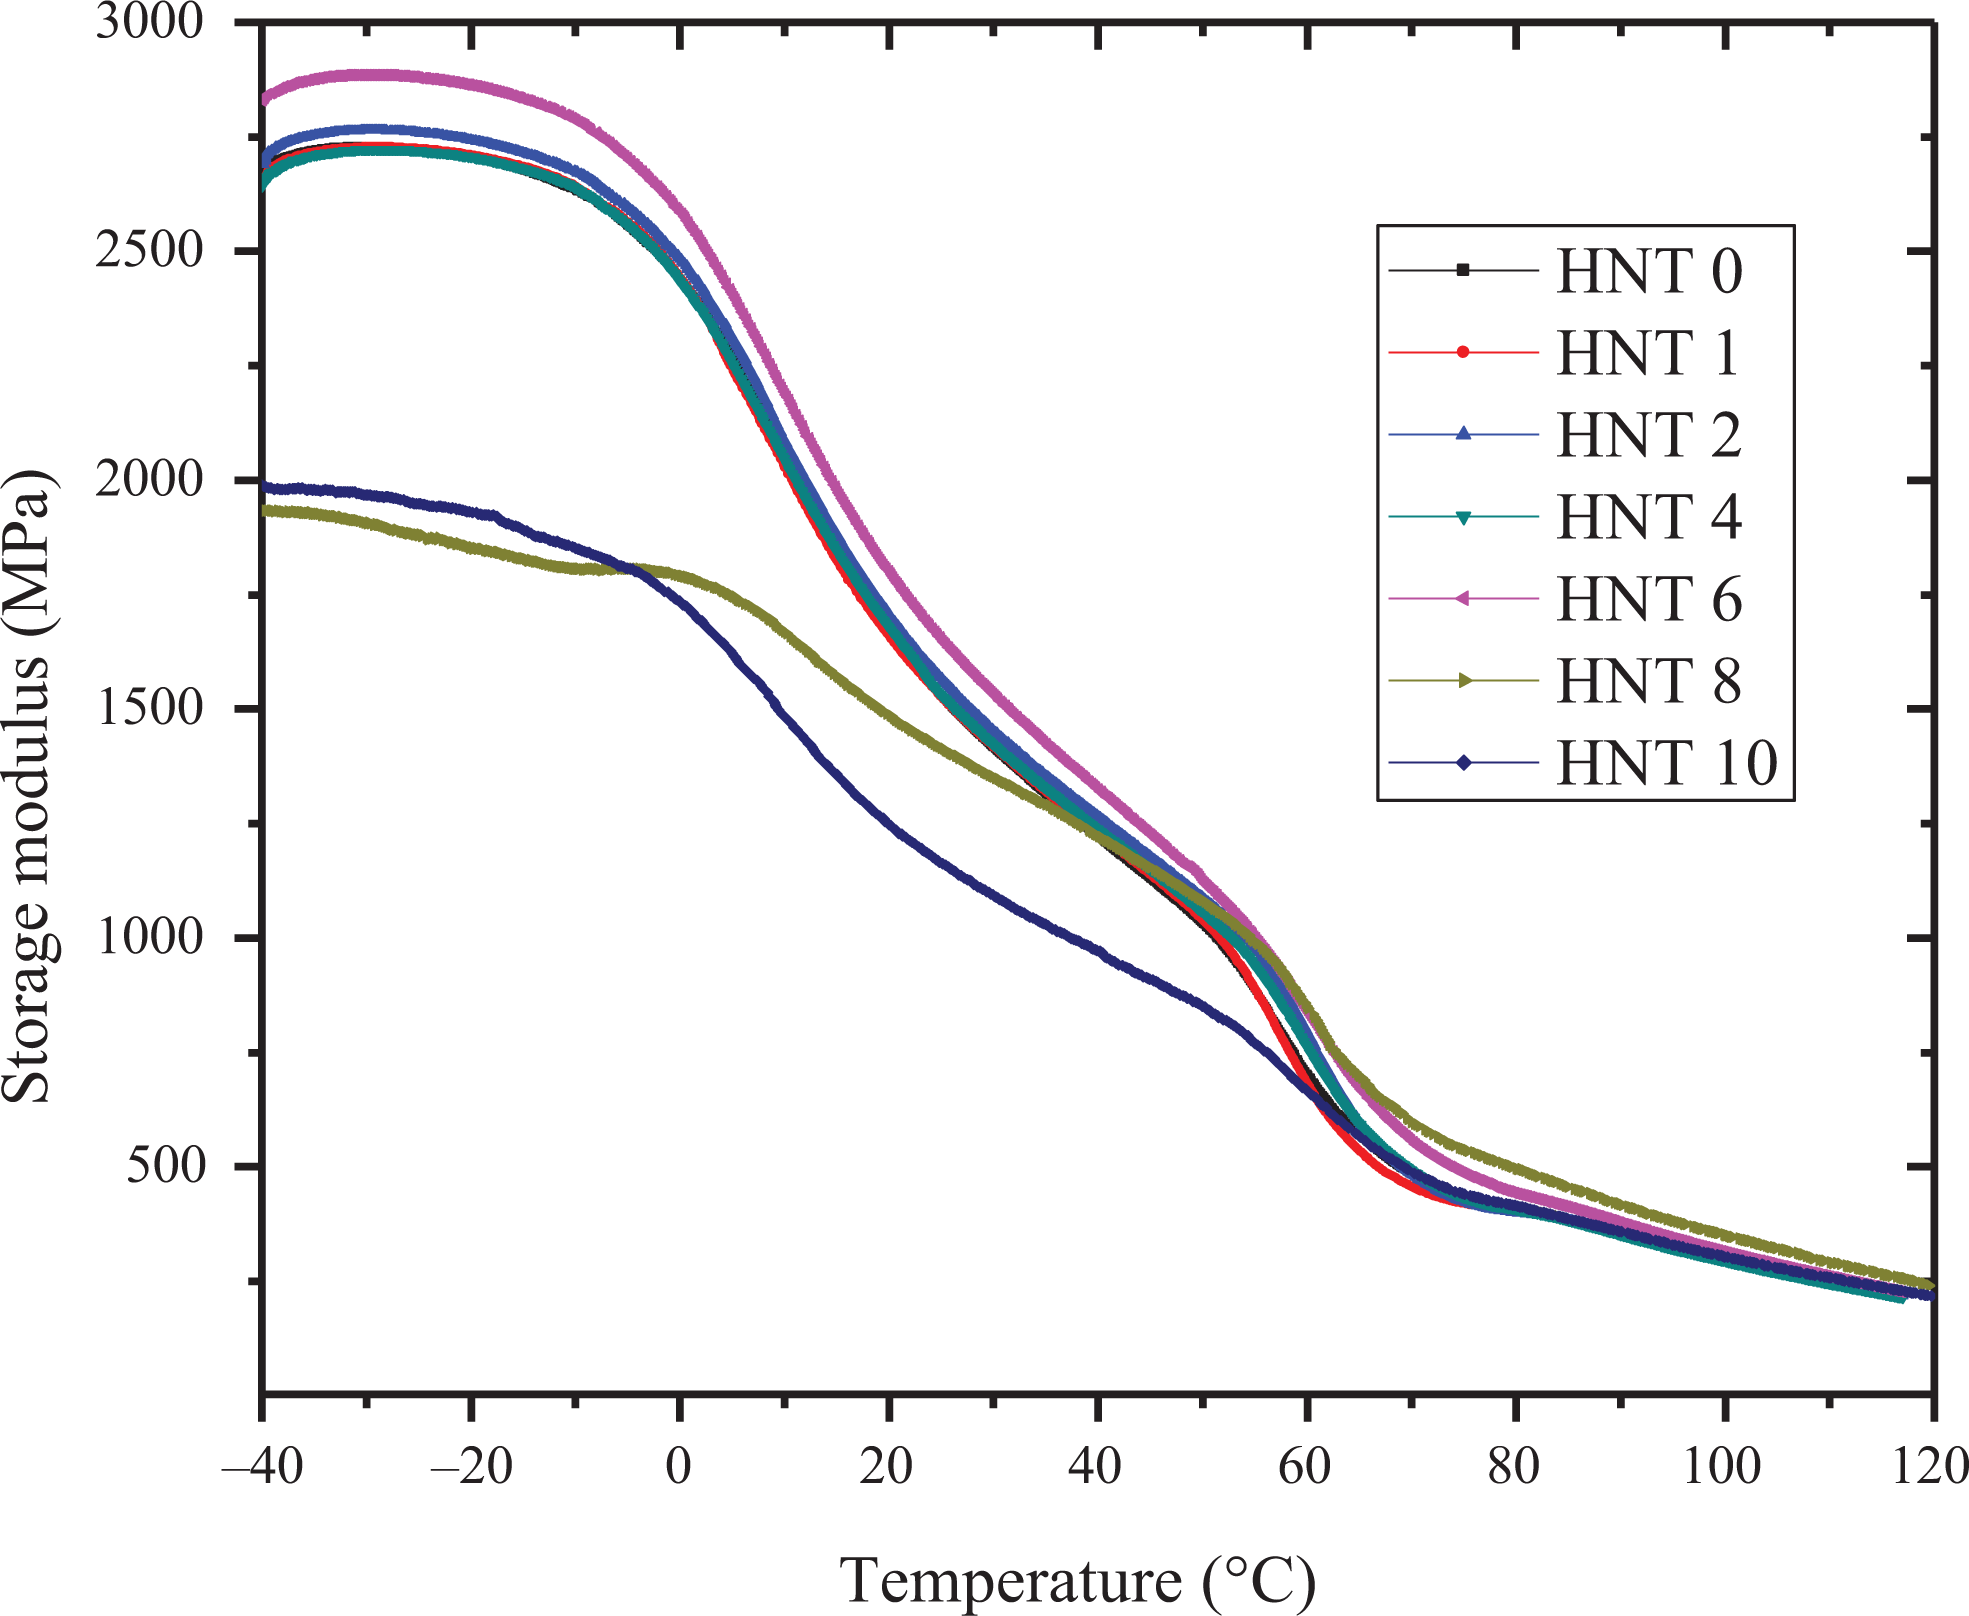
Storage modulus traces of nanocomposites.
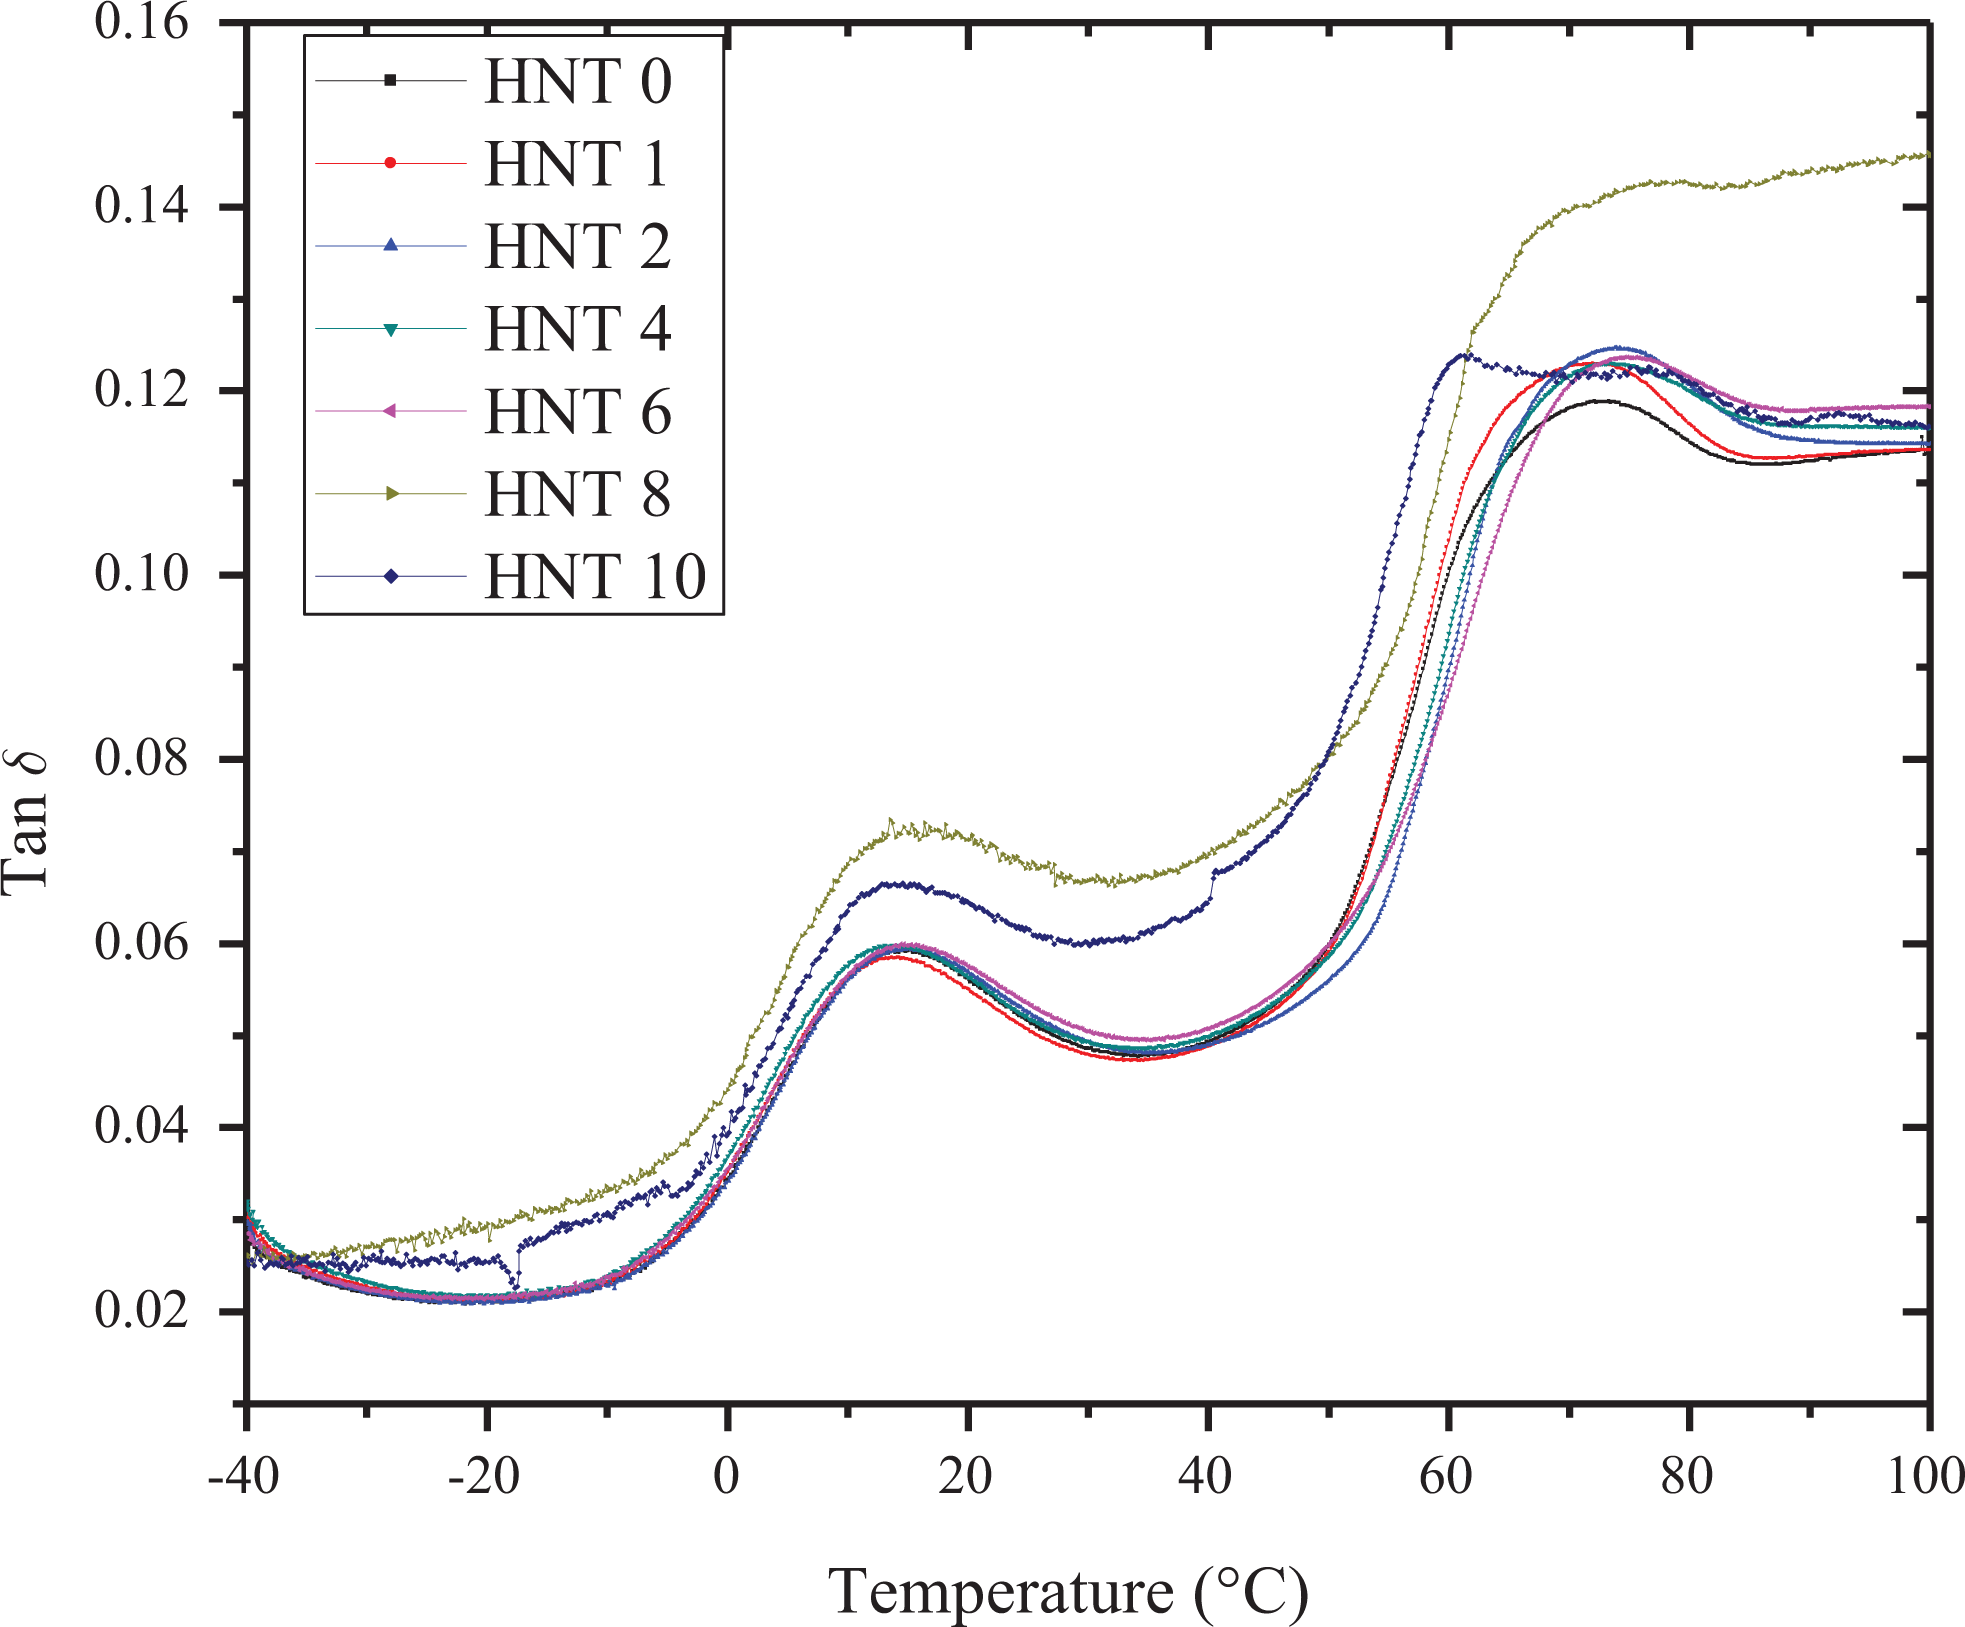
Tan δ curves for the nanocomposites.
Storage modulus and T g of the nanocomposites.
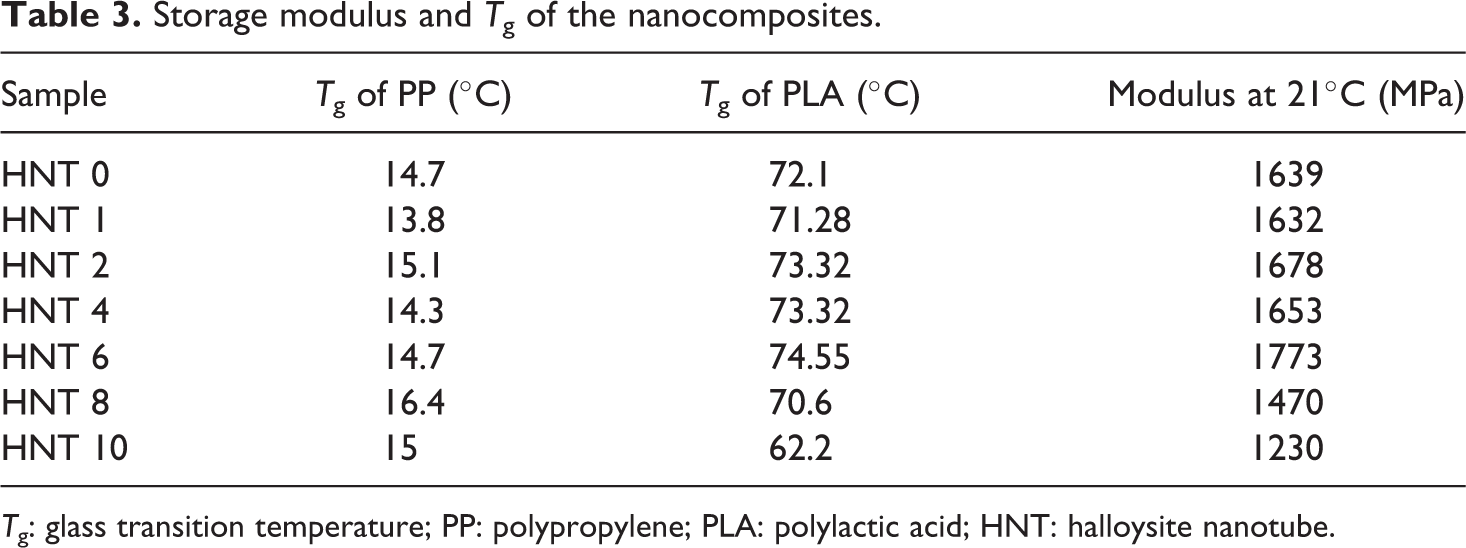
T g: glass transition temperature; PP: polypropylene; PLA: polylactic acid; HNT: halloysite nanotube.
Permittivity analysis
Permittivity curves of the compatibilized blend without HNT (HNT 0) as a function of temperature and frequency are shown in Figure S1 (in Online Supplemental information). At a frequency of 1 Hz and at a temperature of 30°C, the permittivity of the blend matrix was almost 1. As the temperature increased, the permittivity slowly increased and reached almost 3 at a temperature of 120°C. This shows that blending non-polar PP with polar PLA imparts some polarity to the resulting blend system. For non-polar polymers, the permittivity remains almost unchanged with temperature, but for polar polymers, the permittivity increases with an increase in temperature. 19 Similar observations was also reported by Wong et al. 32 in acrylate composites reinforced by graphite. As the frequency increased from 1 Hz to 1 kHz, the permittivity values decreased in the lower temperature range and all the curves followed the same trend as that of 1 Hz at higher temperatures. Online Supplemental Figures S2 to S4 present the permittivity curves for the nanocomposites with 1 to 10 wt% of HNT, respectively. For all the composites, the effect of temperature and frequency on the permittivity followed the same trend as that of the base matrix (HNT 0). As the frequency increased from 1 Hz to 1 kHz, the permittivity values decreased sharply at all temperature ranges. This can be attributed to the fact that the dipoles present in the material are unable to follow the field variations at high frequencies. As the frequency increased, it very rapidly led to the intermittent reversal of the electric field and the excess ion diffusion in the direction of the field becomes nil. As a result, the polarization due to charge accumulation becomes very low and the permittivity values tend to be on the lower side. 30 Similar observations were made by Yang et al. in polyethene composites reinforced with vapour grown carbon nanofibers. 19 Figure 3 shows the effect of increasing HNT content in the composites on permittivity values measured at 40°C and 1 Hz frequency. It can be seen that the permittivity value slightly decreased as the HNT content increased from 0 to 2 wt%, but it increased at 4 wt% of HNT and again slightly decreased at 6 wt% of HNT and showed an increasing trend with further increase in HNT (HNT 8 and HNT 10). Polymers with very low permittivity are especially useful in microelectronic packaging applications to minimize the capacitive coupling effects and to reduce the signal delay. 33
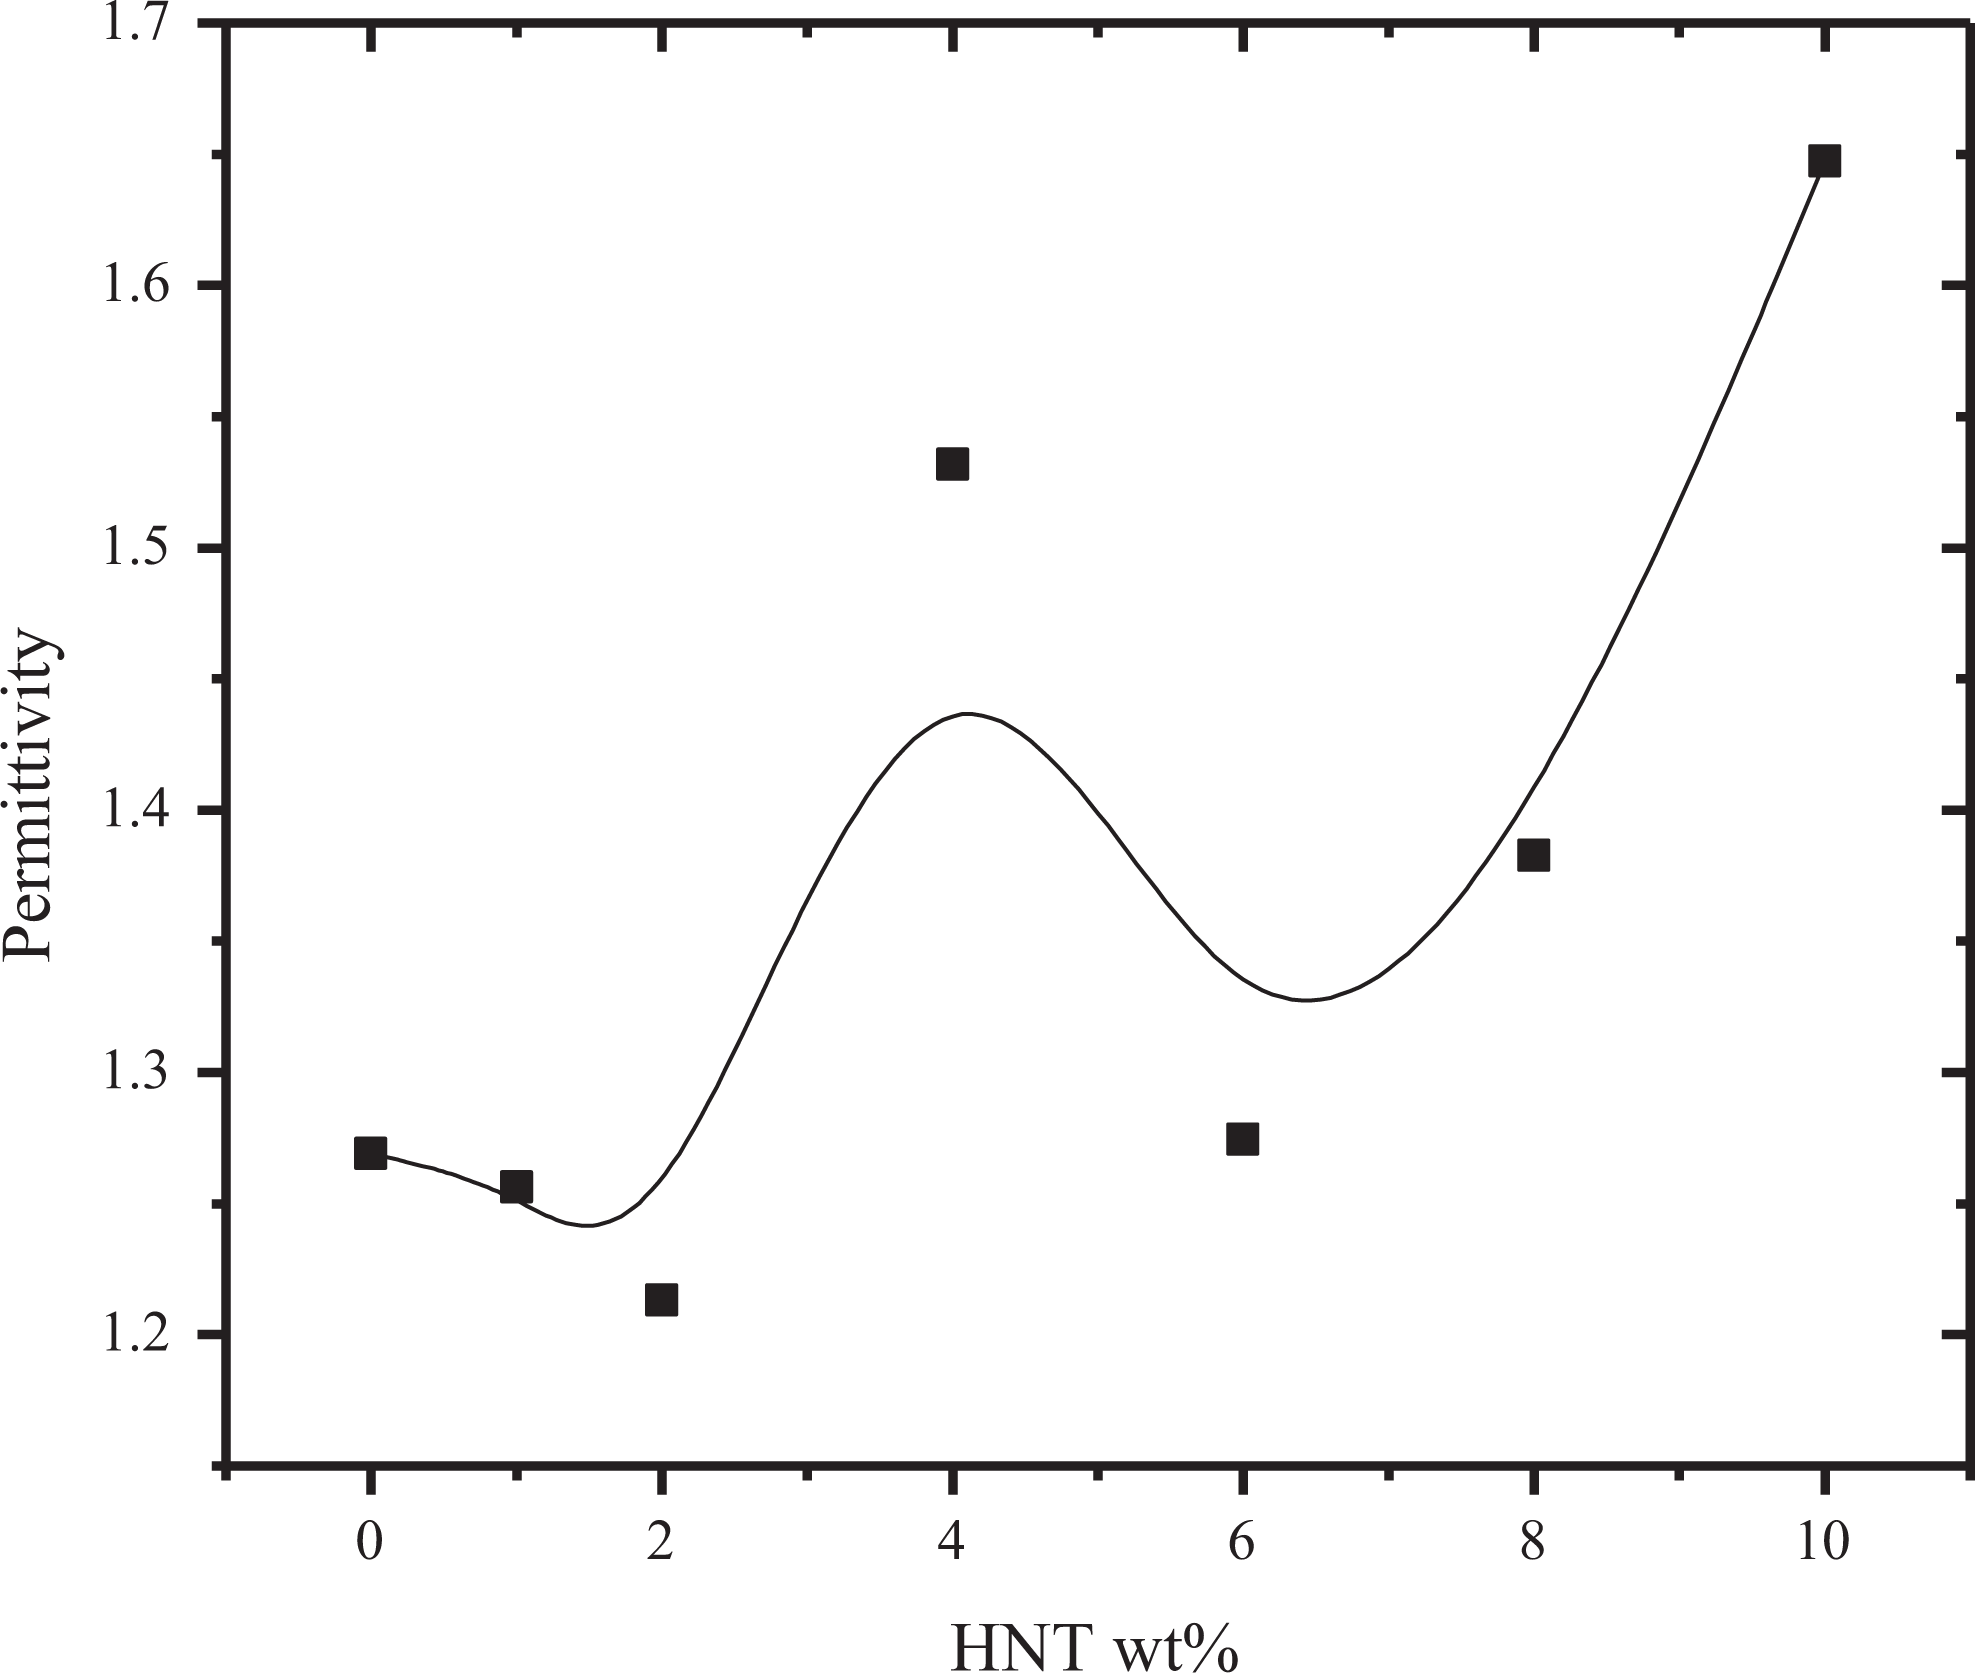
Permittivity at 40°C and 1 Hz for the composites with increasing HNT content. HNT: halloysite nanotube.
Loss factor analysis
Loss factor curves for the compatibilized blend without HNT (HNT 0) as a function of temperature and frequency are shown in Online Supplemental Figure S5. The loss factor values lie in between 0 and 2.6. For frequencies of 1 to 10 Hz, peak values for loss factor are in between 60 and 80°C, which may be correlated to the molecular relaxation process occurring in the PLA phase in the compatibilized blend. During relaxation process, the change in the dipole moment becomes more noticeable, which leads to peaks in loss factor and tan δ in both DMA and DEA. 27 Loss factor versus temperature and frequency for the composites (HNT 1 to HNT 10) are shown in Online Supplemental Figures S6 to S8. The curves showed a similar trend as that of base matrix except for HNT 8. For HNT 8, the loss factor in the lower temperature region (below 40°C) showed very high values. The variation in loss factor with HNT content in the nanocomposites at a temperature of 40°C and at a frequency of 1 Hz is shown graphically in Figure 4. As the HNT content in the composites increased from 0 to 4 wt%, the loss factor decreased slightly, but with further increase in HNT, the loss factor showed a sharp increase.
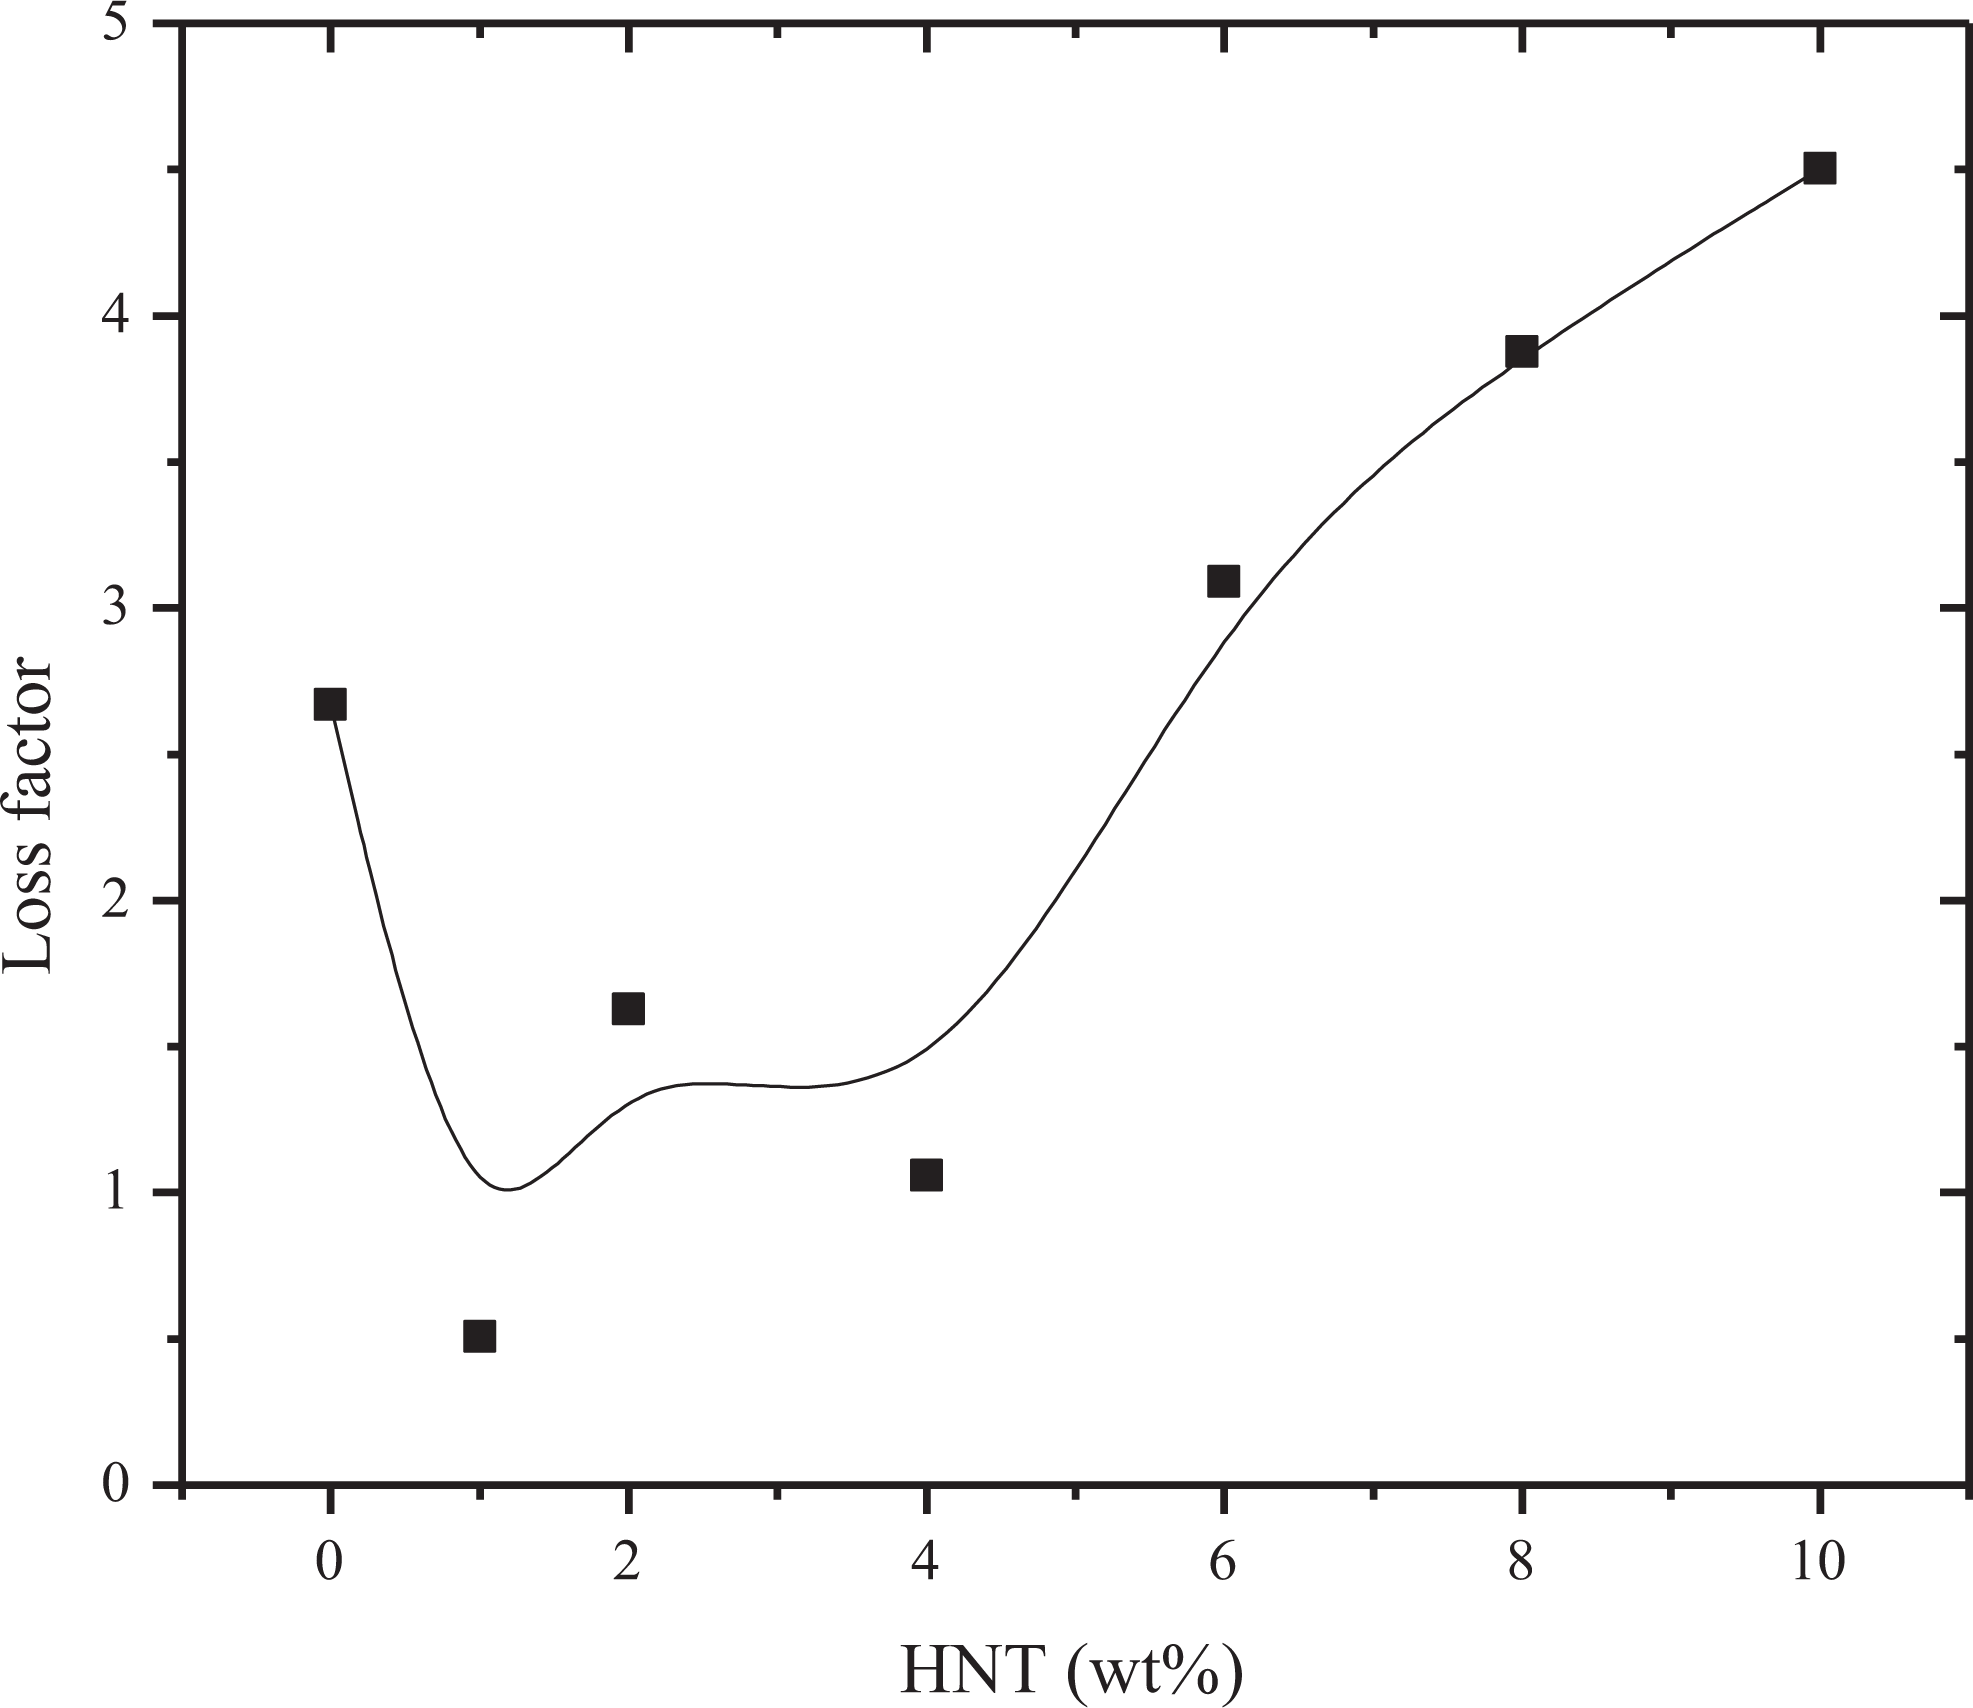
Loss factor at 40°C and 1 Hz for the composites with increasing HNT content. HNT: halloysite nanotube.
Analysis of loss tangent (tan δ) or dissipation factor
Loss tangent (tan δ) is calculated by dividing the loss factor with the relative permittivity. It is a measurement of the ratio of dielectric energy loss to energy storage in an intermittent field. 19 Loss tangent measurements are extremely important for materials intended for microelectronic packaging applications, where low values of loss tangent reduce signal attenuation. 33 The variation in loss tangent (tan δ) with the temperature at a frequency of 10 Hz for all the composites (HNT 0 to HNT 10) is shown in Figure 5. The loss tangent values are well below 1, and a peak can be seen between 60 and 80°C for all the curves which can be attributed to the T g of PLA in the matrix. The variation in tan δ with HNT content at frequencies of 1 and 10 Hz is shown in Figure 6. The common observation is that the tan δ values decreased up to HNT 4 and then increased up to HNT 8 and then decreased slightly (for HNT 10).
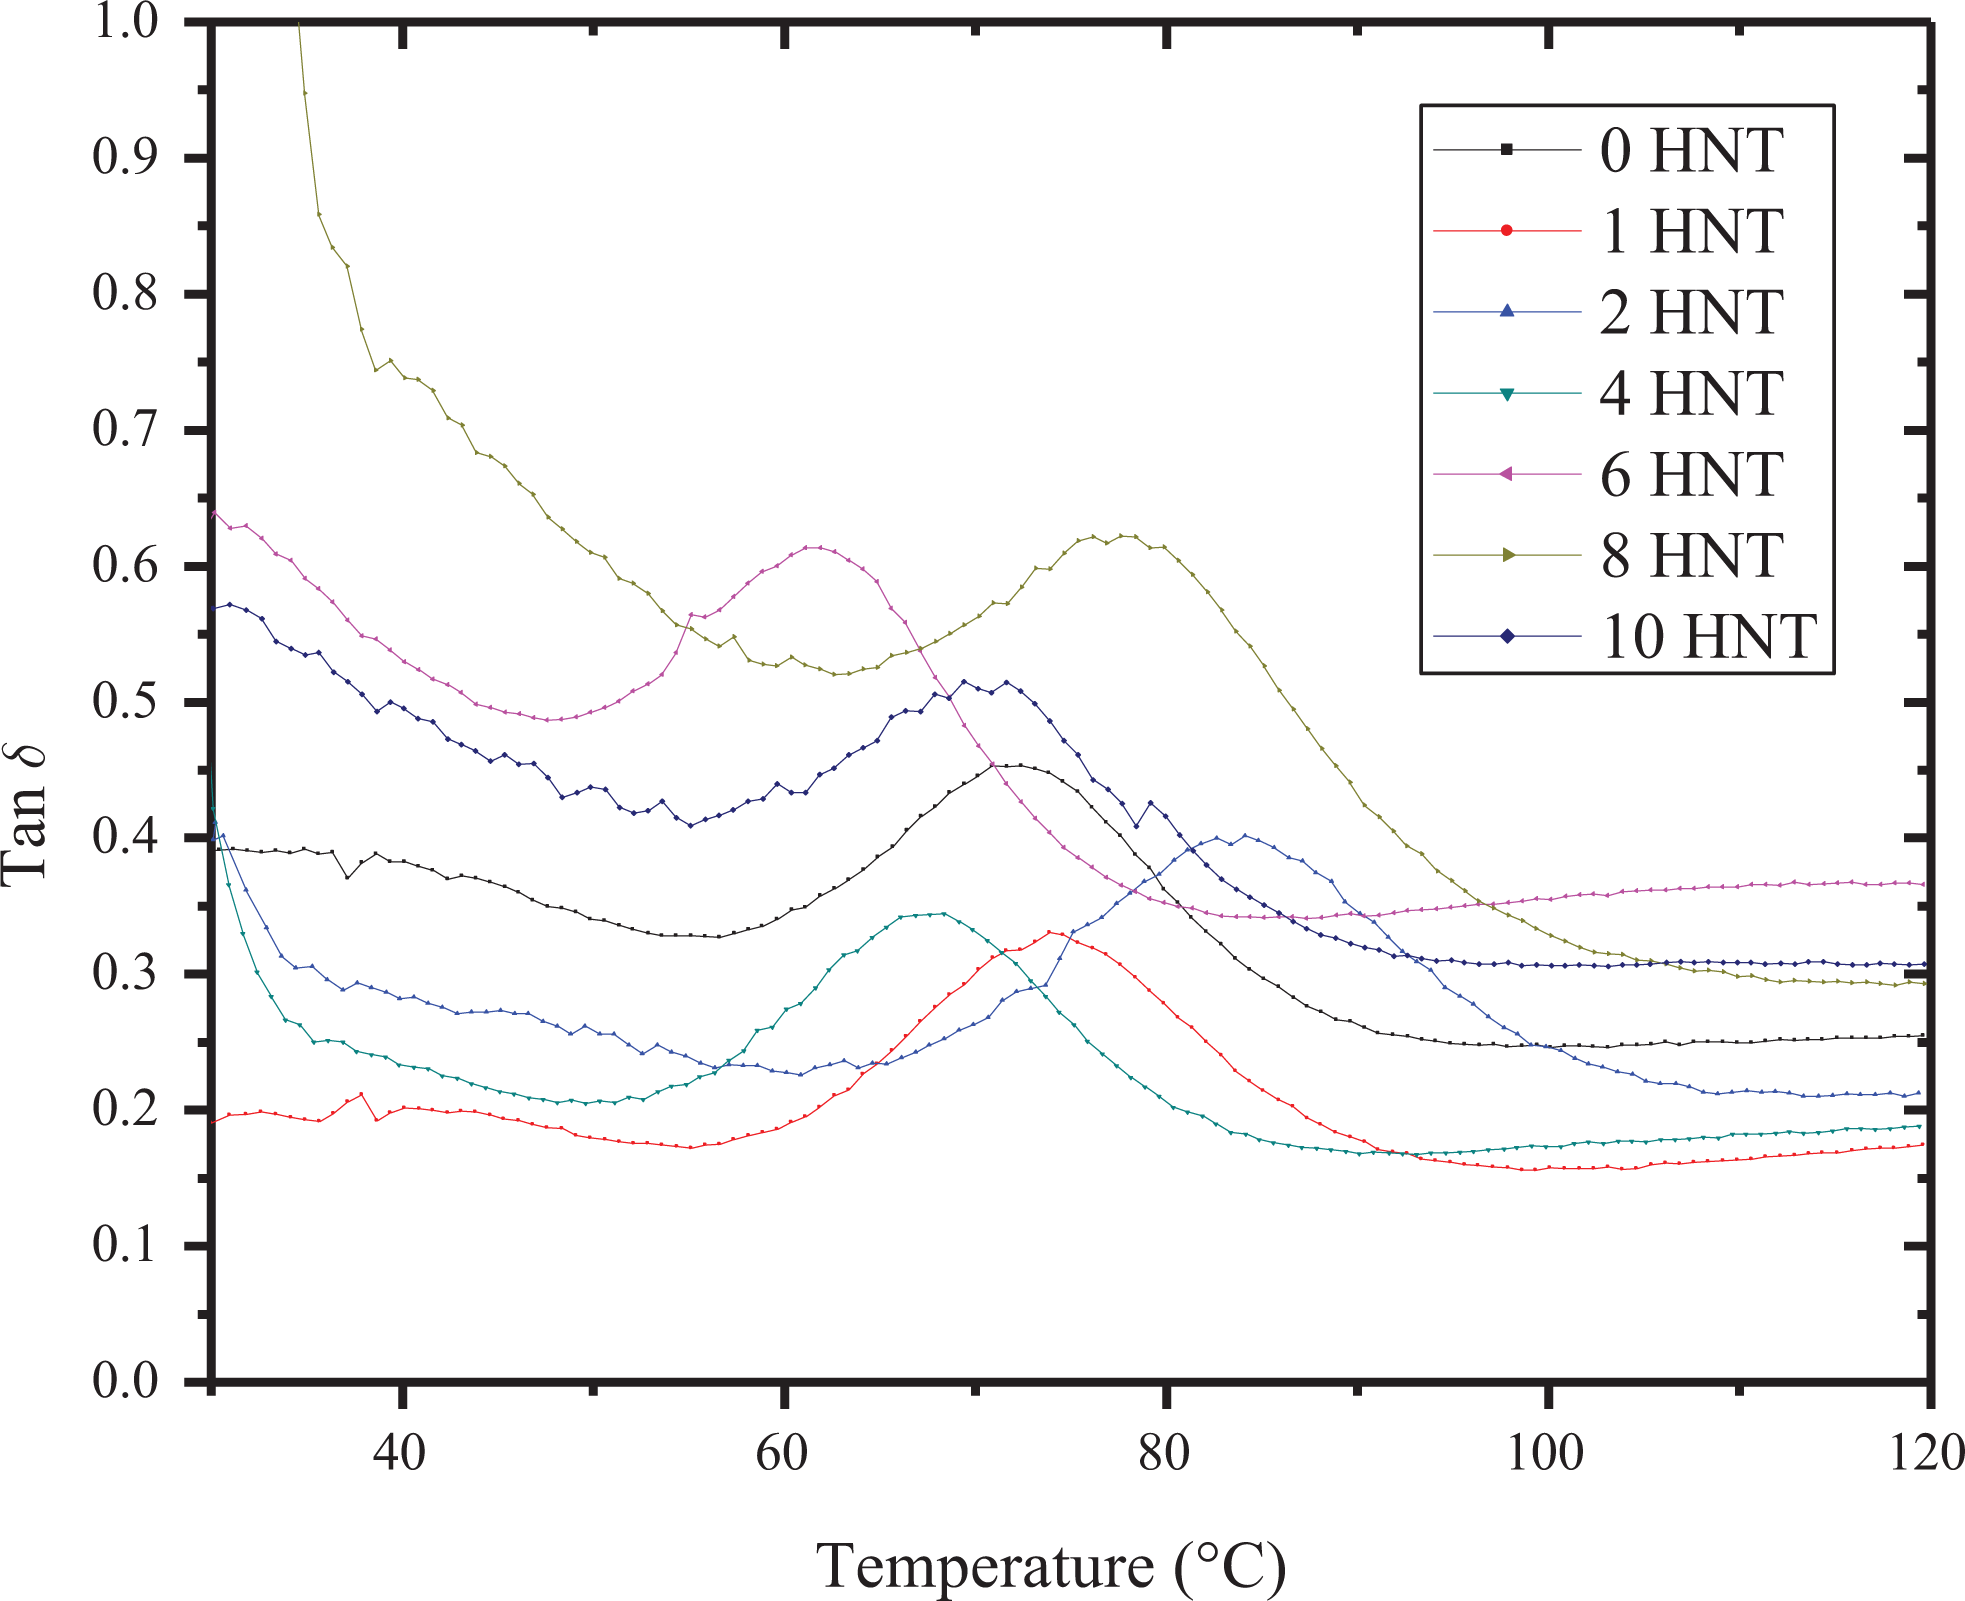
Variation of tan δ with temperature at 10 Hz for nanocomposites.
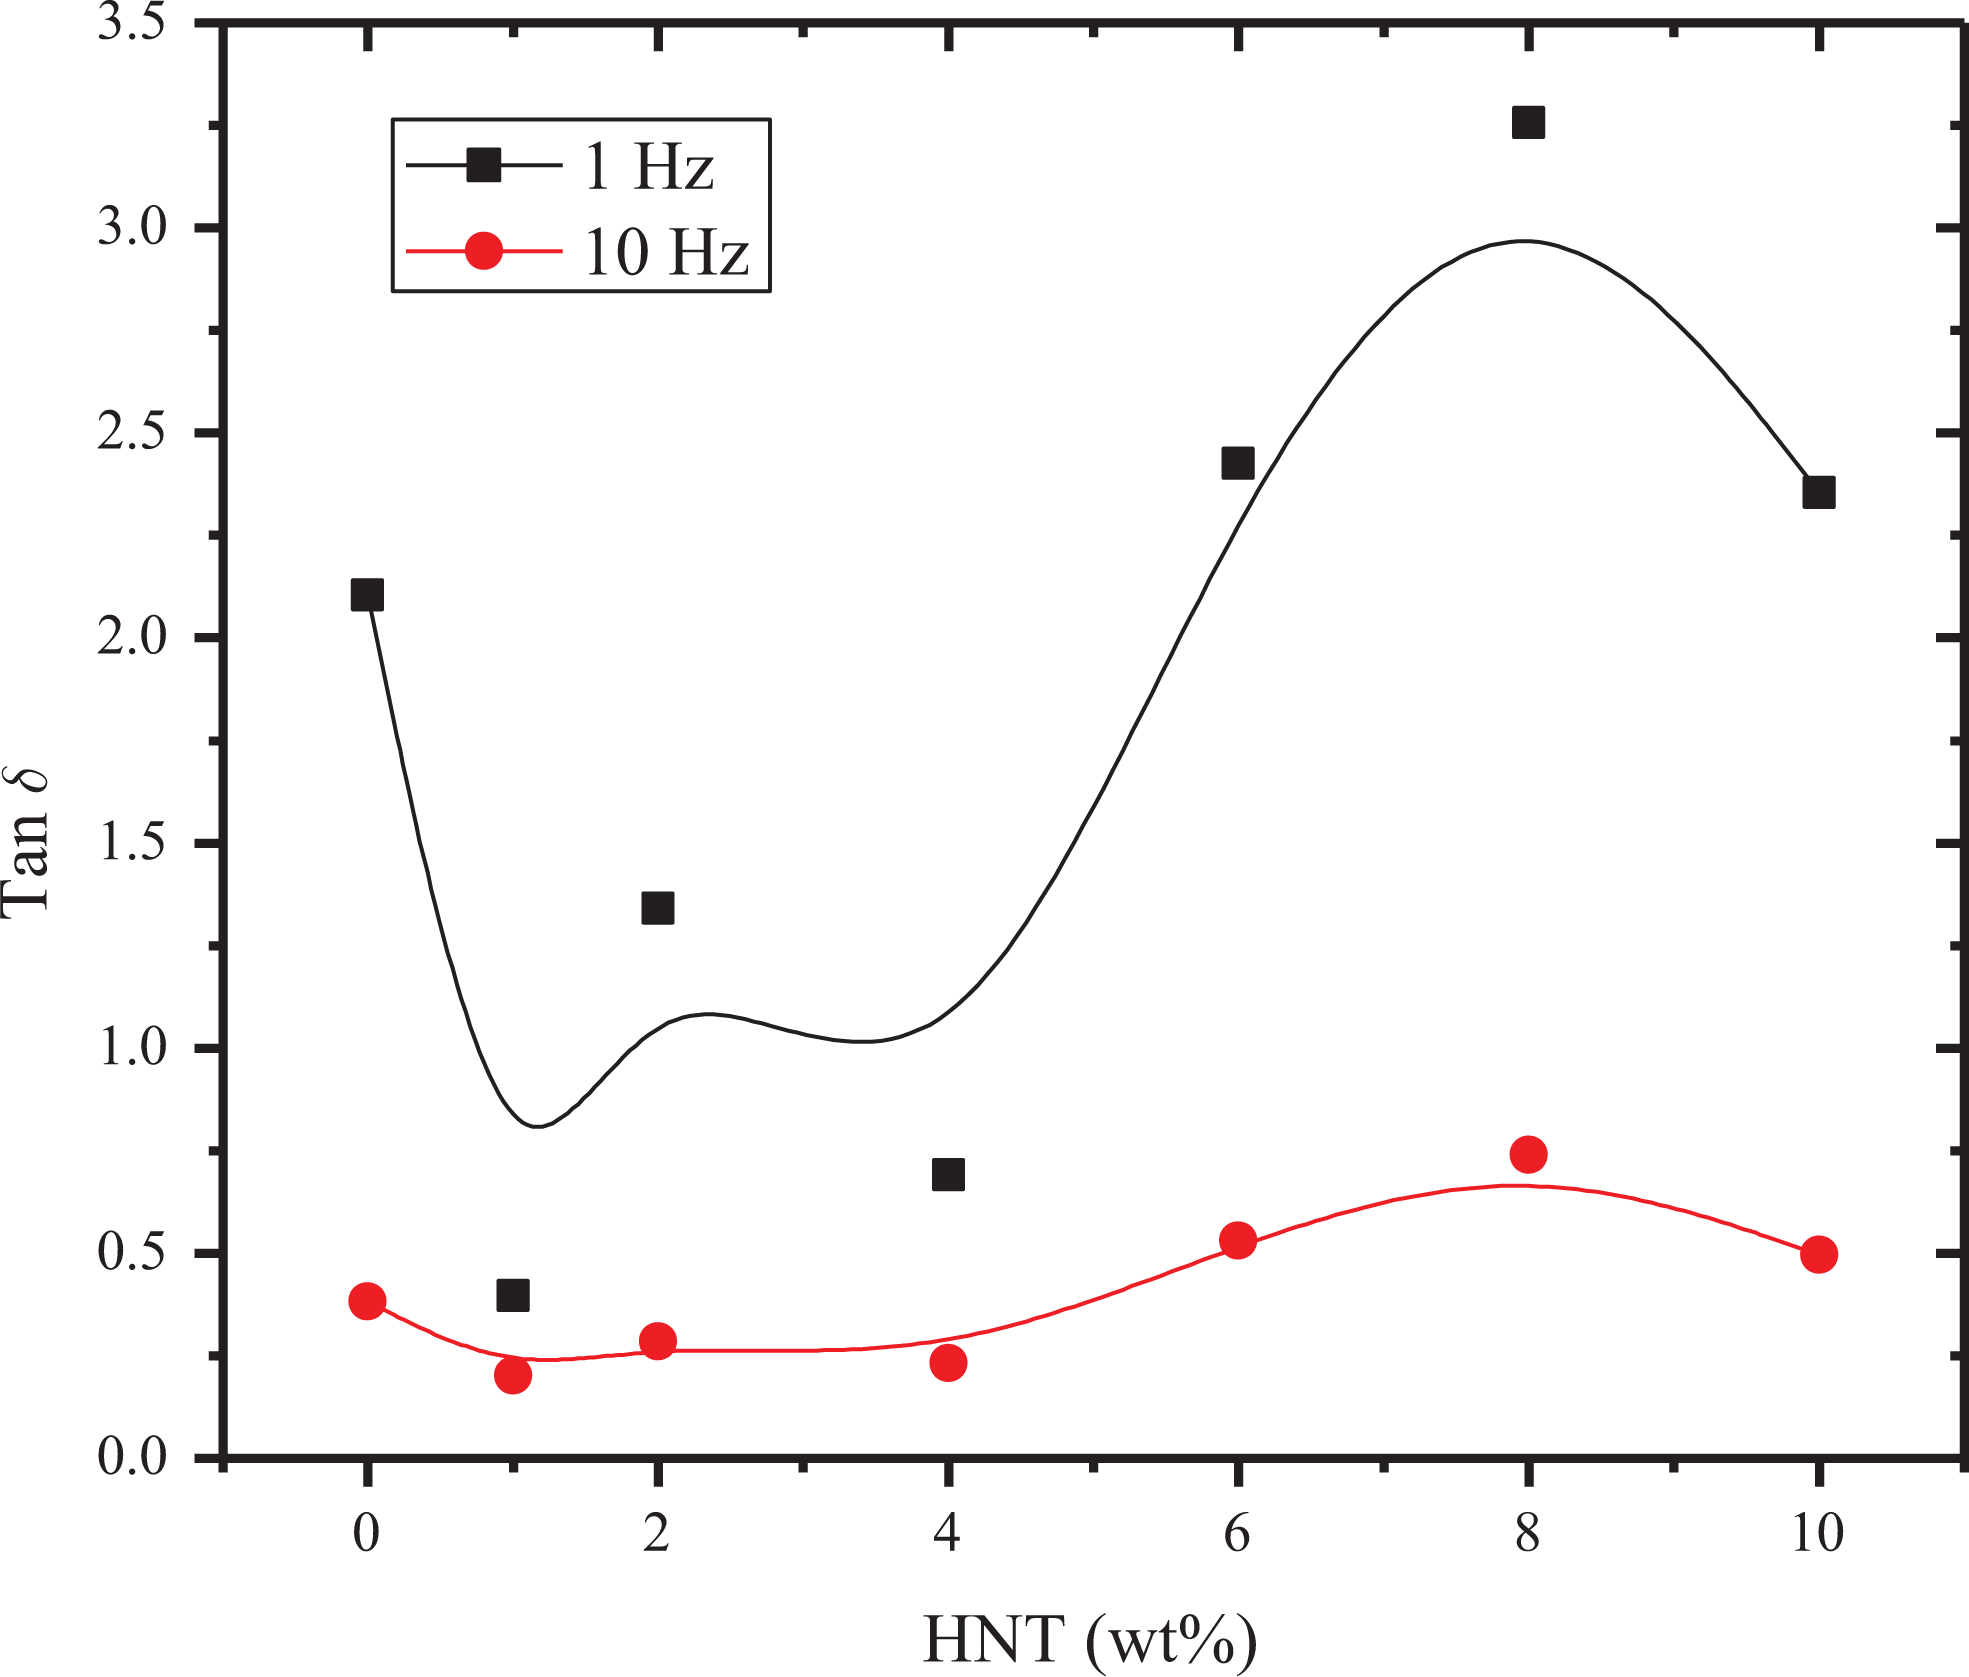
Variation of tan δ with HNT content in the composite. HNT: halloysite nanotube.
Conclusion
Dielectric properties of nanocomposites of a compatibilized blend of PP and PLA with HNT as the filler were investigated by varying temperatures from 30 to 120°C at frequencies ranging from 1 Hz to 1 kHz. Permittivitty, loss factor and tan δ values established 6 wt% of HNT as the optimum loading. The static and dynamic mechanical properties also corroborated similar outcomes. The analysis showed that the composites are ideal candidates for use in microelectronic devices or in microelectronic packaging applications.
Supplemental Material
Supplemental Material, Supplementary_information - Dielectric analysis of polypropylene (PP) and polylactic acid (PLA) blends reinforced with halloysite nanotubes
Supplemental Material, Supplementary_information for Dielectric analysis of polypropylene (PP) and polylactic acid (PLA) blends reinforced with halloysite nanotubes by Krishna Prasad Rajan, Ahmed Al-Ghamdi, Selvin P Thomas, Aravinthan Gopanna and Murthy Chavali in Journal of Thermoplastic Composite Materials
Footnotes
Declaration of Conflicting Interests
The author(s) declared no potential conflicts of interest with respect to the research, authorship, and/or publication of this article.
Funding
The author(s) received no financial support for the research, authorship, and/or publication of this article.
Supplemental material
Supplemental material for this article is available online.
References
Supplementary Material
Please find the following supplemental material available below.
For Open Access articles published under a Creative Commons License, all supplemental material carries the same license as the article it is associated with.
For non-Open Access articles published, all supplemental material carries a non-exclusive license, and permission requests for re-use of supplemental material or any part of supplemental material shall be sent directly to the copyright owner as specified in the copyright notice associated with the article.