
Abstract
Morphology of a nanocomposite, which has indisputable effects on its properties, is determined by its dynamic and thermodynamic conditions. While physical properties of the components of a nanocomposite as well as the interaction between them are the parameters controlling the morphology thermodynamically, their dynamic condition is related to the issues like intensity of mixing and geometry of mixer. In this research, we investigate the mixing process of solution casting method by studying the effects of mixing intensity on the dynamics of the particle structure and hereby its morphology using sedimentation test. In these experiments, mixing is performed at various durations, input energies, and energy types for suspensions containing different particle sizes and concentrations as well as diverse polymer concentrations. We found that increasing mixing time and input energy along with using ultrasonic wave decrease the size of aggregates. Sedimentation test revealed improvements of dispersion and distribution states of suspension by using ultrasonic waves and high shear mixing, respectively. Finally, particle–particle interaction data show increase in the probability of restructuring after mixing with reduction in particle size and increase in particle volume fraction.
Introduction
Mixing operations are the processes tend to reduce nonuniformity in concentration, temperature, and size of dispersive phase along with other properties of the system. 1 In the mixing process, the entropy of the system raises, 2 and to achieve the stable system, some energy is needed to overcome the change in the entropy. This energy is provided from mixer input energy 3 and the change in the enthalpy of mixing. 4
Properties of a nanocomposite are function of filler particle size, 5 concentration, 6 surface physics, 7 and mixing quality. 8 On the other hand, mixing quality is determined by particle size as particle dispersion and by mixture uniformity as particle distribution. 9
In a nanocomposite system, the final goal of mixing is to achieve homogeneous dispersion of nanoparticles in the matrix and obtain the ultimate size of nanoparticles. Number of particles in nanocomposites is much higher than ordinary composites, thereby the entropy of these systems is high. And because of high entropy in the system, preparation of random mixed nanocomposites with uniform distribution and good dispersion is a difficult task.
In the mixing process of nanocomposites, the change in enthalpy is related to the energy needed to breakdown nanoparticle clusters and to create polymer surfaces. 10 Adsorption of created surfaces on the particle surface provides some energy needed for mixing. 11,12 Nonmodified nanoparticles usually are polar and their surface energy is higher than the nonpolar polymers. 13 In other words, the energy needed for mixing nanoparticles in the polymer matrix is high.
Beside thermodynamics of the mixing, mixing quality is also determined by mixing conditions, 3 such as mixing rate, 14,15 temperature, 16,17 time, 18 and the mixer geometry. 19 –21 The quality of mixing is a vital property and determines the effectiveness of the selected process. The mixing quality can be estimated from the response of the sample to the mixing device 22 and analyzing the final product. This analysis is determined with the size, shape, orientation, and distribution of dispersed phase in the matrix. 23 For a certain distribution state, lower dimension of dispersed particles can be interpreted as higher quality of mixing. 14
After the mixing process, the morphology of the nonstable systems may change until the system becomes thermodynamically stable. Particles can interact on each other and gather to form larger aggregates. The strength of a particle–particle interaction is related to the particle surface energy and interparticle distance. Higher surface energy and lower interparticle distance tend to particle aggregation and decrease the quality of mixing. 24
Statistically, particles can stand near each other and form larger structures. Probability of this event increases in the nanocomposites and the concentrated suspensions, which has a bad effect on the mixing quality. 25
Melt and solution mixing methods are used to prepare nanocomposites. In the solution mixing method, amount and type of input energy and particle and polymer concentration are the important parameters affecting the mixing quality. The aim of this study is to optimize these variables. In order to investigate the mixing quality, sedimentation tests are performed. Based on sedimentation behavior, we compare the quality of dispersion and distribution of systems prepared with various types and amounts of input energy. Particle–particle interactions in the suspension are estimated from sedimentation test, and the particle–particle interaction is tracked at different particle and polymer concentrations. Higher particle–particle interactions tend to particle aggregation, and the systems with lower interactions have better condition for the mixing. At low particle concentration, the particle–particle interaction is negligible. 26 Therefore, the effect of particle–particle interaction on sedimentation velocity can be estimated from the difference between sedimentation velocity and velocities at very low concentrations.
Theory
In Figure 1, four different mixing qualities of filler particle in the polymer matrix are shown. These systems have different mixing qualities, that is, different states of dispersion and distribution.
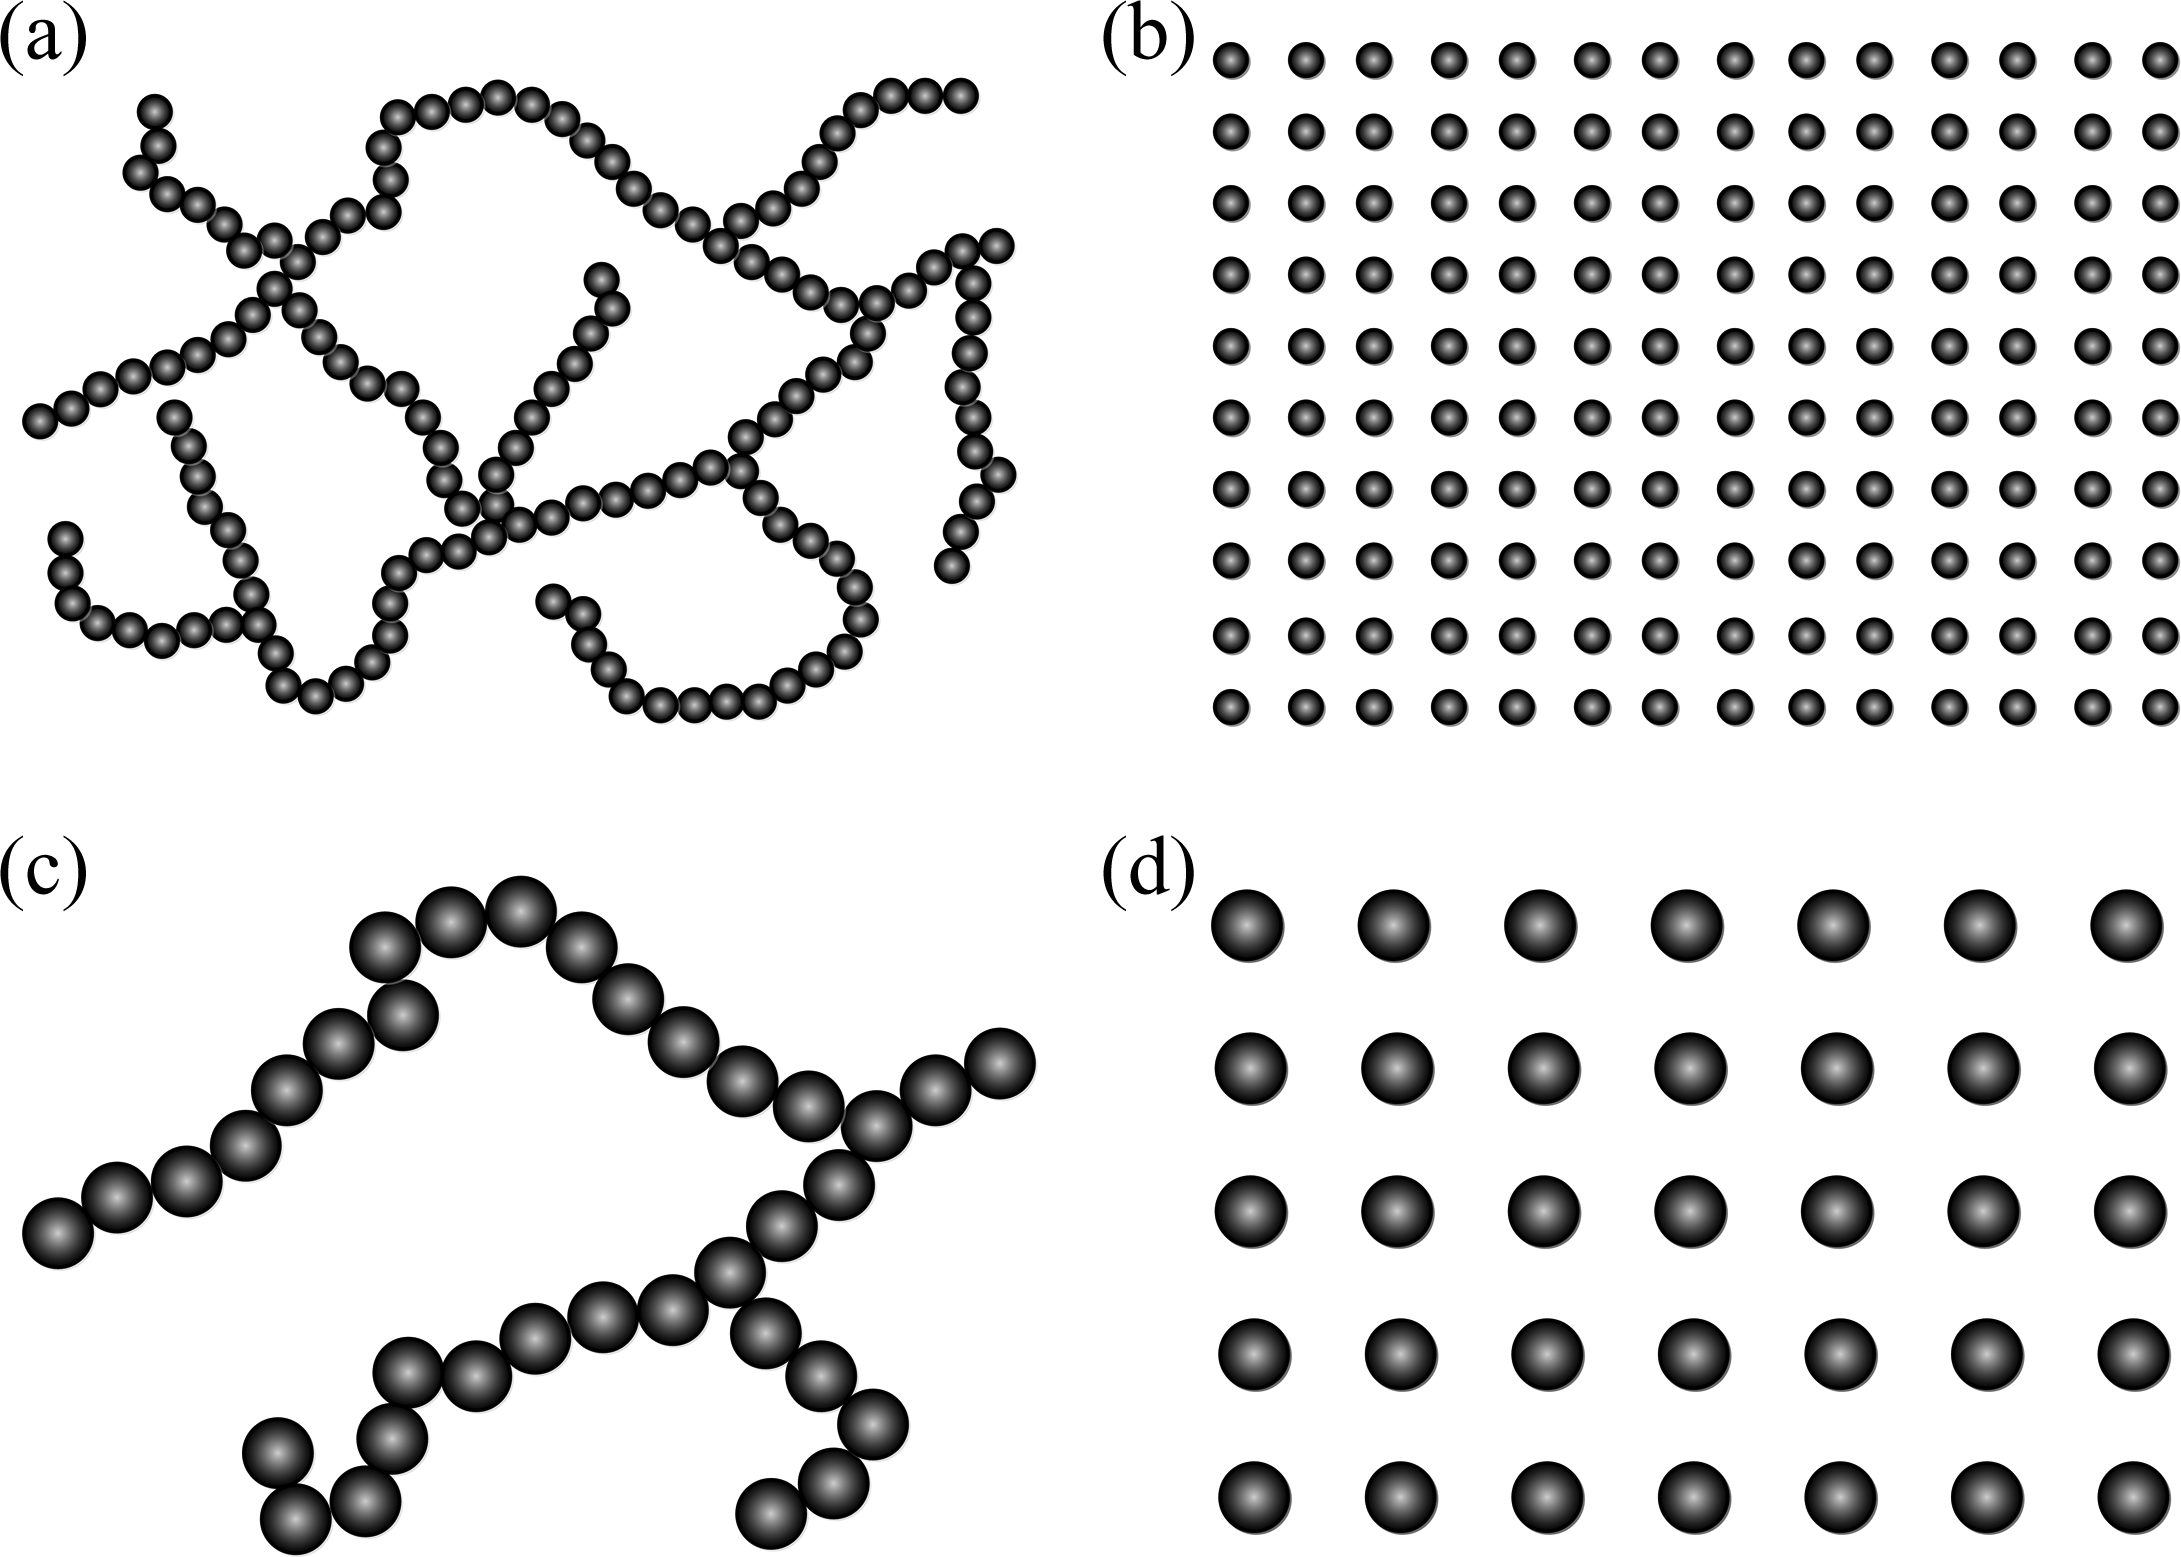
Systems with the same particle volume fraction but different microstructures (different mixing qualities).
According to this figure, systems (a) and (b) have the same dispersion but different distribution states, same pattern exists for systems (c) and (d). However, systems (a) and (b) have different dispersion state compared to (c) and (d). As an important question, one might ask which system has higher mixing quality. Apparently, system (b) has the highest and system (c) has the lowest mixing quality compared to the other systems. Also, system (a) has higher dispersion and lower distribution state compared to system (d).
Another question is which system has higher mechanical and rheological properties. In the context of rheological properties of filled systems, modulus of polymer as the matrix is considered extremely lower than modulus of filler particle. This condition happens at the temperatures higher than glass transition of media or at the frequencies where polymer has liquid-like behavior.
Rheological properties of filled systems are connected to the hydrodynamic motion of filler particles in media, 27 properties of polymer chains affected by the surface of filler particles (i.e. properties of adsorbed polymer) and filler network properties. 28 On the other hand, these parameters are affected by some other variables. Effect of hydrodynamic motion of particles in media on filled systems properties is function of particle volume fraction and shape. Portion of adsorbed polymer on these properties is related to the available surface area of particles and polymer–particle interaction. And finally, portion of filler network on these properties is function of particle–particle connection number and strength and spread of particle branch all over the system. 29
In the cases that modulus of polymer is noticeable compared to modulus of filler, the properties of systems are called as mechanical properties. In this state, properties of the system are function of the amount of tension that is transfer to the filler structure through filler–polymer interface.
With the purpose of studying the effect of filler structure on the nanocomposites properties, Capuano et al. 30 added nanosilica to the poly(ethylene oxide) with melt mixing and freeze-drying method. Through SEM micrographs, they showed samples produced by freeze-drying method have higher dispersion quality. They performed linear viscoelastic tests and found the freeze-drying samples have higher storage and loss modulus. According to these results and by looking at Figure 1, we can conclude systems with structures like (a) and (b) have higher rheological properties compared to systems with structures like (c) and (d).
Banc et al. 31 prepared nanocomposites of silica in poly(ethyl methacrylate) at different matrix molecular weights. They took SAXS and TEM tests for prepared samples and realized particles in nanocomposites with lower molecular weight have higher tendency to form network. Again, it can be concluded the filler structure in low molecular weight systems looks like systems (a) and (c) in Figure 1 and high molecular weight systems look like systems (b) and (d). They also done linear viscoelastic test to investigate filler particle structure effect on rheological properties, and they found nanocomposites with low molecular weight matrix have higher reinforcement. Therefore, filler networking produces higher reinforcement for filled systems. Accordingly, systems (a) and (c) have higher reinforcement compared to systems (b) and (d), respectively.
Filler network has viscoelastic behavior in addition to the viscoelastic media. Its behavior is function of particle size, concentration, and surface properties. Also, smaller particles or higher concentrations result in stronger network in nanocomposites. 28 Replacing polar groups on particle surface with nonpolar ones reduces particle network strength.
The effect of structure type on properties of filled systems is investigated, and it is expressed how different structures have different properties. These expressions provide patterns to relate different properties to the different structures. Payne effect or strain softening is a phenomenon that is related to filler structure break up in filled systems. Jouault et al. 32 done SAXS test for samples strained at different values and proved filler structure break up with strain in Payne effect phenomenon. Also, they believe filler agglomerate rupture happens while strain sweep tests and the size of aggregates are constant during the tests.
Properties of filled systems can be affected by many parameters, such as physics of matrix and particles along with the application conditions. 33 Physical parameters of a polymer affecting filled systems’ properties are the molecular weight, amount and type of functional group on polymer chain backbone and type of covalent bound in backbone. Also, physical properties of particles affecting the behavior of filled systems are shape, size, surface polarity, and roughness as well as volume fraction of particles. On the other hand, application conditions that affect the properties of filled systems consist of temperature and pressure of ambience and frequency, and time and amplitude of applied stress or strain. These parameters change properties of filled systems by changing properties of components and microstructure of the system. The microstructure is creature of components interactions and history of applied variables over preparation and application.
Properties of each component as function of applied variables are problems with known answers. However, different microstructures formation and their properties are unknown issues for researchers these days. Microstructure is determined with dynamic and thermodynamic conditions of their preparation and application.
Mixing as the major stage of preparing filled systems has an important effect on the microstructure thereby on the properties of filled systems. Variables of a mixing process are mixing time, intensity, and the type of input energy. Shear and ultrasonic energy are the typical energies used to disperse filler particles to polymer media. Kahraman et al. 34 mixed nanoclay into epoxy at various sonication times and performed linear viscoelastic tests to investigate the effect of mixing time on the properties. They found rheological properties of filled systems increase with mixing time and reach the extremity in the properties. They believed intercalation of clay increases with sonication time which tends to properties improvement. Therefore, we can conclude sonication helps to improve dispersion states, that is, transform from system (c) or (d) to (a) or (b) in Figure 1. Also, Majeste and Vincent 8 prepared nanocomposites of SBR and silica with internal mixer at different mixing times. They found the properties of these filled systems increase with mixing time and reach to optimum point and then decrease. They presented TEM images from the prepared sample indicating the breakup of particle agglomerates during mixing, that is, the state of distribution approaching to its ideal state (structure changing from (a) or (c) to (b) or (d) in Figure 1). According to these experiments, it is safe to say that mixing time has different effects on the properties of filled systems depending on how mixing changes the microstructure system.
Optimization of conditions in the mixing process is a vital step for preparation of nanocomposites with high-quality products based on their properties and price. In this regard, we need to evaluate the effects of several parameters on the mixing process and find the optimum ones. However, because of interaction between components in filled systems and removal of mixer energy, microstructure of samples changes after the mixing, making the final product properties and microstructure not a good evidence to evaluate mixing condition. Solution mixing is the method we chose to use in this study to prepare nanocomposites, since this method has higher quality in comparison with melt mixing. 30,34 Studying the behavior of the mixture directly after mixing helps to evaluate mixing intensity. Sedimentation tests are used to evaluate quality of the mixture.
The hydrodynamic forces on the particles 35 and interactions of particles with matrix 36 and with each other 37 –40 control the sedimentation velocity of particles. Higher hydrodynamic forces tend to hydrodynamic sedimentation, which is function of particle size and density as well as viscosity and density of sedimentation media. 41
Sedimentation is due to the balance of forces acting on the particle in the surrounding media. 42 These forces are buoyancy, gravity, friction with the media, interaction with the media, and interaction with other particles. Summation of friction, buoyancy, and gravity forces is called the hydrodynamic forces; so acting forces on particles can be reduced into hydrodynamic forces and forces that are due to particle–matrix and particle–particle interactions. It could be concluded from Newton’s Second law, which relates forces to velocities, that sedimentation velocity is a result of hydrodynamic velocity and velocities resulted from particle–matrix and particle–particle interactions, so

In this equation, φ is particle concentration in suspension, and subscripts h, pm, and pp represent hydrodynamic forces, forces that are because of particle–matrix, and particle–particle interactions, respectively. At low particle concentrations, effect of particle–particle interactions on sedimentation velocity is negligible, so sedimentation velocity at these concentrations (v 0) is a function of particle–matrix interactions and hydrodynamic motion of particles, so

Stokes equation could be used to estimate the hydrodynamic motion of particles
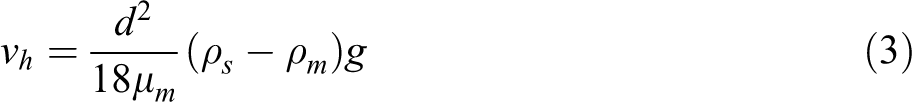
where d is the particle diameter, μm is the media viscosity, ρs is the particle density, and ρm is the media density. From this equation, it is clear that hydrodynamic motion is not a function of particle concentration in the suspension. Furthermore, particle–matrix interaction is affected by surface properties of the particle and the matrix, so it is not a function of particle concentration in the suspension either. Therefore, it is only particle–particle interaction influenced by changing in particle concentration which causes variation in sedimentation velocity. So, the difference between sedimentation velocity and low concentration sedimentation velocity (v 0) is just a function of particle–particle interaction. Dimensionless velocity that is a function of particle–particle interaction at different particle concentrations can be defined as follows:

where v is the sedimentation velocity, v 0 is the velocity at low concentrations, and lpp is dimensionless velocity that is a result of only particle–particle interactions. For estimation of lpp , low concentration velocity, v 0, is obtained from extrapolating the sedimentation velocity data at different particle concentrations to zero.
Hydrodynamic sedimentation velocity of smaller particle is lower. Therefore, the effects of particle–matrix interaction on sedimentation velocity compared to particle–particle interaction and hydrodynamic forces are negligible. 43 Effect of particle–particle interaction on sedimentation velocity is function of particle size and concentration. In our previous work, we found that sedimentation velocity decreases with particle size reduction and particle concentration addition, since increase in particle–particle interaction affects sedimentation velocity. 44 So, lower sedimentation velocity at various mixing conditions leads to smaller particle aggregate or better dispersion state.
Experimental
Materials
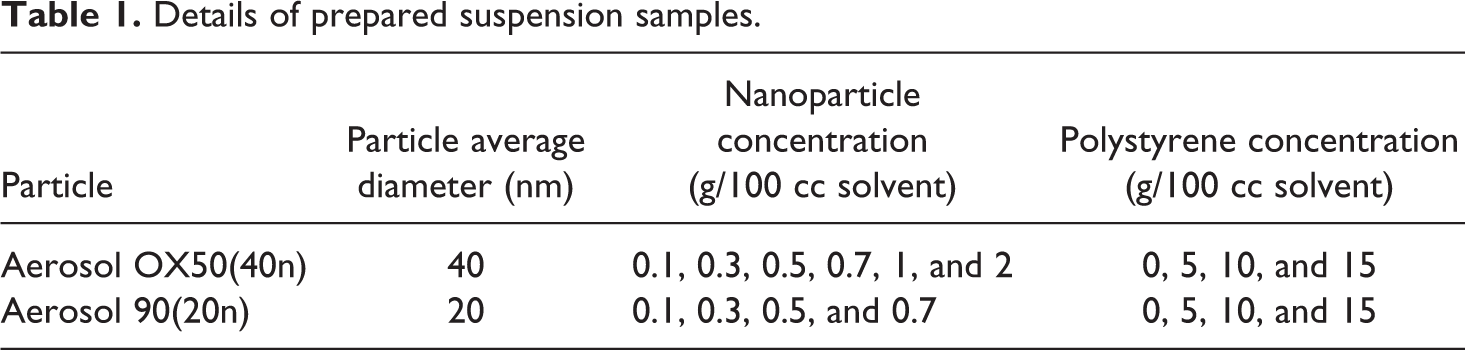
In the present study, the following materials were used: polystyrene grade 336 provided by EN CUAN Industrial, with a density of 1.05 g/cm3 (ISO 1183) and a melt flow index of 12 (g/10 min) as the polymer and nonporous silica Aerosil 90 and OX50 (supplied by Degussa Chemical, Germany, Essen) as particles. All silica particles were hydrophilic with surface area of 90 m2/g and 50 m2/g, and their average primary particle sizes were 20 nm and 40 nm, respectively.
Suspension preparation
We use polystyrene as rigid granule and nanosilica as powder. It is better to prepare the final suspension as follows: first, dissolve polystyrene in toluene then add it to the suspension of nanosilica in toluene. We perform all tests and preparation processes of suspensions at room temperature (close to 25°C). Test time is very long (in some cases about 3 months), and higher accuracy and lower costs are the reasons we hold these tests at room temperature. Toluene and polystyrene are transparent, and a clear solution is not an evidence for completely solved polystyrene. Therefore, in order to confide homogeneity in the solution, we use a high speed mixer for long durations. The speed of the mixer was 2000 r/min throughout these tests, and the mixing time was 1 h.
We dried nanosilica at 100°C for 24 h in order to remove adsorbed moisture on the particle surface and to help the particle dispersion. The nanoparticles were cooled down to the room temperature and were kept dry by silica gel to prevent the re-adsorption of moisture. Dry particles were mixed with toluene at 2000 r/min (mixer speed) for an hour to prepare homogeneous suspension.
Suspension of toluene, nanosilica, and polystyrene solution was mixed in a high shear mixer with speed of 12,000 r/min. This mixer was designed and constructed for this purpose. 45 Maximum tested speed of the mixer is 15,000 r/min, and for these experiments, we chose the speed of 12,000 r/min. Details of the samples prepared according to this method are presented in Table 1. All the concentrations are defined as mass of solute per 100 cc of solvent (g/100 cc).
Details of prepared suspension samples.
For applying ultrasonic energy to the suspension, combined tank is designed and constructed. The schema of the combined mixer tank is presented in Figure 2. This tank contains two connected cups. In one cup, there is the rotational blade and in the other one the ultrasonic probe. Blade rotation pumps and circulates suspension between cups. Ultrasonic systems and the probe contain variable power supply up to the power of 5 kW and 1 kW, respectively. The exerted ultrasonic energy to the suspension is estimated from the output energy of power supplier.
The schema of the combined mixer tank.
Sedimentation velocity measurement
Sedimentation test was performed in columns with length of 50 cm and 26 mm in diameter. When the suspension is at the rest state, particles start to deposit and the suspension becomes two phases. One phase is rich and the other is poor of particles. At this state, a boundary is created in the column between two phases, and the height of this boundary changes with time. This boundary tracked in graduated cylinder with naked eyes over time. Velocity measurement was carried out by estimating the time variation of boundary height.
Results and discussion
High shear energy optimization
Because of high speed of blade rotation, high shear mixer has high capability of circulation, so every particle has the same shearing history during the mixing process. Consequently, high shear mixer exerts uniform energy to the suspension. Because of this uniform energy, resultant suspension contains particles with narrow particle size distribution. In this suspension, particles sediment with the same velocity so suspension changes to two phases with clear boundary layer. Sedimentation velocity could be estimated from the slope of boundary layer height versus time. In Figure 3, boundary height versus time of a typical sedimentation is shown. In this sample, particle is 20 nm, polymer concentration is 10 g/100 cc (wt/100 cc of solvent), and particle concentration is 0.3 g/100 cc.
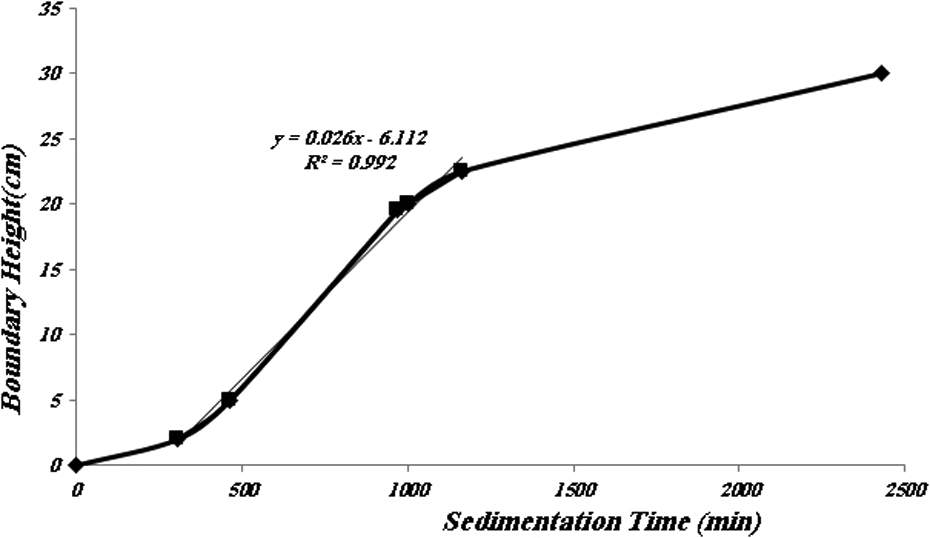
Changes of boundary height with sedimentation time.
Sedimentation velocity can be calculated from Figure 3, as the rate of change in boundary height with time. This velocity is governed by the hydrodynamic and thermodynamic of the system. The graph shows that velocity is low at first, then it is increased, and at the end, it is decreased. The trend can be interpreted as follows: In the beginning, particles are separated and small therefore their velocity is low. Because of stopping mixer energy, the suspension becomes unstable and, as time passes, the particles start to have dynamic motions and attract each other and form clusters which result in a higher velocity. In the middle times, particles become large and thermodynamic forces inhibit the particles to move toward each other and stop the growth of clusters, so the dimension and the sedimentation velocity of particles become constant over time. As the time passes, particles are collected at the end of the column and form 3-D structure, which prevents other particles from depositing in the media, and the changes in boundary height with time decreases accordingly. Consequently, the slope of the straight line in the middle region in Figure 3 states the sedimentation velocity. The behavior of particle during sedimentation in the suspension is described schematically in Figure 4.
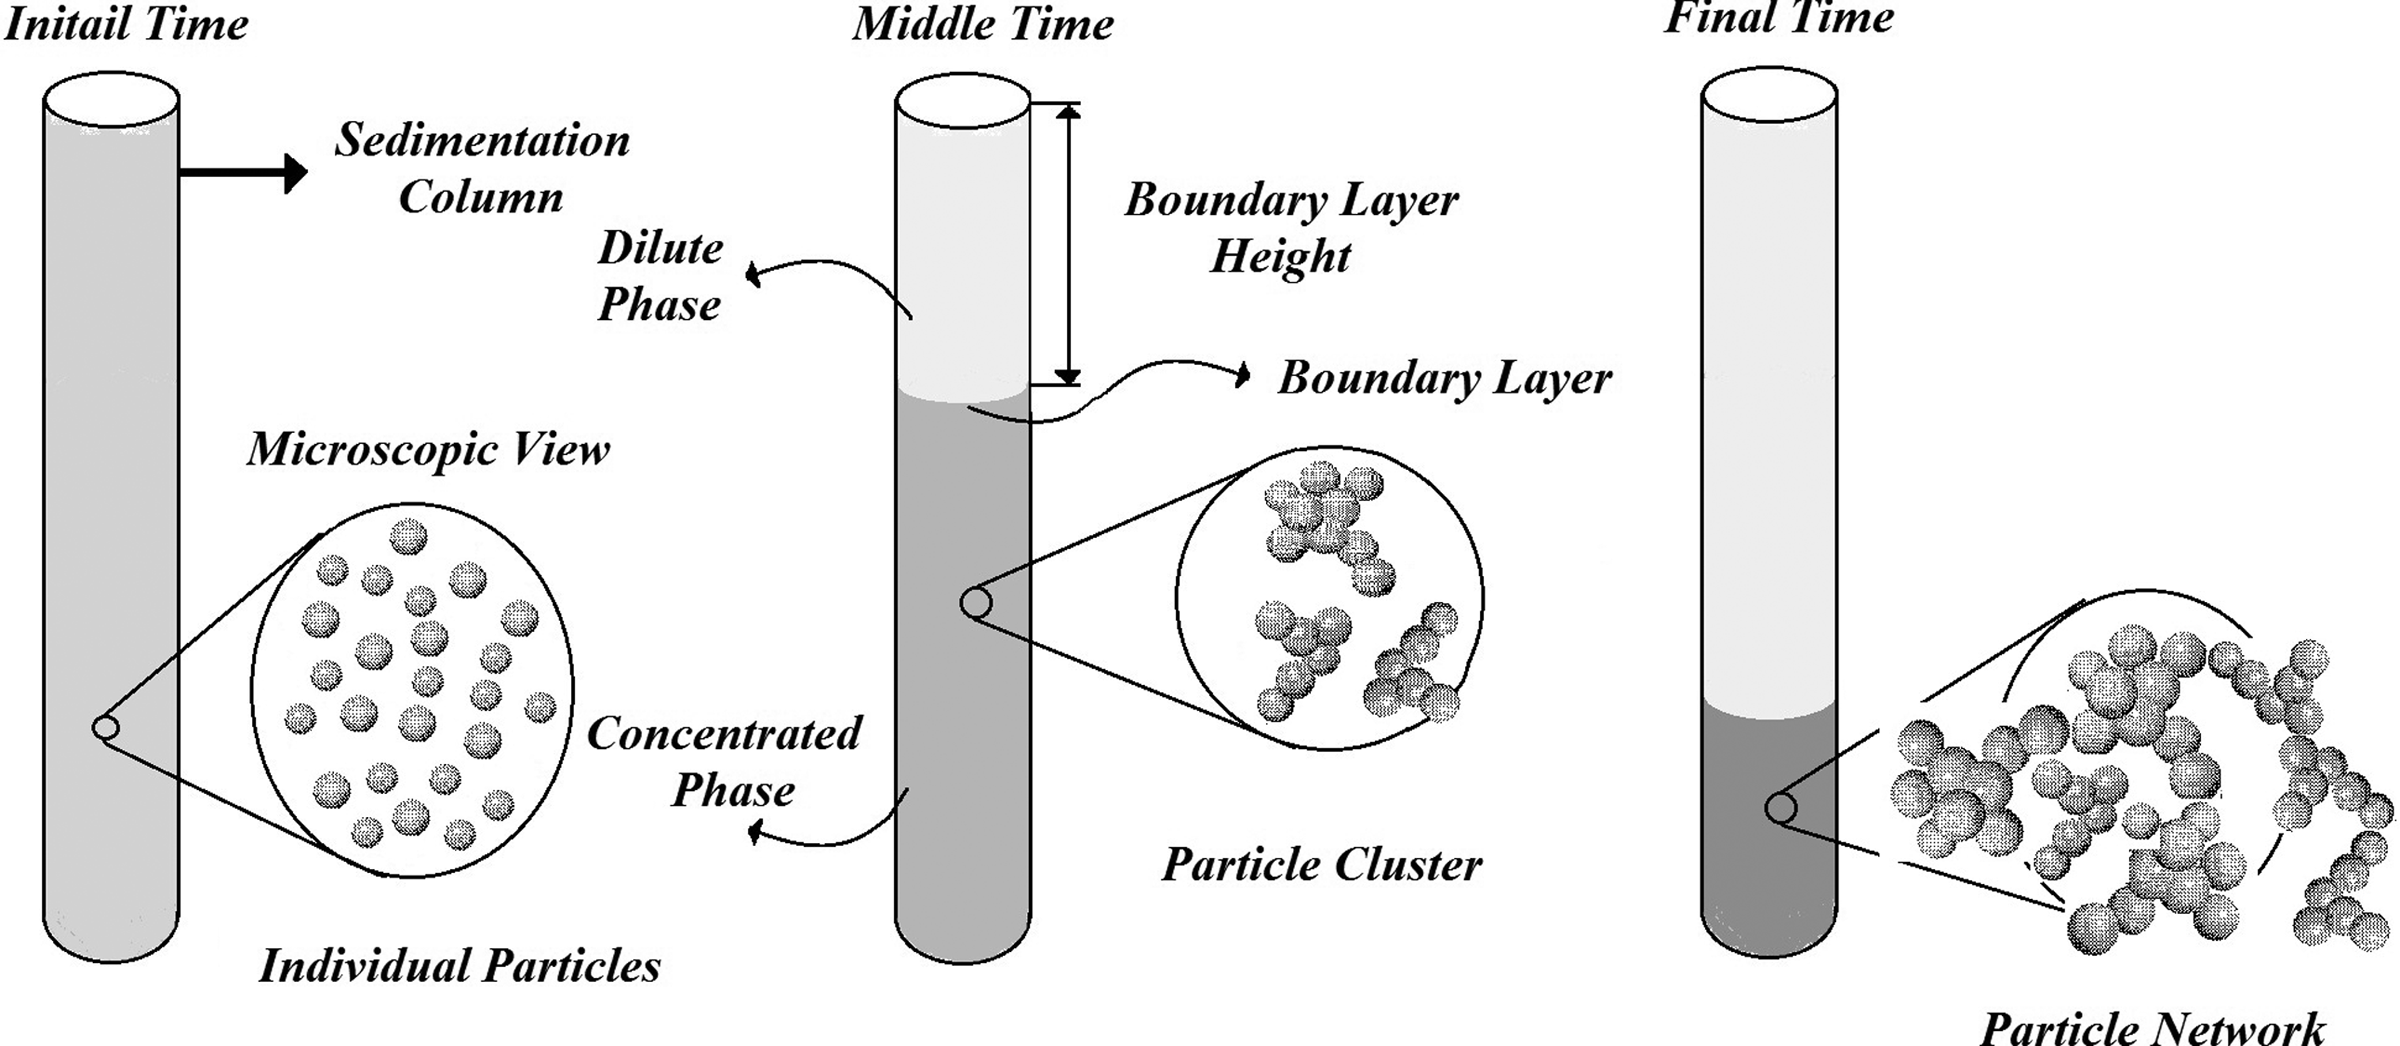
The behavior of particle in the suspension during sedimentation. 44
For this specific example (Figure 3), sedimentation velocity is 0.0225 cm/s for suspension containing 0.3 g/100 cc 20 nm particles and 10 g/100 cc polystyrene. Sedimentation velocity is obtained for different particles and polymer concentrations in the similar manner.
In sedimentation graph, the slopes of initial times and middle times are the important parameters. The sedimentation column scaled to 2 cm and sedimentation pattern of first 2 cm is different. Time of boundary layer passing through first 2 cm is considered as the onset time. Systems having lower onset time contain smaller particles, higher uniformity and higher interparticles distance, so this parameter could be used to study the state of particle distribution in suspensions. Lower middle time means smaller aggregates in the suspension where the size of aggregates determines quality of dispersion. Therefore, the quality of dispersion and distribution of a mixing procedure could be examined from sedimentation behavior of particles through media. In Figure 5, effect of high shear mixing time on sedimentation behavior for the same suspension is shown.
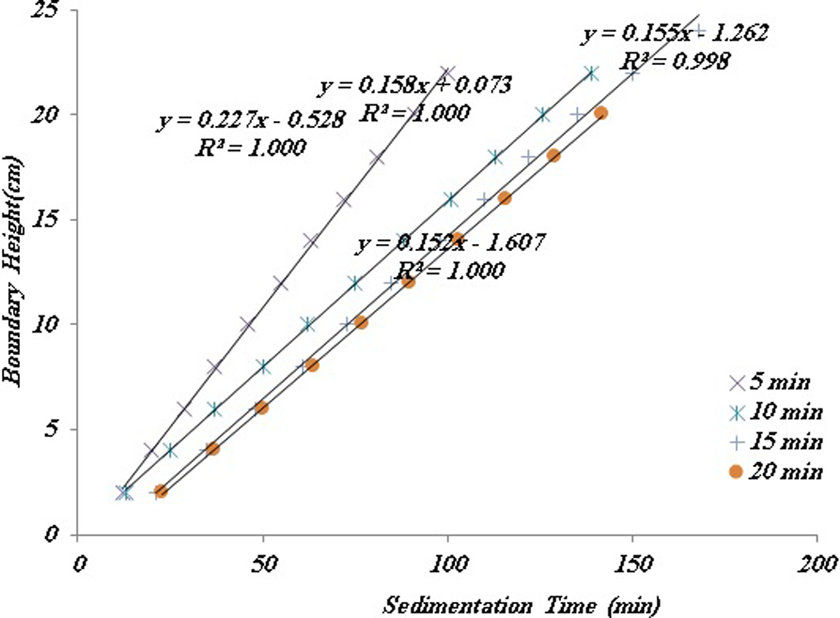
Sedimentation graph at different high shear mixing times.
From the data in Figure 5, it is clear onset time and middle times slope increase with high shear mixing times. It could be concluded that with the increase in mixing time, the quality of dispersion and distribution improves. In Figure 6, the slope of middle times at different mixing times is shown. It is clear the slope of middle times reaches to an optimum value with mixing time because the intensity of shear energy is limited. Therefore, the power of mixer is finite to break particle structure and the suspension reaches to equilibrium state during mixing. So, no change will happen in the structure of the filler particle.
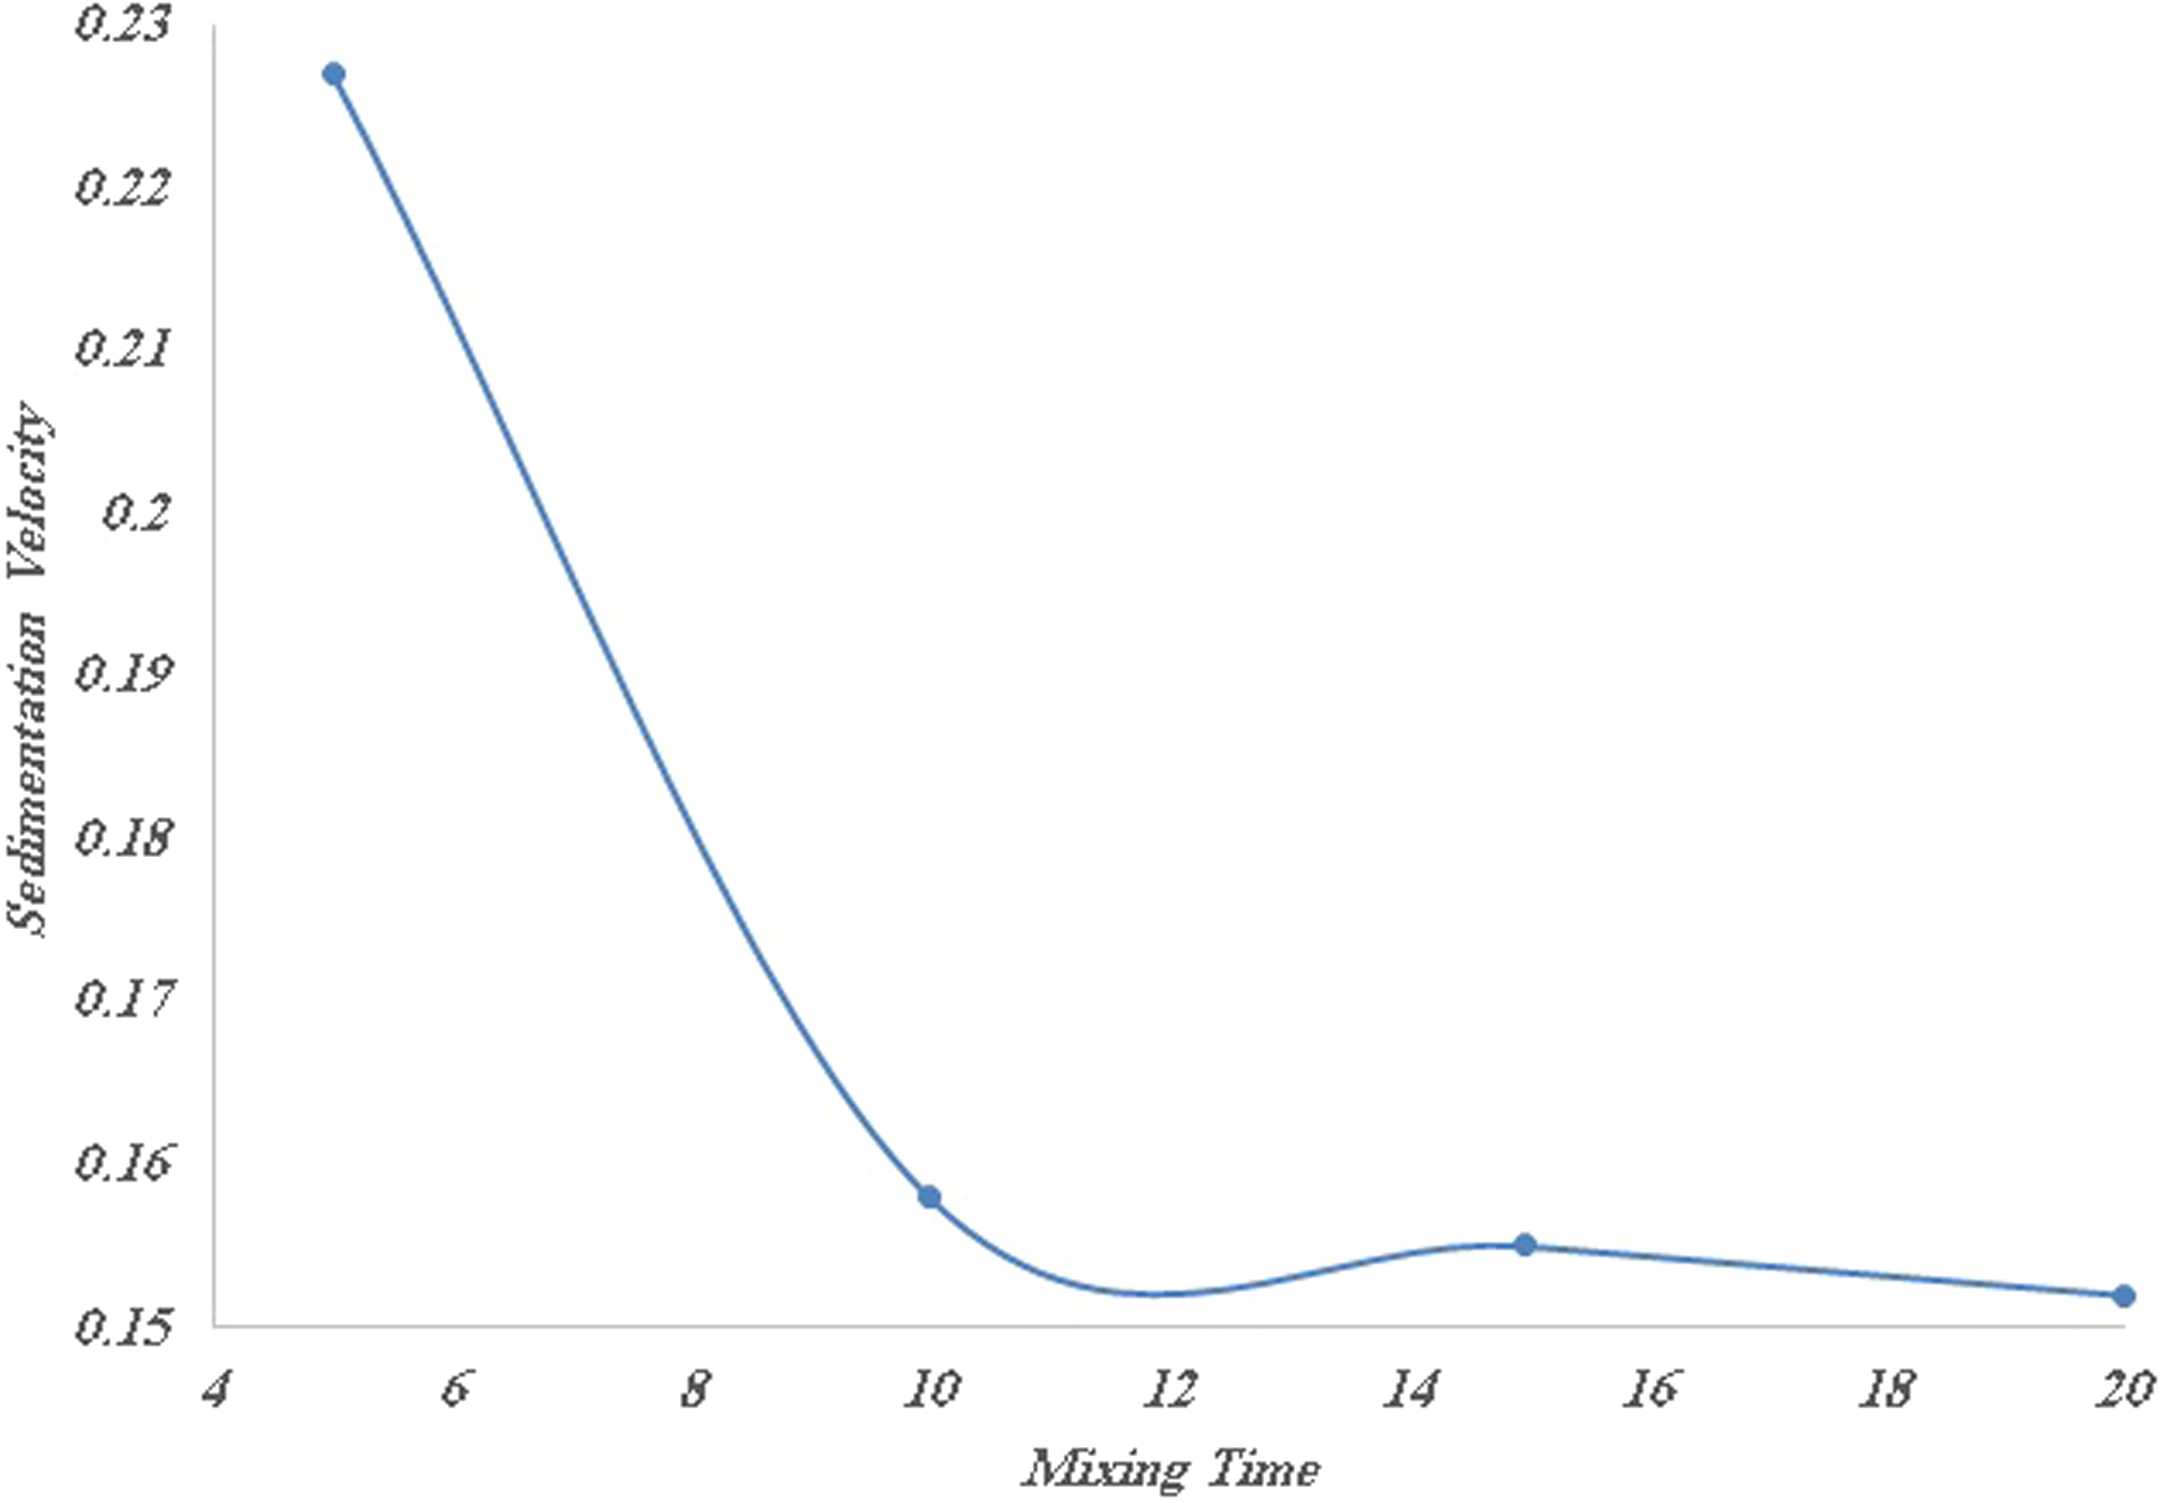
The slope of middle times at different mixing times.
Middle time slopes of suspension with mixing times of 10 min, 15 min, and 20 min are the same but onset times of suspension with mixing times of 10 min and 15 min are different and onset time of 15 min is higher thereby has better mixing quality. There is no difference between sedimentation behavior of suspension with mixing time of 15 min and 20 min; thus, 15 min is considered as the optimum high shear mixing time.
Ultrasonic energy optimization
Ultrasonic power is too much higher than mechanical power, so it is expected that ultrasonic wave destroys filler structure more than mechanical shear. Ultrasonic wave’s energy in the media containing nanoparticle suspension concentrates on particle structures and destroys them. Destroying intensity depends on frequency and input energy.
It is observed the ultrasonicated suspension is not sediment in uniform manner because intensity of ultrasonic energy in the media is not uniform and ultrasonic wave does not cause any eddy transformation to separate broken particle structure in media, so rebuilding is easy to happen in ultrasonicated suspensions. Consequently, particle size distribution for this suspension is broad. Structures with different sizes do not sediment with the same velocity, and clear two phases are not formed in suspension. Consequently, it can be inferred bad distribution exists in ultrasonicated suspension which is a weakness for ultrasonic homogenizers.
For studying the effect of ultrasonic energy on mixing quality, the time that is needed to sediment all particles at various sonication input energies is recorded. In Table 2, sedimentation time of particles at different input energies is shown.
Particle sedimentation time for different energy inputs.
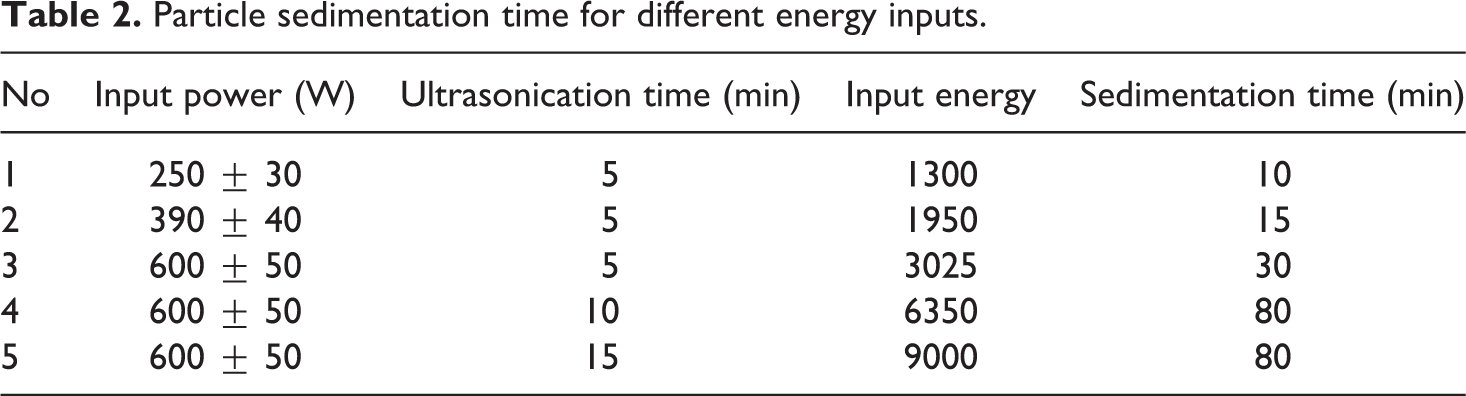
Presented data in this table reveal that with increase in input energy, sedimentation time increases. Higher sedimentation time is because of lower particle size and lower particle size means higher mixing quality. Therefore, it can be concluded higher input energy improves mixing quality. For known input power, improvement in the quality of mixing reaches an optimum in energy because input power is not enough for more breaking particle structures. It could be concluded 10 min at power of 600 W can be considered as the optimum condition of ultrasonic wave usage.
High shear and ultrasonic energy
Circulation in mixing tank, because of high speed rotation of blade, provides the same history for all species of suspension. Same history tends to high quality of distribution for the suspension. Intensity of ultrasonic wave’s energy is higher than the shear energy. Higher energy intensity destroys particle structures more, which improves dispersion quality of suspension. In Figure 7, effect of ultrasonic waves on sedimentation behavior of particles through polymer solution is shown.
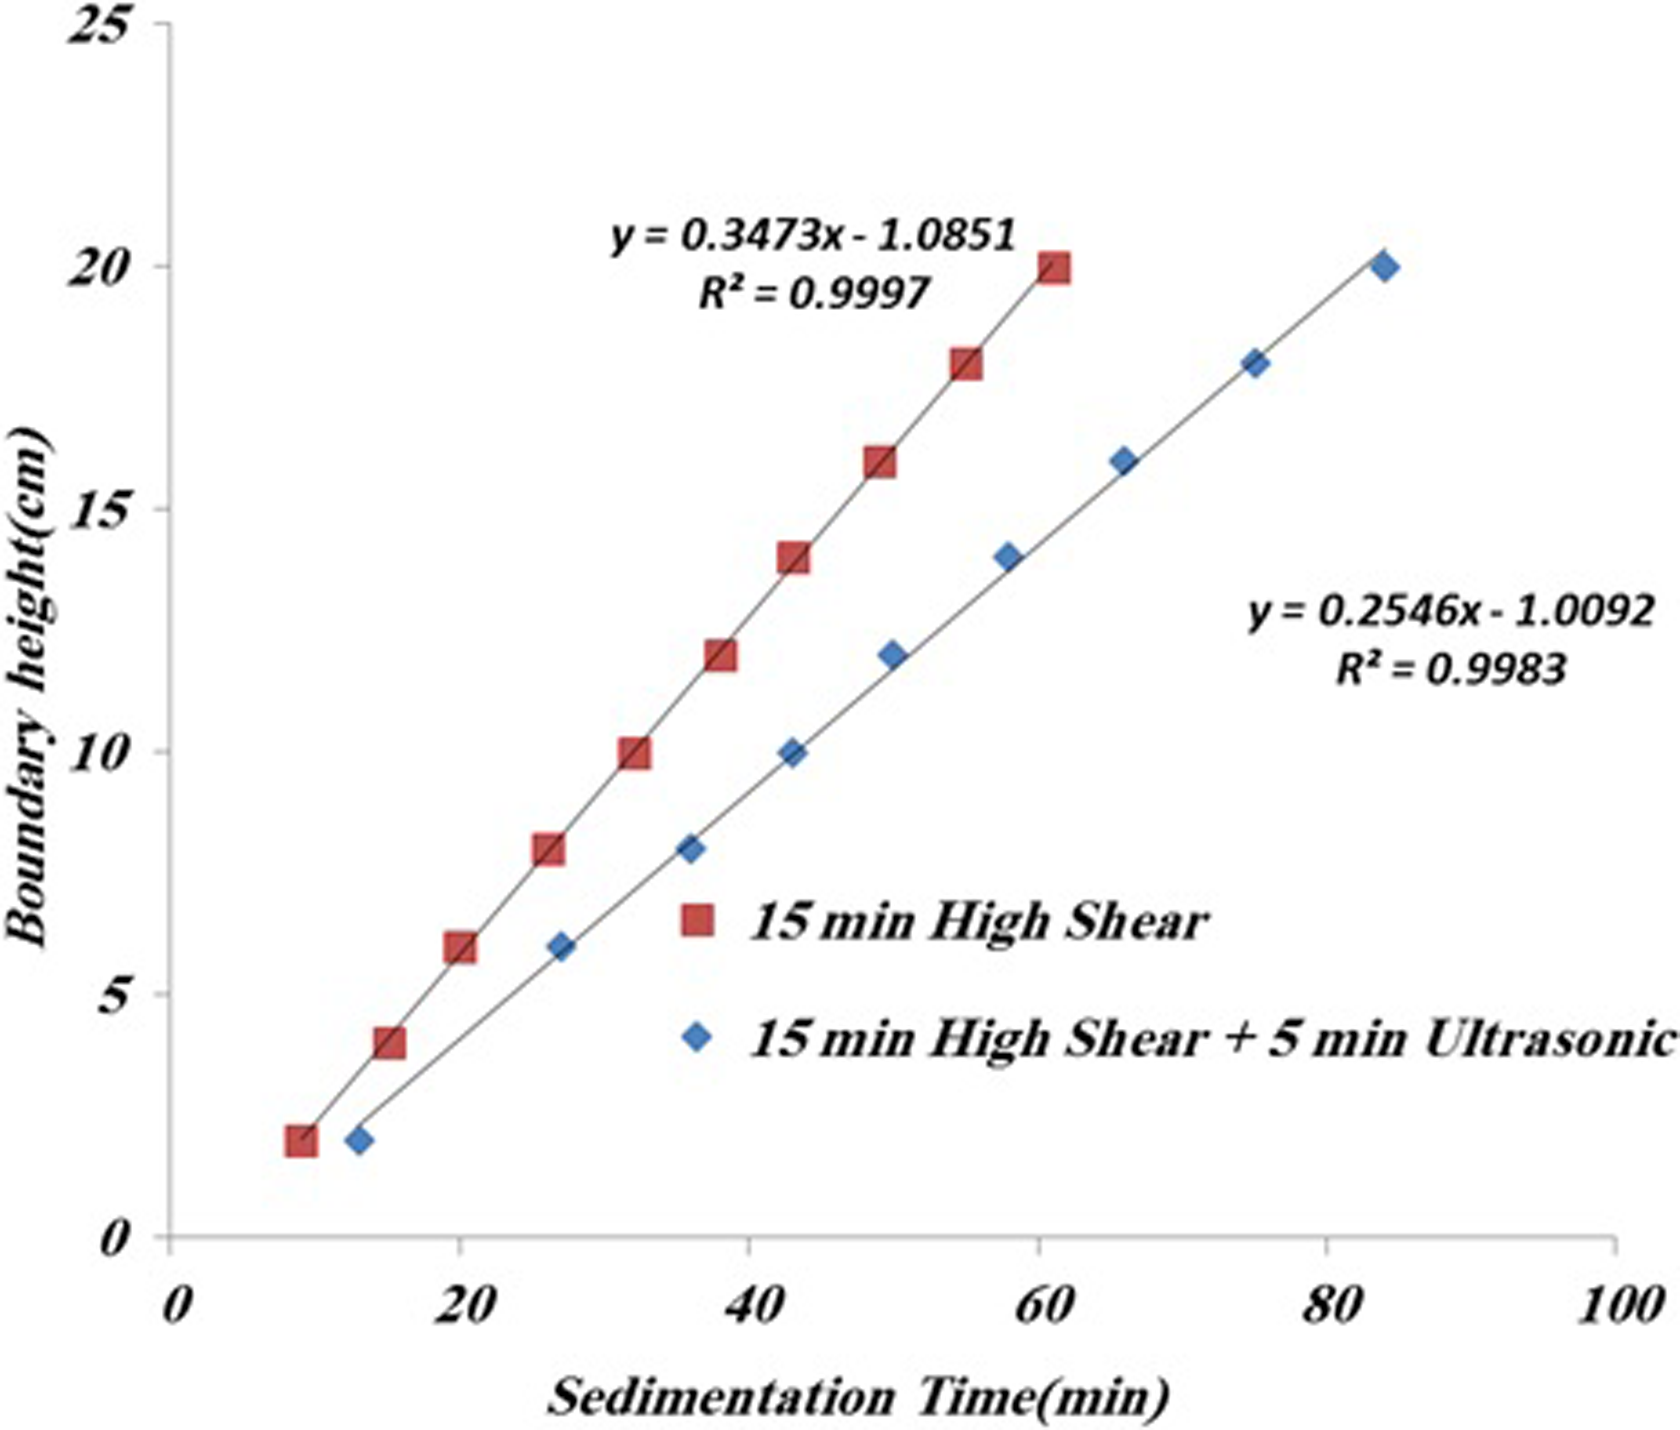
Effect of ultrasonic waves on sedimentation behavior of nanoparticles.
As shown in Figure 7, the slope of middle times decreases and onset time increases with exerting ultrasonic waves. This means ultrasonic energy destroys particle structure more, improves dispersion of systems, and helps the mixer to distribute particles in the media.
Material optimization
The lpp is a good approximation of particle–particle interaction, which affects sedimentation velocity and other suspension properties. Figure 8 shows lpp obtained from equation (4) for 40 nm particle at different particle and polymer concentrations.
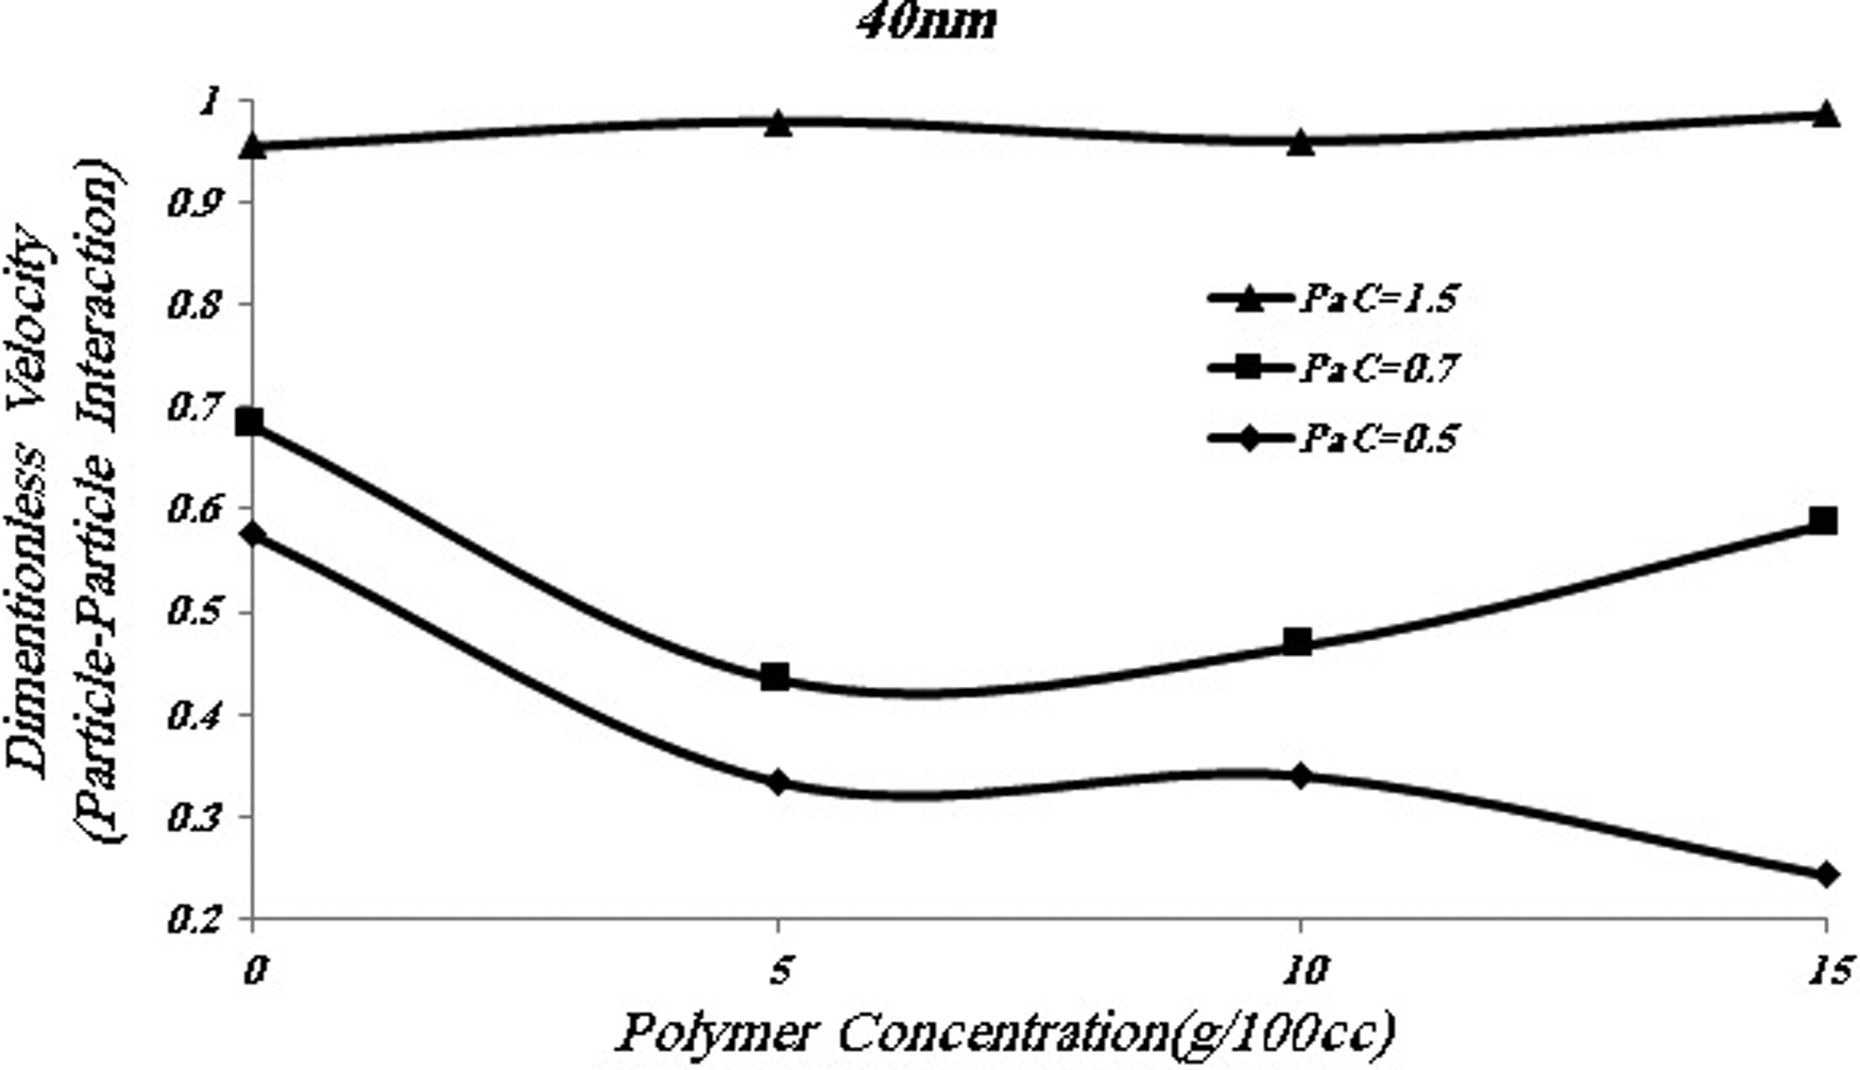
Dimensionless velocity as polymer and particle concentration for suspension contain 40 nm particle.
It is seen that increasing particle concentration results in an increase of particle–particle interaction and tendency of particles to form a network. This behavior has a bad effect on the mixing quality. Higher particle–particle interaction tends to particle aggregation, so in the mixing process, the concentration of particle must be as low as the process economic optimization allows.
In this mixing method, the energy needed to breakdown particles is provided from shear stress that is exerted from mixer blade. Higher shear stress helps the system to achieve better mixing quality. For a certain mixer, the exerted shear stress increases with mixing speed and matrix viscosity. Viscosity of the system increases with particle concentration, but this increase is not effective to achieve a better mixture.
Polymer concentration has a different effect on the particle–particle interaction. Effect of polymer concentration on particle–particle interaction depends on polymer and particle concentration. Under critical particle concentration (C PaC = 0.7 g/100 cc), low amount of polymer in the suspension decreases the particle–particle interaction, as shown in Figure 8.
Silica nanoparticles are polar and polystyrene is not polar. Adsorption of polystyrene chains on the particle surface creates a layer and existence of this layer is proved with DSC tests. 46 This layer decreases the polarity of suspended particles in the media. Lower polarity of the particle tends to lower surface tension, so adsorbed layer decreases the surface tension of particles. The surface tension is the driving force for particles to attract each other, that is, the particle–particle interaction. So, low amounts of nonpolar polymer chain in the suspension systems decrease the particle–particle interaction. It is can be concluded from particle–particle interaction data in Figure 8 that under particle critical concentration or low filled systems, particles are separated, so presented structures in Figure 1(b) and (d) can be offered for low concentration systems.
Particle–particle interaction could also be assumed as a measure of transformed forces through the networks of particles in the suspension. For higher polymer and particle concentration, adsorbed polymer chain layers can overlap and connect particles to each other. Forces can transform through the adsorbed polymer chains, so they have higher particle–particle interaction in comparison with those with lower concentrations of particle and polymer. This behavior can be seen in Figure 8 from comparing data for polymer concentration = 5 g/100 cc to the polymer concentration = 10 g/100 cc or polymer concentration = 10 g/100 cc to polymer concentration = 15 g/100 cc where particle concentration = 0.7 g/100 cc. Hence, in the suspension of particles, polymer chains can connect particles to each other and resist to the distribution of particles. Consequently, higher amounts of polymer chains have a bad effect on the mixing quality.
At the same rotational speed of mixer, higher polymer concentration helps to break up of filler structure due to the higher transformed shear tension to the filler structure in more viscous systems. So, in the mixing process, more viscous systems have higher dispersion state. However, particles cannot diffuse easily through viscous media, so more viscous systems have lower distribution states.
From presented data in Figure 8, it is clear that above the particle critical concentration, C PaC, or in high filled systems, the existence of polymer chains in media cannot affect particle–particle interactions. So, it is safe to say that particles connect to each other directly and form a direct particle network. Consequently, polymer chains leave the surface of particles and let particles connect directly. So, structures (a) and (c) presented in Figure 1 can be predicted for high filled systems. Estimated data in Figure 8 are taken from middle time of sedimentation where the system reaches to thermodynamic stability, so formation of this structure for high filled systems cannot be ignored for stable systems. Thus, restructuring of particles after removing mixing energy reduces the quality of distribution of final products. Hence, studying the structure of final product for the investigation of mixing quality is not a proper method.
For high filled systems, probability of particles meeting each other and forming particle clusters during mixing process and after removing mixing energy is high. So, at this particle concentration, the mixing quality is expected to not be good from distribution point of view. Therefore, for preparing nanocomposites by solution casting method, it is better to use particle concentration below the critical ones.
Changing in dispersion state can affect structure of particles in filled systems. Better dispersion state means smaller aggregates in the suspension. Using original smaller particles at the same concentration in filled systems behaves like using the same particle in concentration and primary size at different dispersion states. For studying the effect of dispersion quality on mixing quality of final products, sedimentation tests are performed for various particle sizes and lpp is estimated. In Figure 9, estimated dimension velocity at various polymer concentrations for suspension containing 20 nm and 40 nm particles is presented.
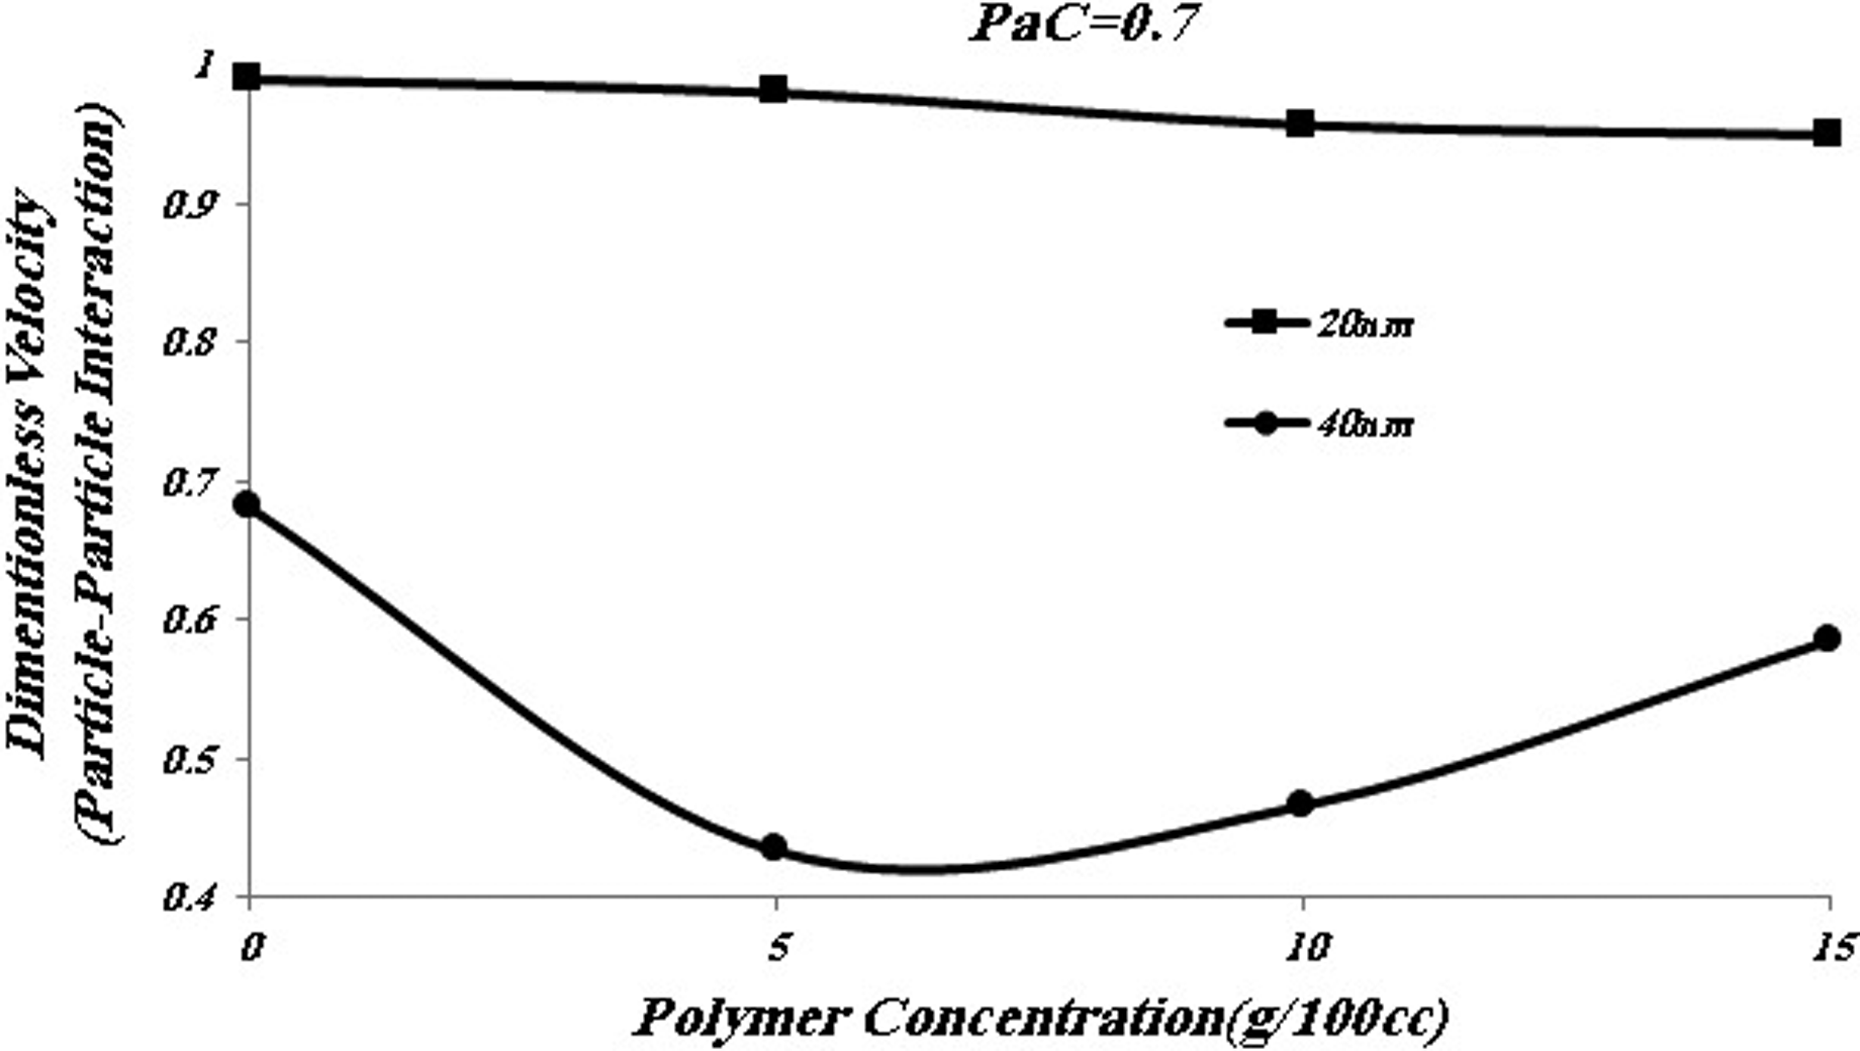
Dimensionless velocity for different particle sizes.
According to this figure, reduction in aggregate size of particles tends to higher particle–particle interaction, which motivates them to form a network. Hence, the structure presented in Figure 1(b) has higher tendency to convert to the structure in Figure 1(a) than (d) converts to (c). Therefore, systems with better dispersion quality have higher tendency to reduce their prepared distribution state after removing mixing energy. Consequently, higher mixing intensity which results in smaller aggregates in the matrix has a contradictory effect on the final product’s texture and mixing quality.
The optimize particle and polymer concentration is where the interaction between particles in the suspension was as low as possible. Polymer chains in the concentrated solution form a network. Hence, the operating concentration for polymer in the mixing process must be lower than the concentration where chains form a network. The relative viscosity of polymer solution is 1.24, 4.42, and 55.15 for 5 g/100 cc, 10 g/100 cc, and 15 g/100 cc solvent, so the 10 g/100 cc is the critical concentration, and the operation concentration for polymer must be lower than 10 g/100 cc . This conclusion is clear regarding Figure 8. The operation concentration for this particle (40 nm) is 0.7 g/100 cc, because the concentration is as high as possible, and the particles do not form the network.
Conclusion
In this study, the effects of particle size and concentration, existence of polymer chains along with the mixing input energy type and amount on the mixing quality are investigated with sedimentation of particles through suspension. For this purpose, dynamic of particles is studied directly after removing mixing energy at various input energies. It is found dispersion and distribution of particles in suspension improve with increasing input energy until an optimum value. Also, ultrasonic energy helps to reduce particle aggregates size and high shear mixing improves distribution of particles in a suspension.
Lower particle–particle interaction tends to achieve better mixing quality. Sedimentation tests are performed to estimate particle–particle interaction at various particle sizes and concentrations as well as different polymer concentrations. From sedimentation velocity, parameters like particle–particle interaction are defined and verified. It is concluded that low amount of nonpolar polymer in the suspension of polar particles reduces the particle–particle interaction. Higher amount of polymers creates indirect network in the suspension with bridging the particles to each other. This network prevents the particle dispersion and reduces the mixing quality. In a highly particle filled suspension, polymer cannot affect thermodynamics of the system. Also, in this case, particle–particle interaction is independent of polymer concentration; therefore, existence of polymer chains cannot affect the mixing quality thermodynamically.
Footnotes
Declaration of Conflicting Interests
The author(s) declared no potential conflict of interest with respect to the research, authorship, and/or publication of this article.
Funding
The author(s) received no financial support for the research, authorship, and/or publication of this article.