
Abstract
Shear strains during processing affect the agglomerate size of nanoparticles in nanocomposites and their final behavior in various applications. In this study, dielectric characterization technique as a novel and well-effective method is applied for quantitative measurement of average agglomerate size in polymer nanocomposites under shear strain sweep, combining with an existing analytical model. Examining how changes in filler content, surface energy and polarity of particles and the matrix control the strain-dependency of agglomerates size, two different nanoparticles, namely, titanium dioxide (TiO2) and carbon black (CB), with same average diameters and volumes were added to polystyrene (PS). It was found that larger agglomerates were present in the PS/CB nanocomposite prior to shearing and the CB agglomerates were less prone to deagglomeration under shear strain. This behavior was attributed to higher polarity of CB nanoparticles, leading to higher tendency for agglomeration and higher resistance to shear, in respect to TiO2 nanoparticles.
Keywords
Introduction
Among the various material and processing parameters affecting the final performance and application of a nanocomposite (such as particle size, surface physics, concentration, and etc.),1–7 the dispersion and agglomeration state of nanofillers is of most importance.8–14 The dispersion state in a nanocomposite is representative of the inter-particle and particle-matrix interactions.15–17 Generally, a well-dispersed nanocomposite is achieved at lower nanofiller concentration resulting in superior properties compared with conventional composites.18,19 Therefore, many efforts are invested to improve the dispersions state of nanofillers inside the matrix. One applicable method is the application of large shear forces which causes agglomerates to break down leading to a better dispersion state.20–25
At high filler loadings, particles are more prone to agglomeration stemming from their high intermolecular van der Waals interactions which increases with reduction of inter-particle distance.1,19,26 The agglomeration phenomenon occurs when the forces which bind particles together exceed the forces that try to separate them. 8 These forces depend on the polarity and surface energy of both the matrix and the particles, as well as particle size and aspect ratio. For a specific particle size and aspect ratio, there is more chance of agglomeration with larger difference between the degree of polarity of particles and the matrix.1,8 In polymer nanocomposites, the rigid nanofiller network structures (agglomerates) determine and control their viscoelastic behavior, because aside from formation of the nanofiller network directly from filler-filler interactions, the bridging particles by polymer chains has a notable impact in the aggregate formation.27–29
Since dispersion of nanoparticles in a nanocomposite is often critical for achieving be spoke properties, it is essential to characterize nanoparticle dispersion state accurately in the matrix and track changes in the microstructure during processing. Visual techniques such as Transmission Electron Microscopy (TEM) and Scanning Electron Microscopy (SEM) are often used to assess the dispersion state of nanoparticles in a matrix. 30 Rheology is widely used for tracking the effect of shear strain on the dispersion state of nanocomposites through analyzing storage and loss modulus versus strain amplitude and interpreting their viscoelastic behavior.20,22 In this method, a linear viscoelastic behavior is observed at small strain amplitude regions and when the shear strain reaches a critical value, a non-linear rheology is observed which adds complications to material response and its interpretation. 31 In some cases, a rheometer is equipped with SEM to track the changes in microstructure with shear forces, visually. However, microscopic techniques such as SEM and TEM can only provide a qualitative measure of particle dispersion on a very a small scale of the specimen, which is not necessarily an accurate representation of the entire sample.32,33 In addition, the simultaneous involvement of both inter-particle and polymer-particle interactions and their impact on the rheological properties (such as storage and loss modulus) can result in misinterpretations in detecting the agglomeration state of a nanocomposite. In other words, increase or reduction in the mechanical properties measured using rheology cannot be an accurate indication of improvement or deterioration of dispersion state in a nanocomposite. In some cases, a dispersed structure leads to a lower mechanical improvement than its agglomerated structure, due to surface physics of components and their interactions as demonstrated by rheological parameters. 34 The dielectric characterization technique is regarded as an alternative tool for non-destructive analysis of particle dispersion state in nanocomposites.35–37 It is possible to distinguish the impact of inter-particle and particle-polymer interactions on the effective dielectric properties of composites at higher frequency ranges in dielectric analysis. Moreover, incorporation of existing models for prediction of agglomerate size in conjunction with the dielectric technique assist better understanding and quantitative characterization of particle dispersion state in nanocomposites.38,39
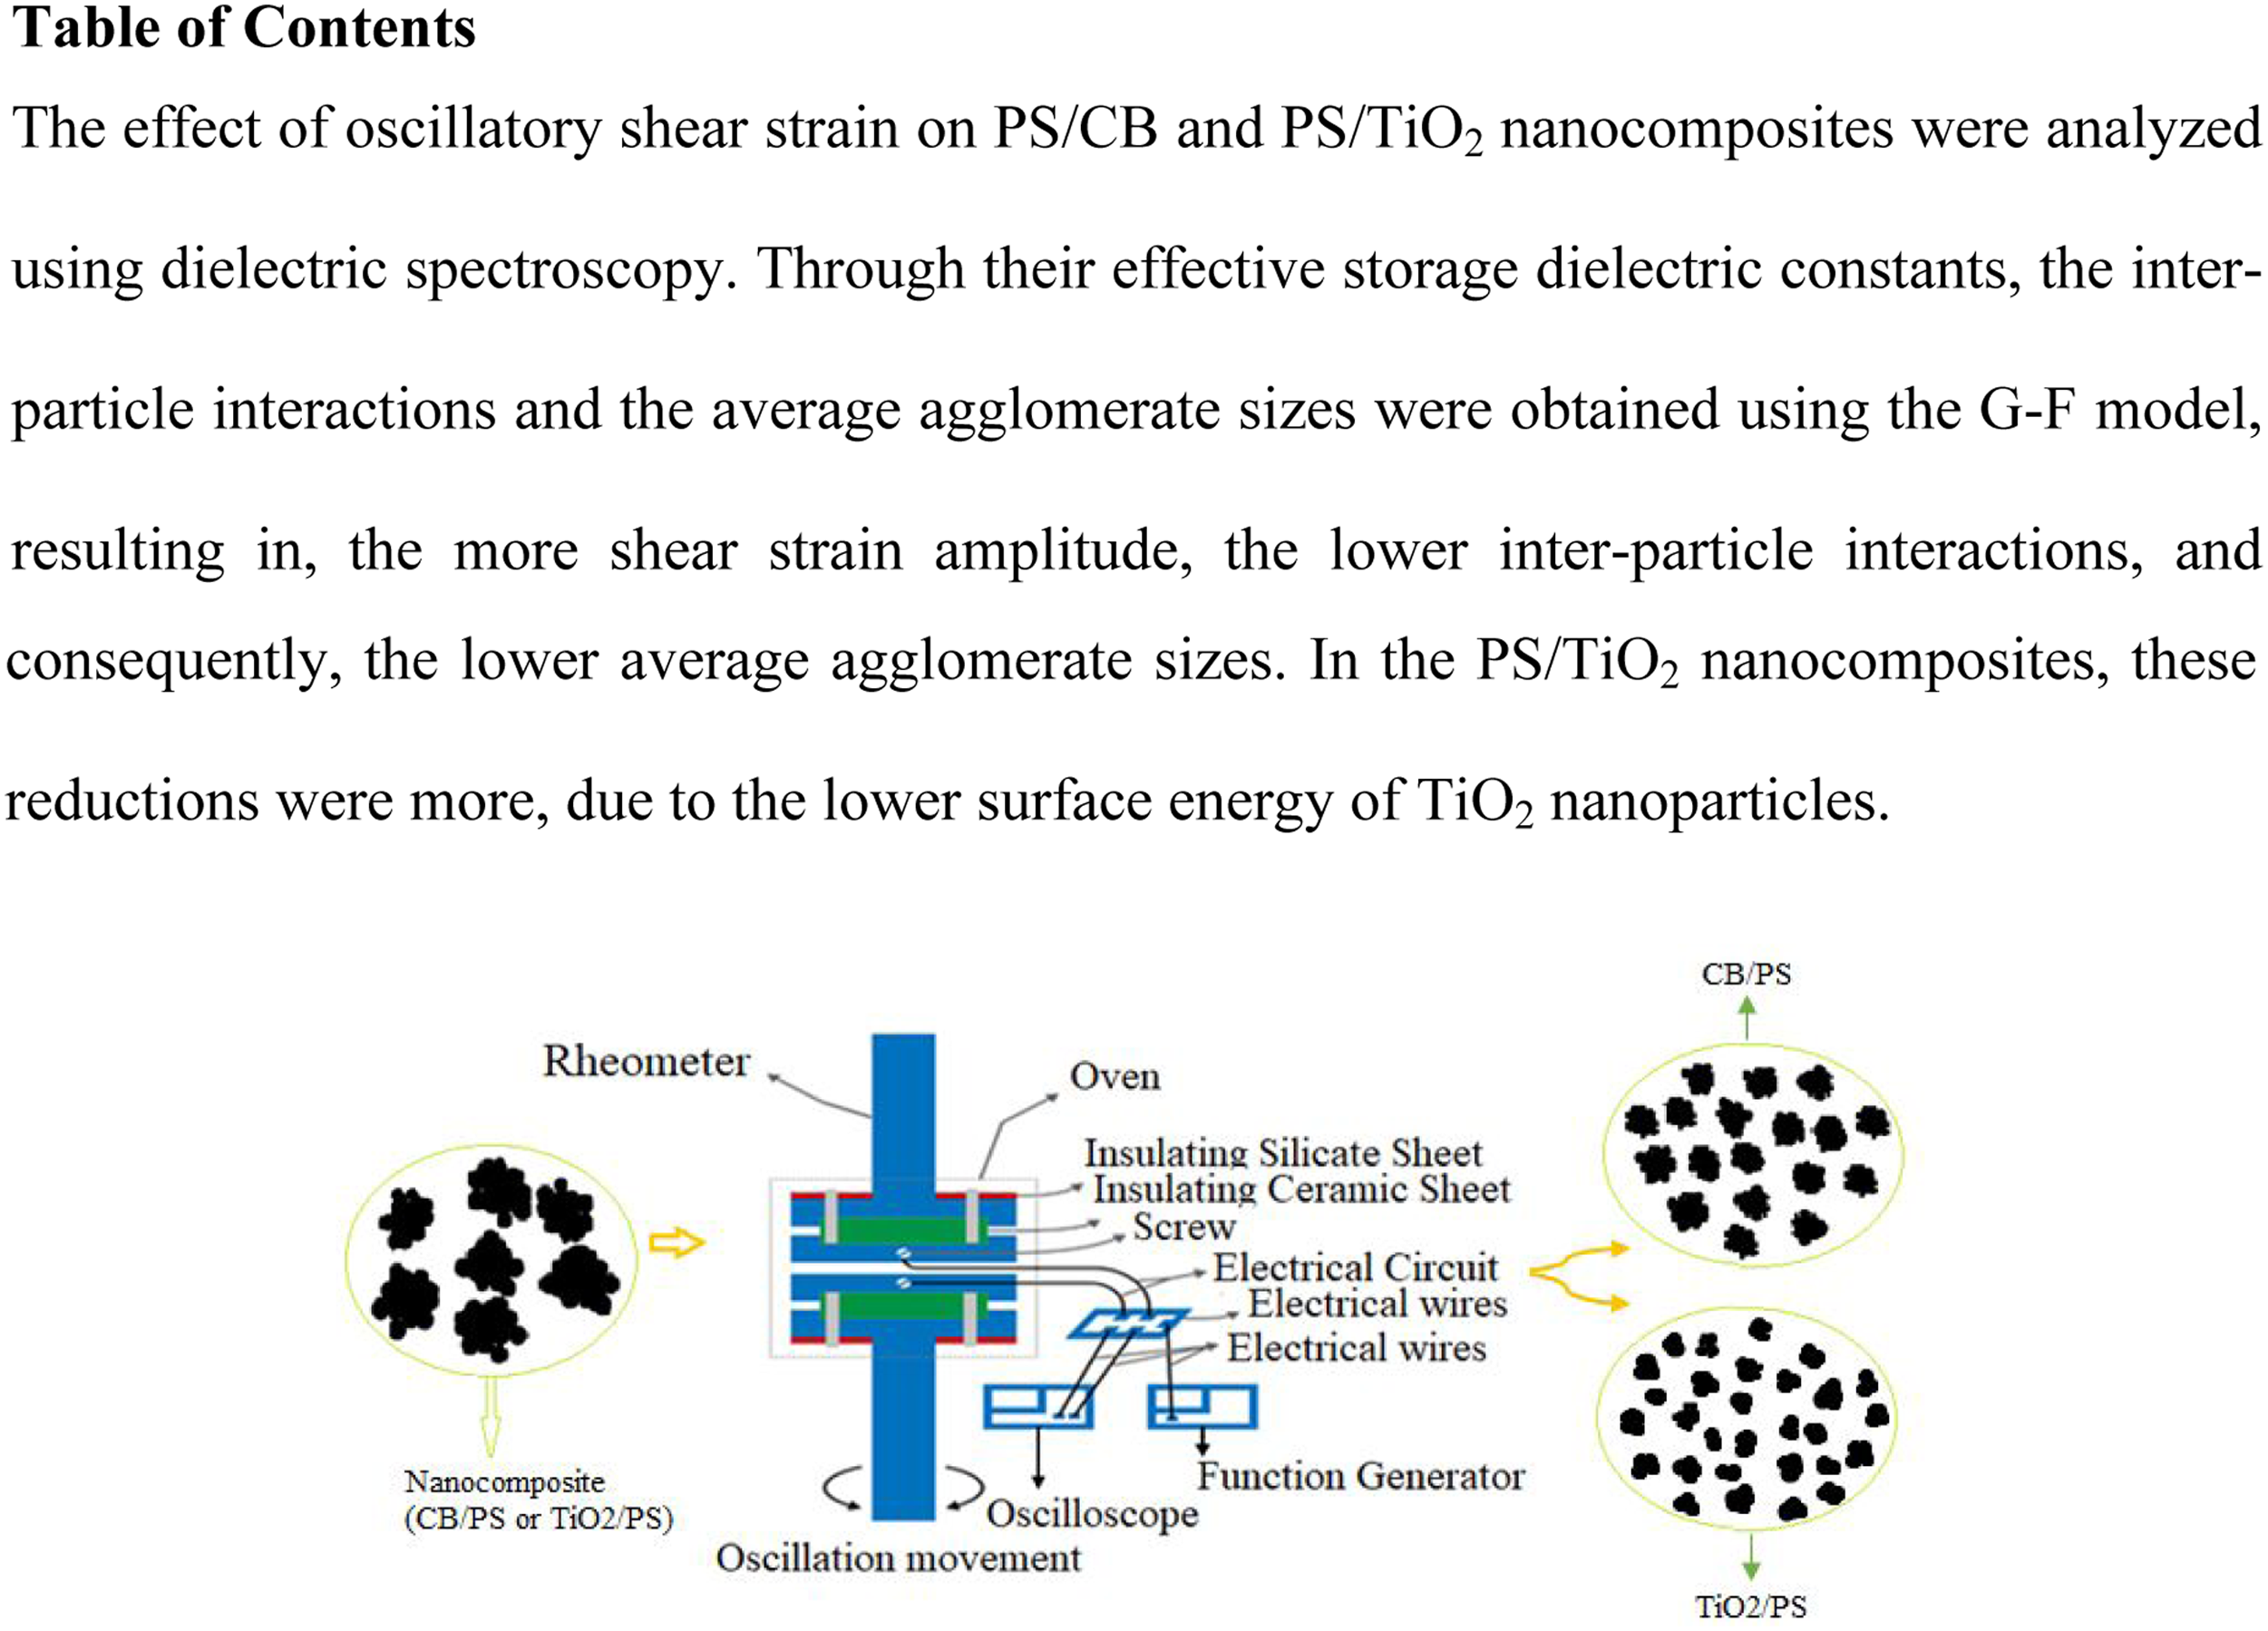
In the present study, we aim to analyze the effect of oscillatory shear strain amplitude on the dispersion state of two different types of nanocomposites containing dielectric and electric conductive nanofillers using dielectric technique as a novel and well-sufficient approach. Strain sweep has been found to affect nanofiller networks according to their components’ polarity and surface energy, as these are parameters that determine the filler-filler and filler-polymer interactions.40–43 So, another underlying goal of this study is to analyze how oscillatory shear strain affects nanocomposites with particles of different surface energy and polarity (TiO2 and CB, respectively).
The model developed by Golbang et al. for quantitative characterization of particle dispersion, which is referred to as the G-F model, is applied for interpreting and measuring the average agglomerate size in the nanocomposites based on the obtained dielectric response at high frequencies. 33 In previous works the model was verified in a controlled environment employing applicable SEM pictures.32,33 In dielectric characterization technique, two phenomenon including interfacial polarization between filler and matrix, 44 and filler-filler interactions control the dielectric properties. The interfacial polarization or the space charge phenomenon, formed by negative and positive space charges at the interfaces of materials under an electric field, 45 is only visible in the low frequency regions. 46 So, in the high frequency region, only the impact of inter-particle interactions play a role in the dielectric response and consequently, it is possible to differentiate between the filler-polymer and filler-filler interactions.47,48 This would be useful for more accurate interpretation of agglomeration state in a nanocomposite. It should be noted that since the voltage frequency response differs in nanocomposites comprised of conductive and dielectric constituents due to the interfacial polarization effect between the particles and the matrix, interestingly, the association of high frequency region, as indicated in the G-F model, could be interpreted differently depending on the type of particle.49–51 As such, a set of contrasting nanoparticles were used to show the difference in the sensitivity of dielectric characterization of dispersion of nano composites based on conductivity or permittivity of the nano particles. The contrasting particles were nano Titanium dioxide with a high dielectric constant and nano CB with a high conductivity. Both particles were used without any surface treatment, hence, a non-polar matrix like PS has a rather similar interlayer polymer deposition on the nano particle agglomerate surfaces.
Experimental
Material
Polystyrene (PS) 336 with a molecular weight of 20,000 was purchased from Tabriz petrochemical company. Rutile titanium dioxide (TiO2) and carbon black (CB) spherical nanoparticles, with average diameter 20 nm, were purchased from Nano Sani Company. The effective storage dielectric constants of the purchased TiO2, CB and PS are 85, 150, and 2.64, respectively.
Toluene and ethanol with a purity of 99% and 97% were applied as solvent and anti-solvent, respectively. To distribute and disperse nanoparticles in PS, a magnetic stirrer with a speed of 1500 r/min coupled with a 2 KW Ultra-sonic homogenizer (ULPS 2000 in-house production) was used.
Sample preparation
PS/CB and PS/TiO2 were produced in three different nanofiller volume percentages of 5, 10, and 17. From previous experience, 52 the nanocomposites with the 17vol% was first made using the solvent/anti-solvent method, and nanocomposites with 5vol% and 10vol% were made by diluting the concentrated sample. In this method, about 15 gr of polystyrene was added to 200 mL of toluene and dissolved by a magnetic stirrer at a temperature of 100°C. Then the nanoparticle was added gradually while sonicating the mixture. The sonication was continued for 30 min more, then a specific amount of ethanol (5 times more than the solvent) was added to the mixture immediately after the end of sonication. The addition of ethanol resulted in the precipitation of the nanocomposite almost free of toluene. To ensure evaporation of the remaining minor amount of toluene in the precipitate, the collected nanocomposite was crushed into small pieces and dried for 24 h in a vacuum oven and the resulted dried granules were pressed to a disk of 50 mm radius, 1.2 mm thick using a 5-ton hot press at 150°C. 52 For the samples containing lower filler volume fraction, the required amount of neat polystyrene solution was added to the concentrated mixture during the sonication stage.
Characterization
A rheo-dielectric setup with a voltage frequency range of 10−6–107 Hz was employed. In this setup, the material was put between two parallel plates (Figure 1) of 50 mm in diameter and 1.2 mm apart. For this work, 5 AC voltage with a variable frequency in the range, 10–106 Hz with logarithmic intervals, was used. An oscillatory shear strain sweep tests from 0% (no movement or static state) to 468% at 52% strain intervals were imposed on the sample. All the data were collected at 1 rad/sec strain rate and a temperature of 180°C. At each shear strain, the steady-state data was used for the analysis. The schematic figure of the rheo-dielectric setup.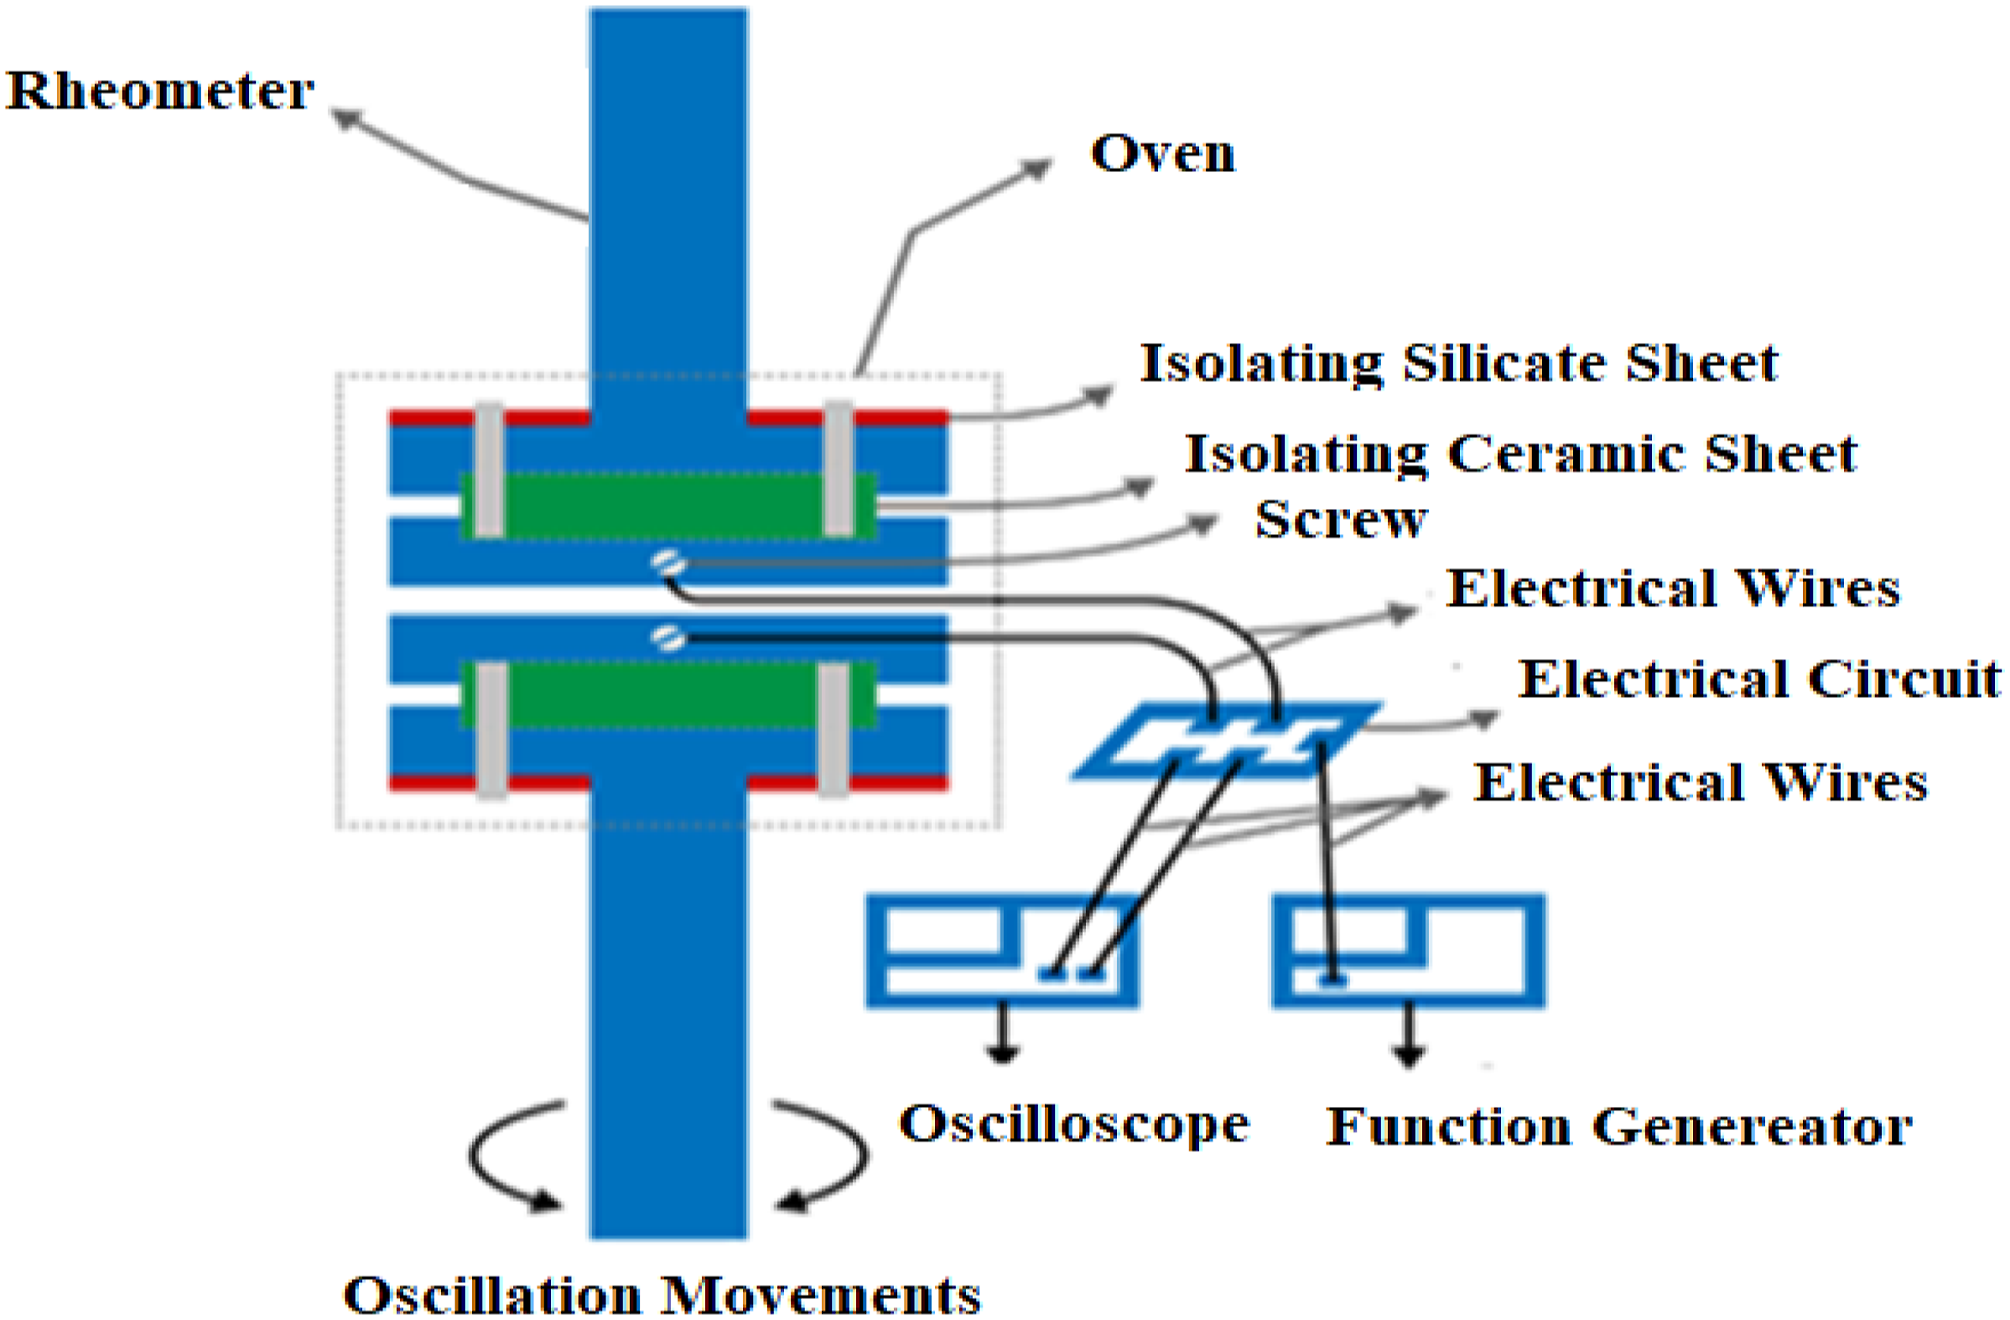
Results and discussion
Dielectric experiments
Figure 2(a)–(c) show the effective storage dielectric (εeff) of the rheo-dielectric experiments on CB/PS nanocomposites. In Figure 2(a)–(c), it is seen that εeff of PS increases with increase in CB vol%, which is expected since CB has higher dielectric constant than PS.53,54 Effective storage dielectric constants of PS/CB nanocomposites under an oscillatory shear strain sweep from 0% (static state) to 468% at 52% strain intervals with 1 rad/sec strain rate, and an electrical frequency sweep from 10 Hz to 106HZ at (a) 5 nanofiller volume percentage, (b) 10 nanofiller volume percentage, and (c) 17 nanofiller volume percentage.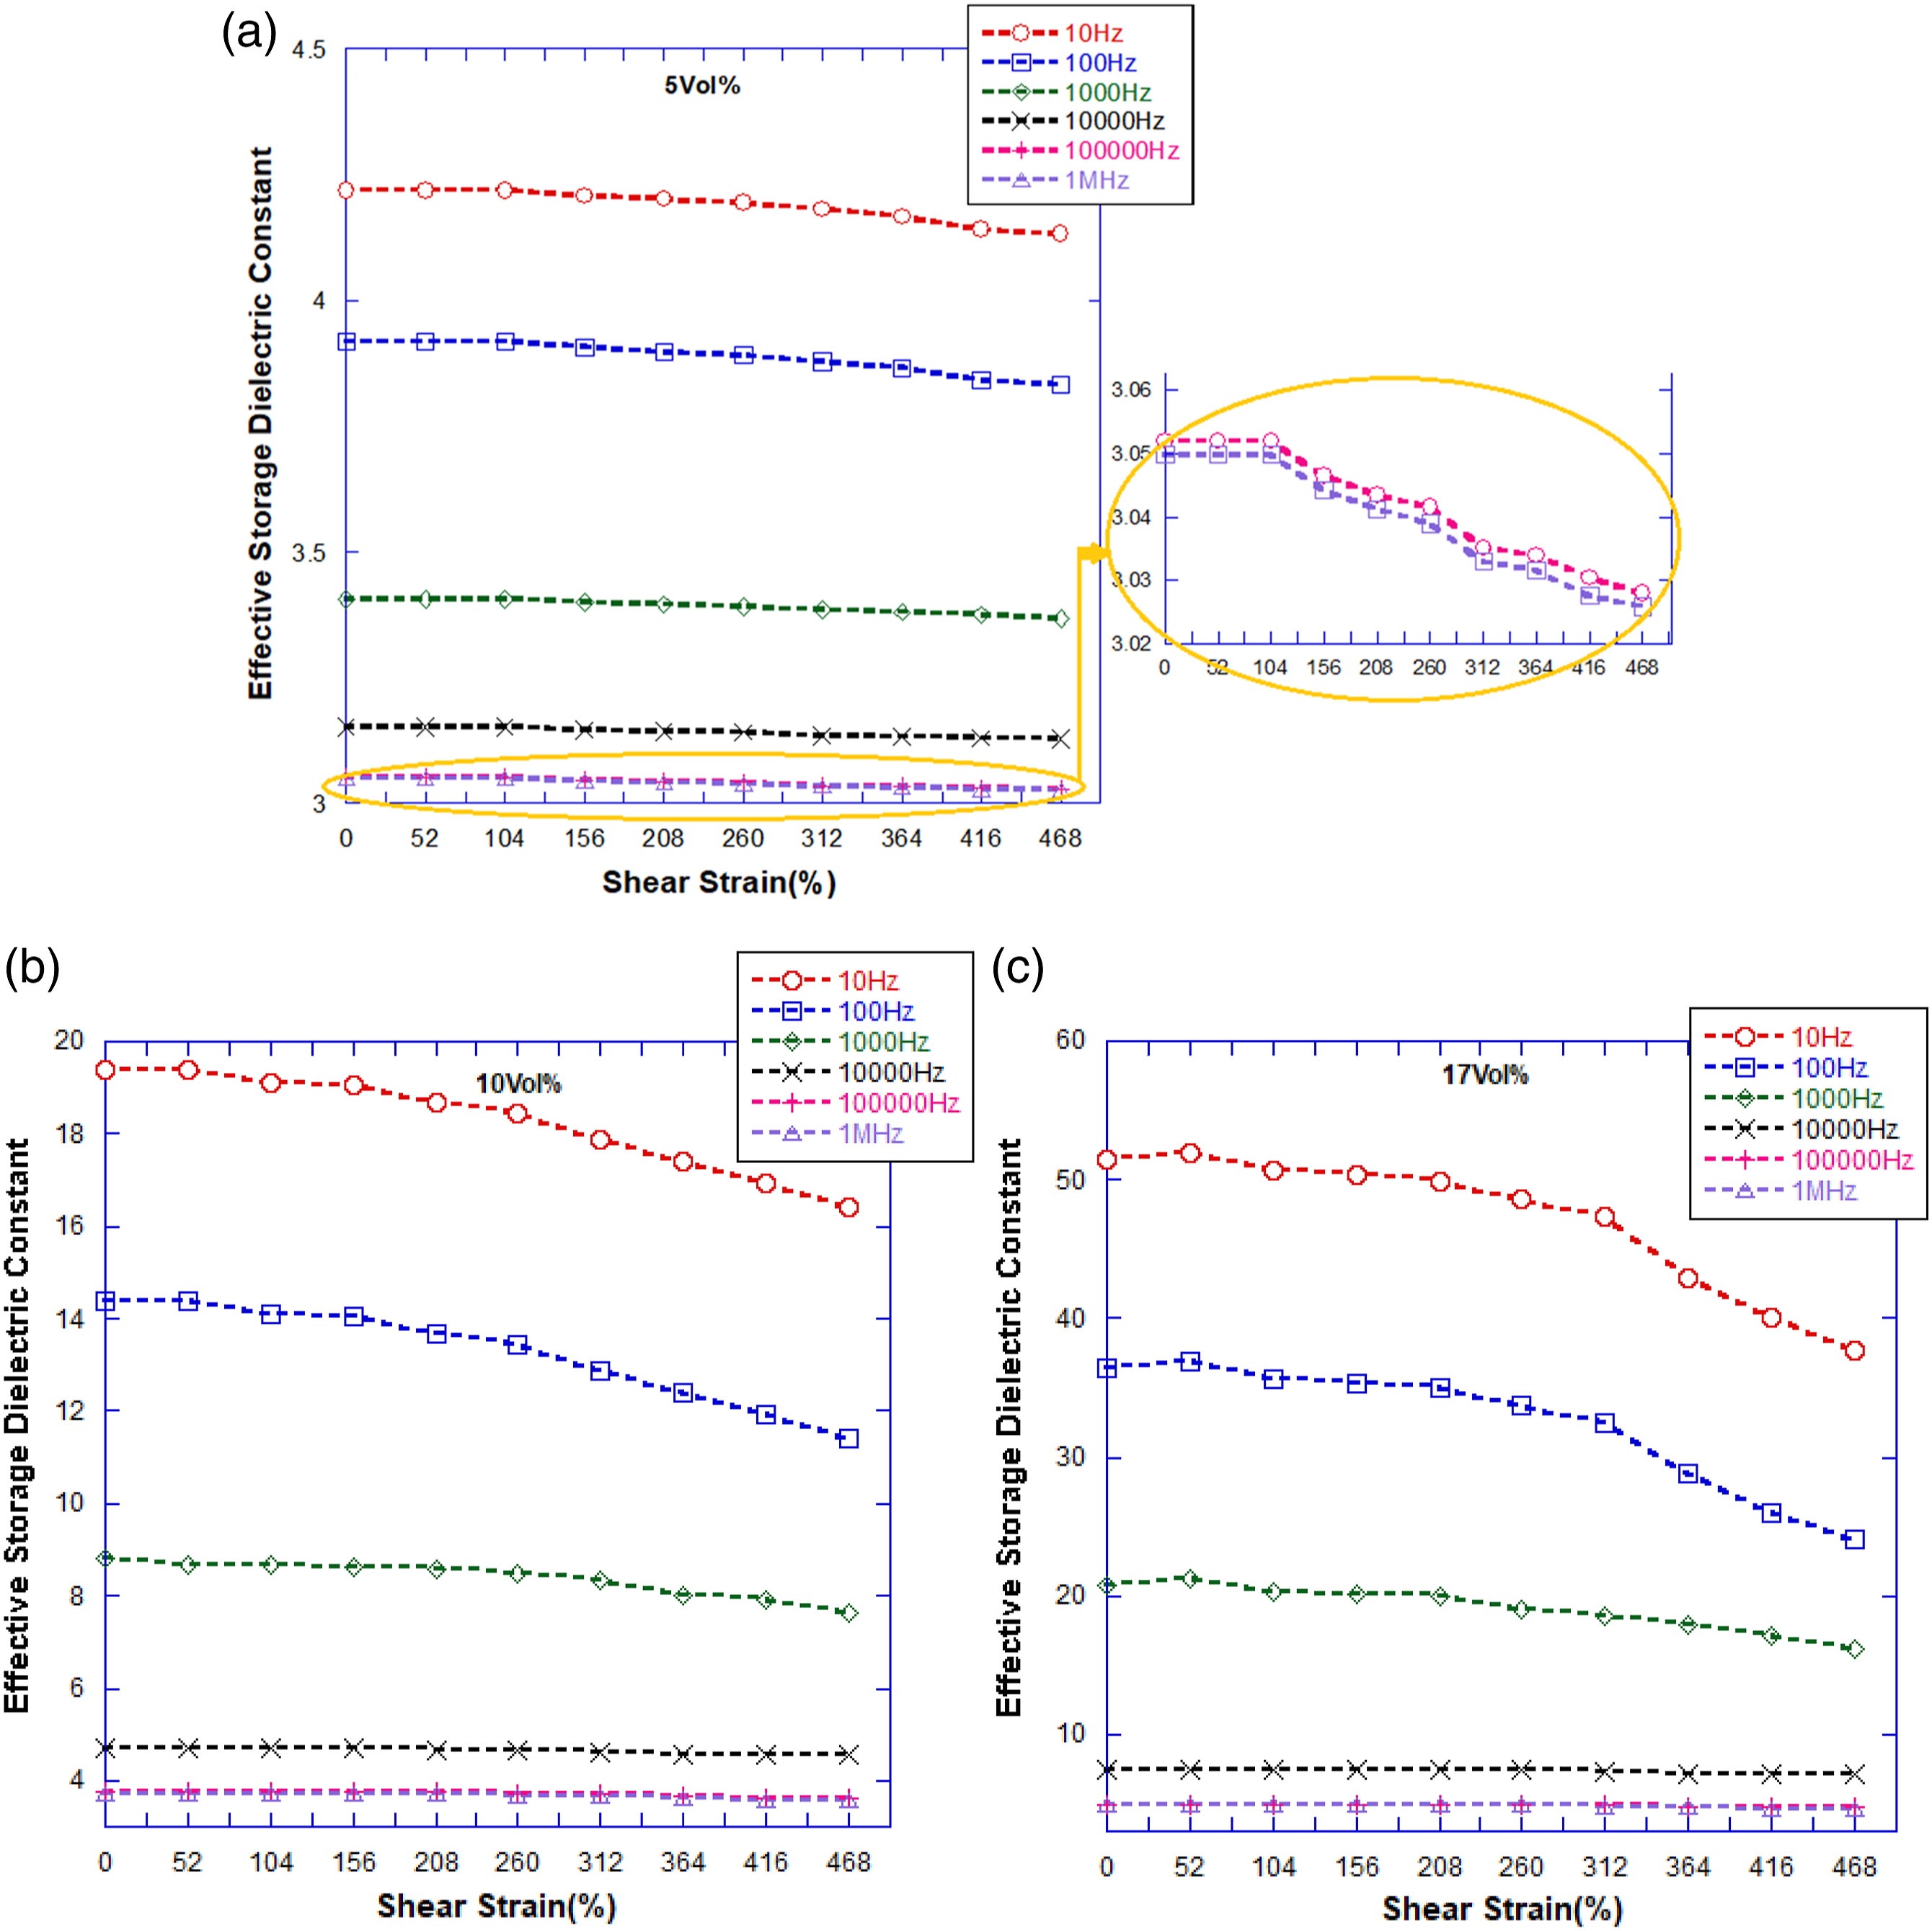
In samples containing 5vol% and 10vol% CB, in Figure 2(a) and (b), variation of the dielectric coefficient with shear strain initiate at a critical strain amplitude
The trend of changes in εeff with shear strain observed in Figure 2(c), at 17 volume percentage of CB nanofiller, is slightly different than that in Figure 2(a) and (b). Initially, there is a slight rise in the εeff with increase in the applied shear strain before it starts to drop continuously. The observed peak resembles strain-induced agglomeration phenomenon in composites, where a strain overshoot is detected in the viscoelastic behavior.24,31,56 So, in this case, the applied shear strain initially induces agglomeration of particles, giving rise to the εeff and then decline with further increase in strain amplitude, due to deagglomeration.23,57,58
In Figure 2(a)–(c), it is seen that changes in εeff, increase with increase in CB vol%, this happen because as the volume fraction increases, the chance for formation of bigger agglomerates rises, leading to more changes in their sizes with strain, in other word, there are more strain-sensitive agglomerates in the system.58–61
Figure 3(a)–(c), demonstrate the effective dielectric coefficients of PS/TiO2 nanocomposites obtained from the rheo-dielectric experiments. Since TiO2 has an intrinsically lower dielectric permittivity than CB, at the same filler loading, the PS/TiO2nanocomposites exhibit lower εeff than PS/CB nanocomposite samples. In general, the trend of changes in εeff with shear strain in PS/TiO2 nanocomposites at various voltage frequencies and filler loading is similar to that described for the PS/CB nanocomposites. However, it is seen that PS/TiO2 nanocomposites are less resistant under shear strain amplitudes comparing to PS/CB nanocomposites and their agglomerations tend to breakdown at lower shear strains, demonstrating the strain softening viscoelastic behavior for all amounts of filler volume percentage. This is indicated by a lower Effective storage dielectric constants of PS/TiO2 nanocomposites under an oscillatory shear strain sweep from 0% (static state) to 468% at 52% strain intervals with 1 rad/sec strain rate, an electrical frequency sweep from 10 Hz to 106HZ at (a) 5 nanofiller volume percentage, (b) 10 nanofiller volume percentage, and (c) 17 nanofiller volume percentage.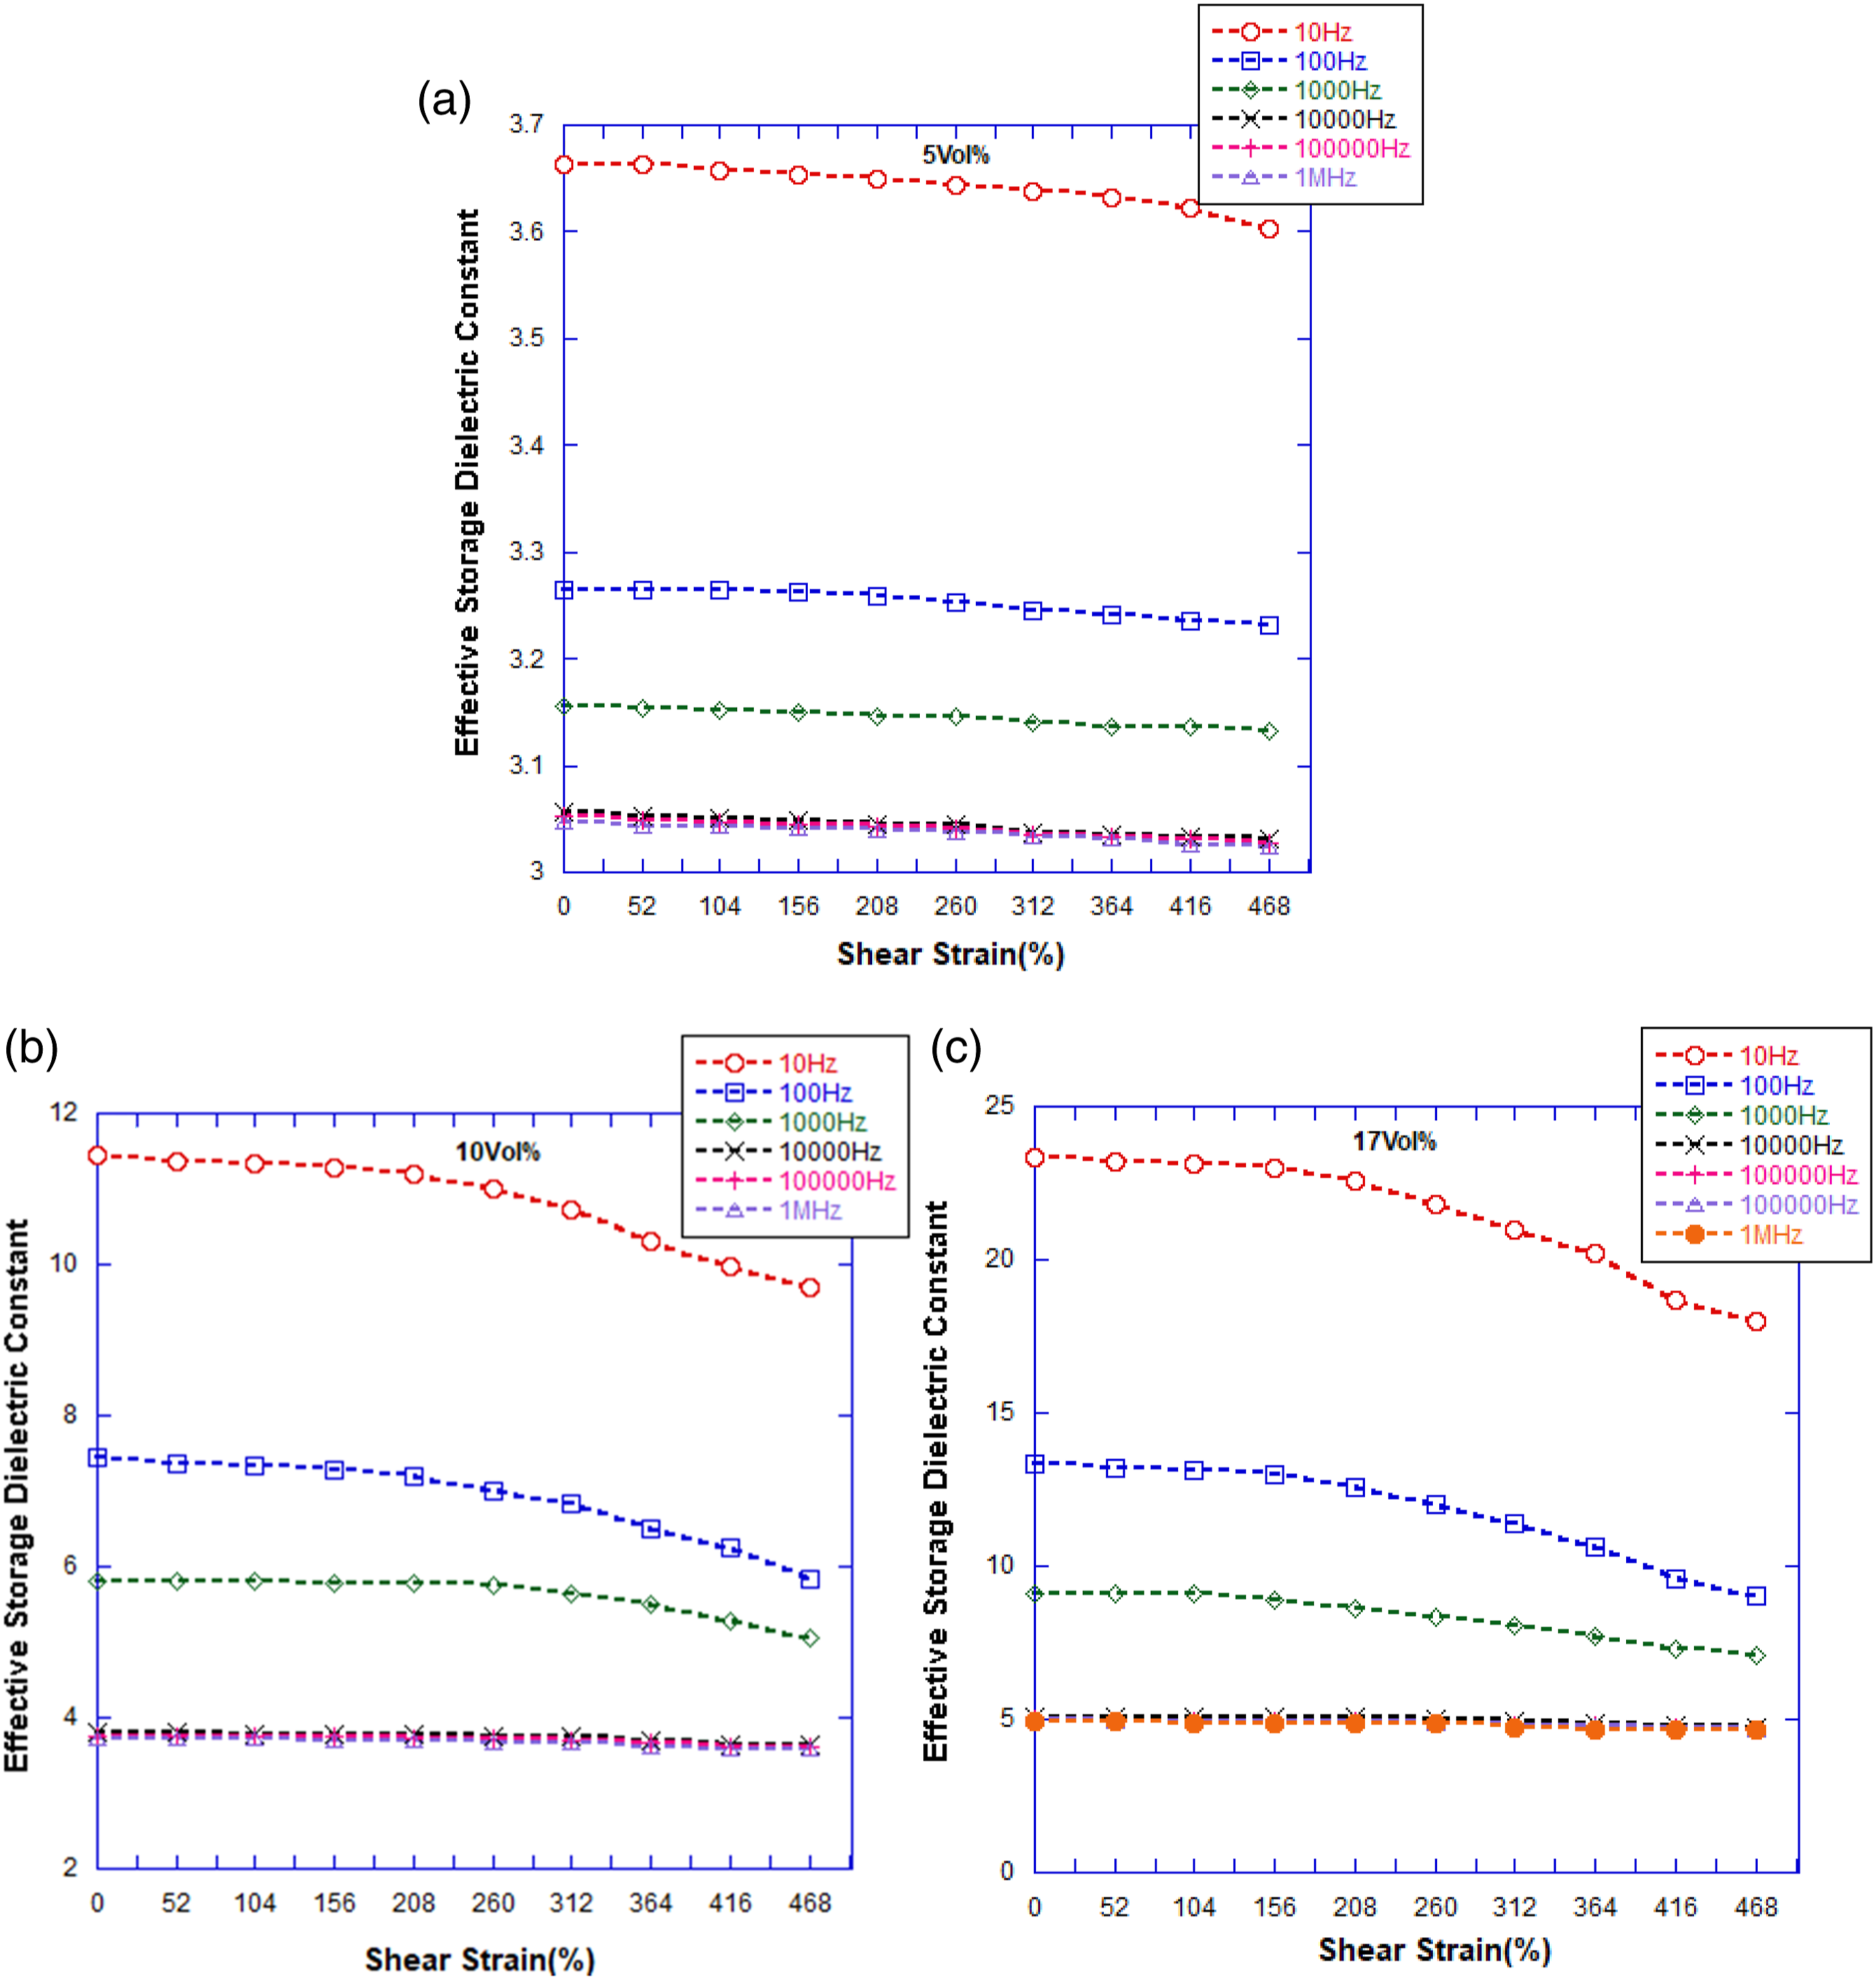
Dielectric properties of a nanocomposite are influenced by two factor including interfacial polarization and inter-particle interactions, but at only low frequency regions (where changes in dielectric results with voltage frequency is observed.) the impact of interfacial polarization is seen as it is observed in Figures 2 and 3.47,67 As the frequency decrease, the interfacial polarization effect decreases too, because it’s a frequency-dependent phenomenon, so it causes vast changes in dielectric results with frequency, until no changes with frequency is observed (where the interfacial polarization effect is omitted.) In a non-destructive dielectric experiment (low electrical voltage ranges), voltage frequencies at which the dielectric results are almost constant (at the same experimental conditions), are so-called high frequencies where there are only inter-particle interactions. 33
Another interesting observation is that the underlying impact of higher surface-free energy of CB compared to TiO2 can related the interfacial polarization phenomenon. It is seen from Figures 2 and 3 that the influence of interfacial polarization between CB and PS continues to almost frequency of 104 Hz and while there is no remarkable interfacial polarization between TiO2 and PS after the electrical frequency of 103 Hz. This happens because CB nanoparticles have higher polarity and conductivity than titanium dioxide nanoparticles, the interface polarization happens faster in PS/CB nanocomposites, and their interfacial polarization effect between CB and PS continues to the higher voltage frequency. 48
Incorporation of the G-F model
To assess and confirm the changes in size of the agglomerates with shear strain in the two nanocomposites quantitatively, the G-F model can be applied against the achieved dielectric data.
The G-F model quantifies the agglomeration state and dispersion degree of nanocomposites at high frequencies at which dielectric constant is only influenced by inter-particle interactions,
33
through:

The model assumes that the nanoparticles within the agglomerates are random, and the agglomerates are distributed randomly within the composite. The A parameter is then expressed by:

Golbang et al. showed that for the case of random particle distribution,
As:

Then, clearly:


Since the G-F model is applicable at higher frequency ranges (at which the dielectric constant is only influenced by inter-particle interactions and the interfacial polarization is negligible), to apply the model to experimental data, the first step is to identify the high frequency range for each nanocomposite. The high frequency range in dielectric analysis is identified as the region where the interfacial polarization (representing the filler-polymer interactions) fade, and only the dipole-dipole interactions (i.e., filler-filler interactions) are present. Hence, only the effect of inter-particle interactions is detected in the high frequency region in dielectric analysis. Therefore, the high frequency region in this study is attributed to the frequencies where no changes in the inter-particle coefficient (A parameter) with frequency is observed (at the same volume fraction and strain amplitude).
The G-F model can be used to calculate the average agglomerate size in a composite material comprised of a non-dielectric matrix and dielectric spherical particles by calculating the A parameter using equations (1) or (4) and (5), knowing the values of R, εeff, εm, εf, and φf. It is worth noting that at low filler concentrations, A≤0.6φf, which means that the composite is either randomly distributed or if A is close to zero, the particles are uniformly dispersed, hence, either way, no agglomerate is formed. When A>0.6φf; particles have formed agglomerates. At zero shear it is safe to assume that R/Ra<<1 (i.e., R/Ra≈0), hence, for this stage from equation (2) A = 0.6φfa. Based on experimental studies, the shear strains applied in rheometry can at most break down the agglomerates in to smaller sizes, while the packing density or concentration of particles within the agglomerate (φfa) remains constant due to high particle-particle interactions. 35 Hence, is safe to assume that φfa is constant during the applied range of shear strain in this study. Therefore, using the φfa obtained from zero shear data, one can track the changes in agglomerate size as the composite is sheared further.
To monitor the changes in agglomerate size with shear strain in this study, initially, the high-frequency limit for the PS/CB and PS/TiO2nanocomposites should be identified. Then, the above-mentioned procedure can be used to calculate the agglomerate size in the nanocomposites at each shear strain.
Applying the G-F model on storage dielectric results
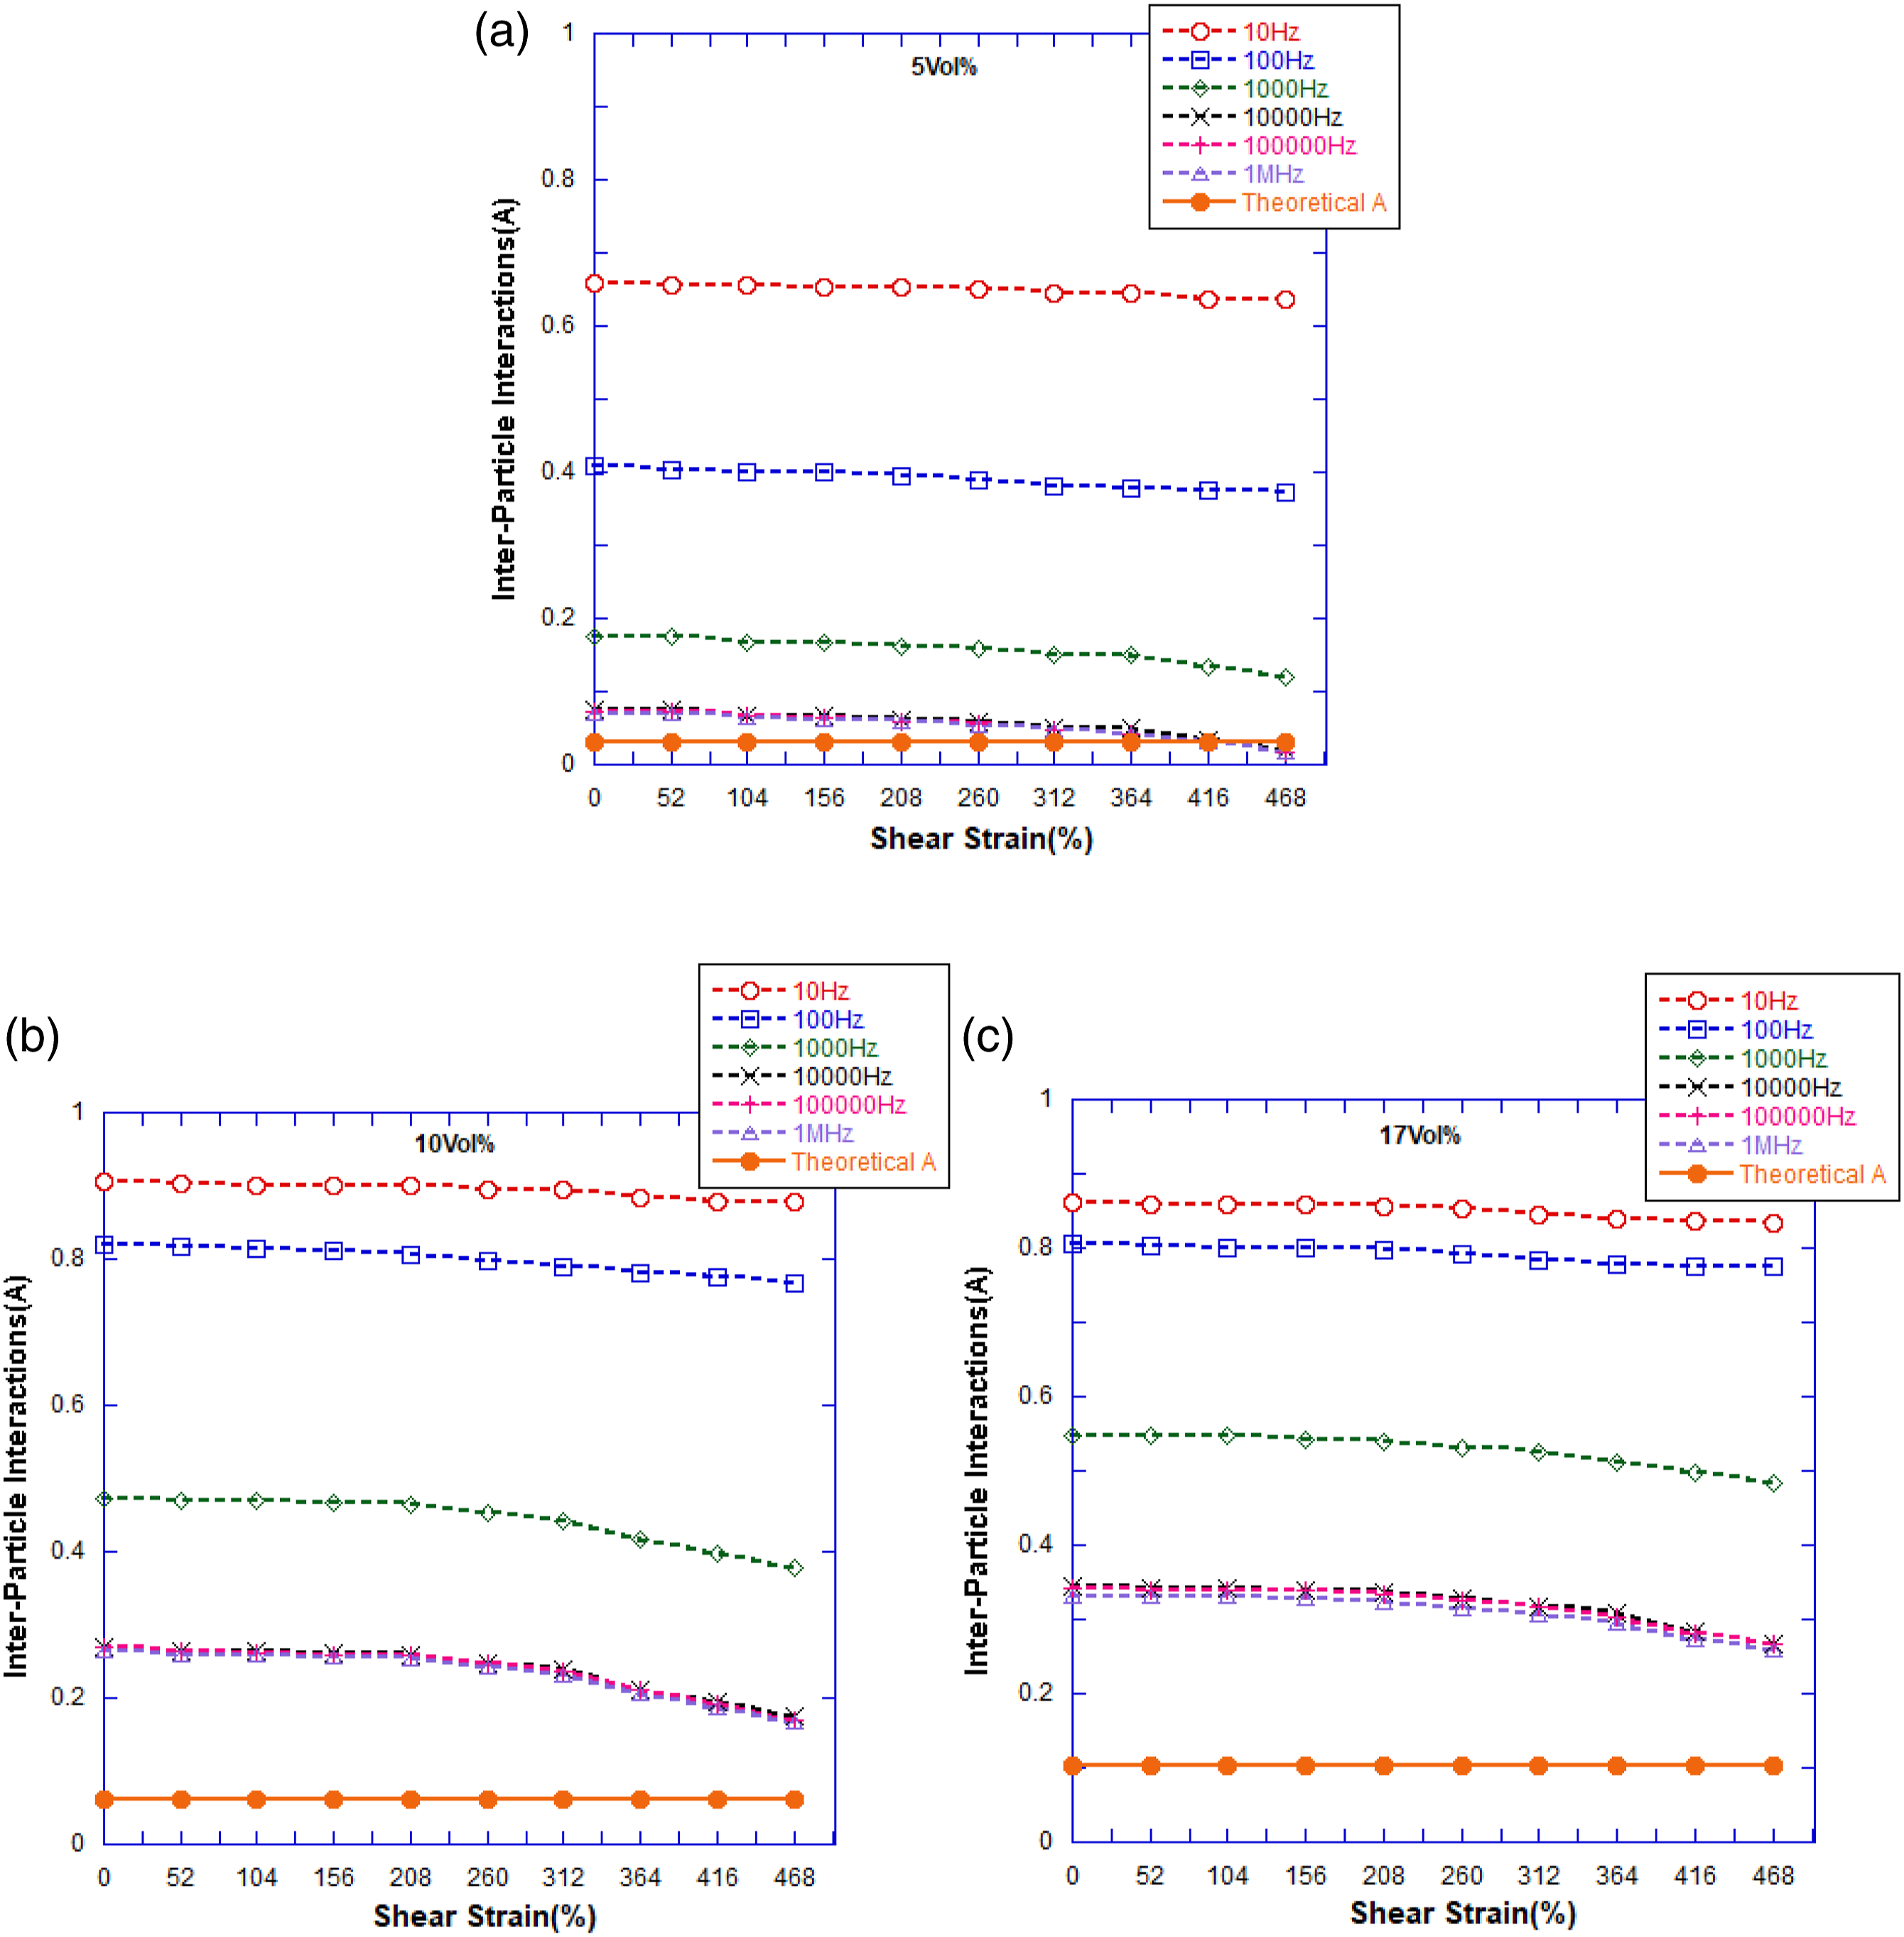
Figure 4(a)–(c) and Figure 5(a)–(c), show the calculated A values for PS/CB and PS/TiO2, respectively. To show the filler concentration limit for the development of agglomerates from fillers the theoretical limit of A = 0.6φf is also drawn in Figures 4 and 5. In other words, this limit ( Inter-particle interactions (A) derived from effective storage dielectric constants of PS/CB nanocomposites under an oscillatory shear strain sweep from 0% (static state) to 468% at 52% strain intervals with 1 rad/sec strain rate, an electrical frequency sweep from 10 Hz to 106HZ at (a) 5 nanofiller volume percentage, (b) 10 nanofiller volume percentage, and (c) 17 nanofiller volume percentage. Inter-particle interactions (A) derived from effective storage dielectric constants of PS/TiO2 nanocomposites under an oscillatory shear strain sweep from 0% (static state) to 468% at 52% strain intervals with 1 rad/sec strain rate, an electrical frequency sweep from 10 Hz to 106HZ at (a) 5 nanofiller volume percentage, (b) 10 nanofiller volume percentage, and (c) 17 nanofiller volume percentage.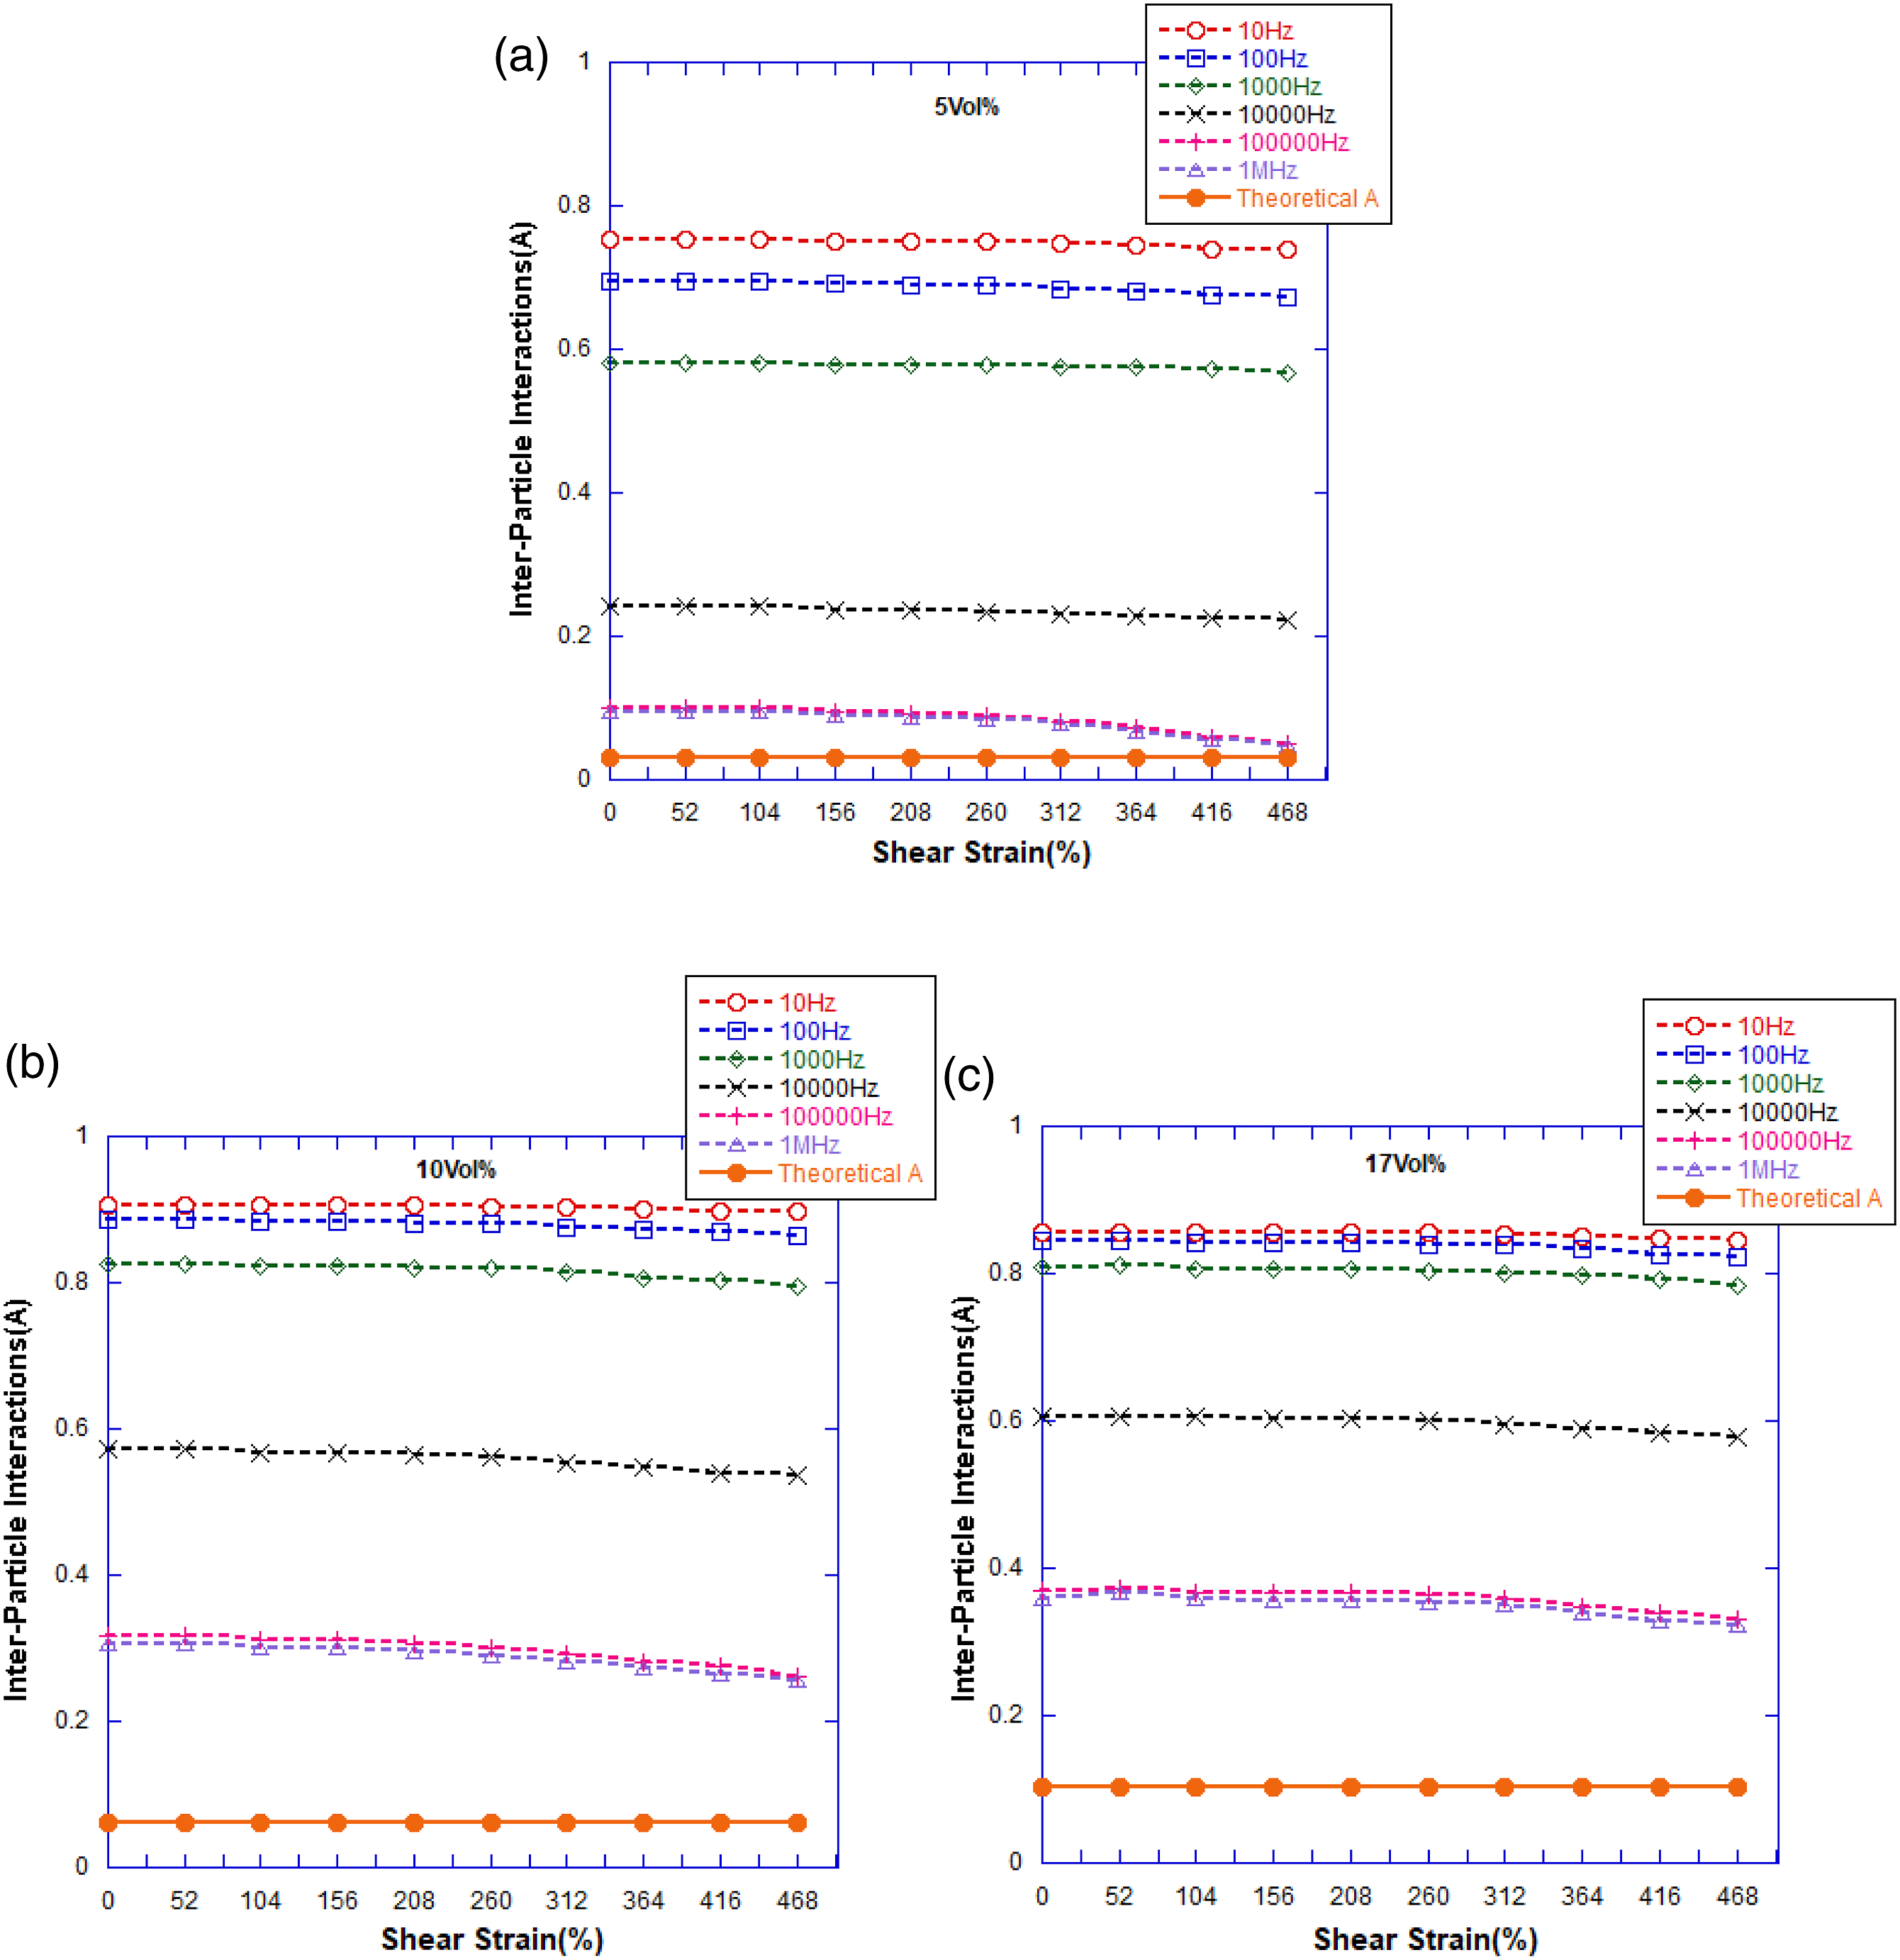
In Figure 4(a)–(c), it is observed that the amounts of “A” parameters calculated at 105 Hz and 106 Hz almost overlap, indicating the high-frequency limit of the G-F model for the CB/PS nanocomposites is 105 Hz, where the interfacial polarization effect disappears. As this model is only applicable for high frequencies, the data obtained from low frequencies (below 105 Hz in this case) are not reliable and cannot be commented on for determining the agglomerate size.
As seen in Figure 4(a) and (b), the amount of A in the high-frequency limit for 5vol% and 10vol% CB reduces progressively with increase in shear strain, reflecting the break-down of agglomerates, particularly at higher shear strains. For the sample containing 17vol% CB, a small rise in the amount of A parameter is observed with the imposed shear strain which represents a slight increase in agglomerates size. Then, the amount of A parameter starts to reduce at higher shear strains. The above-mentioned trend was also observed in the experimental data (Figure 2(a)–(c)). Hence, the changes in the A parameter confirm the discussions made about the changes in the obtained dielectric data and its relation to agglomerate size for the PS/CB nanocomposite samples.
The A parameter is calculated for the PS/TiO2 nanocomposite samples using the same approach and the results are demonstrated in Figure 5(a)–(c). It can be seen in Figure 5(a)–(c), that above the frequency range of 104 Hz, the effect of interfacial polarization disappears, so, this frequency represents the high-frequency range for the PS/TiO2 nanocomposites. Hence, the model is applicable in frequencies from 104 Hz and higher and the model’s data from frequencies below this frequency are not reliable. The reason why the high frequency limit in the case of PS/TiO2 nanocomposites is lower compared with the PS/CB nanocomposites, is that the polarity of CB nanoparticles is higher than that of TiO2 nanoparticles, and the higher difference between polarity of CB and PS results in higher sensitivity towards voltage frequency in this nanocomposite.46,62,65
The decline in the amount of “A” parameters from all filler volume percentages (Figure 5(a)–(c)) confirms the decrease in agglomerate size with increase in shear strain amplitude, which agrees with the dielectric results presented in Figure 3(a)–(c).
As seen in Figures 4 and 5, the obtained A value is greater than
From Figures 4(a) and 5(a), at 5vol% filler loading, it is observed that at the final imposed strain amplitude, the calculated A value is equal or almost equal to 0.6
To calculate the size of agglomerates (Ra) in these nanocomposites, the following approach is applied. From the A value for zero shear strain, one can find the initial agglomerate packing density from A = 0.6φfa, by assuming Ra >> R. This assumption is acceptable because as shown in Figures 4 and 5, at zero shear strain, A>>0.6φf for all samples, particularly at higher filler loadings. Considering that the packing density of fillers inside the agglomerates (φfa) remains constant in the range of applied shear strain, the Ra value can be calculated using equation (2). This is because, the range of applied strain in this study is not large enough to disperse the particles inside the agglomerates (i.e., for the polymer chains to diffuse in between the particles inside the agglomerates and result in loosely packed agglomerates). As mentioned earlier, the “A” parameters derived from high frequency data are almost equal, since interfacial polarization does not play a role in the amount of εeff, and the only remaining factors are the amount of dielectric particles in the polymer matrix and the interparticle interactions. Hence, the agglomeration sizes derived from these high frequency data are equal. The agglomerate size versus strain amplitude at electrical frequency of 106 Hz, at different volume percentages, are presented in Figures 6 and 7for PS/CB and PS/TiO2, respectively. The average agglomerate sizes of PS/CB nanocomposites with 5, 10, and 17 nanofiller volume percentages, under electrical frequency of 106 Hz, and under an oscillatory shear strain sweep from 52% to 468% at 52% strain intervals with 1 rad/sec strain rate. The average agglomerate sizes of PS/TiO2 nanocomposites with 5, 10, and 17 nanofiller volume percentages, under electrical frequency of 106 Hz, and under an oscillatory shear strain sweep from 52% to 468% at 52% strain intervals with 1 rad/sec strain rate.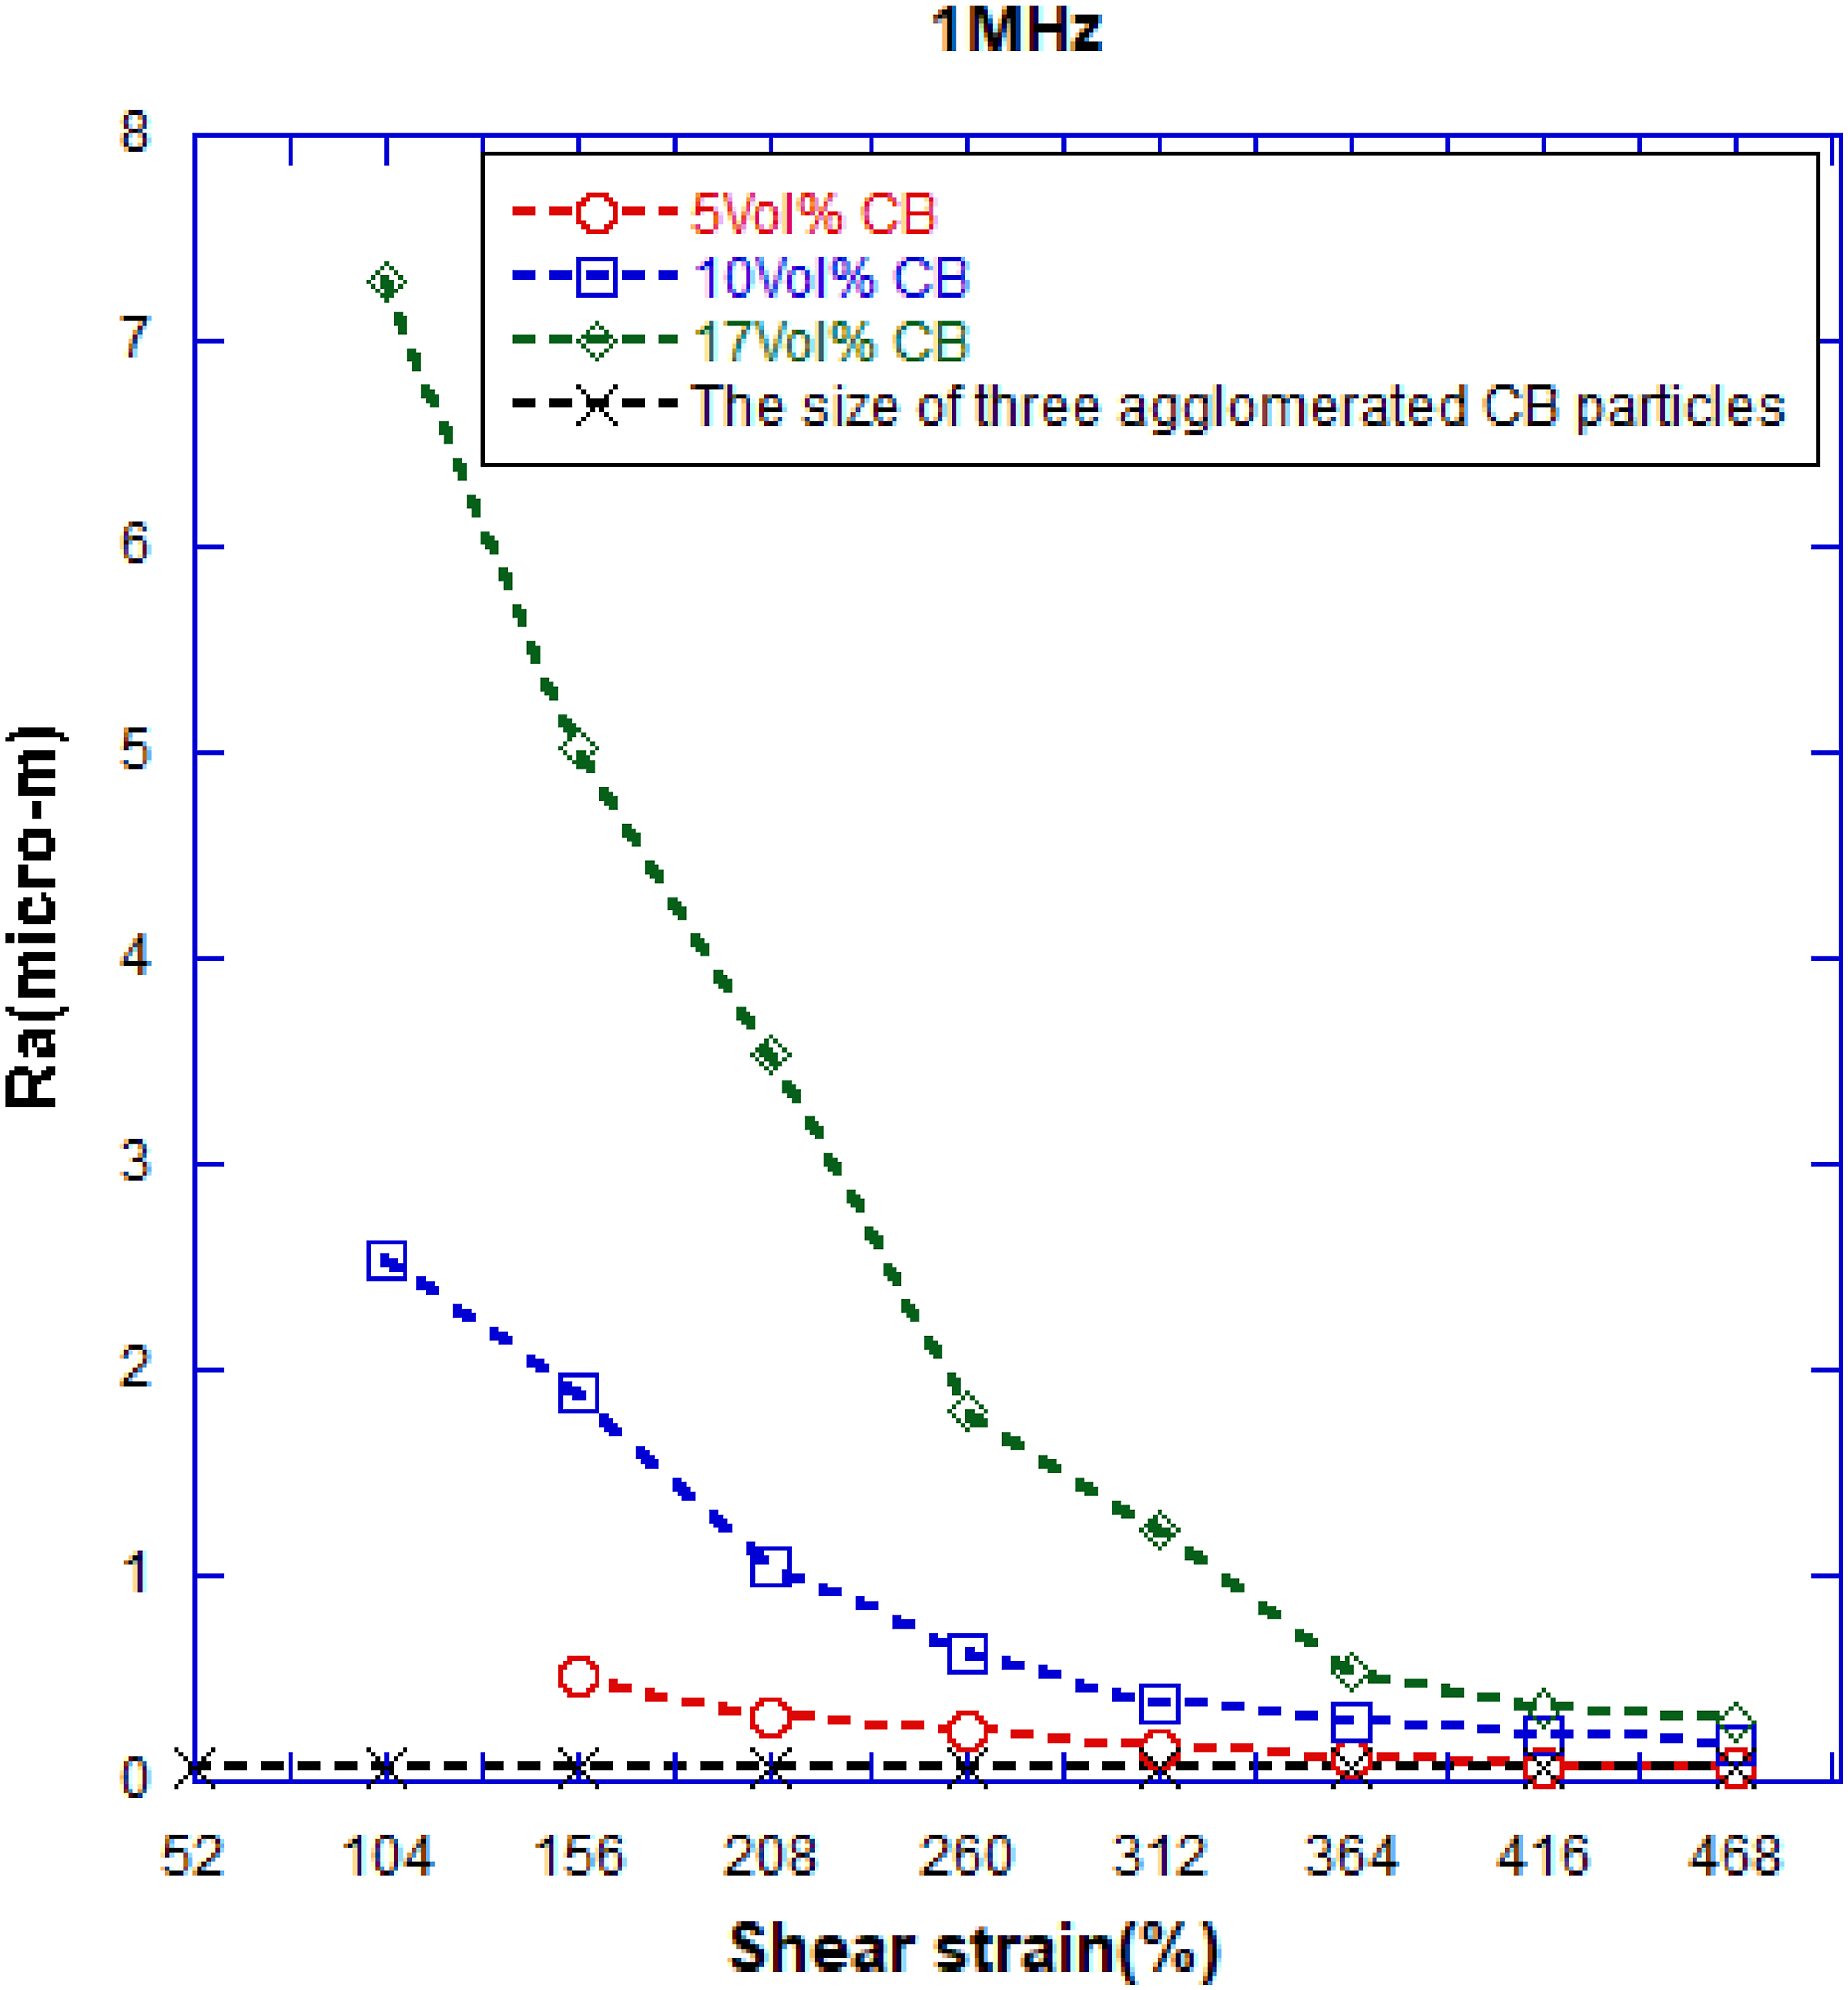
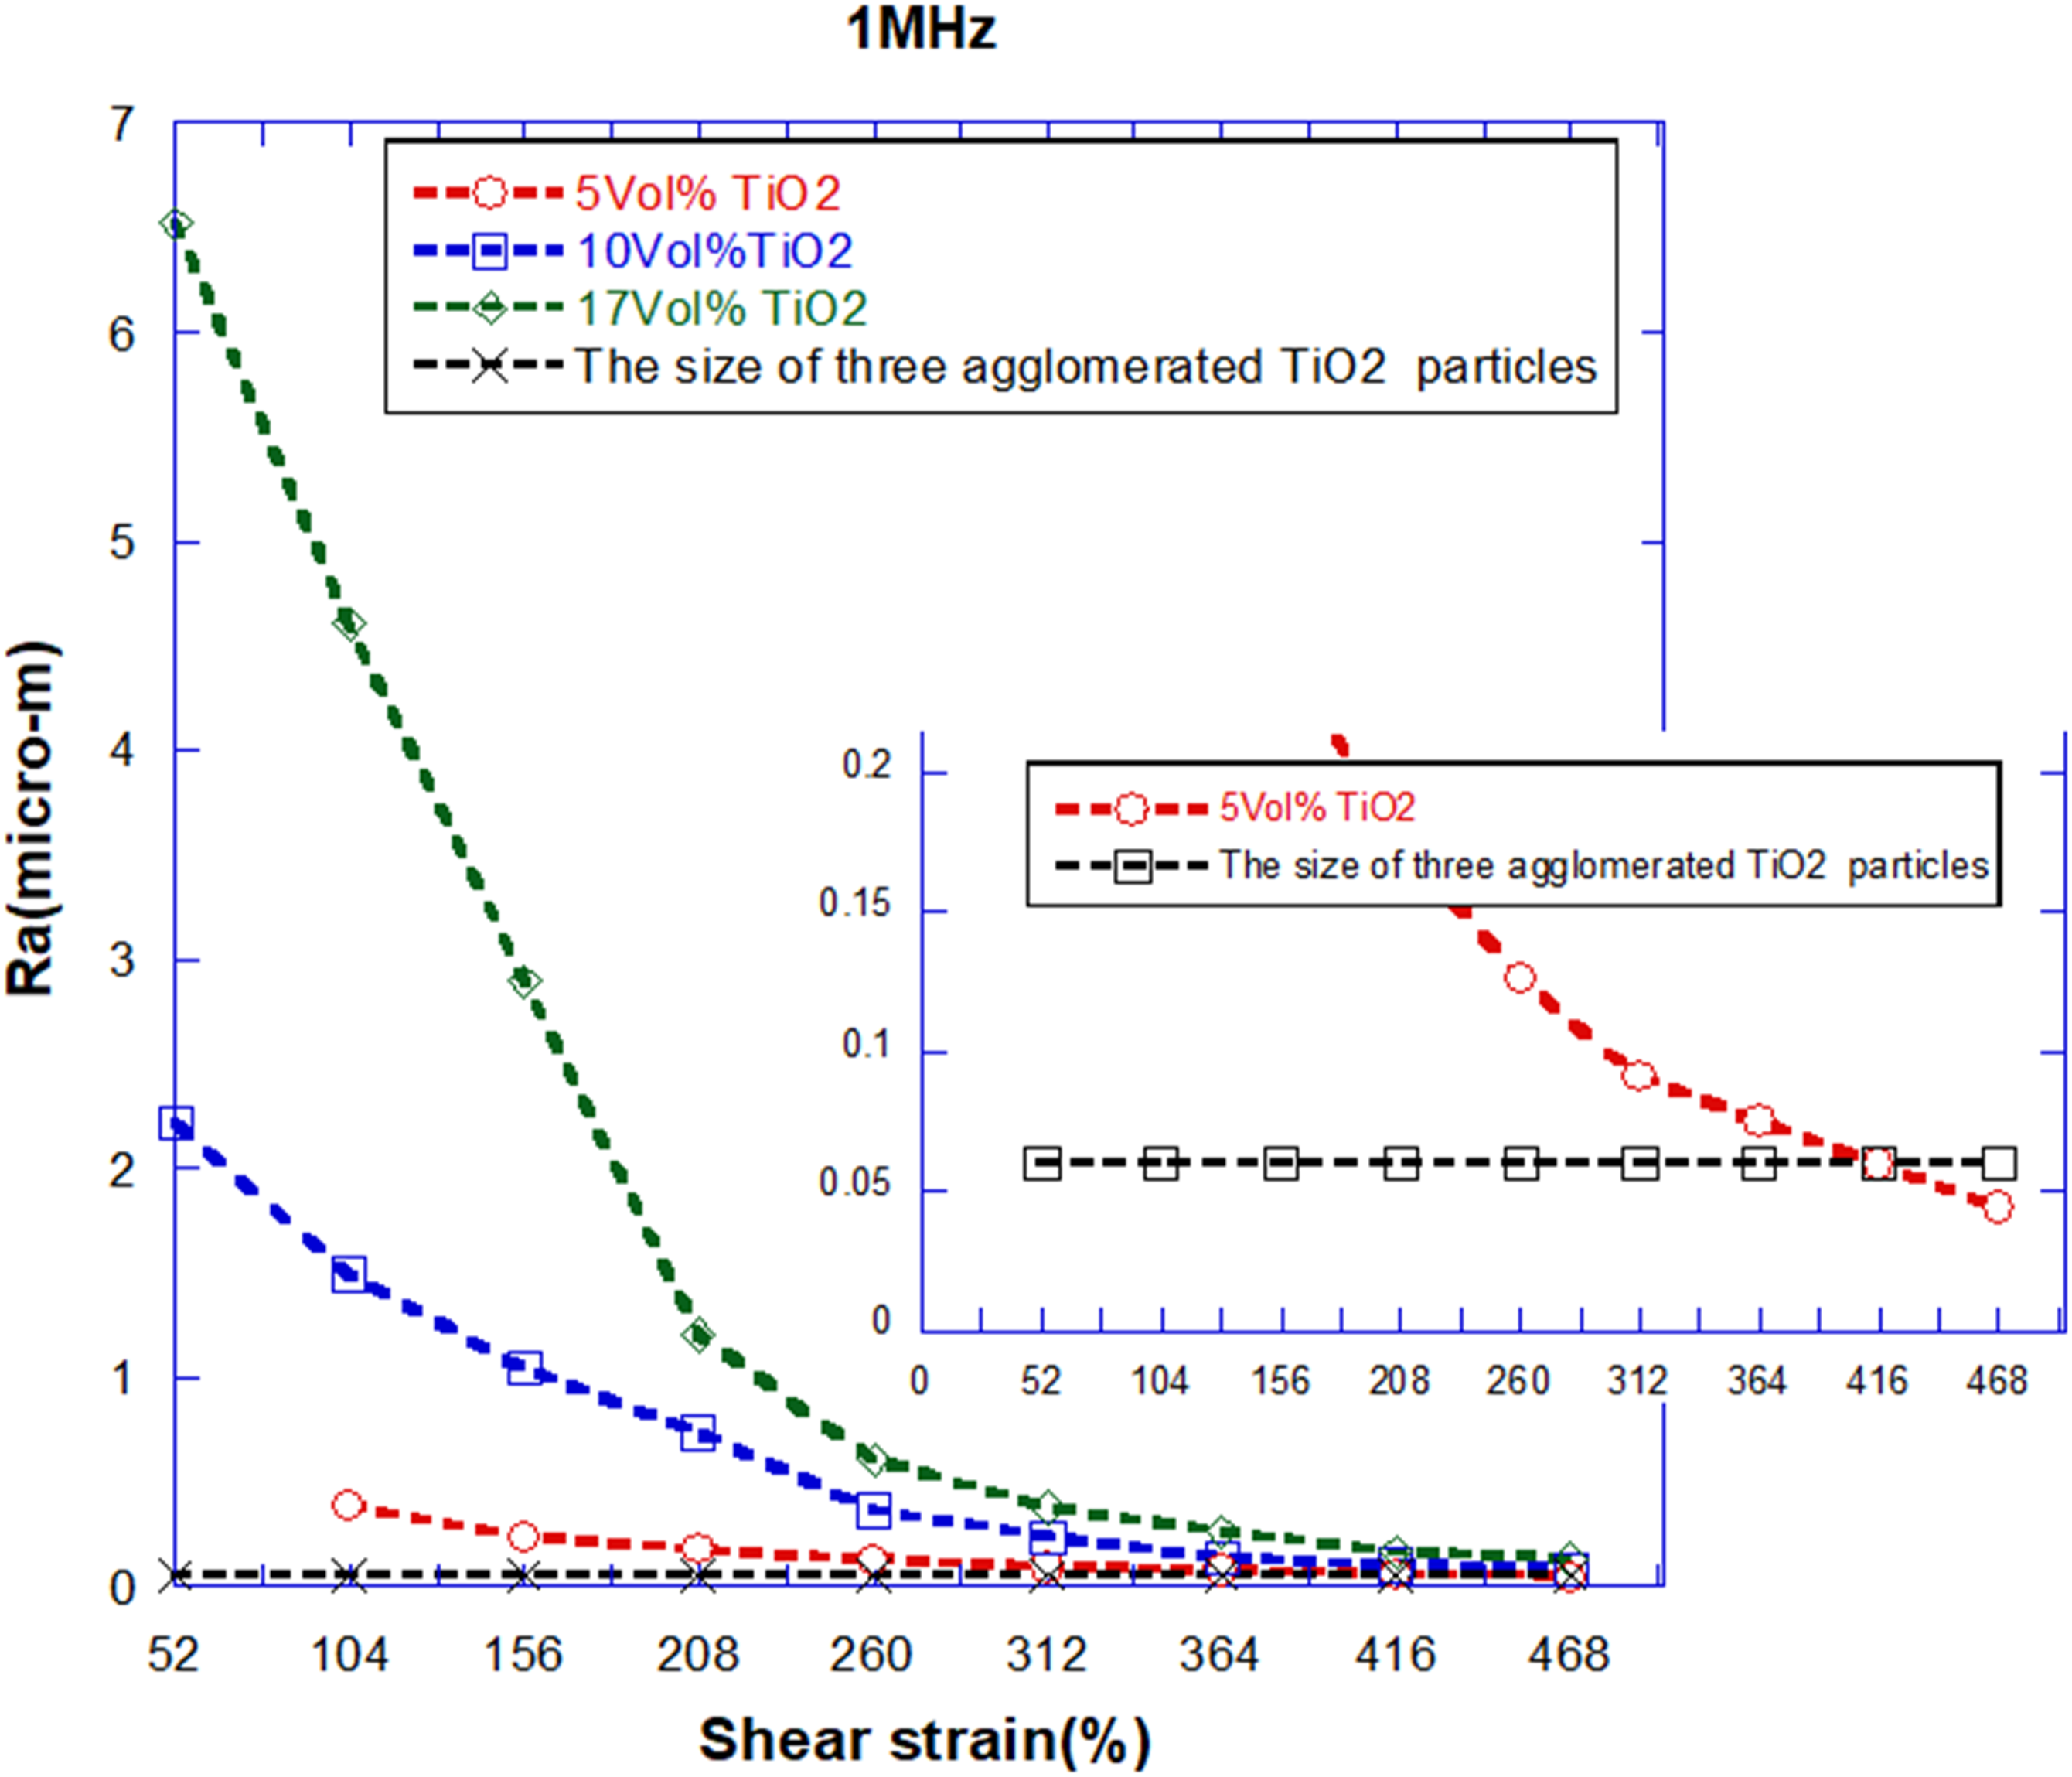
The line drawn in Figures 6 and 7, shows the average size of an agglomerate containing 3 nanoparticles (the minimum number of particles to form an agglomerate in a medium which here is
At nanofiller 17vol%, the shear-induced agglomeration phenomenon enhances the average agglomeration size initially and with further application of shear strain, the agglomerates break down into smaller sizes. At the strain-dependent zone, it is observed that the average agglomerate sizes are reducing with remarkable rate with shear strain, particularly at higher filler volume fractions. By comparing Figures 6 and 7, the agglomerate sizes in PS/CB nanocomposites are in general slightly larger, in respect to PS/TiO2 nanocomposite, which can be attributed to the higher interparticle forces in the former. Also, the agglomerate sizes in both nanocomposites increase with increase in filler volume fraction in both nanocomposites. This is expected because the nanoparticles are both polar particles with the average dielectric constants more than PS, so, the average dielectric constant of the medium is expected to increase with higher interaction between the particles. 68
In Figure 7, the changes in agglomeration sizes of TiO2 at 5vol% initiates from strain amplitude of 104%, because the nanocomposite is strain-independent at a strain amplitude of 52%. But 1vol% and 17vol% show no strain-independency, so agglomerate size changes begin from the first imposed strain. The changes at 10vol% of volume percentage, on observes that the changes start with agglomerates with an average size above 2 µm and finish to overlap the minimum agglomerate size, depicting the considerable effect of strain amplitude on agglomerates, while in at the same volume percentage of CB, aside from strain-independency of CB nanoparticles at 52% shear strain, the rate of changes for the remaining shear strain amplitudes was, also, less than TiO2 agglomerates, shows the lower strength of TiO2 agglomerates compare to CB agglomerate, because of the closer surface energy of TiO2 and PS than CB and PS. One observes this effect at the 17vol% of both nanocomposites, where although both start from (with this difference that CB agglomerates are strain-independent at 52% strain amplitude) high agglomerate sizes and ends above the minimum agglomerate radius, the changes in the PS/TiO2 is still more and with a
higher rate, such that gets, more, closer to the minimum agglomerate radius. It is interesting to note that, at the 5vol% CB, it was observed that there is almost no agglomerate in the medium at the highest applied shear strain(i.e., shear strain of 468%) because its size is less than an agglomerate containing 3 nanoparticles.
Conclusion
Nanofiller network structures (or agglomerates) control the behavior of a nanocomposite and changes in these network structures can greatly impact the properties of the nanocomposite. Hence, characterization of nanoparticle dispersion state and tracking the changes in the size of agglomerates with shear forces is of utmost importance. In this study, a new approach was introduced to measure the changes the average in agglomerate size of nanocomposites (PS/CB and PS/TiO2) with different filler loadings under an oscillatory shear strain sweep using a dielectric technique, with the help of the G-F model.
As the interfacial polarization disappears beyond the voltage frequency of 104 Hz and 105 Hz for PS/TiO2 and PS/CB nanocomposites, respectively, these frequencies were regarded as the high frequency limits of these nanocomposites. Because of higher surface energy of CB nanofillers compared to TiO2 nanoparticles, the effect of interfacial polarization between filler and matrix in PS/CB nanocomposites remains visible until higher voltage frequency. The average agglomerate sizes of both PS/TiO2 and PS/CB nanocomposites were calculated using the dielectric measurements and the A parameter (from the G-F model) at various applied shear strains for the high limit frequency range. It was seen that the agglomerates of PS/TiO2 nanocomposites are less resistant against shear strain amplitude, due to their lower surface energy and polarity in respect to CB particles, resulting in smaller strain-independency region in PS/TiO2 nanocomposite. The calculated average agglomerate sizes of the nanocomposites show that the TiO2 agglomerates break down faster when exposed to shear strain compared with CB agglomerates. Non-agglomerated dispersion of TiO2 nanoparticles was achieved at 5vol% nanofiller loading at the highest strain amplitude (468%).
Footnotes
Acknowledgements
We wish to thank Tarbiat Modares University for financial supports.
Declaration of conflicting interests
The author(s) declared no potential conflicts of interest with respect to the research, authorship, and/or publication of this article.
Funding
The author(s) received no financial support for the research, authorship, and/or publication of this article.