
Abstract
Graphite nanoplatelets with an average particle size of 13 μm and an estimated flake thickness of about 76 nm were prepared by microwave exfoliation, followed by ultrasonication-assisted liquid-phase delamination, of an expandable graphite. This nanoadditive was used to fabricate linear low-density polyethylene (LLDPE) and poly(ethylene-co-vinyl acetate) (EVA)-based nanocomposite sheets using rotational molding. The dry blending approach yielded surface resistivities within the static dissipation range at filler loadings as low as 0.25 wt.% (0.1 vol.%). However, even at this low graphite content, impact properties were significantly reduced compared to the neat polymers. Bilayer moldings via the double dumping method proved to be a feasible approach to achieve both acceptable mechanical properties and antistatic properties. This was achieved by rotomolding nanocomposite sheets with a 1-mm outer layer containing the filler and a 2-mm inner layer of neat LLDPE. Excellent fire resistance, in terms of cone calorimeter testing, was achieved when the outer layer also contained 10 wt.% expandable graphite.
Introduction
Rotomolding is a polymer-forming technique used to produce seamless and nearly stress-free hollow products in one piece. 1 The flexibility of the process even extends to the manufacture of multilayer products. 2 Polyethylene is the dominant rotomolding material. 3 It is well suited for this process due to its relatively low cost, favorable rheology, and low melting temperature that, combined with its high thermal stability, provides for a wide processing window. 1,4 However, polyethylene is also highly flammable and a good electrical insulator. 5 Buildup of static charge on polyethylene products presents a potential fire and explosion hazard in some situations. 6
Many applications require that the material must be at least static dissipative. This can be achieved by the incorporation of conductive filler particles. 7 Traditional conductive fillers require high loadings, up to15 wt.%, to impart sufficient conductivity. This usually has a negative effect on mechanical properties including impact and tensile strength. 3,8 –10 Nanoparticles have attracted interest due to their ability to significantly improve polymer properties even at very low filler loadings. 11 –13 However, few studies have considered the rotomolding of nanocomposites. 14
Graphite nanoplatelets (GNPs) feature thicknesses less than 100 nm while their lateral dimensions may extend into the micrometer range. 15 They enable the fabrication of nanocomposites with high conductivity at loadings above a critical percolation threshold. 16 GNPs are conveniently obtained by first heating expandable graphite to yield graphite nanoplatelet stacks. 17 Subsequent ultrasonic treatment facilitates delamination into individual flake-like sheets and their dispersion in a suitable liquid medium. 11,18 –21
Melt extrusion compounding is an effective way of distributing and dispersing particulate additives in polymer matrices for rotomolding. 22,23 However, an additional grinding step is required to convert the material into powder (particle size <500 μm). Rotomolders frequently simply disperse additives into polyethylene powder by high speed mixing or even just by dry blending in tumble mixers. Although not as effective as melt extrusion, this is a flexible, cost-effective approach. At low additive loading levels, the mechanical properties, and in particular impact properties, are usually retained at acceptable levels comparable to those delivered by melt compounded materials. 23
Another option to consider is double dumping. In this approach, the molding is produced layer-by-layer, with the filler additive present in particular layers only. Although this practice causes process disruptions, rotomolded parts with good mechanical properties can be obtained. 9,23
The overall aim here is to develop cost-effective, flame-retarded, and antistatic polyethylene–graphite compounds suitable for rotational molding for use in underground mining applications. A previous study considered antistatic polyethylene–graphite composites using micron-sized natural flake graphite. 24 The inclusion of the natural graphite in polyethylene also improved the ignition resistance in cone calorimeter fire tests. 25 However, the impact and tensile strengths of these composites were severely compromised at the graphite loadings required to achieve static dissipation (≥10 wt.%). The present communication reports on antistatic and flame-retarded rotomolded polymer nanocomposites based on GNPs that have overcome some of these limitations.
Experimental
Materials
Hexene comonomer-based linear low-density polyethylene (LLDPE) rotomolding powder was supplied by Sasol Polymers (Grade HR 486: MFI 3.5 g 10 min−1 (190°C/2.16 kg); density 0.939 g cm−3; d90 particle size <600 μm). Poly(ethylene-co-vinyl acetate) (EVA) was supplied by Affirm Marketing Services (Grade: AMS 3042: Vinyl Acetate content 18%, MFI 1.7g 10 min−1 (190°C/2.16 kg); density 0.939 g cm−3; d90 < 600 μm). Debco Technologies supplied the silicone-based mold release agent RM20. The two grades of expandable graphite ES 250 B5 (exfoliation onset temperature 220°C) and ES170 300A (exfoliation onset temperature 300°C) were supplied by Qingdao Kropfmuehl Graphite (China). Natural Zimbabwean flake graphite was supplied by BEP Bestobell, Johannesburg.
Sample preparation
Graphite exfoliation and delamination
About 3.50 g of expandable graphite-type ES 250 B5 was exfoliated in a Samsung Model ME9144ST microwave oven. The power setting was 1 kW, and the treatment time was 2 min. About 2 g of exfoliated graphite was then immersed in 300 mL isopropanol present in a 600-mL beaker and placed in an ice bath. Ultrasonication was performed for 2 h at a power setting of 300 W using a Vibracell VC375 ultrasonic generator with a 12.5-mm solid tip horn. During this time, the dispersion was agitated continuously with a magnetic stirrer.
Small portions of the colloidal dispersion of graphite nanoplatelets were deposited on a microscopic glass slide and allowed to dry for observation with Field Emission Scanning Electron Microscopy (FESEM) and Raman spectroscopy. The rest of the colloidal dispersion was fed into a rotary evaporator (Büchi Rotavapor R-114) set at 100°C. The isopropanol was evaporated until a paste-like consistency was obtained. The paste was dried for 12 h in a convection oven at set at 60°C. A fluffy, highly friable graphite nanoplatelet aerogel was obtained.
Rotational molding
The mold was a stainless steel rectangular cuboid with interior dimensions of 200 × 150 × 100 mm. The rotomolding machine was a modified Thermopower convection oven fitted with a biaxial mold rotating mechanism. Charge weights were determined following the protocol suggested by Crawford and Throne. 26 The charge volume was adjusted to ensure that all moldings had the same wall thickness of 3 mm. For the neat polymer, this amounted to 352 g. Molding was conducted for 45 min at an oven temperature of 300°C and a rotation speed of 20 rpm for the inner axis and 10 rpm for the outer axis. This setting was chosen based on trials conducted at five different oven times, that is, 30, 35, 40, 45, and 60 min. The cooling protocol was 20 min in the opened oven followed by 20 min in ambient air. This brings the standard cycle time to a total of 85 min.
Dry-blended LLDPE/graphite nanocomposites were obtained by mixing the LLDPE powder and the graphite nanoplatelets in a 750 W grinder-mixer for 10 min. The graphite content was varied up to 2 wt.%. Dry-blended EVA/graphite nanocomposites were obtained in a similar manner except that the mixing time was reduced to 5 min to avoid melting of the polymer.
Melt-compounded LLDPE–graphite nanocomposites were obtained as follows. First, the LLDPE powder and the graphite nanoplatelets were mixed in the 750 W grinder-mixer for 10 min. These compositions were then melt compounded on a TX28P laboratory scale co-rotating 28 mm twin crew extruder with an L/D ratio of 18. The temperature profile, from hopper to die, was 140°C/160°C/180°C/200°C. The extruded strands were water-cooled, air-dried, and granulated into pellets. They were then milled into rotomolding powder (<600 μm) using a Pallmann 300 pulverizer.
Bilayer molding was done by double dumping as follows. Two charges were prepared on the basis of a nominally 1-mm-thick exterior layer containing graphite and a 2-mm interior layer of LLDPE (231 g). A modified stainless steel mold was used for the double dumping experiments. The mold had the same interior dimensions, but it was also fitted with a 28-mm φ vent pipe that extended 50 mm into the mold cavity and 80 mm above the mold lid. The vent pipe had a screw cap that made double dumping possible. To produce a bilayer molding, the mold lid was opened and charged with the shot for the outer layer. This layer was then rotomolded for 30 min at 300°C at an inner axis rotation speed of 20 rpm while the outer axis rotated at 10 rpm. After the first molding cycle was completed, the second charge was fed via a funnel after removing the screw cap from the hot mold. Immediately after adding the second charge, the mold was rotated at 40 rpm to facilitate even distribution of the LLPDE powder. The second layer was then molded for 30 min at 300°C at the standard rotation speed of 20 rpm for the inner axis and 10 rpm for the outer axis. Bilayer composites with an EVA outer layer were molded in the same manner except that the molding time for the first cycle was reduced to 15 min.
Material characterization
Particle size and density
The graphite particle size distributions were determined with a Mastersizer Hydrosizer 2000 (Malvern Instruments, Malvern, UK). The specific surface areas of the graphite powders were determined using a Micrometrics TriStar BET in liquid N2 at 77 K. Densities were determined on a Micrometrics AccuPyc II 1340 helium gas pycnometer. The level of melt densification of the rotomolded parts was quantified by measuring the density of 10 × 10 × 3 mm samples on the same instrument.
Imaging
Graphite particle morphologies were studied using an ultrahigh resolution field emission scanning electron microscope (HR FEGSEM Zeiss Ultra Plus 55) with an InLens detector at an acceleration voltage of 1 kV to ensure maximum resolution of surface detail. The same instrument was used to observe fracture surfaces of the rotomolded polyethylene cross-sections obtained after immersion of the samples in liquid nitrogen. These samples were coated with carbon before viewing.
Cross-sections of the rotomolded nanocomposites were prepared using cryo-ultramicrotomy performed with a Leica EM UC6. Slices were cut at −80°C using a glass knife at a speed 2.5 mm s−1. Sections, with a nominal thickness set at 200 ± 10 nm, were mounted on a glass slide. They were observed under polarized light using a transmitted light microscope (Tokyo, Japan) with a Nikon DXM1200F digital camera (Tokyo, Japan).
Raman spectra were recorded using an HORIBA Scientific, Jobin Yvon Technology T6400 series II triple spectrometer system. A 514.5-nm laser line of coherent Innnova®70 Ar+ laser in the wavelength range 500–3500 cm−1 was used. The resolution of the laser was 2 cm−1. An Olympus microscope attachment to the instrument recorded the spectra in back scattering configuration with a long working distance 100× objective. The detector used was liquid-nitrogen-cooled CCD detector, and the laser power on the sample was 10 mW. An accumulation time of 120 s was utilized.
Fourier transform infrared (FTIR) spectroscopy was used to track thermo-oxidative degradation as a function of oven time. Spectra (based on the average of 32 scans) of the interior molded surfaces were recorded with a Perkin Elmer FTIR fitted with an ATR attachment.
Surface resistivity
Composite surface resistivity was measured with a Vermason Analogue Surface Resistance Meter and the TB-7549 concentric ring probe. These measurements allowed categorization of the samples into conductive, static dissipative (antistatic), or insulative according to test method IEC 61340-2-3. 27
Impact testing
Sheet specimens, measuring at least 70× 70 × 3.0 mm, were cut from the molding. Falling weight impact tests were performed at 25°C on the rotomolded composites according to test standard ASTM D 5628 28 using sample geometry FB. A weight of 2.5 kg was used for all the samples with the exception of the neat LLDPE molded for 60 min which required a 5-kg weight. The sheet specimens were struck on the exterior side by the 25-mm diameter tup. Failure was defined as the formation of a crack through which water can flow. At least five specimens were initially used to determine the approximate height at which a failure was likely to happen. Thereafter, tests were conducted on 10 specimens. The Bruceton up-and-down method was used to evaluate the mean failure energy normalized with respect to the average sample thickness.
Tensile tests
ASTM D638-08 Type IV dog bone specimens with a thickness of about 3.0 mm and gauge length of 25 mm were cut out of the moldings for tensile tests. The tensile tests were conducted according to ASTM D 638-08 at 23°C. A Lloyd Instruments LRX Plus machine fitted with a 5-kN load cell was used, and the extension rate was set at 50 mm min−1. At least six specimens were tested for each sample.
Fire testing
A Fire Testing Technology Dual Cone Calorimeter was utilized to perform fire tests on the rotomolded nanocomposites according to the ISO 5660-1 standard. The specimens used had lateral dimensions of 100 × 100 mm and a thickness of 3.0 mm. The sheets were wrapped in aluminum foil and exposed horizontally to an external heat flux of 35 kW m−2. A grid was placed on top of the sample to prevent the sample from expanding and touching the spark igniter. The outer layer was exposed to the radiant heat flux. At least two tests were conducted for each sample, and average results are reported.
Results
Graphite filler properties
The FESEM micrograph in Figure 1 reveals a crumpled morphology for the graphite nanoplatelets (GNPs). Table 1 lists the median particle size and the BET surface area of the expandable graphite powders and the final graphite nanoplatelets. The thickness of the final platelets is in the nano range with lateral dimensions in the micrometer range. Particle size analysis showed that the d 50 particle size of the nanoplatelets (Table 1) was 13 μm, almost 30 times smaller than the precursor flakes. It is known that ultrasonication decreases particle size until a critical size is reached. 11
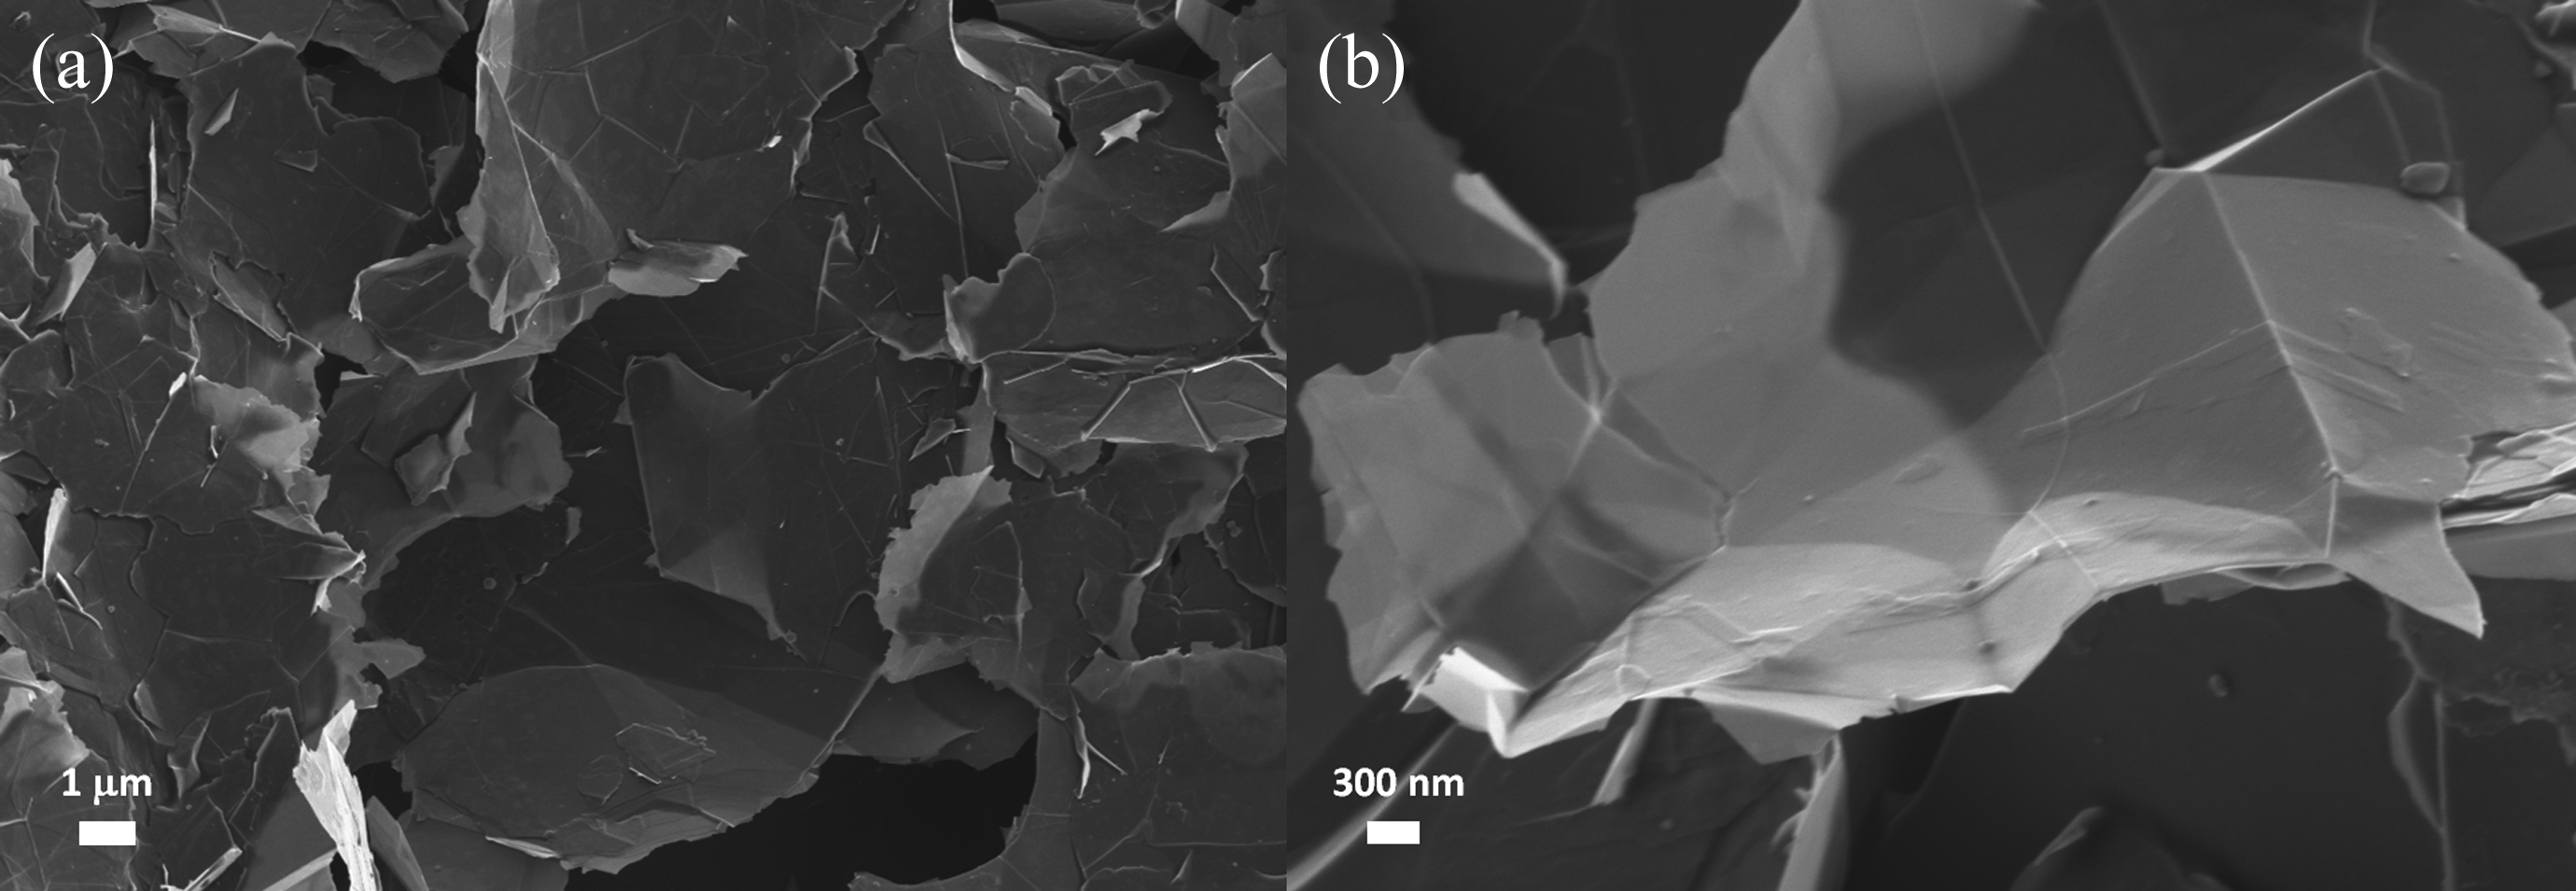
FESEM of graphite nanoplatelets obtained by ultrasonication-assisted liquid-phase exfoliation of expanded graphite (Grade ES250 B5) in isopropanol. (a) Low magnification and (b) high magnification.
Graphite properties.
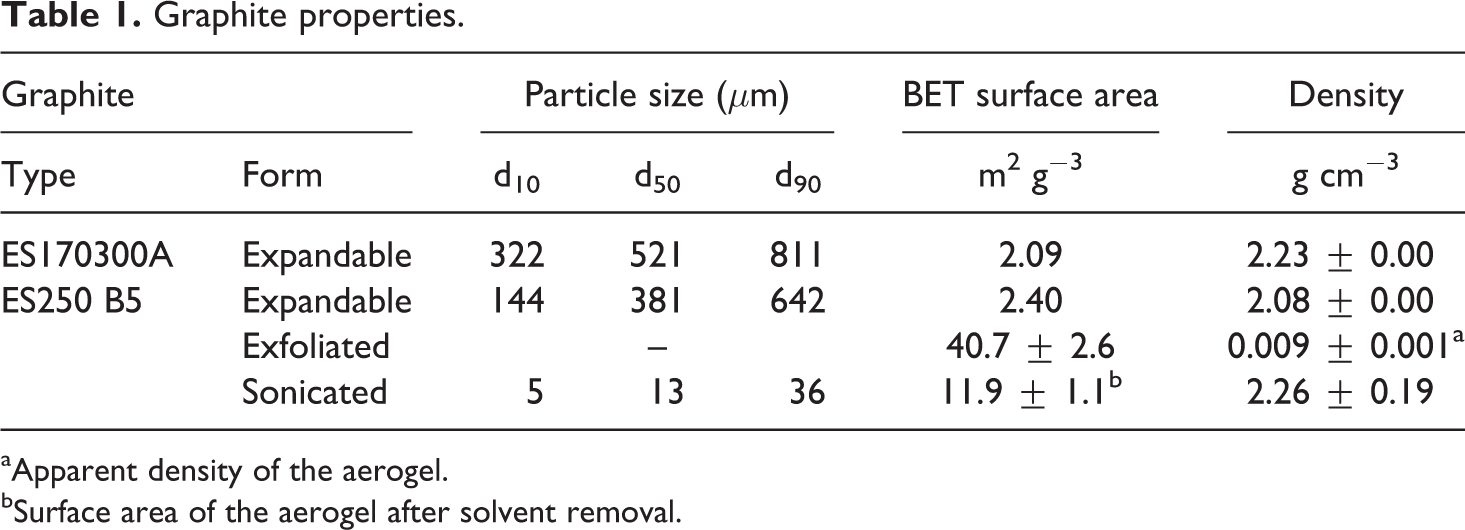
aApparent density of the aerogel.
bSurface area of the aerogel after solvent removal.
According to Table 1, the BET surface area of the GNP aerogel, after solvent removal, was 12 m2 g−1. This value is considerably lower than that for the exfoliated graphite. The discrepancy is attributed to reagglomeration during solvent removal. The aspect ratio of the platelets was estimated by comparing their surface area to that expected for a graphene monolayer, that is, 2700 m2 g−1. 11 From this comparison, the average GNP consisted of 227 graphene sheets and thus a thickness of 76 nm. Using the d 50 particle size of 13 μm obtained for these GNPs resulted in an average aspect ratio of about w/t = 171.
The Raman spectrum of Figure 2 confirms the graphitic nature of the graphite nanoplatelets. The ratio of the peak intensities of the D (1350 cm−1) to that of the G band (1582 cm−1) (ID /IG ) is a measure of imperfection in graphitic materials. 29 The ID /IG ratios for the natural graphite, ES250 B5, and the graphite nanoplatelets synthesized presently were 0.18, 0.72, and 0.15, respectively. The measured density of the latter (2.26 g m−3) was also is comparable to that of pure graphite.
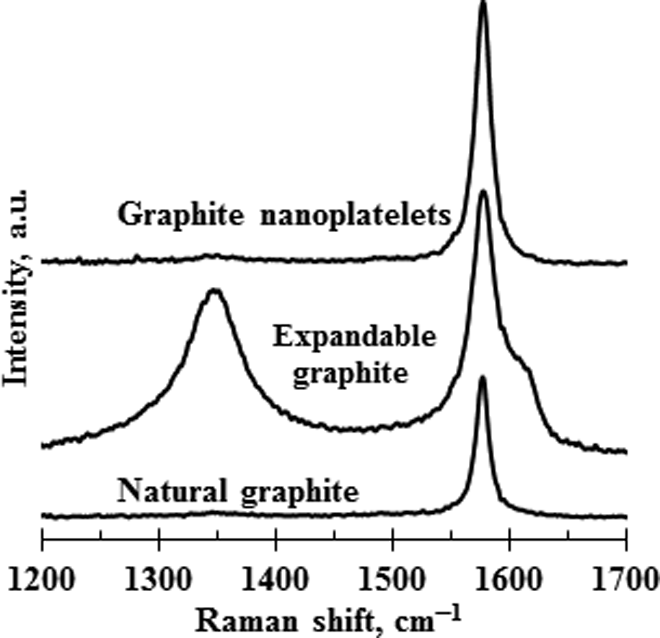
Raman spectra of the natural graphite, expandable graphite, and the graphite nanoplatelets (GNP).
Rotational molding process conditions
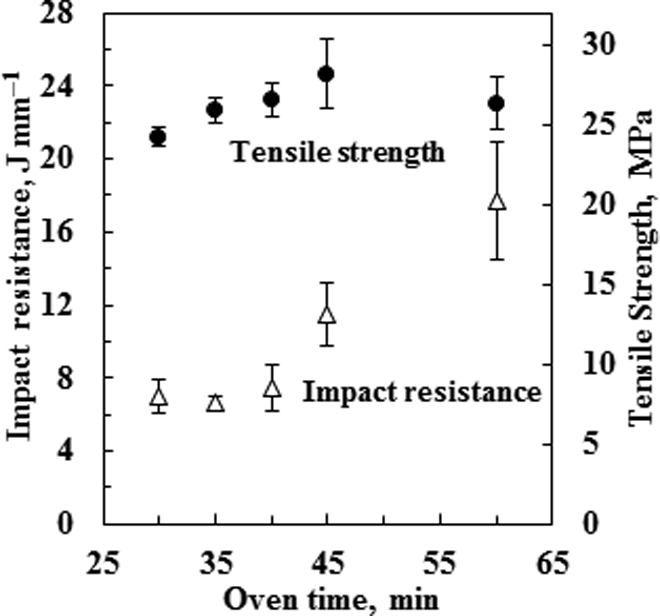
The properties of rotomolded parts are strongly influenced by the oven time and temperature. 26 Optimum mechanical properties of rotomolded parts are realized through properly cured parts. Insufficient oven time or too low temperature results in incomplete melting and densification of the polymer powder. Undercured parts exhibit pin holes on the surface in contact with the mold wall and porous part cross-sections. Such samples exhibit poor impact properties because these defects act as stress concentrators. 30 Overcuring parts result in thermo-oxidative degradation of the polymer with a concomitant deterioration in mechanical properties.
The oven time was selected based on the properties of parts molded with neat polyethylene with the oven temperature fixed at 300°C. Figure 3 shows the variation in impact properties and tensile strength with oven time. The tensile strength of the rotomolded LLDPE increased almost linearly with increase in oven time up to 45 min but deteriorated thereafter. The impact resistance was not affected by oven time up to 40 min, but it increased above this heat exposure time. Parts molded for 30 min or less featured pin holes in their exterior surfaces and porosity in the wall cross-sections. These defects were not observed for samples molded at oven times of 45 min or higher. According to Table 2, the density of the rotomolded LLDPE parts increased with oven time and reached a plateau value at 45 min. This was also the oven time at which the highest tensile strength was realized.
Effect of rotomolding oven time on impact resistance (mean failure energy) and tensile strength.
Variation in LLDPE part density with rotomolding oven time.
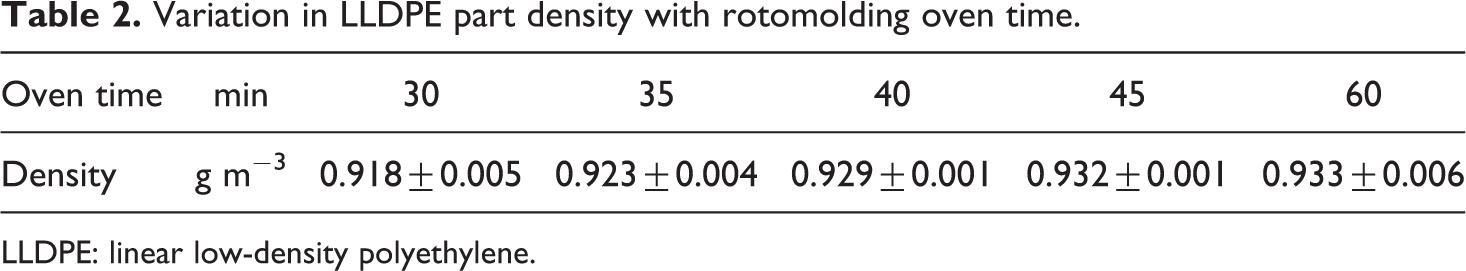
LLDPE: linear low-density polyethylene.
The aesthetics of the parts molded for 60 min were impaired as surface yellowing was evident. The discoloration probably arose from the sacrificial oxidation of the antioxidants to chromophoric quinones. 31 Unlike parts molded at lower temperatures, the FTIR spectra of the inner walls of these parts also featured a carbonyl peak at ca. 1717 cm−1. This indicates that the onset of thermo-oxidative degradation had been reached. During the early stages of oxidation, the cross-linking reactions dominate in polyethylene. 32 This effectively increases the molecular mass and provides an explanation for the continued increase in impact energy beyond 45 min. However, later on, chain scission reactions will dominate and eventually catastrophic property loss will follow. 33 Based on these observations, all further LLDPE-based moldings were conducted using an oven time was 45 min.
Properties of the rotomolded nanocomposites
Electrical resistivity
The resistivity of the neat polyethylene, and all the melt-compounded LLDPE nanocomposites considered presently, was outside the range of the instrument employed, that is >1015Ω/□.
Figure 4 shows surface resistivity data for rotomolded nanocomposite sheets obtained by dry blending. The surface resistivity decreased abruptly with increase in graphite content. At the lowest graphite loading used (0.25 wt.% or 0.10 vol.%), the surface resistivity of the polyethylene nanocomposites was <109 Ω/□, that is, well into the static dissipative or antistatic classification region according to the specifications of the IEC 61340-2-3 standard. Further addition of graphite nanoplatelets decreased the surface resistivity into the conductive range. At 0.25 wt.% graphite content, the EVA nanocomposites were already in the conductive range, that is, below 105 Ω/□. Further addition of graphite nanoplatelets did not reduce the resistivity significantly.
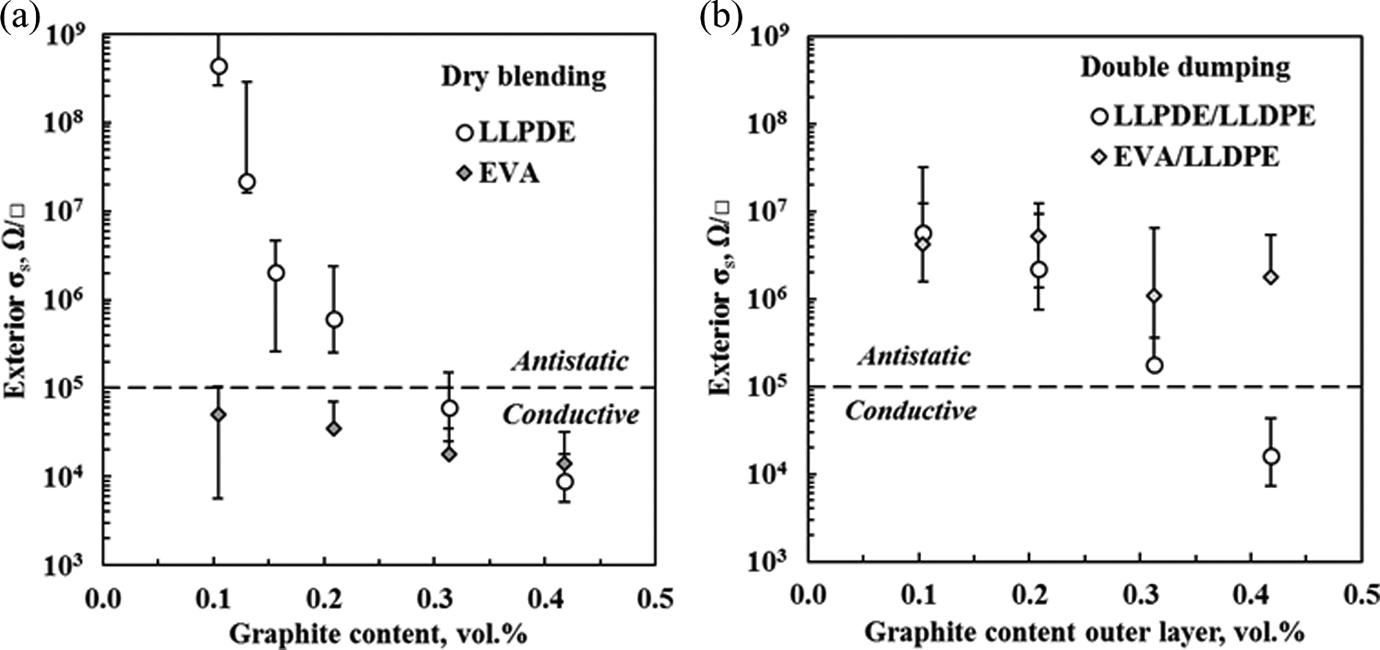
Surface resistivity of nanocomposite sheets prepared via dry blending. (a) Neat polymer nanocomposites and (b) bilayer sheets made by double dumping.
Surface resistivity of bilayer parts formed via double dumping
The double dumping procedure was used to rotomolded nanocomposites that retained antistatic properties at the exterior surfaces. GNPs were included in the outer layer only. Figure 4(b) shows the surface resistivity of the bilayer nanocomposites obtained by double dumping. At 0.25 wt.% (0.10 vol.%) graphite nanoplatelet content in the outer layer both the LLDPE/LLDPE and EVA/LLDPE nanocomposites performed well into the antistatic range. The EVA/LLDPE nanocomposites showed little change in resistivity with an increase in graphite nanoplatelet content. However, the resistivity of the LLDPE/LLDPE nanocomposites decreased with an increase in nanographite content reaching into the conductive range, that is <103 Ω/□.
Mechanical properties of dry blended and compounded nanocomposites
Impact resistance is a key indicator of rotomolded part quality. Figure 5 compares the impact resistance and the tensile strength data at a graphite loading of 0.25 wt.%. Figure 6 shows the variation in the impact resistance with graphite nanoplatelet loading. Incorporation of GNPs by melt compounding at 0.25 wt.% decreased the impact resistance by 31%. However, that composite was not conductive. Even at a loading of 2 wt.% graphite, the compounded samples retained the insulative character of polyethylene. Ductile failure was observed up to 0.50 wt.%, and the impact resistance of the nanocomposites dropped by only 32%. However, beyond 0.50 wt.% graphite, the mechanical properties deteriorated catastrophically.
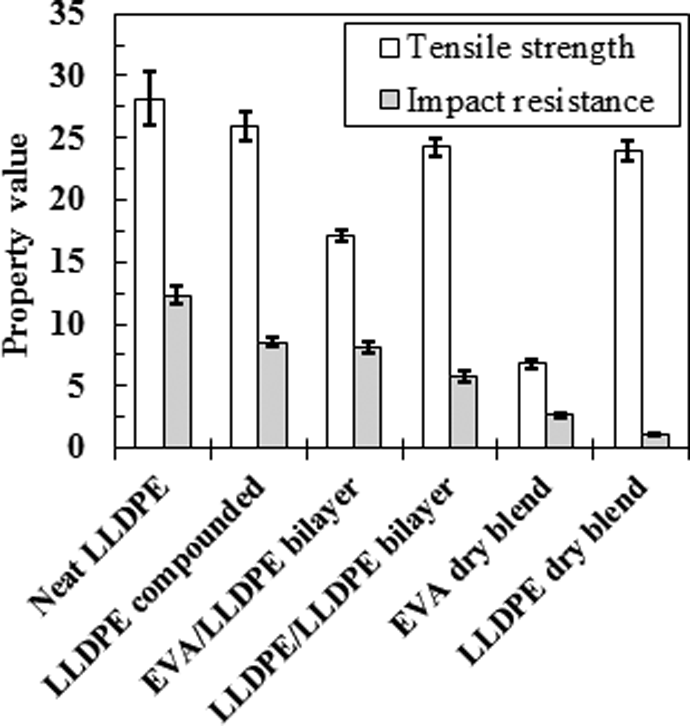
Impact resistance (J mm−1) and tensile strength (MPa) of dry blended, compounded, and double-dumped nanocomposites containing 0.25 wt.% graphite nanoplatelets. In the bilayer sheets, this corresponds to the concentration in the outer layer.
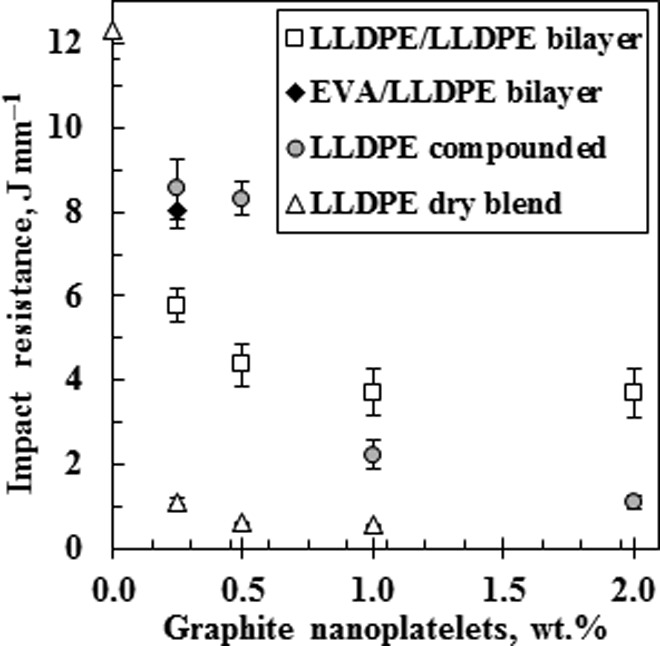
Variation in impact resistance (J mm−1) with graphite nanoplatelet loading. In the bilayer sheets, this corresponds to the concentration in the outer layer.
Considering dry-blended LLDPE samples, the resistivity was already in the antistatic range at 0.25 wt.% GNP. However, impact resistance of the nanocomposite was 4 times lower compared to the virgin polyethylene. In fact, the nanocomposite exhibited a brittle failure mode even at this low graphite loading.
Changing to a bilayer structure resulted in significantly improved impact properties. Figure 5 shows the impact and tensile strength results when the outer layer (nominally 1 mm in thickness), constructed of either LLDPE or EVA, contains 0.25 wt.% GNP. The 2-mm inner LLDPE layer showed some level of ductility with the impact or making a deep-drawn dent in the samples before they failed. The impact energy appeared to have been absorbed through stress whitening in the LLDPE layer. Using EVA rather than PE as the outer graphite-containing layer improved the reduction in impact resistance compared to that of LLDPE. EVA is more flexible than LLDPE and thus able to absorb the impact energy more efficiently. The EVA layer together with the LLDPE exhibited some ductility, but the LLDPE layer failed first in most instances. The tensile strength was, however, compromised in the EVA-based nanocomposites.
Cone calorimeter fire test results
Nanofillers reportedly improve the fire properties of polymers at relatively low addition levels. 34 Therefore, the fire properties of the rotomolded nanocomposites were evaluated at 1.0 wt.% GNP. Figure 7 compares the heat release rate (HRR) curves for dry blended LLDPE and the bilayer LLDPE/LLDPE and EVA/LLDPE GNP nanocomposites. Table 3 summarizes the test results. The inclusion of the graphite nanoplatelets at a loading of 1.0 wt.% graphite nanoplatelets did not have a significant impact on the fire behavior of the nanocomposites in cone calorimeter testing. The HRR curves for most of the nanocomposites featured a single sharp peak. This behavior is characteristic of thermally thin samples that are pyrolyzed almost at once. 35 The peak HRR (pHRR) reached the highest value of 745 ± 18 kW m−2 and 714 ± 53 kW m−2 for the bilayer LLDPE/LLDPE and EVA/LLDPE structures, respectively. The corresponding value for a monolayer LLDPE sheet containing 1.0 wt.% GNP was ca. 667± 16 kW m−2. This is only a marginal improvement.
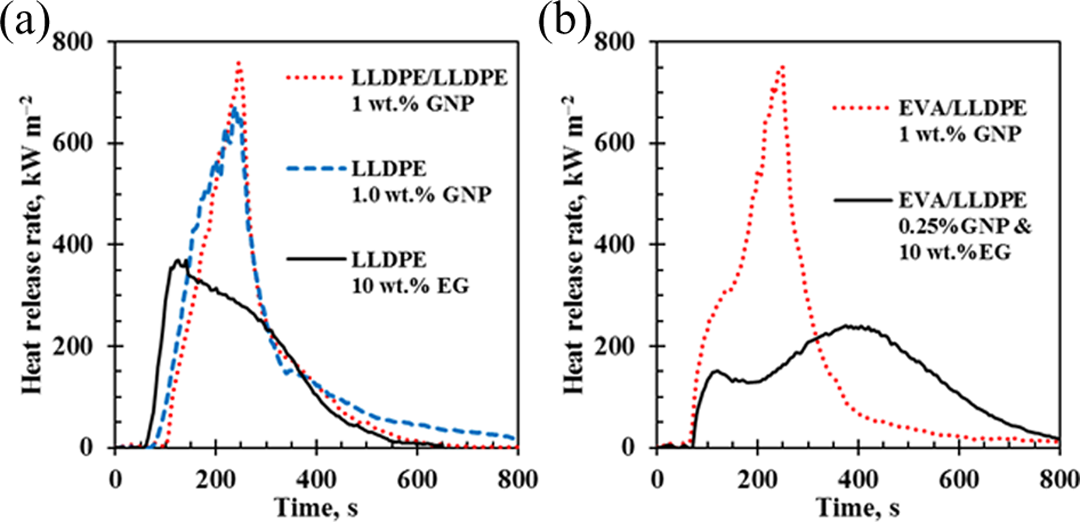
Heat release rate (HRR) curves of graphite–polyethylene composites. (a) linear low-density polyethylene (LLDPE)and LLDPE/LLDPE bilayer composites. (b) Poly(ethylene-co-vinyl acetate) (EVA)/LLDPE bilayer composites. The graphite nanoplatelets (GNP) and expandable graphite (EG) fillers were only present in the outer layer of the bilayer composites.
Cone calorimeter data summary.
LLDPE: linear low-density polyethylene
The HRR curve for the expandable graphite composites that contained 10 wt.% expandable graphite featured a more flattened shape and a significantly lower pHRR. This attributed to a protective barrier layer that is formed at the top of the sample surface by the “worm-like” structures resulting from the endothermic expansion of the EG. This barrier slowed down heat transfer into the substrate during cone calorimeter testing. The pHRR was ca. 360 ± 10 kW m−2 for the monolayer LLDPE sheet containing 10 wt.% expandable graphite. This represents a significant improvement. However, unexpectedly, the EVA/LLDPE bilayer structure containing 0.25 wt.% graphite nanoplatelets and 10 wt.% expandable graphite in the outer EVA layer performed even better. In this case, the pHRR was only about 259 ± 26 kW m−2.
The fire growth rate (FIGRA) and the maximum average rate of heat emission (MARHE) are indices that may be used to interpret cone calorimeter data. 35,36 The FIGRA is an estimator for the fire spread rate and size of the fire, whereas the MARHE guesstimates the tendency of a fire to develop. 36 The FIGRA is defined as the maximum quotient of HRR(t)/t, that is, the heat release rate up to a time t divided by this time. Table 3 also reports the FIGRA and MARHE indices. By far, the lowest values (1.34 ± 0.01 kW m−2s−1 and 160 ± 7.4 kW m−2s−1, respectively) were recorded for the EVA/LLDPE bilayer structure containing 0.25 wt.% graphite nanoplatelets and 10 wt.% expandable graphite. This implies that this system offered the best fire protection as quantified by the cone calorimeter test. This bilayer nanocomposite also featured acceptable antistatic and mechanical properties. The outer layer of EVA surface resistivity was 106 Ω/□, that is, within the antistatic range. The tensile strength was 16 MPa, a value comparable to the samples that contained only GNP as filler (17 MPa). The impact resistance was 6 J mm−1, a value similar to the impact resistance of the bilayer LLDPE/LLDPE nanocomposites with 0.25 wt.% GNPs in the outer layer.
Discussion
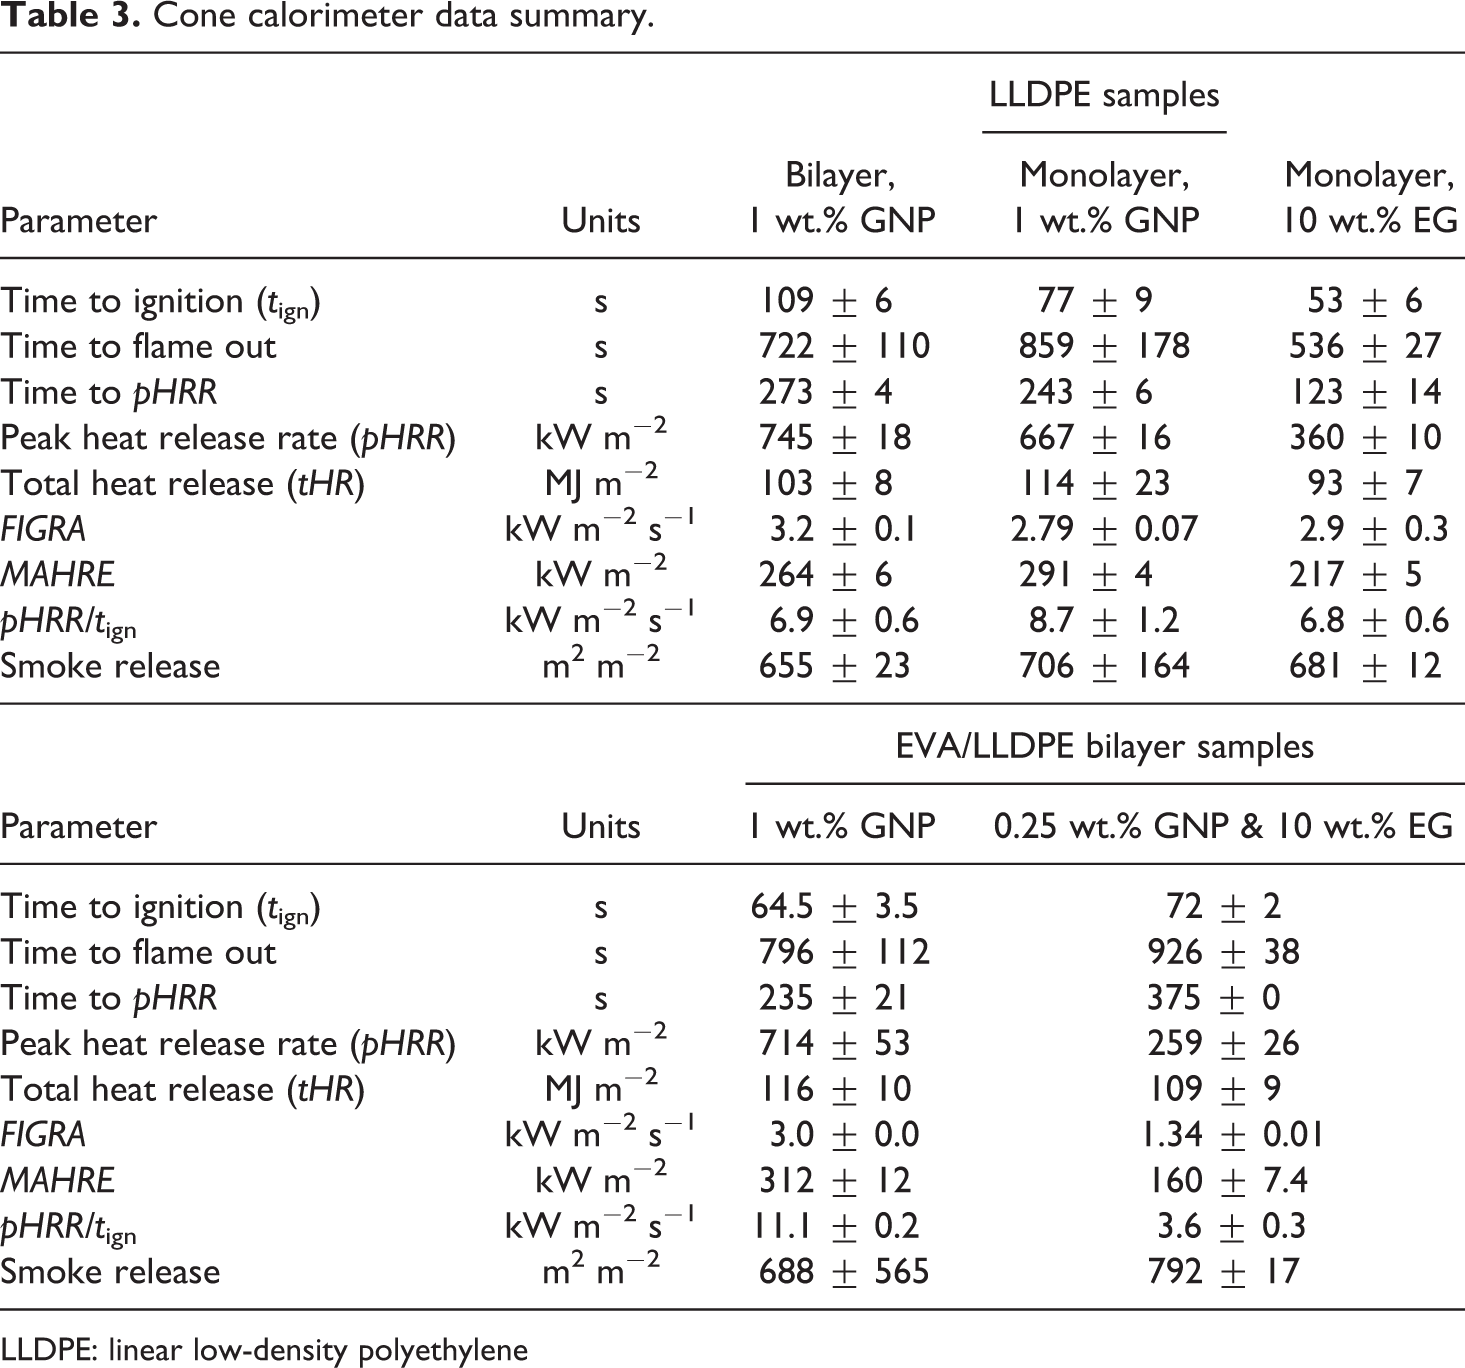
The resistivity data in Figure 4 appear to follow the universal composition trend predicted by the percolation theory. 37 Above a critical graphite volume fraction, corresponding to the percolation threshold, the concentration of graphite nanoplatelets is sufficient to ensure that a conductive network of touching particles is formed. 38 FESEM results of the fractured nanocomposites (Figure 8(a)) revealed that, in the compounded samples, the nanoplatelets are uniformly dispersed and well separated. It is even difficult to discern them, as the compounding process probably caused further crumpling into smaller particles. Therefore, their concentration in the matrix was too low to set up a conductive network. This is consistent with a previous study of polyethylene nanocomposites fabricated with GNPs which found percolation thresholds as high as 15 wt.%. 39
FESEM micrographs of rotomolded linear low-density polyethylene (LLDPE)nanocomposites with 0.25 wt.% graphite nanoplatelets filler after (a) melt compounding and (b) dry blending.
In the sample obtained by dry blending, random clusters of graphite nanoflakes are clearly identified (Figure 8(b)). Apparently, the platelets retained their flake-like shape and aggregated into larger domains. Away from these clusters, regions devoid of graphite particles are observed. This morphology is attributed to the unique character of the dry blending and rotomolding processes. During the blending action, in the high-speed mixer-grinder, the graphite nanoplatelets are distributed over the surface of the much larger polyethylene powder particles. Apparently, this accumulation at the periphery of the polyethylene domains largely persisted even after melting of the powder particles, and the subsequent consolidation and freezing of the polymer phase. This means that the platelets essentially remained trapped in between the original polyethylene powder particles. In this way, they formed conductive pathways around the remnants of the original polymer powder particles that coalesced into a continuous matrix. This hypothesis explains the low percolation threshold and the severe loss in impact resistance.
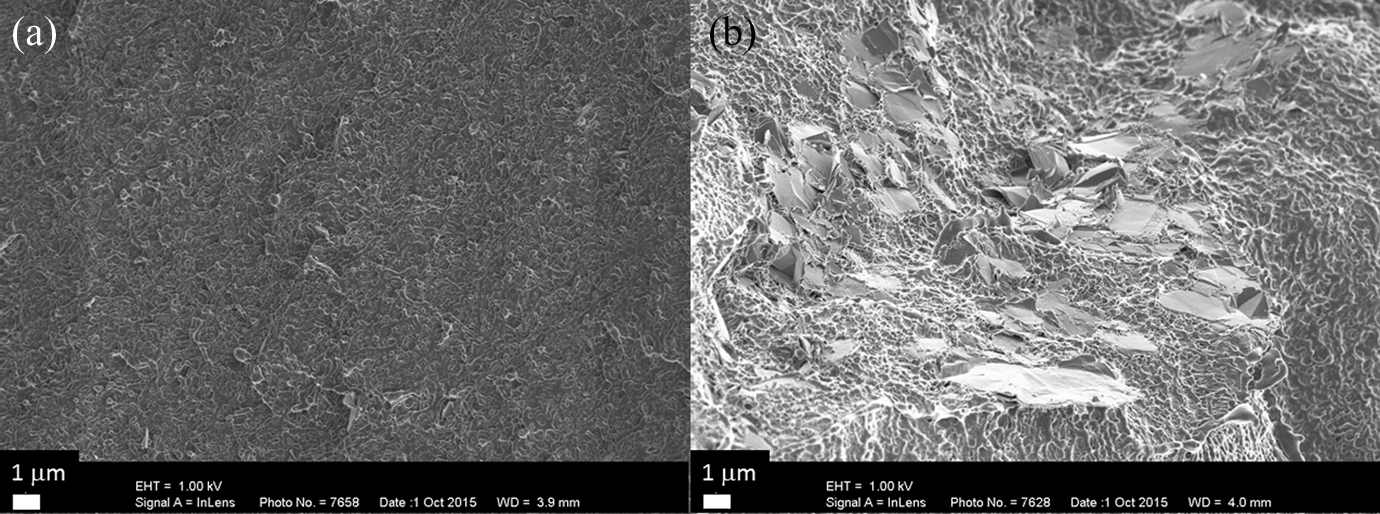
Support for this hypothesis is provided by the optical microscope image in Figure 9 and the SEM image in Figure 10 for LLDPE compounds containing 0.25 wt.% and 2.0 wt.% graphite, respectively. Figure 9 is an image of part of a thin cross-section of the molded wall. The dark fringes around large polyethylene domains are clearly visible. They are attributed to the presence of graphite platelets. Figure 10 shows a fracture surface covered almost entirely with a tapestry of graphite nanoplatelets.
Optical microscopy image of a thin cross-section of the part wall consisting of linear low-density polyethylene (LLDPE)containing 0.25 wt.% graphite nanoplatelets. The dark fringes represent spatially continuous graphite agglomerates.
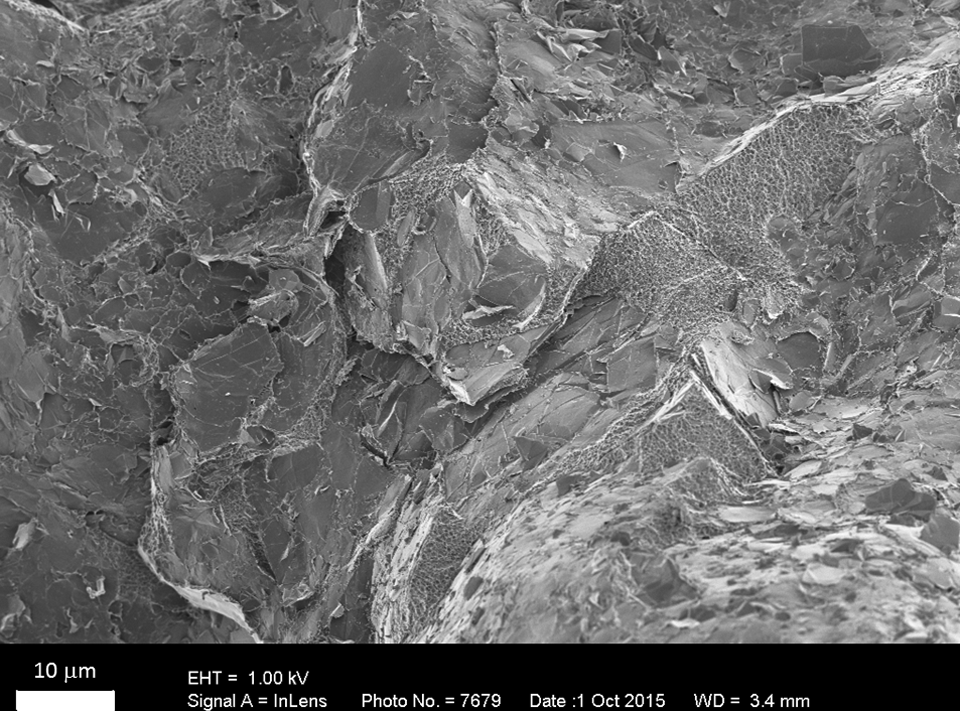
Scanning electron microscope image of a linear low-density polyethylene (LLDPE)fracture surface for a molding containing 2.0 wt.% graphite nanoplatelets. The exposed surface is covered by a tapestry of graphite platelets.
Long-range clustering of GNPs seen in the optical images and FESEM micrographs of dry blended composites enables the facile formation of a conductive network at low loadings, that is, 0.25 wt.% graphite at the expense of mechanical properties. The GNP particle clusters act as stress concentration points and also encourage crack formation, thereby weakening the nanocomposites. 30 At 0.25 wt.%, the compounded composite exhibits better mechanical properties due to better dispersion (Figure 7(b)), but they were not conductive. Closer inspection of the FESEM images revealed that there is hardly any adhesion between the GNPs and LLDPE, with the basal planes of the GNPs mostly uncovered by the polymer. A mismatch in surface energies exists between graphite and the hydrophobic, nonpolar polyethylene, hence the poor interfacial interaction. 12 However, there is evidence of strong adhesion between the GNPs and LLDPE on the edges of some the GNPs.
Conclusions
Graphite nanoplatelets can be conveniently prepared from expandable graphite by ultrasonic treatment of microwave-exfoliated material. This can yield flakes with thicknesses below 100 nm that retain lateral dimensions in the micrometer range. Rotomolding blends of polyethylene powder with small amounts of such graphite flakes yield antistatic and even conductive parts at graphite loadings below 0.5 wt.%. While the tensile strength of the base polymer is largely retained, the impact properties are significantly compromised. This problem can be partially overcome by molding bilayer sheets using the double dumping rotomolding technique with only the outer layer containing filler. It is even possible to mold an antistatic part with bilayer structure that features both antistatic and good fire performance in cone calorimeter testing. This was achieved using a 1-mm outer EVA layer containing 0.25 wt.% graphite nanoplatelets together with 10 wt.% expandable graphite and a 2-mm inner layer of neat polyethylene. The outer surface resistance of the resultant sheet was 106 Ω/□, the tensile strength was 16 MPa, the impact resistance was 6 J mm−1, and the cone calorimeter peak heat release rate was ca. 260 kW m−2. The corresponding values for polyethylene were >1014 Ω/□, 17 MPa, 12 J mm−1, and >720 kW m−2.
Footnotes
Declaration of Conflicting Interests
The author(s) declared no potential conflict of interest with respect to the research, authorship, and/or publication of this article.
Funding
The author(s) received no financial support for the research, authorship, and/or publication of this article.