
Abstract
Chemically engineered polyamide 6 (PA6)/graphene oxide (GO) nanocomposites were produced via the functionalization of GO with an amide (CONH2) functional group, in order to produce amide-GO with improved interfacial bonding and dispersion in the host polymer matrix. In situ polymerization of ε-caprolactam was carried out in the presence of amide-GO to create PA6/amide-GO nanocomposites. The nanomaterial (pre- and post-polymerization) and the composites were characterized using transmission electron microscopy (TEM), Fourier transform infrared spectroscopy (FTIR), X-ray photoelectron spectroscopy (XPS), X-ray diffraction (XRD), thermogravimetric analysis (TGA), differential scanning calorimetry (DSC) and tensile testing. The single-layer nature of GO was attested by TEM. FTIR, XPS, XRD and thermal analysis techniques confirmed the successful amide modification of GO. The expected attachment of PA6 to the surface of GO is demonstrated, along with the reduction of GO during polymerization. Some reduction of GO during the chemical functionalization process was also observed. The thermal stability of the nanocomposites was confirmed, while promotion of α-phase crystallite formation and a molecular weight change of attached PA6 are observed. A linear improvement in stiffness and yield strength was observed as functionalized GO content increased from 0.1 wt% to 0.75 wt%. A levelling off of mechanical properties ensued once the GO content reached 1 wt%, and a decrease was seen at 2 wt%.
Introduction
Graphene is an exciting recently discovered material with renowned mechanical, 1 electrical 2 and thermal properties. 3 This has made it the filler of choice for a wide range of high-performance composite materials. Difficulties arising with large-scale production of pristine graphene, 4 and problems in interfacial interaction with pristine graphene and a host polymer matrix, have led to the use of graphene oxide (GO) as a filler material in composites. GO has recently experienced a surge in research relating to nanocomposite materials. 5 It is the presence of the oxygen functionalities on the surface, which provide good compatibility with polymer matrices. This in turn can lead to good interfacial interaction and dispersion, which are essential for the transfer of graphene’s excellent properties into the composite material. The functionalization of graphene and GO through the covalent attachment of organic molecules, the addition of free radicals or dienophiles, the attachment of polymeric materials and non-covalent attachment involving π interactions is well documented. 6,7 Perhaps, the most popular method for the attachment of molecules to GO is via a reaction with the carboxylic acid edge groups. 8 Nickel chloride has been used to functionalize graphene in the making of graphene/nickel oxide nanocomposites with improved electrochemical properties. 9 The doping of graphene edge groups with nitrogen using ammonia has been conducted previously, 10 but like much of the research in this area, the end application is in the field of electronic devices rather than mechanical performance. Graphene sheets have been functionalized with 3,5-di(trifluoromethyl)-aniline initially by a reaction with the carboxylic acid groups to produce an acyl chloride functionality, thus accommodating the production of graphene/poly(vinylidenefluoride-trifluoroethylene-chlorofluoroethylene) [P(VDF–TrFE–CFE)] nanocomposites with improved Young’s modulus, tensile strength and electromechanical performance. 11 A large amount of research has been undertaken, which focuses specifically on the covalent modification of GO via nucleophilic substitution (as conducted here), electrophilic substitution, condensation reactions and addition reactions. 12 The chlorination of graphene containing oxygen has previously been successful. 13 An investigation into the effect of the functionalization of graphene and carbon nanotubes (CNTs) with an amide group has been carried out with a focus on the electrical and magnetic properties of the materials. 14 GO has been functionalized with polyhedral oligomeric silsesquioxane (POSS) via amide formation between amine groups functionalized on POSS and the oxygen groups present on GO. This new material was then used to prepare POSS-functionalized graphene/poly(methyl methacrylate) (PMMA) nanocomposites with improved thermal properties. 15 Styrene–butadiene–styrene (SBS) has previously been grafted onto the surface of GO through the use of maleic anhydride-grafted SBS. This new SBS-functionalized GO was incorporated into an SBS tri-block copolymer matrix which observed increases in Young’s modulus of up to 43% at 3 wt% loading. 16
To the authors’ knowledge, this is the first report of the synthesis of an amide-functionalized GO/polyamide 6 nanocomposite (PA6/amide-GO). The results reported herein are a continuation of our previous studies of PA6/GO composites prepared through in situ polymerization. 17,18 This study was encouraged by the work of Gao et al. in the Journal of the American Chemical Society. 19 Wherein is reported the successful functionalization of single-walled CNTs with an amide group and their inclusion in a PA6 composite with improved mechanical properties.
The abbreviations used in the display of results are as follows: graphene oxide is denoted GO. Acyl chloride-functionalized graphene oxide is acyl-GO. Amide-functionalized graphene oxide is amide-GO. Amide-functionalized graphene oxide after removal from composite (post-polymerization) is denoted as amide-GOPP.
Experimental
Materials
GO was purchased from NanoInnova Technologies (Spain). ε-Caprolactam (C6H11NO, 99%), 6-aminocaproic acid (C6H13NO2, 99%), anhydrous N,N-dimethylformamide (DMF; 99.8%), oxalyl chloride ((COCl)2; distilled (96%)) and formic acid (HCOOH, 98%) were purchased from Sigma-Aldrich® (St Louis, Missouri, USA). Polypropylene (PP) filter membranes with 0.1 µm porosity and 47 mm diameter were purchased from Sterlitech (Kent, Washington, USA).
Chemical functionalization of GO
GO was functionalized with amide via the replacement of carboxyl (COOH) edge groups with acyl chloride (COCl) using (COCl)2, followed by the addition of ammonia (NH3) to create an amide (CONH2) group in place of the acyl (and thus the original carboxyl group; Figure 1).
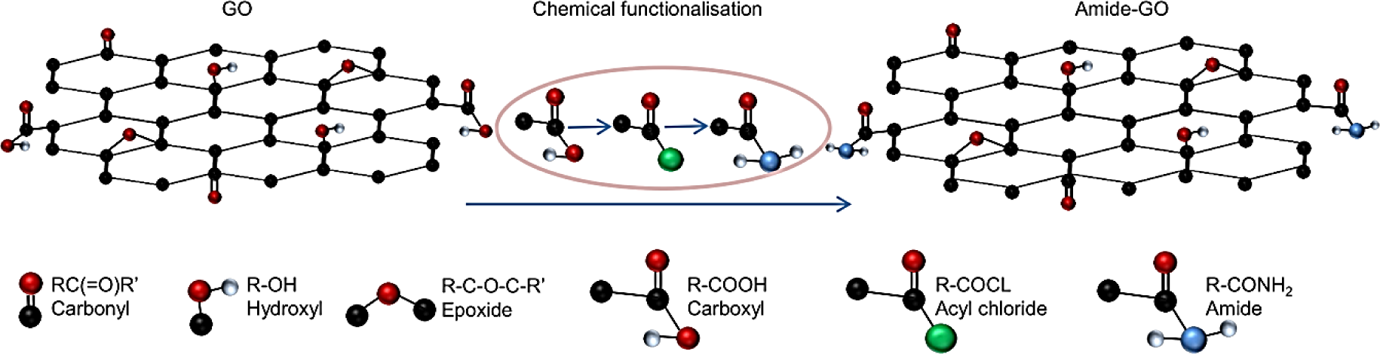
Chemical synthesis of amide-functionalized GO. GO: graphene oxide.
One gram of GO was homogenously dispersed into 1 l of DMF (1 mg ml−1) by bath sonication for 2 h. Into this solution, 28.5 ml of (COCl)2 was added dropwise at 0°C, under a nitrogen atmosphere with magnetic stirring. Upon addition of the (COCl)2, the solution was stirred for 2 h at 0°C. The suspension was then raised to room temperature and stirred for further 2 h. The solution was then heated to 70°C and stirred overnight to remove excess (COCl)2 which has a boiling point of 61°C. 11
The mixture was then filtered through 0.1-µm pore size PP filter membranes using vacuum. The resulting precipitate was redispersed in 1 l of DMF via bath sonication for 2 h, yielding a new suspension of acyl chloride–functionalized GO dispersed in DMF. Ammonia gas was then bubbled through this solution for 4 h at 0°C under magnetic stirring. This solution was then vacuum filtered using 0.1-µm pore size PP filter membranes. The precipitate was collected and washed with water by dispersing it in 1 l of distilled water by bath sonication for 2 h. This final solution was filtered again using 0.1-µm pore size filter paper. The resulting amide-GO was then dried at 40°C before its use in preparing the composites.
In situ polymerization of PA6
The in situ polymerization process used to produce the nanocomposites for this work is detailed in the previous work by this research group. 17 The technique used was the ring-opening polymerization of ε-caprolactam using the initiator 6-aminocaproic acid.
Nanocomposites with the following weight percentage (wt%) of amide-GO were prepared: 0.1 wt%, 0.25 wt%, 0.5 wt%, 0.75 wt%, 1 wt% and 2 wt%.
The method of attachment for the ends of PA6 chains to the amide-GO is depicted in Figure 2. An amide may become the first link in a PA6 chain through reactions among the terminal amines of PA6 during polymerization and the CONH groups at the edge. 20
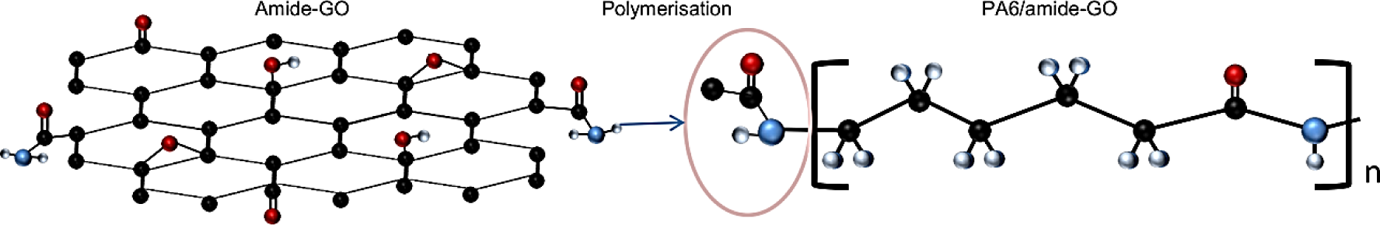
Interaction between amide-functionalized GO and PA6 molecules. GO: graphene oxide; PA6: polyamide 6.
Characterization of materials
High-resolution transmission electron microscopy (TEM) analysis was carried out using a JEOL, JEM-2100F instrument with a point resolution of 0.19 nm. Agar scientific Holey carbon-coated Cu 300 mesh grids were used for sample preparation. Measurements were performed at 200 kV (119 uA) using the smallest aperture.
Fourier transform infrared spectroscopy (FTIR) was carried out using a Varian 640 IR FT-IR spectrometer, in absorbance mode, at a resolution of 4 cm−1 and over the range 4000–400 cm−1. Samples were analysed in attenuated total reflection mode using a KRS5 (Thallium Bromo-Iodide) crystal.
Tensile testing of nanocomposite coupons was undertaken using a Zwick/Roell ProLine machine with a 5-kN load cell using uniaxial stress. The cross head speed was set at 20 mm min−1. ASTM standard D638 Type V samples were used for testing which was carried out at room temperature. The sample dimensions are 63.5 mm length, 3.18 mm width and 9.53 mm gauge length. A micrometre was used to take an average thickness over three points in the gauge length. A minimum of five specimens were tested for control PA6 and for each of the six different weight percentage nanocomposites.
Thermogravimetric analysis (TGA) was carried out using a TA Instruments Q5000 IR analyser at a ramp rate of 10°C min−1 under a nitrogen atmosphere.
Differential scanning calorimetry (DSC) was carried out on a TA Instruments DSC Q100 series at a ramp rate of 10°C min−1 under a nitrogen atmosphere.
The characterization of materials, which was carried out using X-ray photoelectron spectroscopy (XPS) and X-ray diffraction (XRD), was performed in accordance with the methods and materials already stipulated in past work. 17
Sample preparation
Post-polymerization amide-GO (amide-GOPP) was obtained via centrifugation. A total of 3 g of composite was dissolved in 900 ml of formic acid. The solution was then centrifuged using a Thermo Scientific™ Sorvall™ ST16 centrifuge at 12,500 r min−1 for 1 h. Afterwards, the supernatant, consisting of formic acid and dissolved PA6, was removed leaving a pellet of amide-GOPP. The resulting precipitate was redispersed in 180 ml of formic acid and then centrifuged again at 12,500 r min−1 for 1 h in order to remove any free PA6. After this, the supernatant was again removed and more formic acid was added to the precipitate to make the volume back up to 180 ml. This solution was then centrifuged for a final time at 12,500 r min−1 for 1 h and the resulting supernatant was removed. Due to the high solubility of PA6 chains in formic acid, the ensuing pellets of amide-GOPP were deemed to be free of any unattached polymer chains.
Results and discussion
The TEM image in Figure 3 shows the morphology of the GO. This shows the single-layer nature of the material with significant amounts of creasing and also the potential presence of some few layered material as well. 21 Previous atomic force microscopy (AFM) of this GO material has observed a thickness of 0.76 nm and typical lateral dimensions ranging from a few hundred nanometres to up to 1 or 2 µm. 17
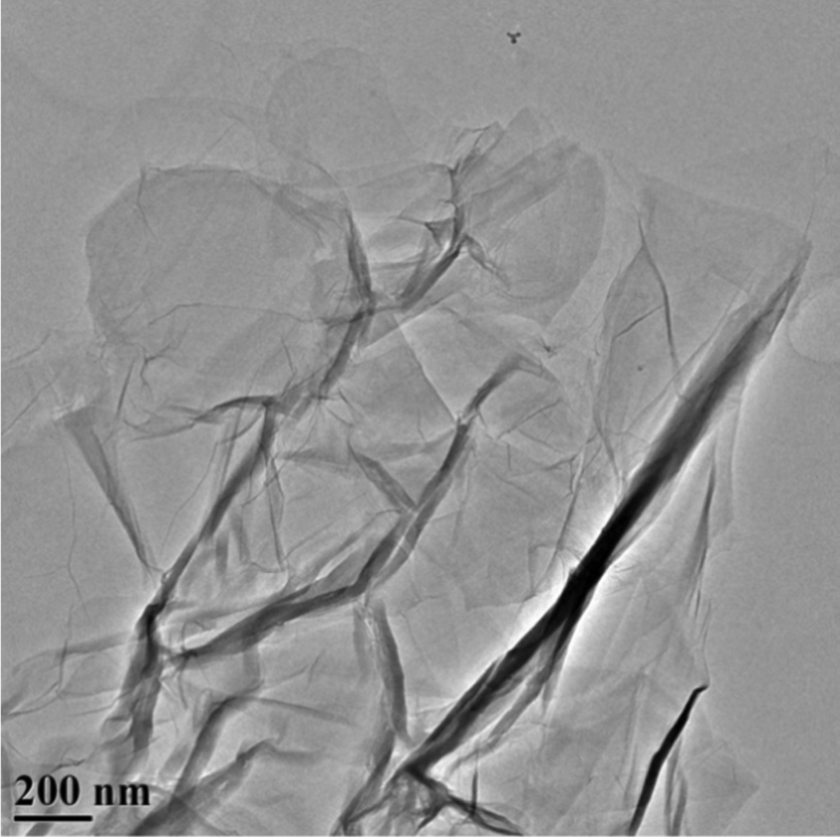
HRTEM image of single-layer GO. HRTEM: high-resolution transmission electron microscopy; GO: graphene oxide.
The FTIR peaks shown in Figure 4 are typical for GO and are assigned as follows: C–OH (hydroxyl) at ∼3600 cm−1. The large range between 3000 cm−1 and 3500 cm−1 can be assigned to O–H from adsorbed water molecules. C=O from carbonyl and carboxyl can be seen at 1750 cm−1, while stretching of C=C in graphene is located at 1650 cm−1. The peaks at 1400, 1210, and 9050–1050 cm−1 are attributed to C–O (carboxyl), C–O (epoxide) and C–O (alkoxy), respectively. 22 Additional peaks in acyl-GO when compared to GO are observed at 2775 cm−1 (C–H3) and 1550 cm−1 (N–CH3) which is likely a result of the presence of the aldehydes present in DMF which have two infrared resonances. The peak at 1450 cm−1is thought to be due to the decomposition of the –OH group, which has been replaced by chlorine. While the new peak at 800 cm−1is caused by the stretch of C–Cl. Peak changes observed in amide-GO are as follows: the peak at 2875 cm−1is caused by the vibrations of N–CH2, which is a result of the new amide functionality. 23 The large and predominant peaks observable at 1400 and 1600 cm−1are attributed to amide II and amide I (C=O stretching), respectively. 8,24 The low-intensity peaks in amide-GOPP can be attributed to a mix between amide-GO and PA6. 25 The amide-GOPP has reduced oxygen peaks when compared to amide-GO as previously detailed. 17 As the GO is reduced during polymerization, the amide-GOPP has extremely low peak intensities. The products of the functionalization process are shown in the spectra for acyl-GO and amide-GO. The addition of an amide peak at 1650 cm−1 suggests the successful functionalization of GO. First by the incorporation of the acyl group onto GO, then the chlorine is subsequently removed in amide-GO further advocating that the acyl group has been replaced with amide. The chemical modification seemingly has no adverse effect on any other of the chemical groups of GO.
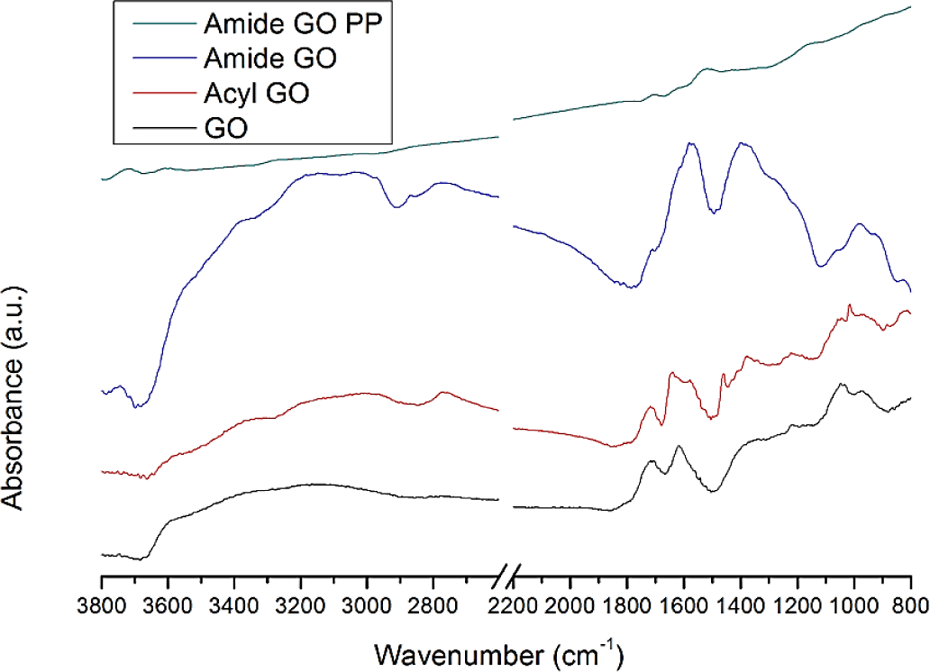
FTIR spectra of GO, acyl-GO, amide-GO and amide-GOPP. FTIR: Fourier transform infrared spectroscopy; GO: graphene oxide; amide-GOPP: post-polymerization amide-GO.
Figure 5(a) depicts the XPS wide energy survey scans which have detected peaks at the following binding energies (BEs): chlorine (Cl 2p) ∼200, carbon (C 1 s) ∼285, nitrogen (N 1 s) ∼400 and oxygen (O 1 s) ∼533. The spectral components of these peaks were fitted to the following BEs. GO C 1 s (Figure 5(b)): C–C at 285 eV, C–O at 287 eV, C=O at 287.8 eV and O=C–OH at 288.8 eV. Acyl-GO C 1 s (Figure 5(c)): C–C at 285 eV, C–Cl at 286.3 eV, C–O at 287 eV, C=O at 287.8 eV and O=C–Cl at 289.1 eV. Amide-GO C 1 s (Figure 5(d)): C–C at 285 eV, C–O at 287 eV, C=O at 287.9 eV and O=C–NH at 288.8 eV. Amide-GOPP C 1 s (Figure 5(e)): C–C at 285 eV, C–C=O at 285.6 eV, C–N at 286.2 eV and CONH at 288 eV. 26 PA6 C 1 s (Figure 5(f)): C–C at 285 eV, C–C=O at 285.8 eV, C–N at 286.2 eV and CONH at 288 eV.
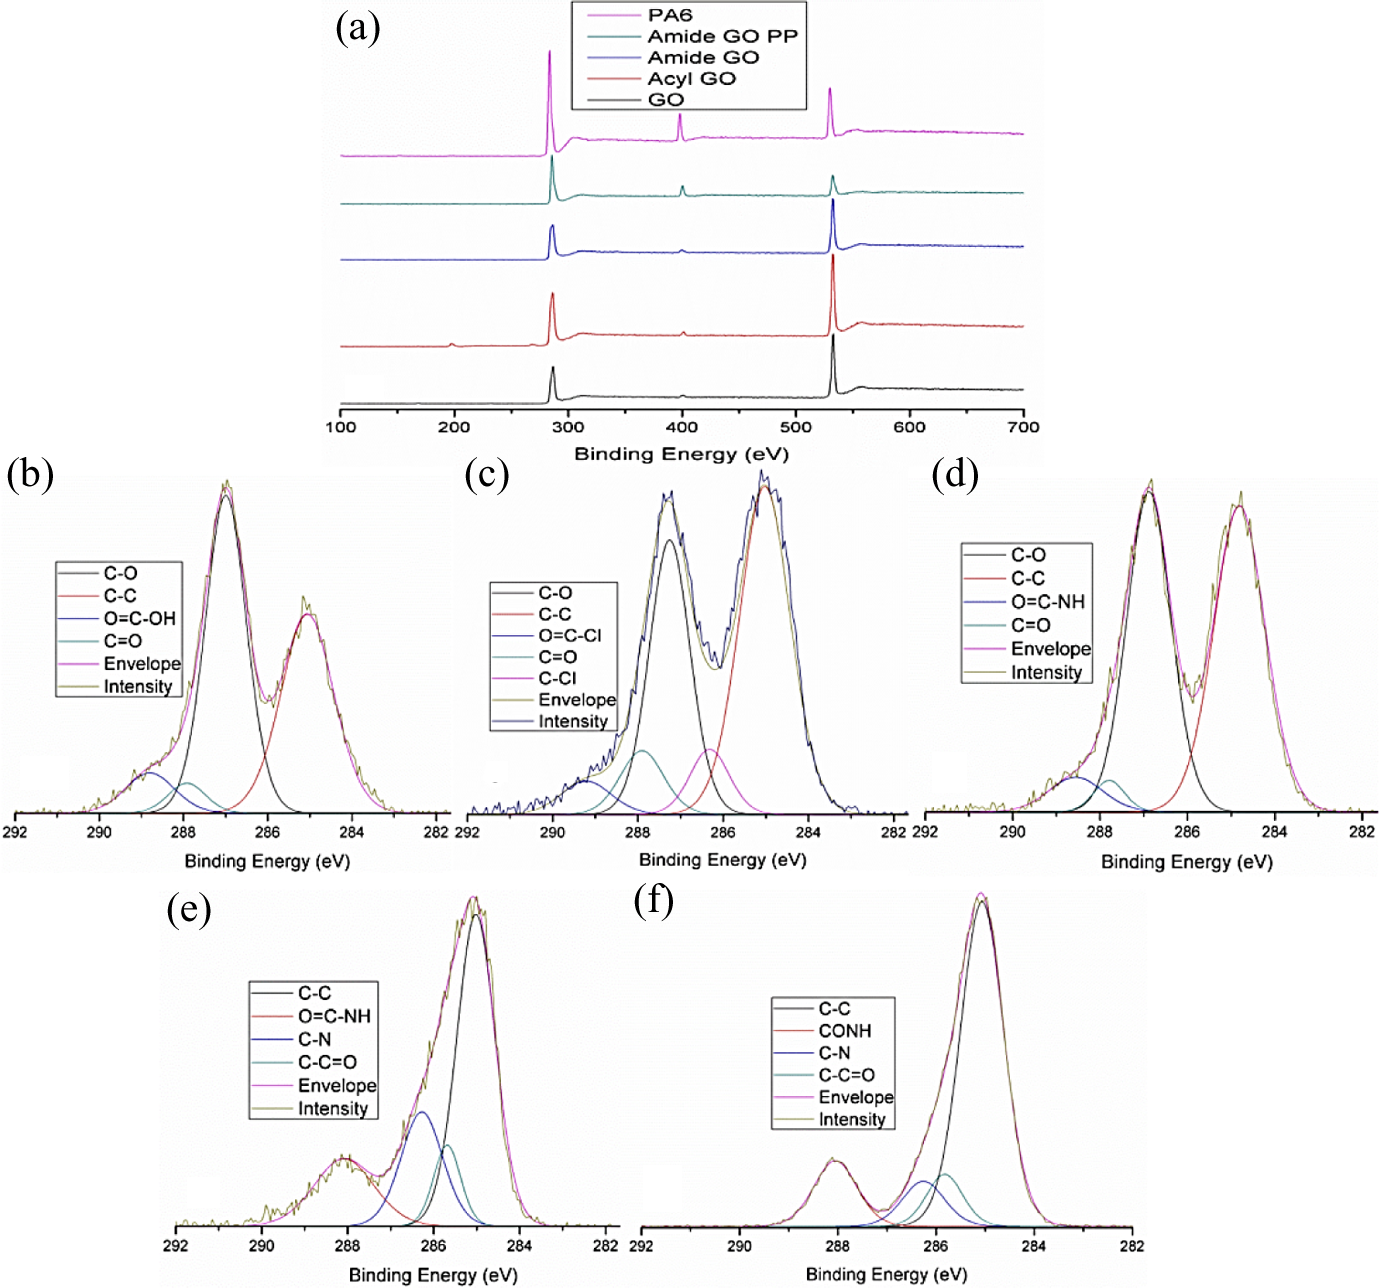
XPS (a) wide energy survey scan for GO, acyl-GO, amide-GO, amide-GOPP and PA6. (b) Peak fitted GO C 1 s. (c) Peak fitted acyl-GO C 1 s. (d) Peak fitted amide-GO C 1 s. (e) Peak fitted amide-GOPP C 1 s. (f) Peak fitted PA6 C 1 s. XPS: X-ray photoelectron spectroscopy; GO: graphene oxide; amide-GOPP: post-polymerization amide-GO; PA6: polyamide 6.
The peak fitted components for GO and PA6 correspond with those in the literature. 27,28 The peak attributed to carboxyl (COOH), acyl chloride (RCOCl) 29 and amide (CONH2) 30 arises at 288.8 eV (7.2%) for GO and is replaced by a peak at 289.2 eV (4.7%) for acyl-GO then a further displacement to 288.8 eV (5.3%) for amide-GO. This suggests successful chemical functionalization with a GO edge group conversion from carboxyl to acyl chloride and finally to amide moieties. Chlorine is present only in the acyl-GO samples as it has been removed in amide-GO due to the replacement of acyl chloride with the amide group. The lack of chlorine in amide-GO samples leads to the conclusion that the acyl chloride edge groups have reacted as expected into amide groups and also any residual chlorine from the solution has been removed during the washing process.
Amide-GO has the highest nitrogen content of ∼4% when compared to traces in GO and acyl-GO, which is indicative of the successful incorporation of CONH2. Due to the extreme surface sensitivity of XPS, the PA6 is predominantly detected in the C 1-s peak for amide-GOPP; however, the C–N peak in amide-GOPP (19.2%) is much larger than the same peak in control PA6 and composite samples (11.5–12.3%). In addition, the CONH peak concentration percentage for PA6 and composite samples increases from 12–14% to 17.5% for amide-GOPP. This increase in nitrogen bonding would also indicate the functionalization of GO with amide, as the nitrogen content of amide-GO is augmenting the nitrogen content of the polymer.
In relation to the C–C peak in the C 1 s spectra in Figure 5, the C–O peak in GO (Figure 5(b)) is of a greater intensity. But the same relationship is not observed in acyl-GO (Figure 5(c)) and amide-GO (Figure 5(d)), where for both samples, the C–C and C–O peak intensities are almost level. Hence, there is some reduction of the C–O peak (which as explained above is a combination of the C–O–C (epoxide) and C–OH (hydroxyl) groups) in functionalized samples. In total, the functionalized samples have approximately 5% less oxygen than GO, as per their atomic weight percentage. It is possible that this reduction could be due to the chemical process the material has undergone, as nucleophilic substitution between amine groups and GO can result in deoxygenation. 31 A nucleophilic reaction between C–O–C and –NH2, 32 hydrolysis of epoxy groups or C–C bond formation via a Claisen rearrangement could all be mechanisms for the reduction of GO. 33 However, this could also be attributed to a reduction in the C–OH portion of the peak through the removal of the hydroxyl moiety in the carboxylic acid edge groups.
As shown in Figure 6, the O 1 s spectral components for the samples were fitted as follows. GO O 1 s (Figure 6(a)): C=O at 531.5 eV, C–O aromatic at 532.7 eV, C–O aliphatic at 533.5 eV and water at 534.3 eV. Acyl-GO O 1 s (Figure 6(b)): C=O at 531.7 eV, C–O aromatic at 533.1 eV, C–O aliphatic at 534 eV and water at 534.9 eV. Amide-GO O 1 s (Figure 6(c)): C=O at 531.6 eV, C–O aromatic at 533 eV, C–O aliphatic at 534 eV and water at 534.8 eV. 34 Cl 2p peak components (Figure 6(d)) have been assigned to Cl–C at 198 eV and Cl–C=O at 200 eV. 35
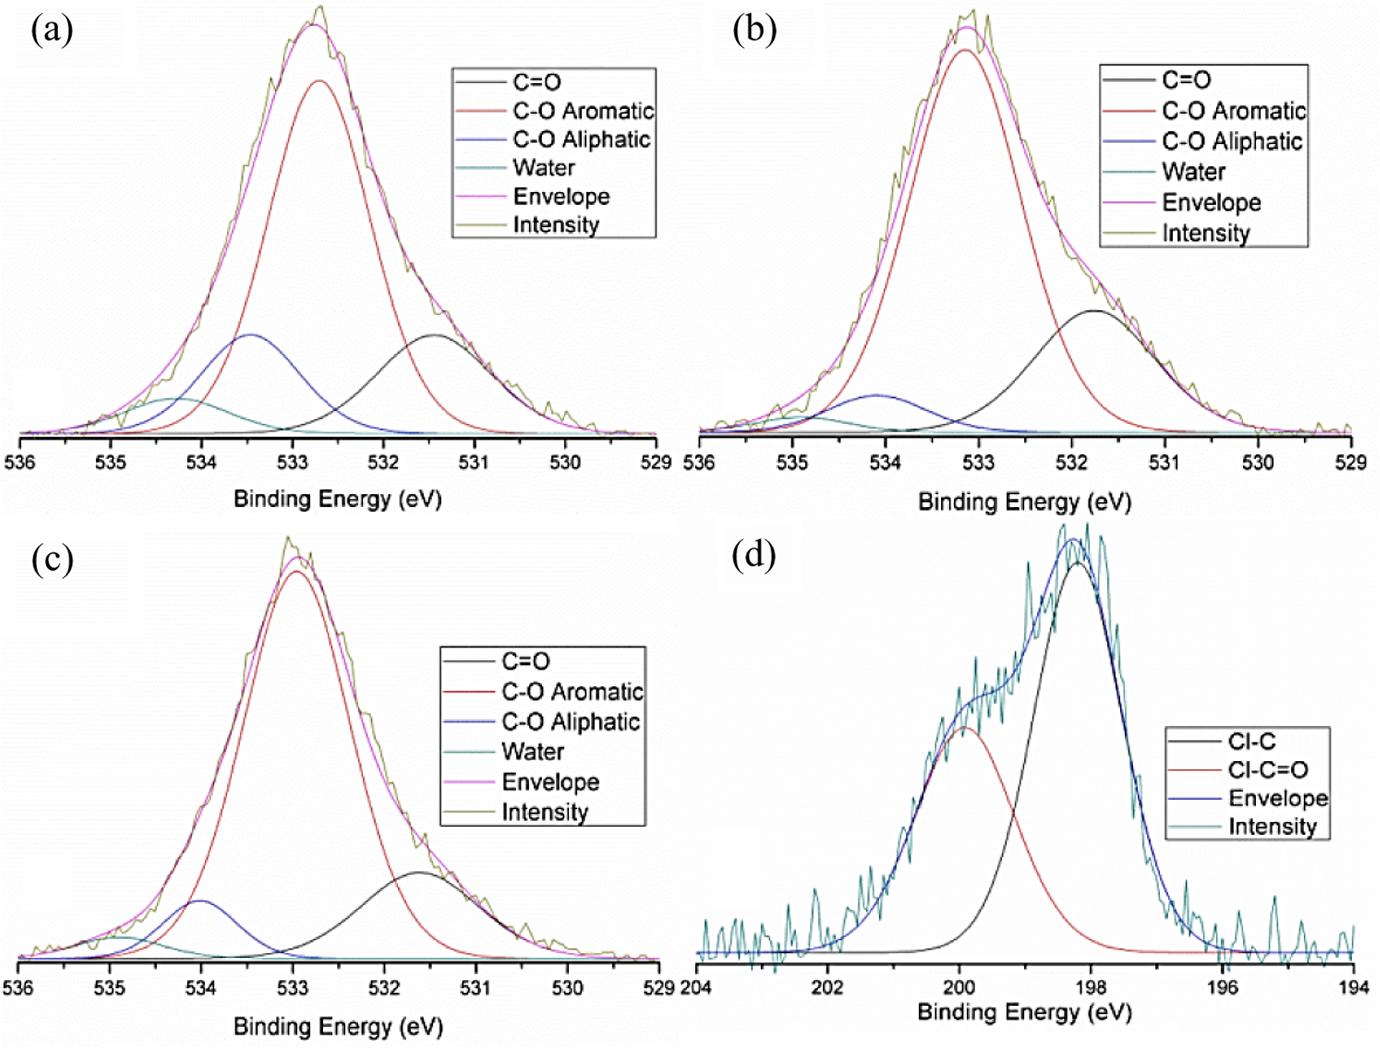
XPS peak fitted O 1 s spectra for (a) GO. (b) Acyl-GO. (c) Amide-GO and (d) peak fitted Cl 2p spectra for acyl-GO. XPS: X-ray photoelectron spectroscopy; GO: graphene oxide.
The O 1 s peaks in Figure 6 for GO indicate the presence of the expected carbon–oxygen complexities. Such as O–C=O, C–C=O, C–OH, C–O–C and C=O. 36 The most predominant of which appear to be hydroxyl groups. 37 The deoxygenation of C–O caused by the initial acyl functionalization, as seen in the C 1 s spectra, is also present in the O 1 s with a decrease in peak intensity. The reduction in size for the peak representing C–O aliphatic from 16% to ∼7%, in acyl-GO and amide-GO when compared to GO is attributed to the reduction in COOH edge groups as predicted during the chemical process. 38 With these being transformed first into O=C–Cl and then to O=C–NH2. Water content from GO to functionalized samples is halved (from 6% to 3%) as is confirmed in the following TGA results and is attributed to the chemical process most likely the use of anhydrous solvent. Cl 2p peak components have two spin orbit split peaks for the chemical state Cl–C=O. The peak components confirm the presence of an organic chloride, although this Cl–C and Cl–C=O bonding is present in both acyl chloride and the as-received (COCl)2. The degradation of polymers containing chlorine under X-ray radiation is known to occur, which can cause a loss of chlorine and may account for the rough spectrum seen in Figure 6(d).
In the diffraction patterns in Figure 7(a), as-received GO shows a distinct graphite oxide peak at 2θ = 12° which corresponds to a d-spacing of 0.73 nm and is attributed to the oxygen and intercalated water present between atomic planes of graphite oxide. 9 The pattern for acyl-GO has a peak at 9.5° which gives an interlayer spacing of 0.93 nm. While the predominant peak at 11.7° in amide-GO is closer to that of GO with a d-spacing of 0.75 nm. Amide-GOPP has a broad diffraction with peaks at 20° and 24° corresponding to interlayer spacing of 0.44 and 0.37 nm, respectively. These are in compliance with peaks commonly seen in reduced GO (rGO). In Figure 7(a), the peaks above 25° in graphene samples are attributed to graphite and result from the presence of few layered graphene which is common in GO produced through the chemical exfoliation of graphite. 39 In Figure 7(b), control PA6 has a broad diffraction range with a peak at 21.2° which is attributed to γ-phase crystallites. The composite samples – PA6/amide-GO 0.1 wt%, PA6/amide-GO 1 wt% and PA6/amide-GO 2 wt% – observe a broadening of the XRD pattern to include peaks at 20.5° and 23° which are attributed to the presence of α-phase crystallites. 40 The crystallinity of the PA6 is confirmed in the literature with the presence of γ- and α-phase crystallites. 41
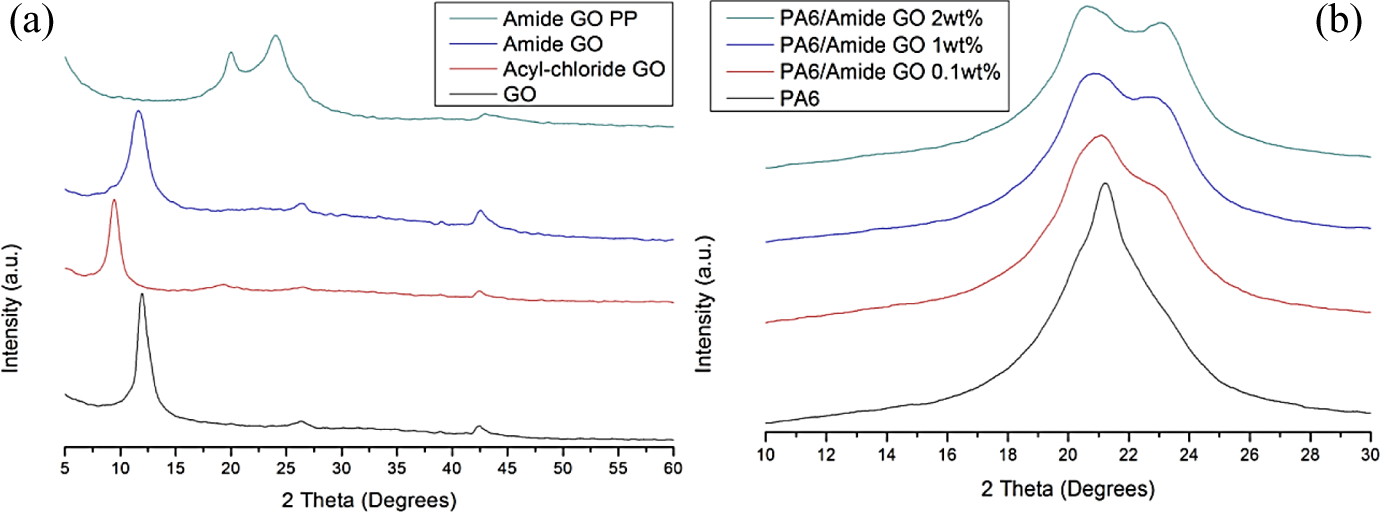
X-ray diffraction patterns offset by y-axis for (a) in ascending order, GO, acyl-GO, amide-GO and amide-GOPP; (b) in ascending order, PA6, PA6/amide-GO 0.1 wt%, PA6/amide-GO 1 wt% and PA6/amide-GO 2 wt%. GO: graphene oxide; amide-GOPP: post-polymerization amide-GO; PA6: polyamide 6.
The shift in peak location from GO to a lower 2θ value for acyl-GO is indicative of successful functionalization with the installation of new chemical groups on the GO surface increasing interlayer spacing. 33 This d-spacing is then reduced for amide-GO samples where the larger acyl chloride molecules are replaced with amide. Diffraction patterns indicate that the GO is reduced during polymerization as the prominent peak at 12° is absent from amide-GOPP. The increase in the amount of the more thermodynamically stable α-phase crystallites in composites compared to neat PA6 is believed to be caused by the inclusion of nanoparticles promoting a change in crystallinity. 42 This change in crystal phase is linear with increasing amide-GO wt%. The α phase typically occurs in quenched PA6, while a mixture of α and γ phases is seen in annealed samples. 43 For amide-GOPP, the peaks observed can be attributed to both rGO and the α-phase crystallites present in PA6. When comparing the amide-GOPP and PA6/amide-GO composites, it is clear that the peak for γ-phase crystallites is greatly reduced in the graphene samples when compared to bulk composites. This confirms that while the addition of amide-GO has facilitated the growth of more α-phase crystallites, this is more prevalent on the polymer attached directly to the graphene, where predominantly α-phase crystallites are observed.
Referring to the TGA curves illustrated in Figure 8(a), all samples display an initial moisture loss followed by decomposition of their oxygen functionalities, whereas the amide-GOPP sample has a further degradation as a result of the attached PA6 on the surface. GO and amide-GO see an initial 13 and 10% weight loss, respectively, while acyl-GO loses only 7% of its weight due to moisture. The main weight loss step for GO (see Table 1 for temperatures) accounts for 27% and is attributed to the loss of oxygen functionalities. For acyl-GO, it has increased to 35% due to the presence of organic chlorides and residual DMF. For amide-GO, the main step accounts for 20% weight loss. This would agree with the XPS results that there is less oxygen present on functionalized graphene samples. Amide-GOPP shows an initial 2% weight loss due to moisture. This is followed by two weight loss peaks as shown by the derivate plot in Figure 9(b). The first of which at 177°C is thought to be due to the loss of remaining oxygen functionalities and accounts for approximately 5% weight loss. The presence of limited oxygen post-polymerization was also observed via FTIR. The final weight loss peak at 340°C is the degradation of PA6 attached to the surface of GO. This accounts for a total of 53% weight loss due to decomposition of attached PA6. Previous reports of attachment differ between 50% and over 90%; however, this can be heavily dependent on the thoroughness of the process used to remove free polymer chains, via dissolution, centrifugation and filtering. 44,45
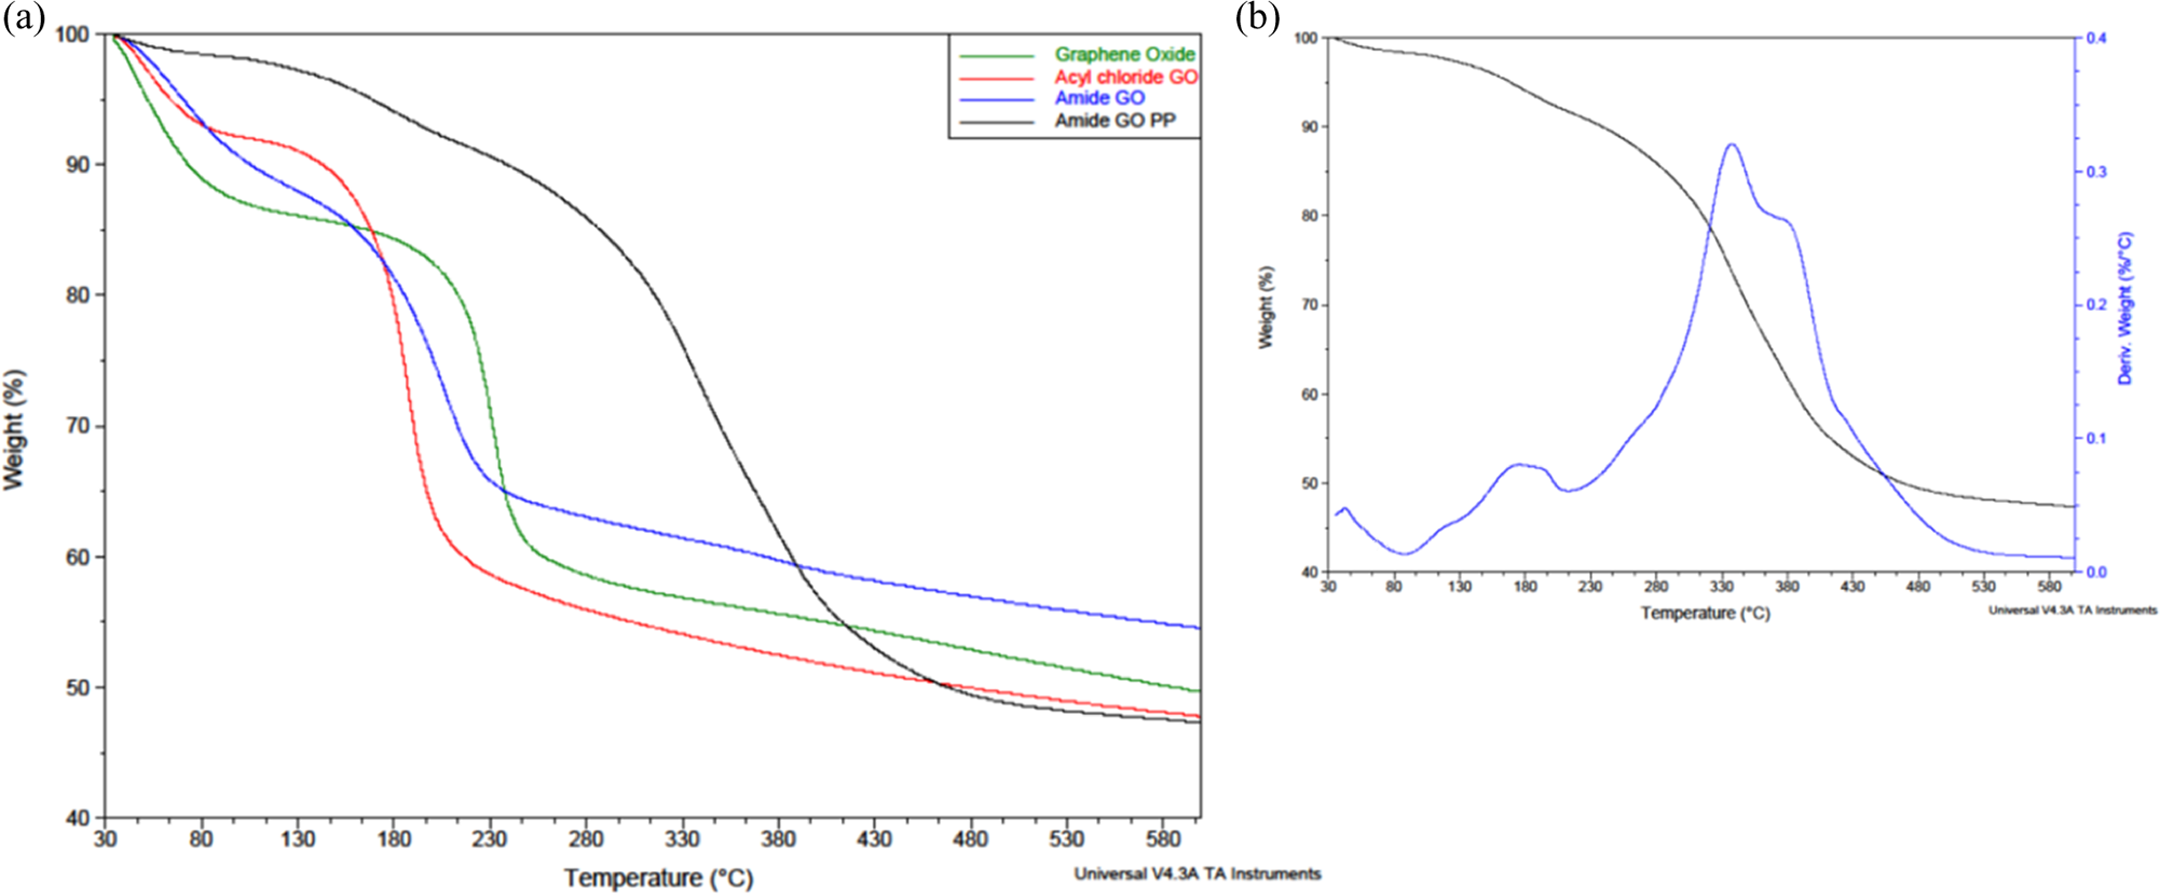
TGA curves for (a) GO, acyl-GO, amide-GO and amide-GOPP. (b) Amide-GOPP with derivative weight (%/°C). TGA: thermogravimetric analysis; GO: graphene oxide; amide-GOPP: post-polymerization amide-GO.
Thermal properties of GO and composite samples ascertained via TGA and DSC.
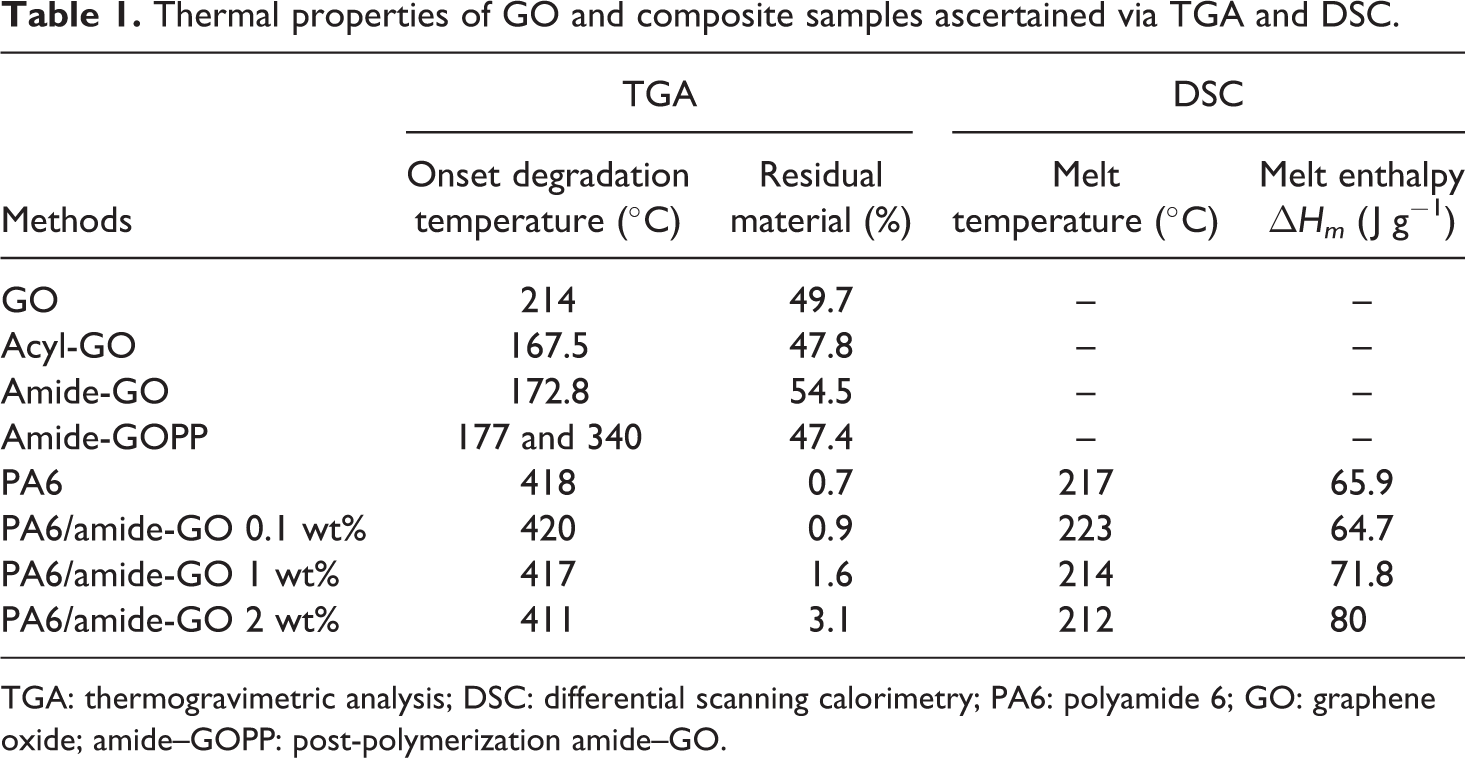
TGA: thermogravimetric analysis; DSC: differential scanning calorimetry; PA6: polyamide 6; GO: graphene oxide; amide–GOPP: post-polymerization amide–GO.
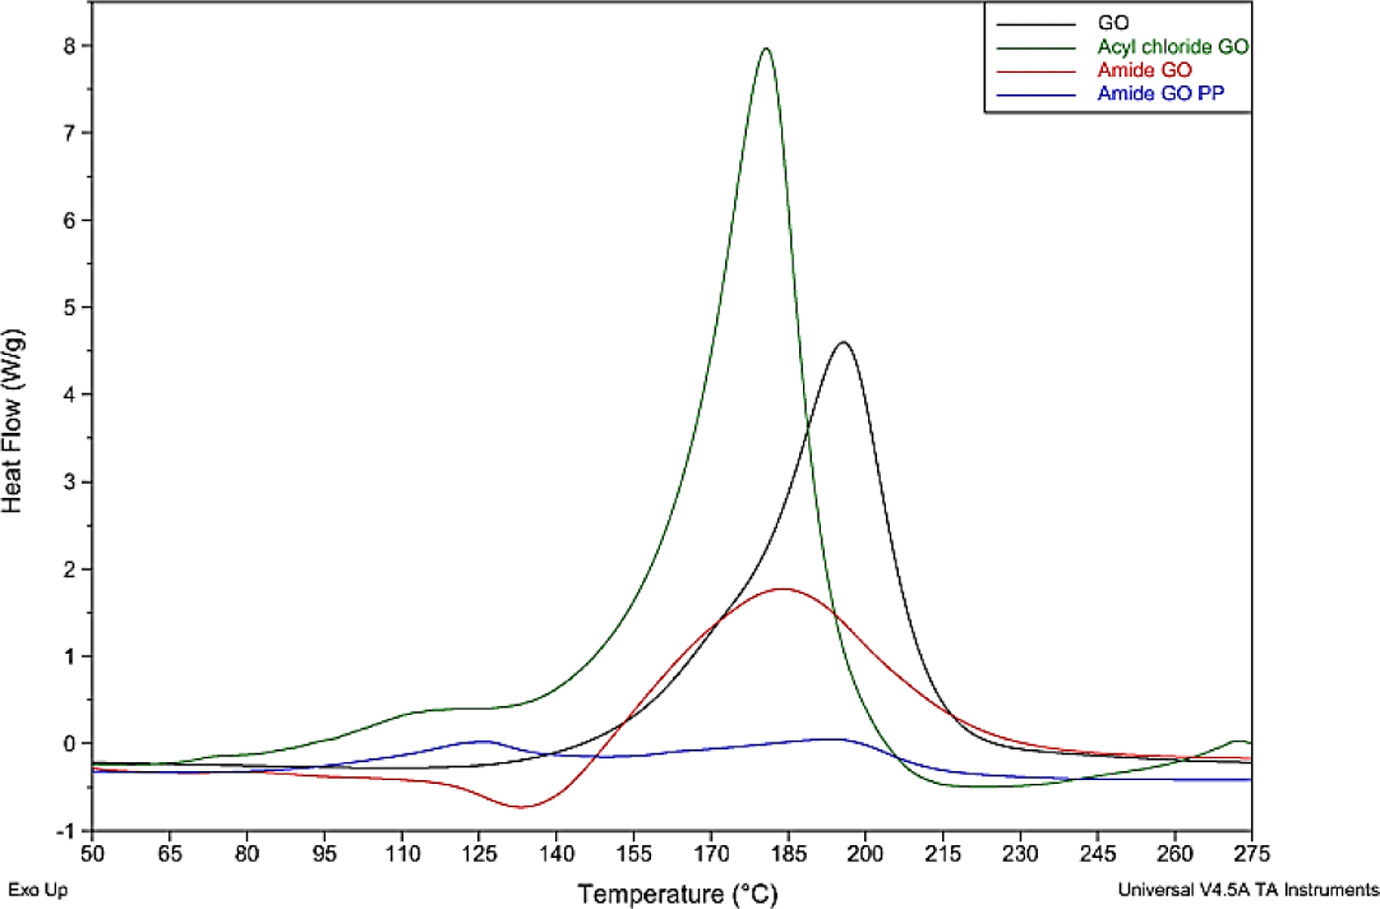
DSC exothermic graphs for GO, acyl-GO, amide-GO and amide-GOPP. DSC: differential scanning calorimetry; GO: graphene oxide; amide-GOPP: post-polymerization amide-GO.
The DSC results depicted in Figure 9 demonstrate the degradation of the oxygen species for all graphene samples. In the as-received GO powder, an event is observed at 195°C, which is in line with TGA data for oxygen degradation. The acyl-GO shows the same event but at a lower peak temperature of 180°C. The peak intensity of acyl-GO is greater due to the presence of organic chlorides and residual DMF as also observed in TGA measurements. The amide-GO observes a peak at 183°C. Amide-GOPP shows two thermal event peaks, one at 120°C which is attributed to a phase change from γ- to α-phase crystallites in the polymer, with increasing temperature 46 and another at 193°C which can be designated to the decomposition of the more stable retained oxygen species.
The decomposition of diverse functional groups present on the surface of GO occurs at variable temperatures. 47 The GO is reduced during the functionalization process. This removal of some oxygen species on the surface may explain the lower decomposition temperatures of acyl-GO and amide-GO samples. The lower temperature of the main DSC peak for acyl-GO may be due to the predominance of particular functional groups possibly due to the removal of carboxylic oxygen. It has been noted that as the density of edge sites increases for graphitic materials, the thermal decomposition temperature decreases. 48 The procedure associated with the functionalization of graphene may have contributed to the fracturing of larger GO sheets (specifically the long sonication time), thus creating more edge sites and lowering the DSC event temperature for functionalized samples. With regard to the phase change at 120°C for the attached PA6 in amide-GOPP, this type of cold crystallization or crystal forming of polymers is a common occurrence in DSC and is prevalent as there is a significant amount of PA6 attached to the amide-GOPP surface. The lesser peak intensity for amide-GO compared with GO and acyl-GO may be due to the replacement of the –OH present on the carboxyl group with the desired amide. This would leave less oxygen content on the samples and result in a less pronounced peak.
The lower onset degradation temperature for polymer attached to graphene in amide-GOPP (340°C), when compared to that of polymer in PA6 and composites (411–420°C), is attributed to shorter polymer chains and a lower molecular weight of attached polymer. The amide-GO may terminate chain propagation, thus making polymer chains attached to the graphene shorter than in the bulk polymer. Acyl chloride is the most reactive species present (lowest boiling point) in the graphene samples, and this would account for the lower onset degradation of the material. Amide is the least reactive species (highest boiling point). The as-received GO has carboxylic acid groups present and has reactivity in between that of the acyl chloride and amide groups. This is affirmed in the above thermal analysis results as the acyl-GO has lower onset degradation, sees greater weight loss at lower temperatures and also has a lower event temperature in DSC. The theoretical melt enthalpy for 100% crystalline PA6 is 210 J g−1. The increasing melt enthalpy for composites compared to neat PA6 further advocates the nucleation of additional crystallites after the inclusion of amide-GO. 49 The degree of crystallinity increases with increasing amide-GO content.
Figure 10 shows the change in Young’s modulus and yield strength in composites for increasing weight percentage of amide-GO. The tensile results show a linear improvement in both yield strength and modulus of elasticity for composites reinforced with 0.1 wt% up to 0.75 wt% amide-GO. However, this levels at 1 wt% and becomes reduced in 2 wt% samples, perhaps, due to the graphene inhibiting the polymer chain forming process and therefore disrupting the mechanical properties of the composites. However, the more likely explanation is that higher loading implies GO agglomeration and thus the creation of defects within the polymer matrix, weakening it. The elongation at break for all composites is greatly reduced with no strain hardening occurring after the initial yield point has been reached. The maximum improvement in stiffness for composites compared to control PA6 is approximately 25% for PA6/amide-GO 1 wt%. The improvement in yield strength from 0.1 wt% loading to 0.75 wt% is approximately 30%. However, compared to the yield strength of PA6 (41.3 MPa) that of the strongest composite PA6/amide-GO 0.75 wt% is reduced by 5% (39.2 MPa).
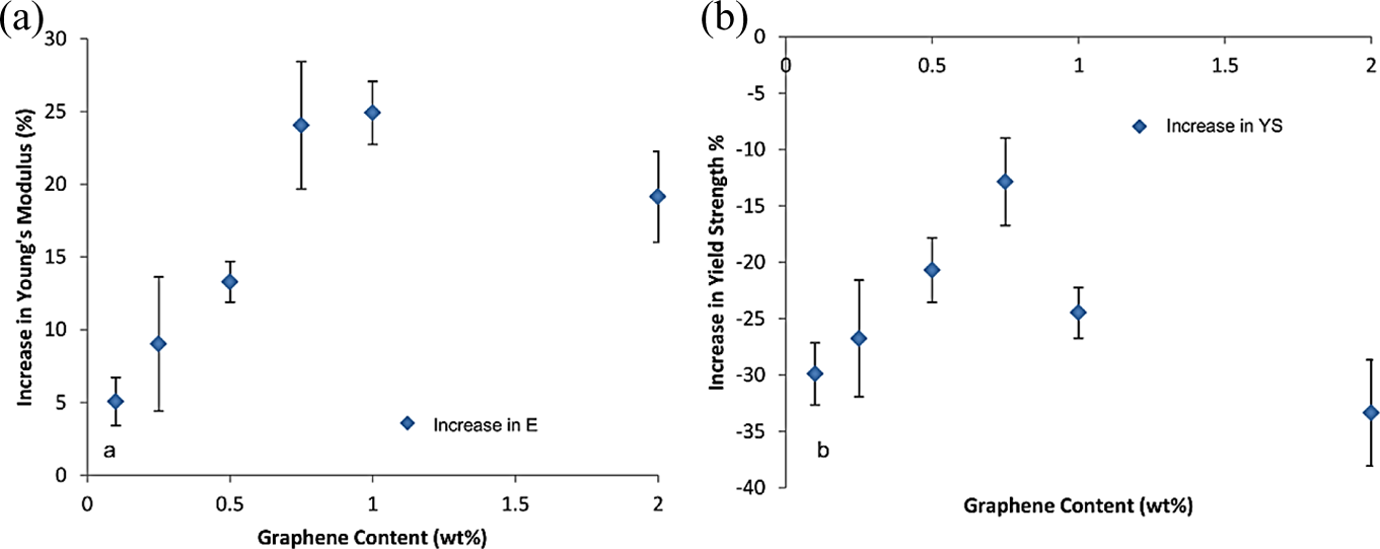
Showing (a) percentage increase in modulus of elasticity with increasing weight percentage of amide-GO in composites. (b) percentage increase in yield strength with increasing weight percentage of amide-GO in composites. GO: graphene oxide.
The average tensile strength for PA6 is within the range previously reported. 50 The increase in mechanical performance would indicate that the caprolactam is an excellent solvent for GO sheets functionalized with amide and allows for good dispersion of the nanoparticle throughout the polymer matrix. PA6 observes strain hardening after initial yield. In composites, the initial yield is also the point of break and thus the ultimate tensile strength, possibly because the amide-GO is cross-linked in the PA6 matrix, thus preventing the chains from sliding. The incorporation of amide-GO into the polymer matrix has clearly had a positive effect on the stiffness of the material; however, the same cannot be said for strength. Both properties are influenced by weight percentage loading. It has previously been reported that an increase in α-phase crystallites can increase the stiffness of PA6. 51 If GO inclusion promotes the nucleation of α phase, then this may contribute to the increased stiffness of composites. The strain at break for composites decreases with increasing amide-GO weight percentage due to constrained chain mobility from 426% for control PA6 to 6.8% for amide-GO 0.1 wt% and then to 5.4% for amide-GO 2 wt%. Increases in strength and stiffness with a decrease in ductility are commonly observed in nanocomposites.
Conclusion
The functionalization of GO has proved to be successful with the addition of an amide group to the surface of GO, first by a change in the carboxyl edge groups of graphene to acyl chloride, and second by the replacement of the acyl chloride with the amide functionality. The covalent attachment of the functionalized GO to PA6 is attested. The chemical engineering process has caused a slight reduction of the GO and has had no negative impact on the structure and properties of the nanoparticle. The attachment of PA6 to the surface of functionalized GO is confirmed along with the expected reduction of GO during polymerization. Noted improvements are observed in the mechanical properties for composites containing functionalized GO. Stiffness is improved; however, overall yield strength is decreased. This work reports an approach to the chemical engineering of GO to include an amide group in order to make thermally stable multifunctional nanocomposites. The chemical process employed has attained good interfacial interaction with the host polymer matrix. Although the amide provides a means for good interaction with the polymer, when compared to the previous studies, the existing carboxyl present on the surface of GO may be sufficient without the need for additional functionalization. Carboxyl and amide groups are necessary for interfacial interaction and dispersion. The purity of the GO used plays a large part in the property improvements for nanocomposites, and thus, it may be best to functionalize pristine graphene with these groups, rather than using GO which has a range of diverse functional groups present which deteriorate the mechanical properties in the first instance.
Footnotes
Acknowledgements
The authors would like to thank the department of employment and learning for funding the research. They would also like to thank Dr Jeremy Hamilton of NIBEC, University of Ulster for the acquisition of transmission electron microscopy images.
Declaration of conflicting interests
The author(s) declared no potential conflicts of interest with respect to the research, authorship and/or publication of this article.
Funding
The author(s) received no financial support for the research, authorship and/or publication of this article.