
Abstract
This experimental work is aimed at studying the effect of fiber surface modification including alkaline, acetic acid, and benzyl chloride on the long-term water absorption and thickness swelling (TS) of wood flour (WF)-reinforced polypropylene composites. The samples were made by melt compounding and then injection molding. Hygroscopic rates of the samples were evaluated by immersing them in water at room temperature and monitoring moisture sorption and thickness changes for several weeks. The results indicated that chemical modification has a significant effect on the water absorption of composites. The mechanism of water absorption of all samples followed the kinetics of a Fickian diffusion process. The composites modified with acetylation-treated fiber showed the lowest and the unmodified composites exhibited the highest water absorption coefficient. TS of the composites was clearly dependent upon the WF chemical modification. The swelling rate parameter of treated samples is less than those of untreated ones.
Keywords
Introduction
The growing production of plastics worldwide is a concern as they rely on fossil fuels that are an increasingly limited resource. As conventional petrochemical-based plastics accumulate in the environment and their resources are limited, there has been an increasing need to find alternative biodegradable materials from renewable resources. 1 In the recent years, there has been a dramatic increase in the use of natural fibers for making new types of environmentally friendly composites. Natural fiber–reinforced thermoplastic composites are the combination of cellulosic fibers and a thermoplastic such as polyethylene, polypropylene (PP), polyvinyl chloride, and polystyrene. The primary advantages of using natural fibers are renewability, low density, low cost, recyclability, and biodegradability. However, major problems associated with using natural fibers in composites are lower processing temperature and incompatibility between the hydrophilic natural fibers. 2,3 This problem can be alleviated by incorporation of coupling agent into the compound and modification of the fibers. 3
Chemical modification of natural fibers is employed to improve the properties of the composites and to promote better adhesion between the natural reinforcement and the polymeric matrix. Different surface treatment methods such as mercerization, isocyanate treatment, acrylation, benzoylation, permanganate treatment, acetylation, silane treatment, and peroxide treatment have been applied on the fiber. 4,5
Water absorption and the consequent thickness swelling (TS) are the most important physical characteristics of wood–plastic composites exposed to environmental conditions and thus affecting their end-use applications. Water absorption can deteriorate both mechanical properties and dimensional stability in such composites. Therefore, hygroscopic characteristics have to be taken into account as limiting parameters in the design with regard to their final applications. 6 –12
Although there has been considerable research conducted to examine the effect of chemical modification of fiber on the characteristics of plastic composites, 13 –20 there is no enough information regarding the influence of chemical fiber’s surface treatment on the long-term hygroscopic behavior of natural fiber plastic composites is available. The present article is a comprehensive investigation on the effect of chemical modification of wood flour (WF) on the long-term water absorption and TS behavior of composite-based PP.
Experimental
Materials
PP, with trade name of V 30 S, an injection molding grade was supplied by Arak Petrochemical Co. (Iran). Some important physical and mechanical properties of the used polymer are presented in Table 1. WF, which was used as the reinforcing material, was obtained from Cellulose Aria Co (Iran); the average size of WF particles was about 425 µm. Maleic anhydride-grafted PP (PP-g-MA) was provided by Solvay with trade name of Priex 20070 (melt flow index = 64 g/10 min, grafted maleic anhydride = 1 wt%) was used as coupling agent.
Physical and mechanical properties of used PP. PP: polypropylene.
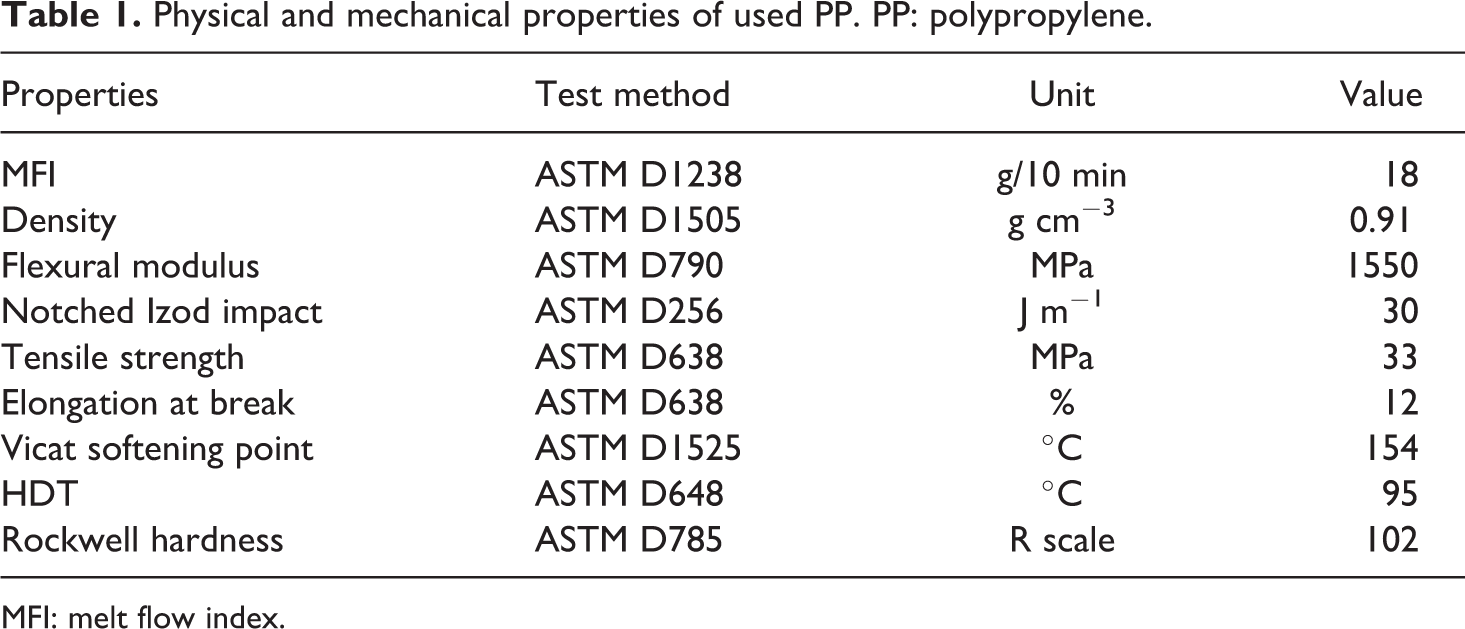
MFI: melt flow index.
Method
Chemical modification
Mercerization
The wood fibers were soaked in 5 wt% sodium hydroxide (NaOH) solution at ambient temperature, maintaining a solution:fiber ratio of 20:1 (by weight). The fibers were immersed in the solution for 30 min. After treatment, fibers were copiously washed with distilled water to remove any traces of alkali on the fiber surface and subsequently neutralized with 1 wt% acetic acid solution. The treated fibers were then dried in an oven at 80°C for 24 h.
Acetylation
The wood fibers pretreated with NaOH solution were soaked in 55% solution of glacial acetic acid for 1 h at 30°C; it was decanted and soaked in acetic anhydride containing one drop of concentrated sulfuric acid for 5 min. Then the fibers were placed in a preheated oven at 120°C for 5 h with the aim of encouraging esterification. Lastly, treated fibers were thoroughly washed with distilled water to remove residual chemicals until a pH of 7 was obtained, and then dried in an oven at 80°C for 48 h.
Benzoylation
The wood fibers pretreated with NaOH solution were suspended in 10 wt% NaOH solution and mixed well with 3 wt% (weight percent compared to the fiber) benzyl chloride for 30 min. Excess amount of distilled water was used to wash out NaOH solution, and the benzylated fibers were immersed in ethanol solution for 1 h to remove unreacted benzyl chloride. Finally, the fibers were washed out with distilled water and dried in an oven at 80°C for 24 h.
Composite preparation
PP, WF, and coupling agent were weighed and bagged according to Table 2. The materials were melt blended at 180°C for 8 min at 60 r min−1 using a Haake internal mixer (SYS 9000; Dearborn, Michigan, USA). The compounded materials were ground using a pilot scale grinder (Wieser, WGLS 200/200 Model, Massachusetts, USA). The resulting granules were dried at 105°C for 4 h. Test specimens were injection molded (Imen Machine Co, Iran) at 190°C to produce standard ASTM specimens. Molding conditions were as follows: press temperature 190°C and pressure during heating 10 MPa. The specimens were stored under controlled conditions (50% relative humidity and 23°C) for at least 40 h prior to testing.
Compositions of the studied formulations.
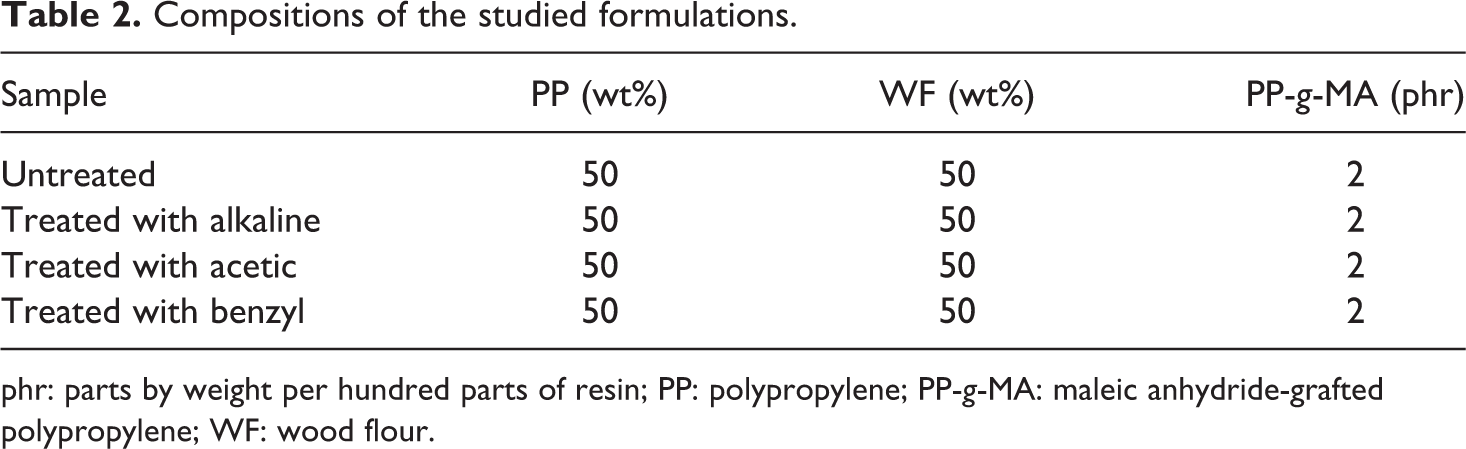
phr: parts by weight per hundred parts of resin; PP: polypropylene; PP-g-MA: maleic anhydride-grafted polypropylene; WF: wood flour.
Characterization
Water absorption and TS tests
Specimens with a dimension of 20 × 20 × 20 mm3 were cut for the water uptake test in accordance with ASTM D 7031 standard. Five specimens of each sample were dried in an oven for 24 h at 102 ± 3°C. The weight and thickness of dried specimens was measured to a precision of 0.001 g and 0.001 mm, respectively. Then they were placed in distilled water and kept at room temperature for 1008 h. At predetermined time intervals, the specimens were removed from the water and the surface water was wiped off using blotting paper and their wet mass values and thickness were measured. The values of water absorption and TS were calculated using equations. (1) and (2), respectively

where, mo and mt denote the oven-dry weight and the weight after time t, respectively.
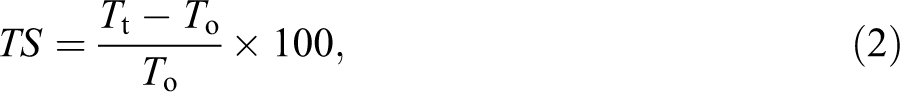
where, To and Tt denote the oven-dry thickness and thickness after time t, respectively.
Fourier transform infrared tests
Fourier transform infrared (FTIR) spectroscopy measurements were performed using a Digilab FTIR spectrometer (model SP-1100; Marlborough, Massachusetts, USA) equipped with a deuterated triglycine sulfate detector. The potassium bromide (KBr) pellet technique was applied for monitoring changes in the range of 400–4000 cm−1 with a resolution of 4 cm−1. Approximately 2 mg of the powdered components was mixed with 150 mg KBr and pressed into pellets and used for further characterization. Vibration transition frequencies were reported in wave number (cm−1). A total of five scans were taken for each sample.
Result and discussion
Figure 1(a) shows FTIR spectra of the untreated WF. The strong peak at 3444.2 cm−1 is characteristic of the hydrogen-bonded hydroxyl group (OH) stretching vibration. The peak at 3008.4 cm−1 was considered due to C–H stretching vibration of all hydrocarbon constituents of the fibers and the shoulder band observed at 1741.4 cm−1 due to the absorption of carbonyl (C=O) stretching of hemicellulose present in the fibers. The peak at 1658.5 cm−1 was because CH is related to bound water and the peak at 1511.9 cm−1 was considered due to the benzene ring. The peak appearing at 1461.8 cm−1 was due to CH2 bending in lignin and the peak at 1322 cm−1 was due to O–H in plane bending. The band at 1249.6 cm−1 was considered due to C–O stretching of acetyl in lignin. A small sharp band at 892 cm−1 appears to have arisen from β-glucosidic linkages between the sugar units in hemicellulose and cellulose. 21,22
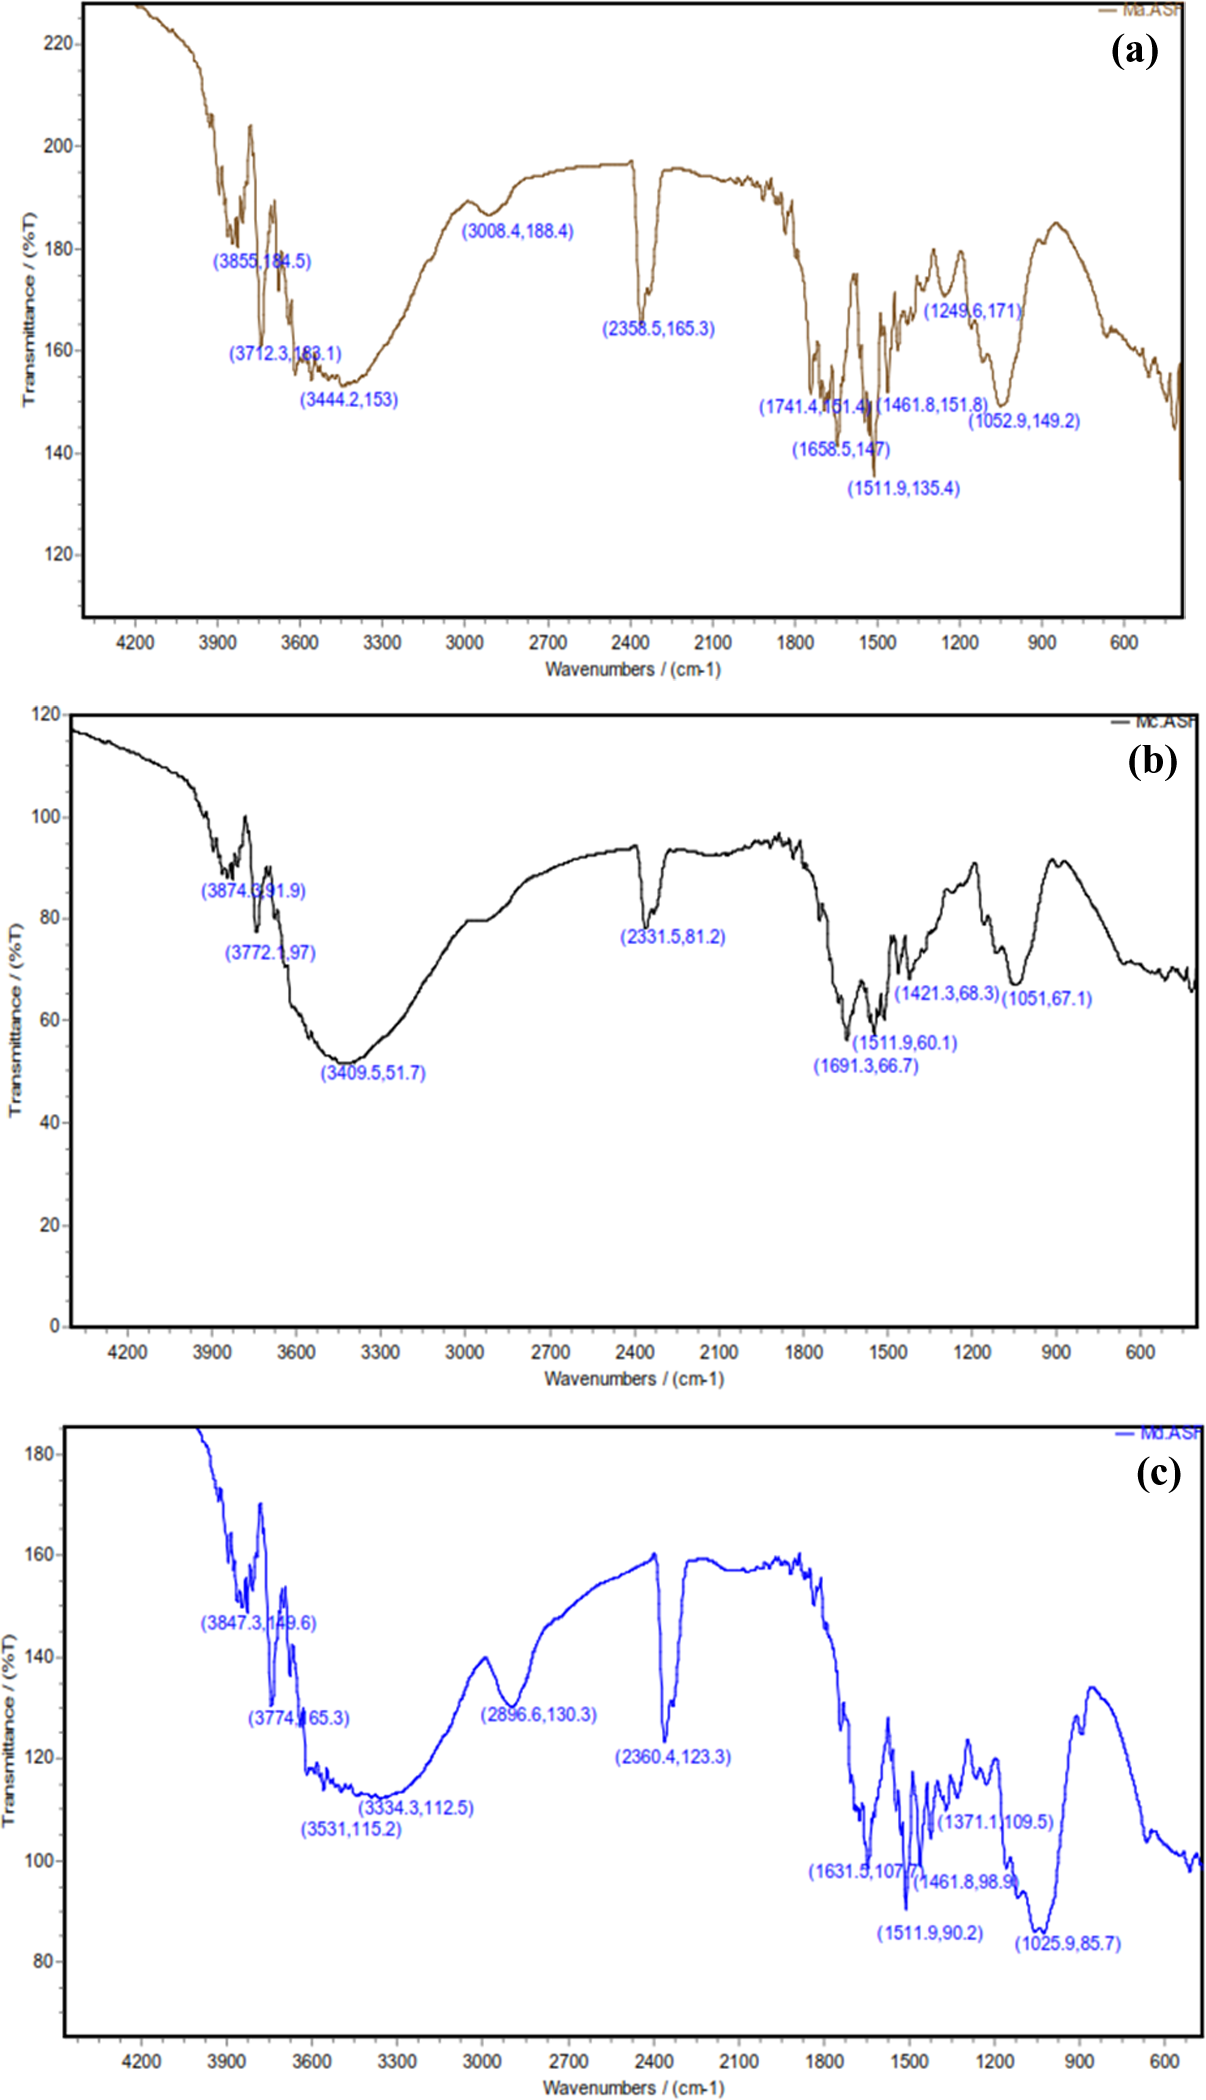
FTIR spectra of the chemical-treated WFs: (a) untreated, (b) mercerization, (c) acetylation, and (d) benzoylation. FTIR: Fourier transform infrared; WF: wood flour.
FTIR spectra of alkali treatment in Figure 1(b) show that the peak at 1741.4 cm−1 was disappeared; this appears to be due to the removal of noncelluloses including fats, wax, and pectin and hemicellulose present in the fibers. 15,22 Also, as can be seen in Figure 1(b) the O–H bond at 3444.2 cm−1 is affected by alkali treatment and its intensity is decreased. The main reason for this behavior is that by alkali treatment an amorphous region is developed in cellulose by removal of OH groups from its network. 15,22 Figure 1(c) shows that the acetylation of fibers with acetic anhydride led to the appearance of a new peak at 1631.5 cm−1 attributed to the C–O stretching of the ester carboxyl group. The lowering in intensity of the OH stretching band at 3334.3 cm−1 in the spectra also provided further evidence of successful acetylation. 22 Figure 1(d) shows FTIR spectra of benzoylation of fibers. The intensity of the bond at 1744.1 cm−1 is decreased due to formation of ester bonds from the reaction between O–H groups and benzyl chloride (Figure 1(d)), while the OH band at 3444.2 cm−1 intensity tends to decrease due to its consumption in this reaction. 15,22
Long-term water absorption
Figure 2 depicts the percentages of the water uptake for the PP/WF composites at different periods of immersion, which vary depending upon the chemical fiber surface modification. As it is clearly seen, generally water absorption increased with immersion time, reaching a certain value at saturation point, beyond which no more water was absorbed and the water content of composites remained constant. The time to reach the saturation point was not the same for all formulations. Figure 2 also shows that those composites, which were treated with chemicals reagents, absorbed less water compared to the untreated samples. The order of water absorption is as follows: untreated > mercerization > benzyolation > acetylation. Considering the fact that the WF fraction was constant in all composites (50% by weight), the different water absorption observed between various composites can be attributed to the chemical modification of fiber.
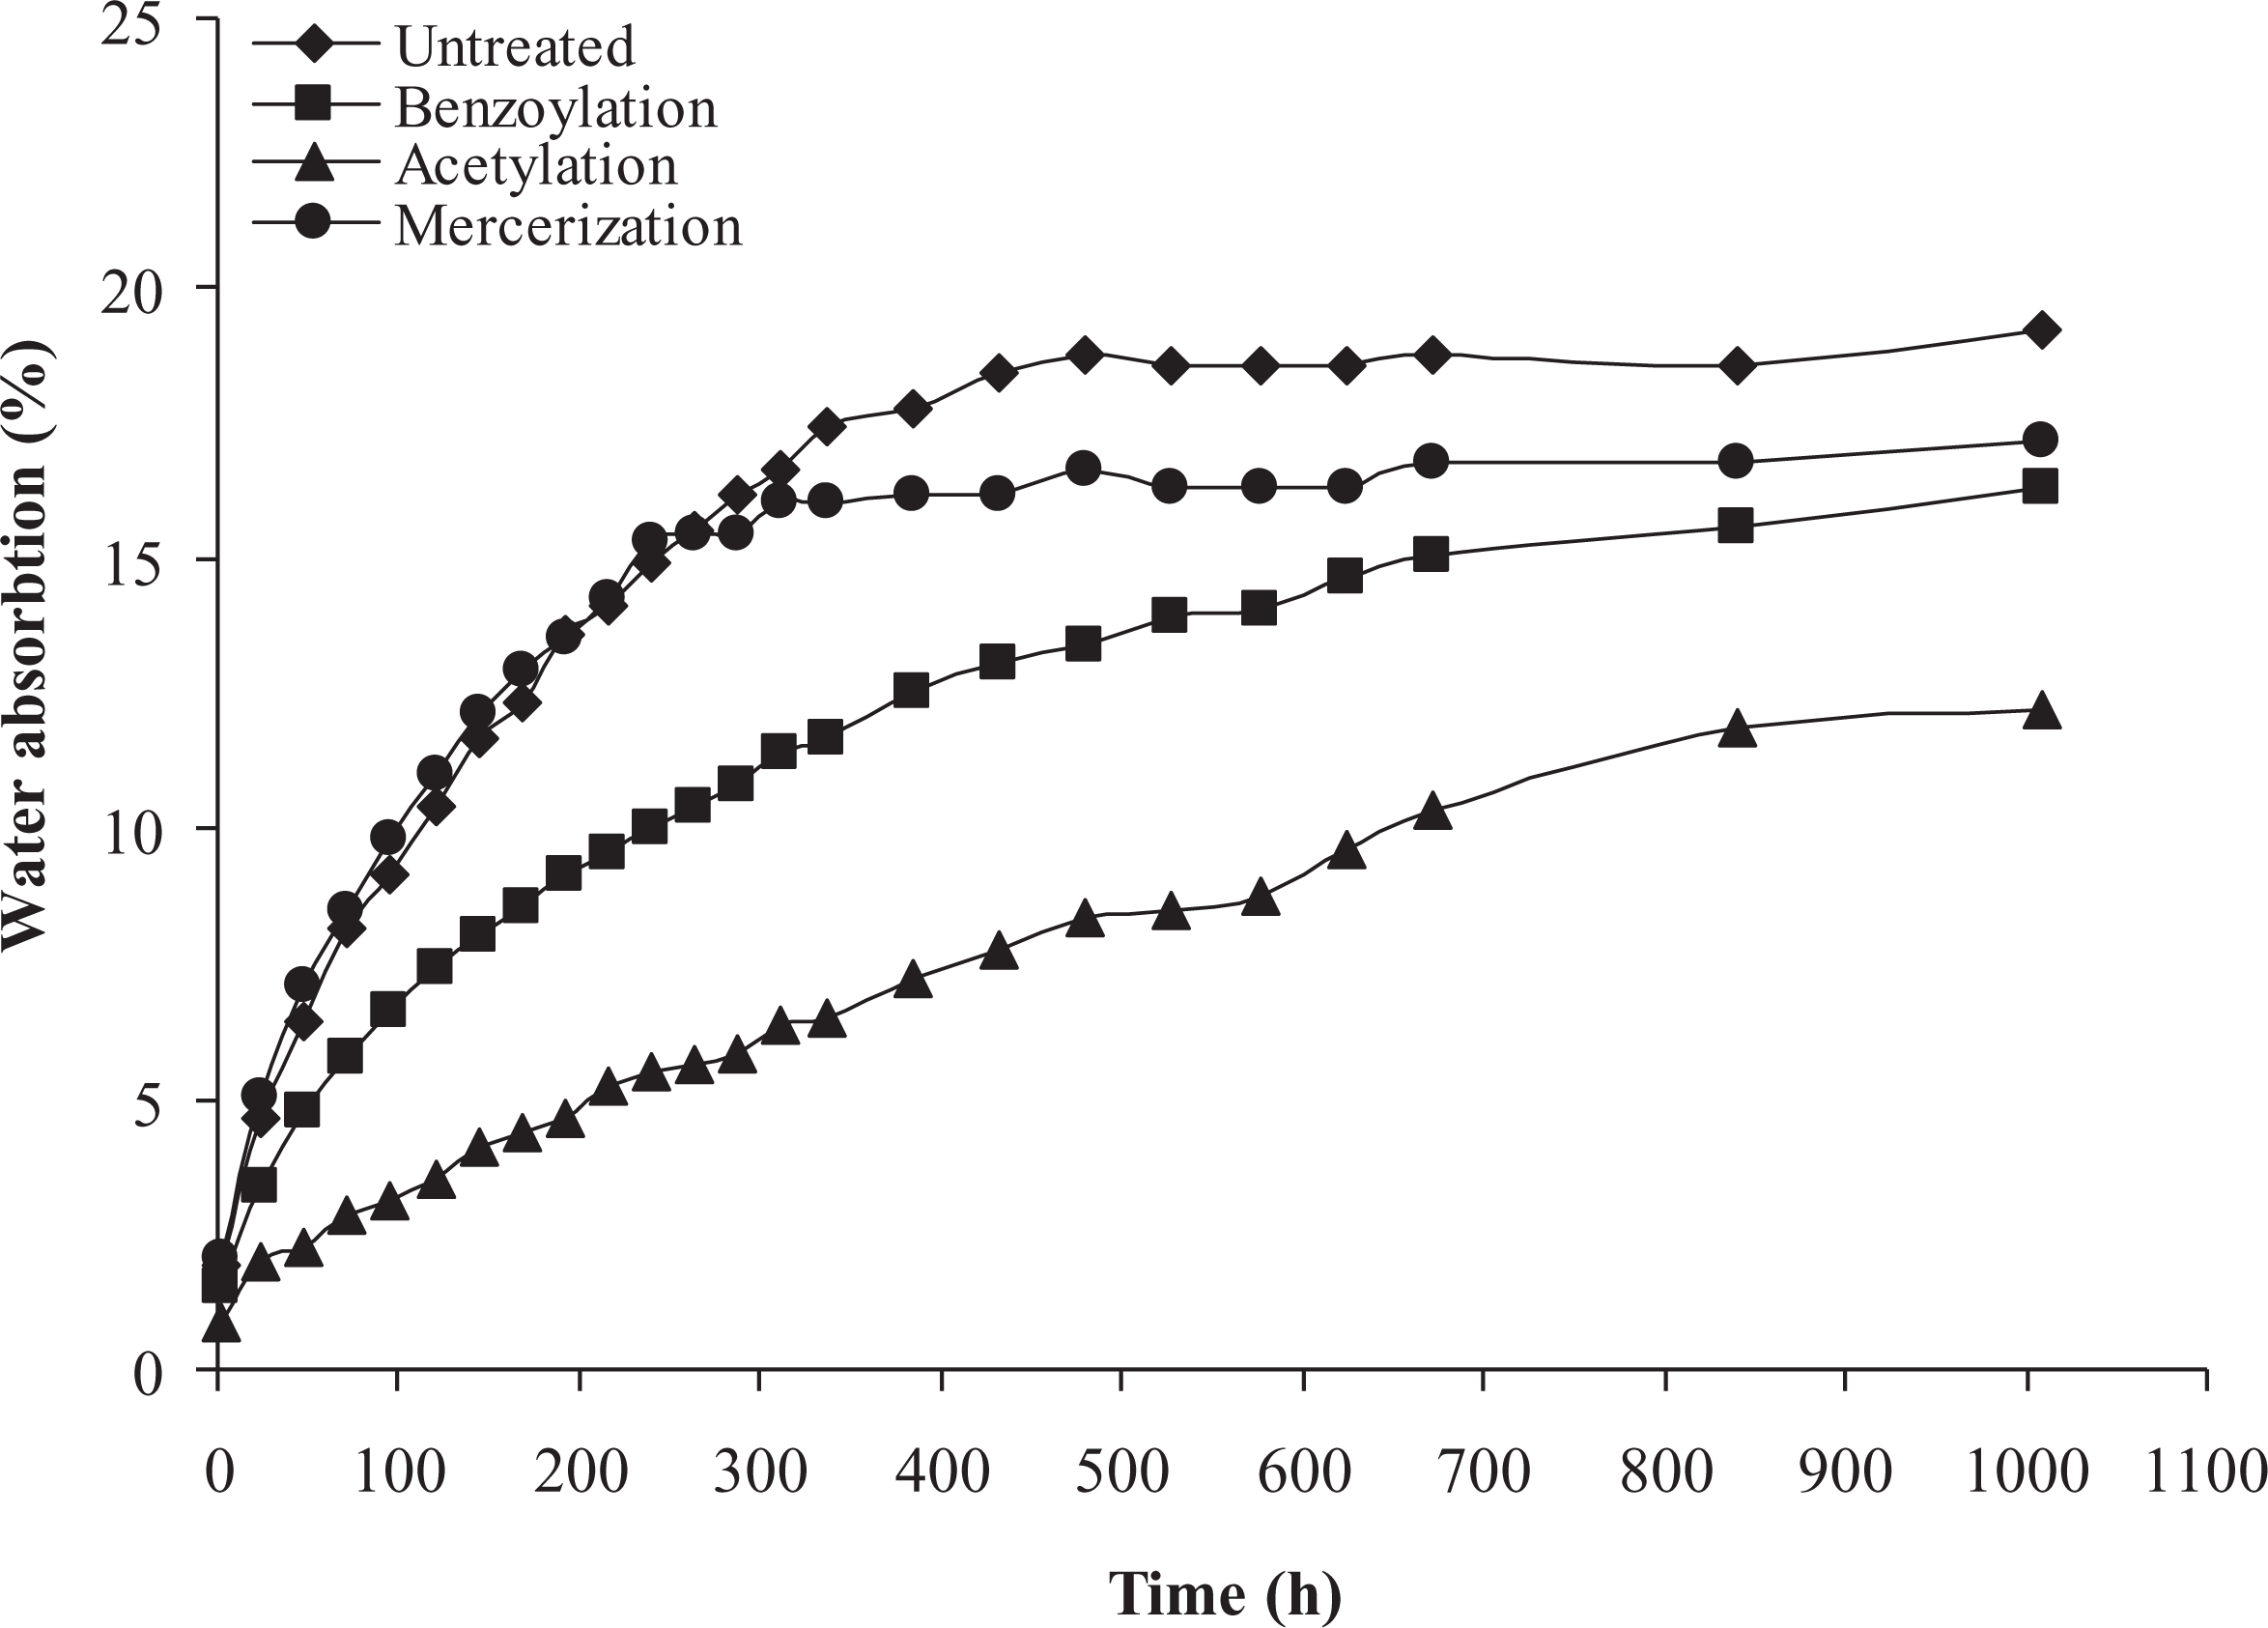
Long-term water absorption of untreated and treated PP/WF composites. PP: polypropylene; WF: wood flour.
Water diffusion behavior in the polymer matrix composites can be Fickian diffusion, relaxation controlled, and non-Fickian or anomalous. 8 These three cases can be distinguished theoretically by the shape of the sorption curve represented by equation (3).
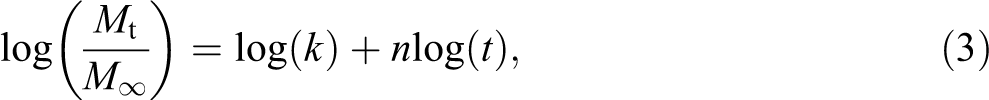
where, Mt is the moisture content at specific time (t) and M∞ is the moisture content at the saturation point. In equation (3), n and k give an idea about the mechanism of diffusion that take place inside the composite. The value of coefficient shows different behavior between the three cases of diffusion: Fickian diffusion (n = 0.5), relaxation (n ≥ 1), and anomalous transport (0.5 < n < 1). The coefficients (n and k) are calculated from slope and intercept of the log plot of Mt/M∞ versus time, which can be drawn from experimental data. An example of the fitting of the experimental data for different chemical treatments is given in Figure 3.
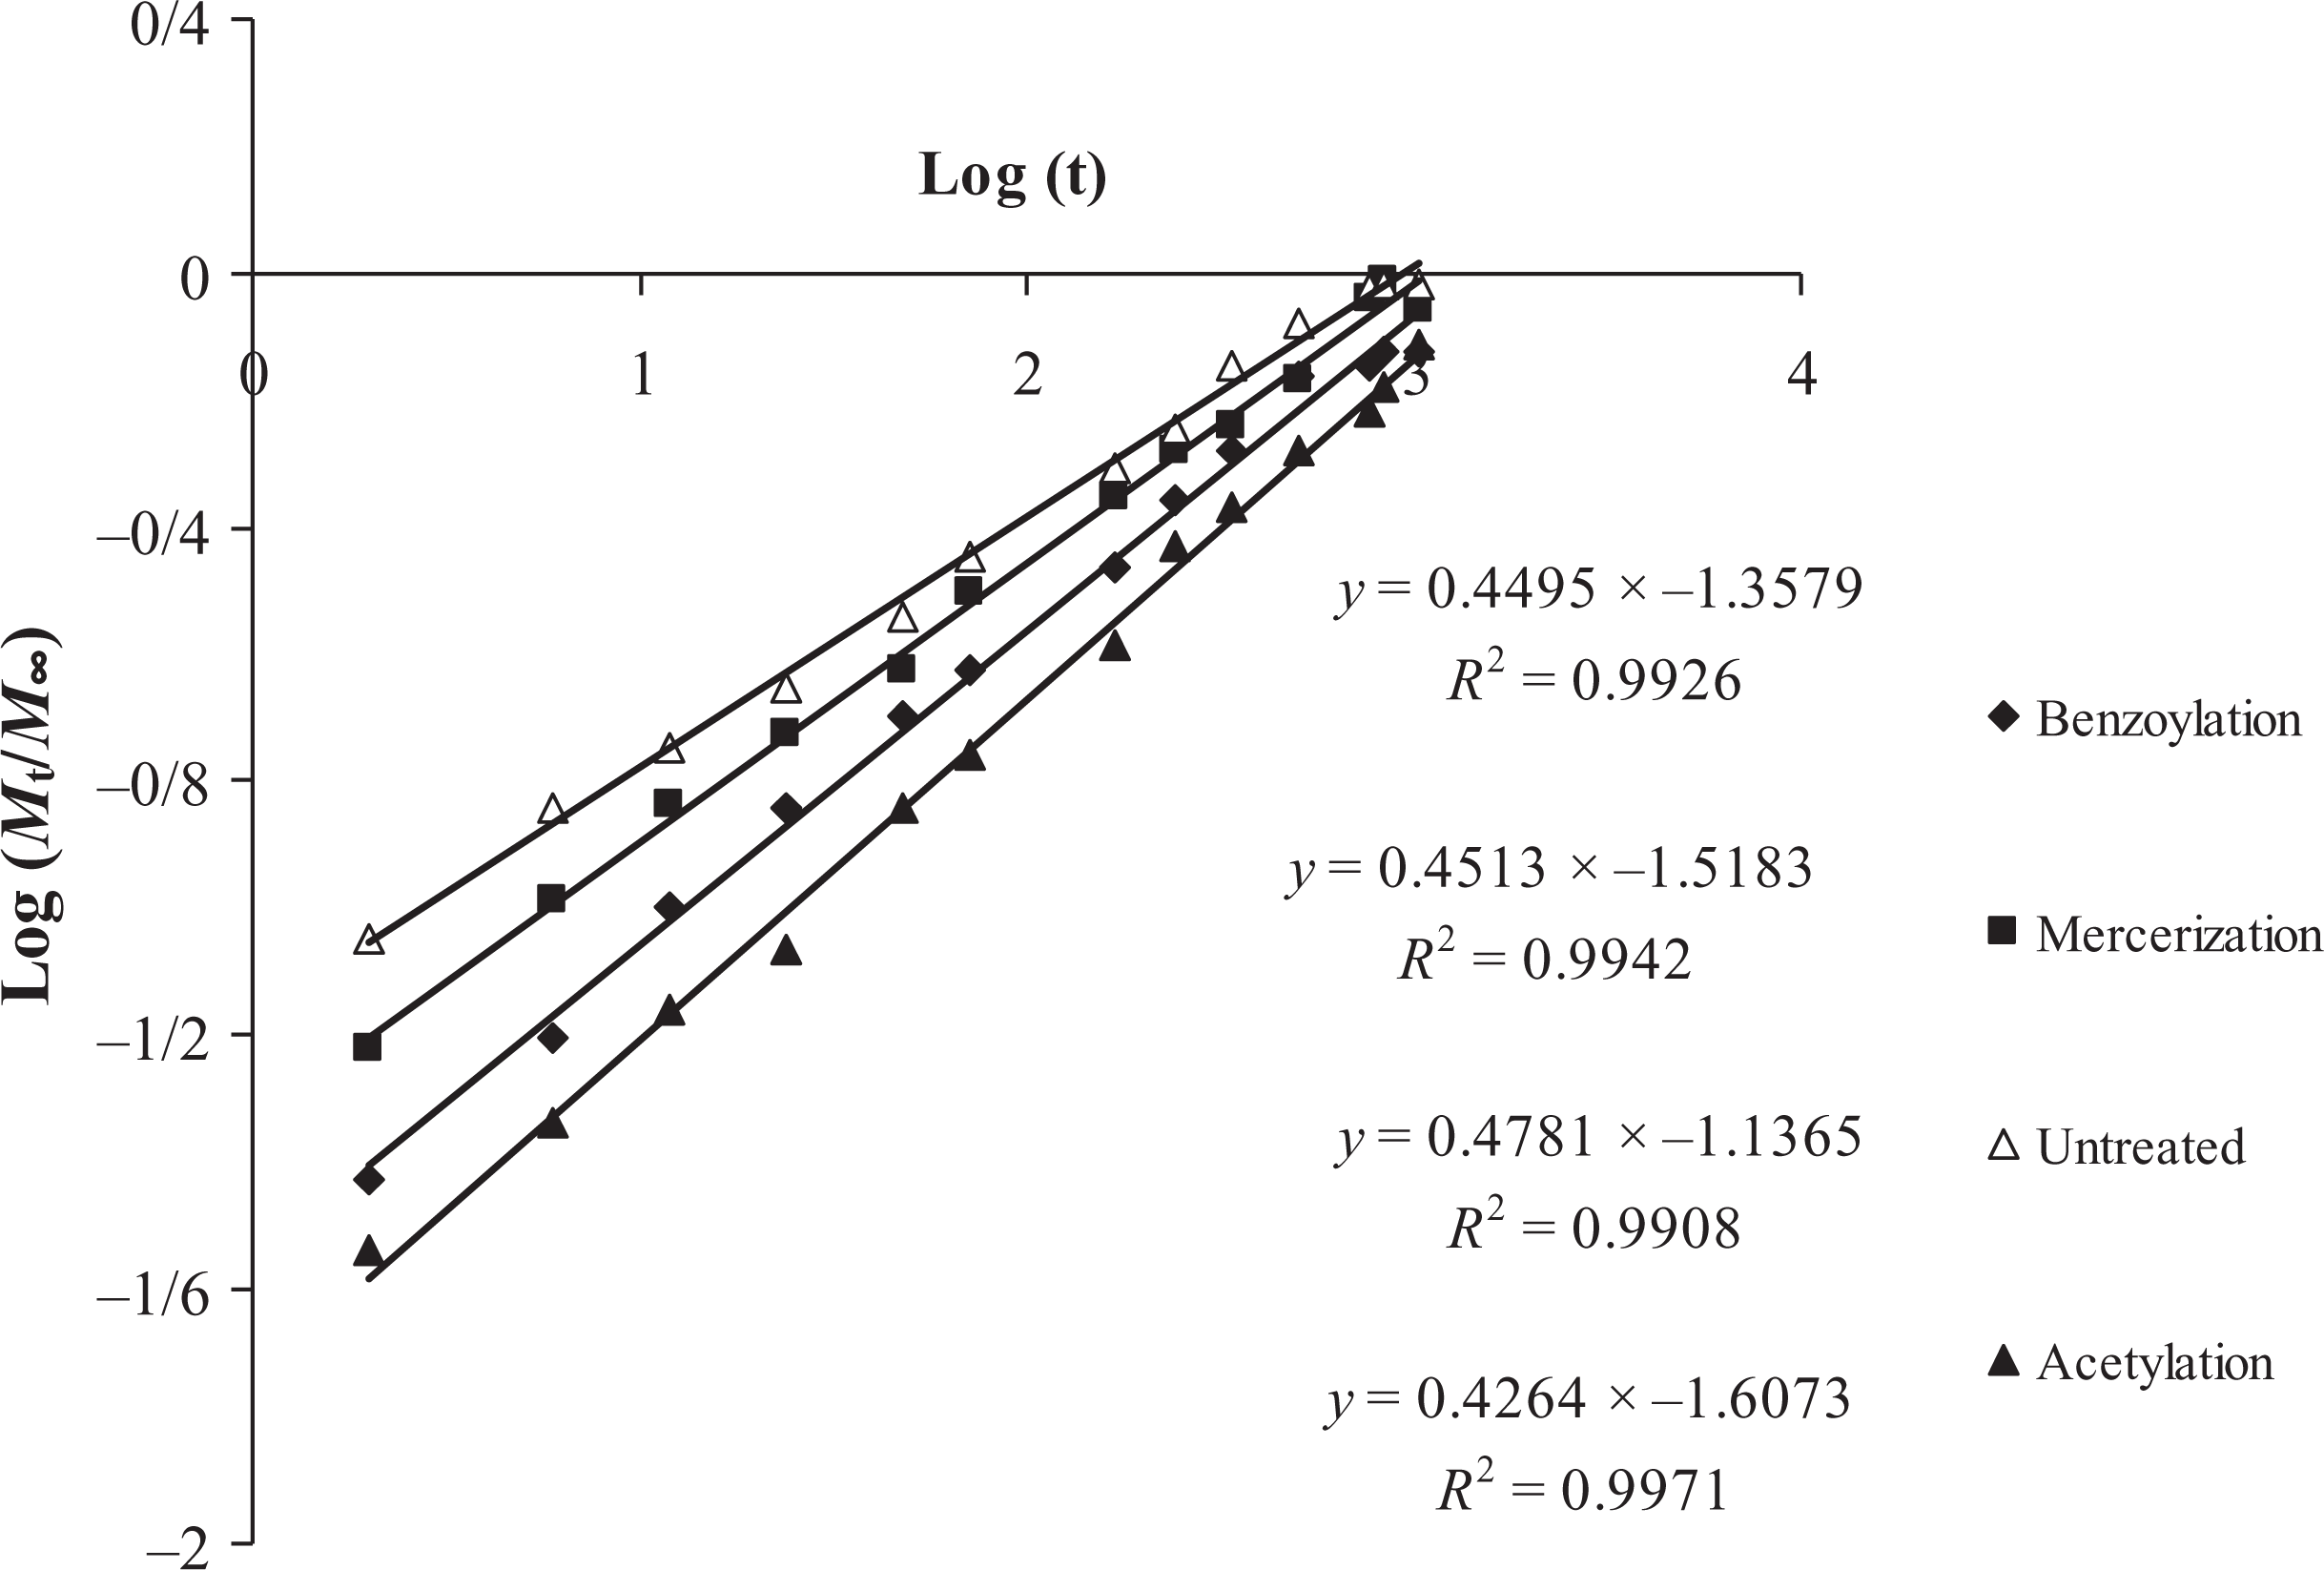
Diffusion case fitting for untreated and treated samples.
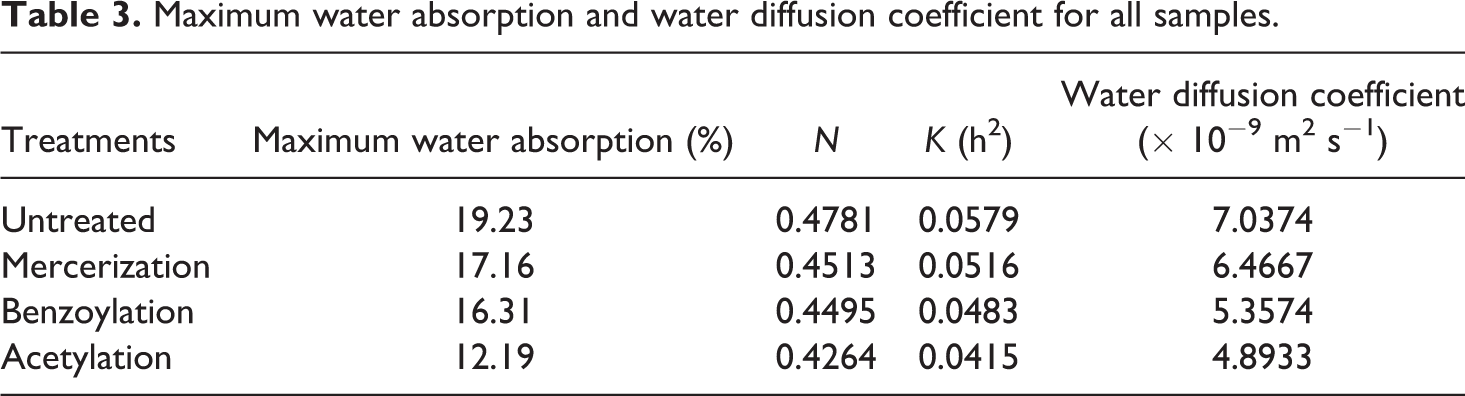
Table 3 shows diffusion parameters for all formulations. The values of n show the absorption of water in treated and untreated samples approaches toward the Fickian diffusion. The water diffusion coefficient is the most important parameter of Fick’s model and shows the ability of water molecules to penetrate inside the composite structures. At early stages and small times (typically Mt/M∞ ≤ 0.5), the diffusion process is presented as follows 8 :
Maximum water absorption and water diffusion coefficient for all samples.
where, L is the thickness of the specimen and D is the diffusion coefficient.
Table 3 shows that water diffusion coefficient of treated samples is less than that of untreated ones. This can be attributed to the fact that the chemical modification promoted good wettability and better matrix and fiber interface adhesion, allowing the moisture diffusion processes to be much slower because there are fewer gaps in the interfacial region. 14 –20 As a result, it is important to apply chemical modification to reduce the gaps and block the hydrophilic groups by improving the quality of adhesion at interfacial region. 23 –25
Long-term TS
The effect of chemical modification of WF on the TS behavior of PP/WF composites is presented in Figure 4. As can be seen, the TS of PP/WF composites reduced by applying chemical modification. Variations in TS of the composites are similar to variations in water absorption. The increase of the TS in the studied composites can be attributed to the same reasons as discussed concerning water absorption. The composite made with acetylation-treated and untreated fiber had the minimum (4.56%) and maximum (8.63%) TS, respectively.
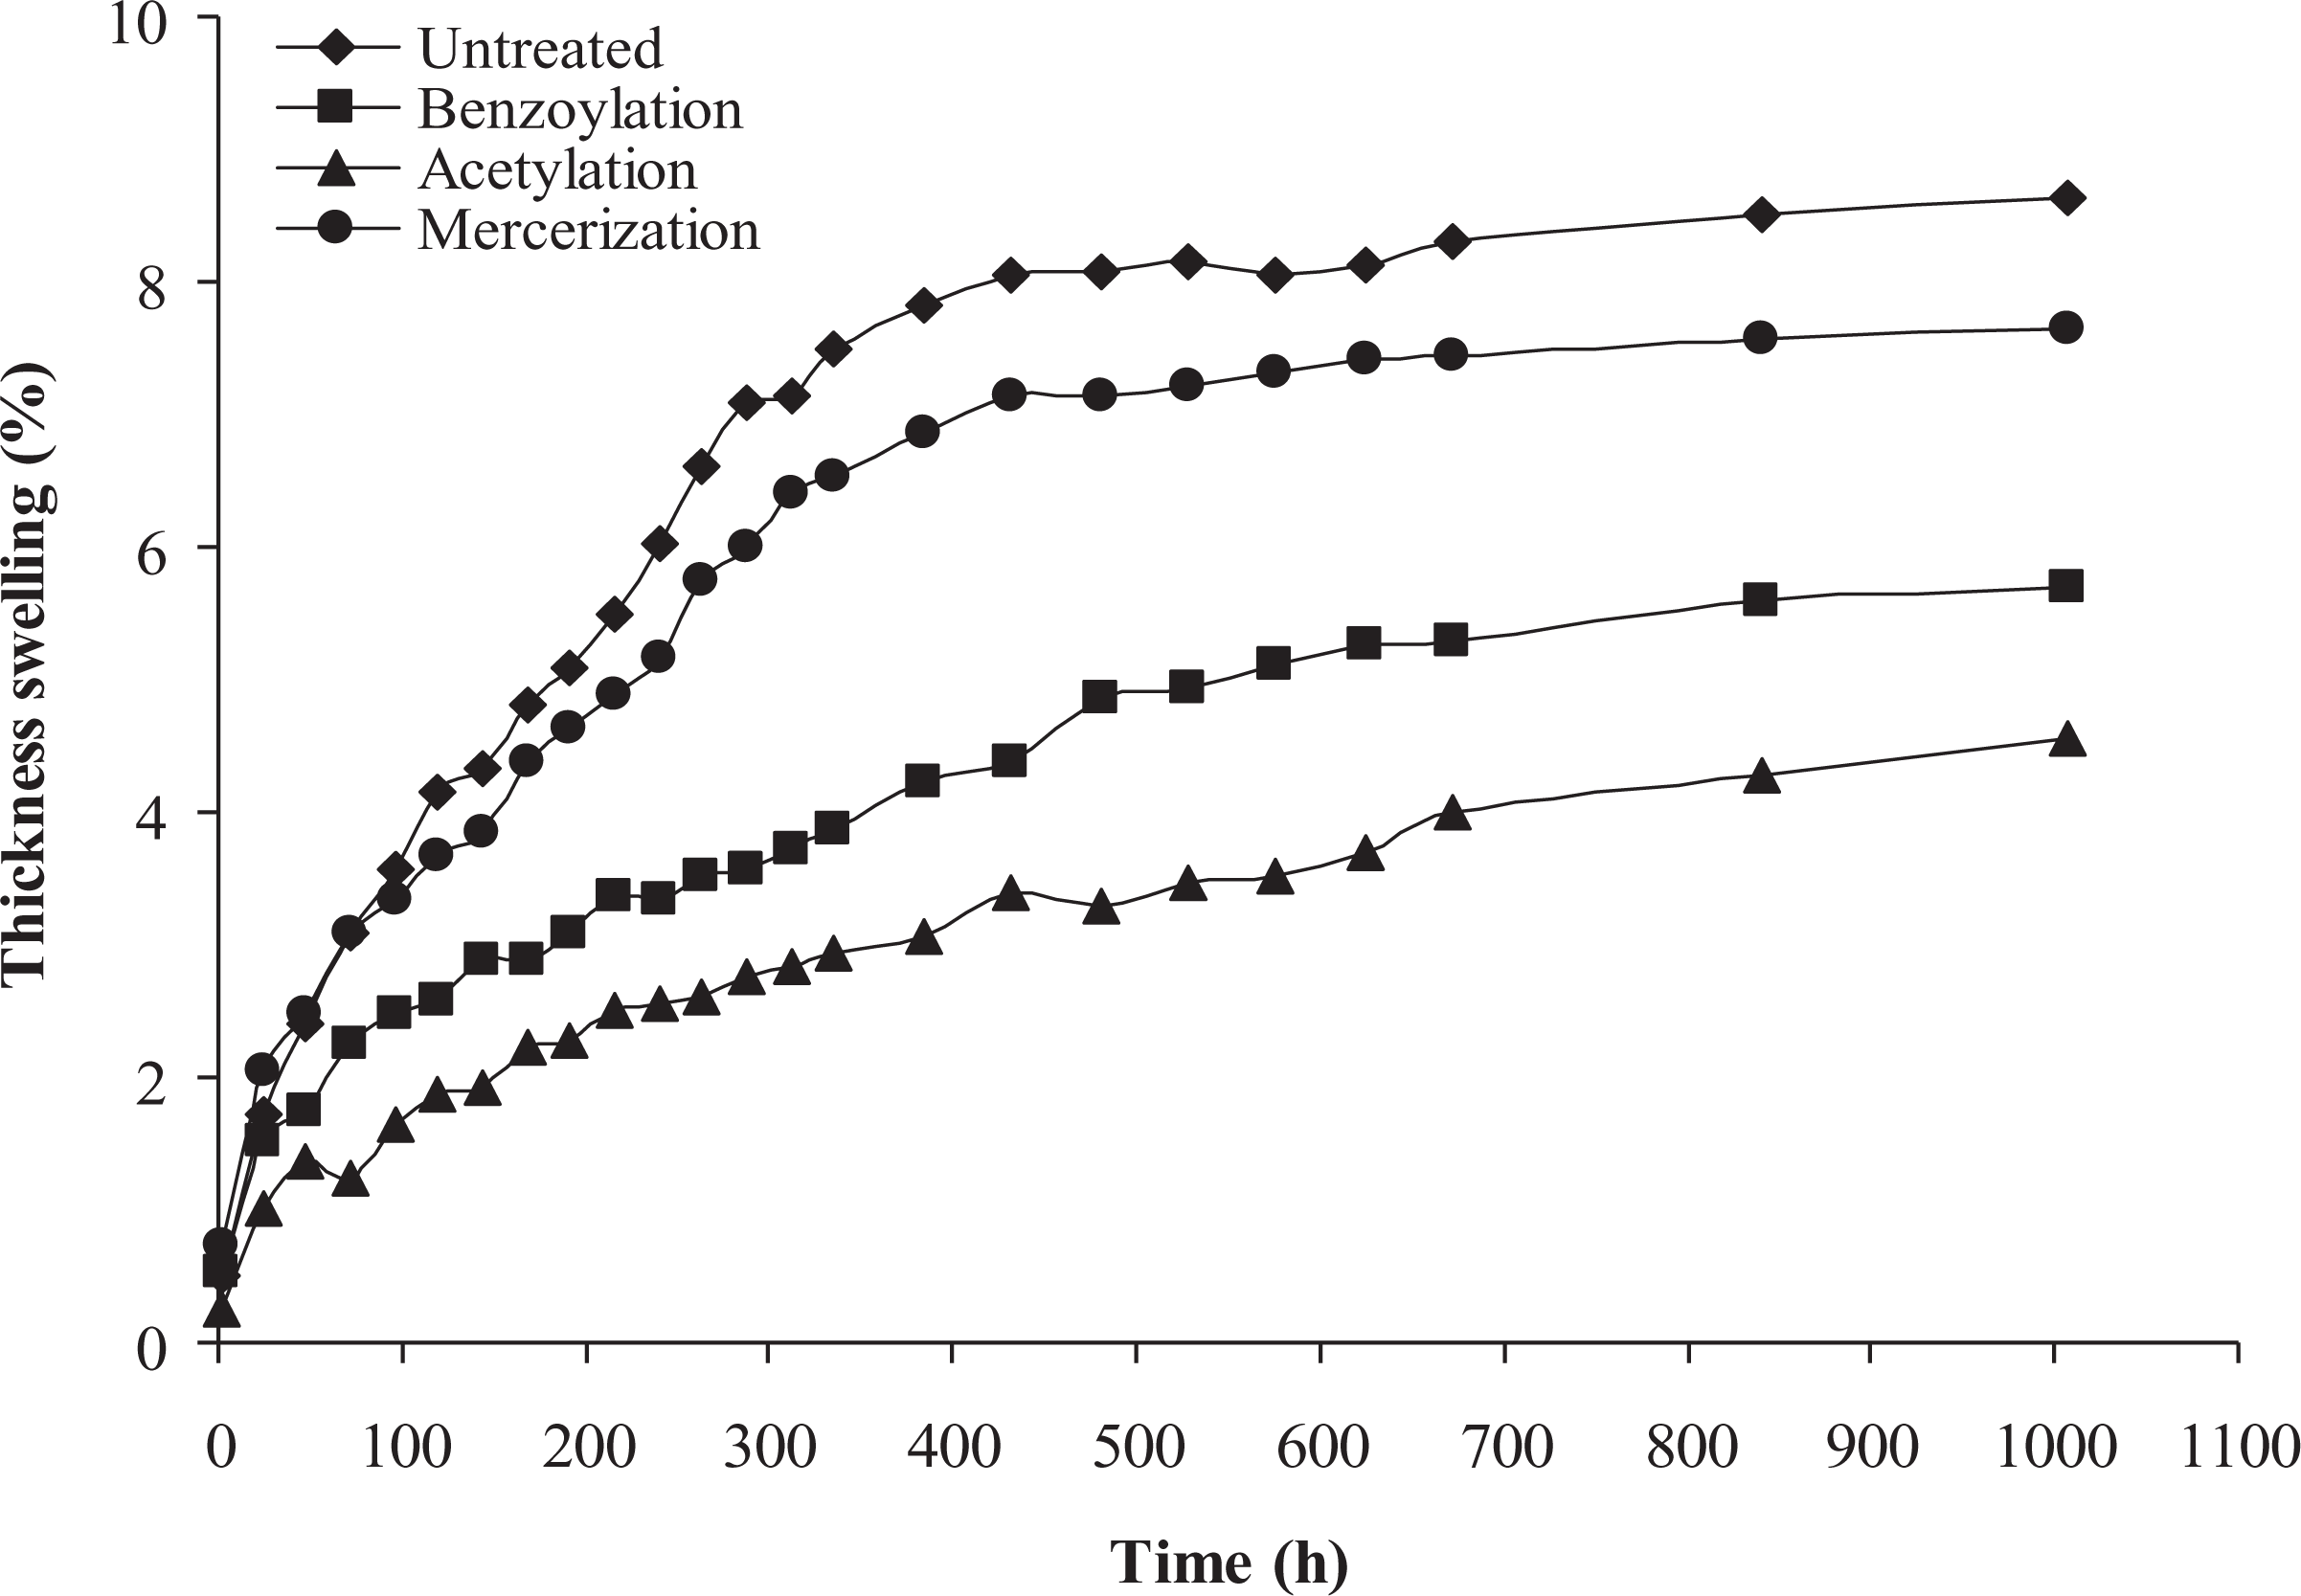
Thickness swelling of untreated and treated PP/WF composites. PP: polypropylene; WF: wood flour.
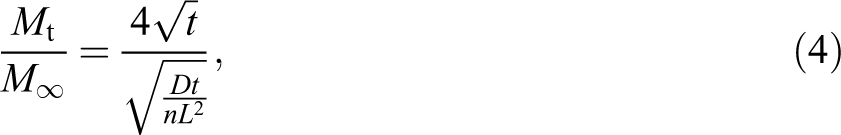
For more convenient comparisons, the TS rates of composites were quantified by the model described and developed by Shi and Gardner. 26 In this model, a swelling rate parameter (KSR), as determined using the test data, can be used to quantify the swelling rate. The swelling model is expressed by equation (5).

where, TS is the thickness swelling at time t, and To and Tmax are initial and equilibrium thickness, respectively. KSR is a constant referred to as the initial (or intrinsic) relative swelling rate.
The nonlinear curve fitting was used to find the constants that provide the best fit between equation (5) and the experimental data. This algorithm seeks the constants that minimize the sum of the squared differences between the observed and predicted values of the dependent variable, as seen in equation (6),
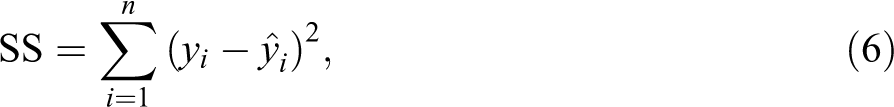
where, SS is the sum of squared difference and yi and
The KSR value of composites is given in Table 4. It can be seen that the untreated samples have higher KSR value than those of treated ones. It is important to note that in the swelling model, KSR was obtained considering the whole thickness process until it was equilibrated; that is, it is dependent not only on the initial rate of swell but also on the equilibrium TS of the composites. 26 For unmodified fiber composites with higher equilibrium TS, there is less time to reach the equilibrium thickness, as well. This can explain the very high KSR value determined in this case. The minimum KSR values were observed in composites made with acetylation-treated fibers.
Thickness swelling values and swelling rate parameters for untreated and treated samples.
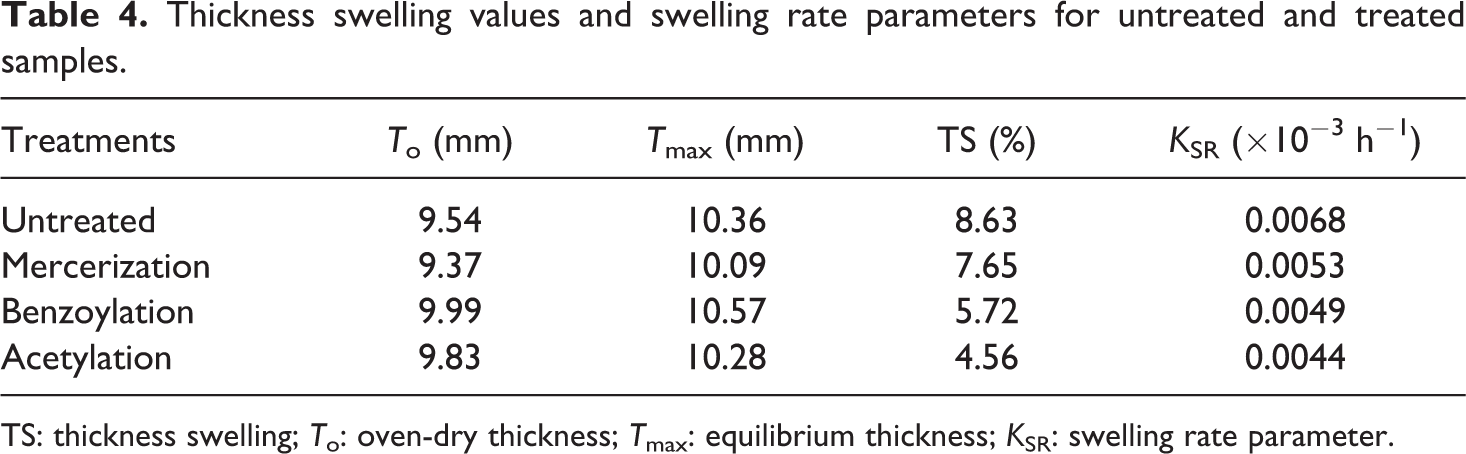
TS: thickness swelling; To: oven-dry thickness; Tmax: equilibrium thickness; KSR: swelling rate parameter.
Conclusions
In this study, the effect chemical modification of WF of the long-term hygroscopic behavior of WF/PP composites was investigated. The results showed that generally the chemical modification enhanced water resistance and dimensional stability in the studied formulations. This is mainly due to better interface quality and increased hydrophobicity in the modified composites. Water absorption of all the composites followed the kinetics of a Fickian diffusion process. Water diffusion coefficient was highest in acetylation-treated fiber composites and the lowest water diffusion coefficient was found in untreated ones. The highest TS KSR took place in the untreated composites. FTIR spectra of treated fibers show that the intensity of the bonds at 3400 and 1740 cm−1 change due to reaction of O–H groups and formation of ester groups in samples. This project has shown that the composites with treated fiber will be desirable as building materials due to their improved stability.
Footnotes
Declaration of Conflicting Interests
The author(s) declared no potential conflicts of interest with respect to the research, authorship, and/or publication of this article.
Funding
The author(s) received no financial support for the research, authorship, and/or publication of this article.