
Abstract
Three types of surfactants, specifically cationic, anionic, and nonionic, at different weight percentages were added into high-density polyethylene/low-density polyethylene/cellulose (HDPE/LDPE/cellulose) biocomposites via melt mixing. The cationic and anionic surfactants which are hexadecyltrimethylammonium bromide (HTAB) and sodium stearate (SS), respectively, were added from 4 to 20 wt%, whereas the nonionic surfactant which is sorbitan monostearate (SM) was added from 1 to 5 wt%. The mechanical testing results exhibited that the addition of HTAB increased tensile strength and tensile modulus, while SS deteriorated mechanical properties, while SM increased impact strength and tensile extension of the biocomposites. Based on the mechanical properties results, optimum weight percentages of HTAB and SM were 12 wt% and 4 wt%, respectively. The scanning electron microscopic micrographs displayed that the amount of cellulose fillers pullout decreased with the addition of HTAB, followed by SM, but it increased with SS. Fourier transform infrared spectra, X-ray diffractometer patterns, thermogravimetric analysis results, and differential scanning calorimetry thermograms have confirmed the presence of physical interactions only with the addition of HTAB and SM. Based on the results, compatibilizing effect was found in HTAB, whereas SM has not showed compatibilizing effect but instead plasticizing effect. However, neither compatibilizing nor plasticizing effect was exhibited by SS.
Introduction
Development of biocomposites has been done by many researchers as a way to reduce the utilization of petroleum-derived thermoplastic for making plastic products. This is due to environmental concern and threats of petroleum supply diminution in future times. Unlike conventional composites, the fillers used in biocomposites are from natural and renewable resources. Utilization of natural fillers that are abundantly available in our surrounding will produce environmentally friendly and low-cost products as well. However, the main problem in biocomposites is the incompatibility between natural fillers and polymer matrices. This issue has attracted many composite researchers to propose ways to increase the compatibility between the biocomposite components. 1 –5 This is important, as it will improve mechanical, thermal, and correlated properties of the prepared biocomposites.
Polysaccharides are the polymer of monosaccharaides that originated from plant, algal, or crustacean. In this research, cellulose, which is a linear polysaccharide obtained from plant, was used as a natural filler. In addition, the advancement of research toward utilization of cellulose for composites reinforcement, biopolymers, and high-technology application are due to its abundant availability, renewable resources, and biodegradable properties. 6,7 On the other hand, polyethylene (PE) is a commodity thermoplastic used in the production of plastic product such as food and beverages container, pipes, plastic bags, and others. There are many types of PE which varied by density and branching and most commonly used for plastic products are high-density polyethylene (HDPE), low-density polyethylene (LDPE), and linear low-density polyethylene (LLDPE). In this research, HDPE/LDPE blend was used as the matrix for the preparation of biocomposites. Both types of PE were blended together to decrease the air bubbles formation in the PE/cellulose biocomposites as observed in our preliminary stage of research. Moreover, it was reported that HDPE is miscible with LDPE. 8,9
The incompatibility between natural filler and polymer matrix is a limitation for the enhancement of mechanical properties of biocomposites. 10 This is caused by the polarity and hydrophobicity difference between natural fillers and polymer matrices, which lead to poor interfacial adhesion between the biocomposite components. 11 PE is normally nonpolar and hydrophobic, 12 whereas polysaccharide is naturally polar and hydrophilic. 13 However, this problem usually can be solved with the addition of coupling agent or compatibilizer into the biocomposite systems for improving their interfacial adhesion. 14 Recently, surface active agents (surfactants) have been used as compatibilizers in polymer composite and blend systems. 3,15 –17 Surfactants have the capability to compatibilize between polar natural filler and nonpolar polymer matrix due to their amphiphilic properties. 18,19 There are several types of surfactants that are commonly used in several food and cleaning products such as ionic (cationic and anionic) and nonionic. Hexadecyltrimethylammonium bromide (HTAB; cationic), sodium stearate (SS; anionic), and sorbitan monostearate (SM; nonionic) were used in this research. These three surfactants are selected based on the similarity in characters, for instance, their structure consisted of single long alkyl chain (C16 to C17), they are environmentally friendly, low toxic, and, most importantly, they do not decompose during melt processing of PE. The chemical structures of HTAB, SS, and SM surfactants are displayed in Figure 1.
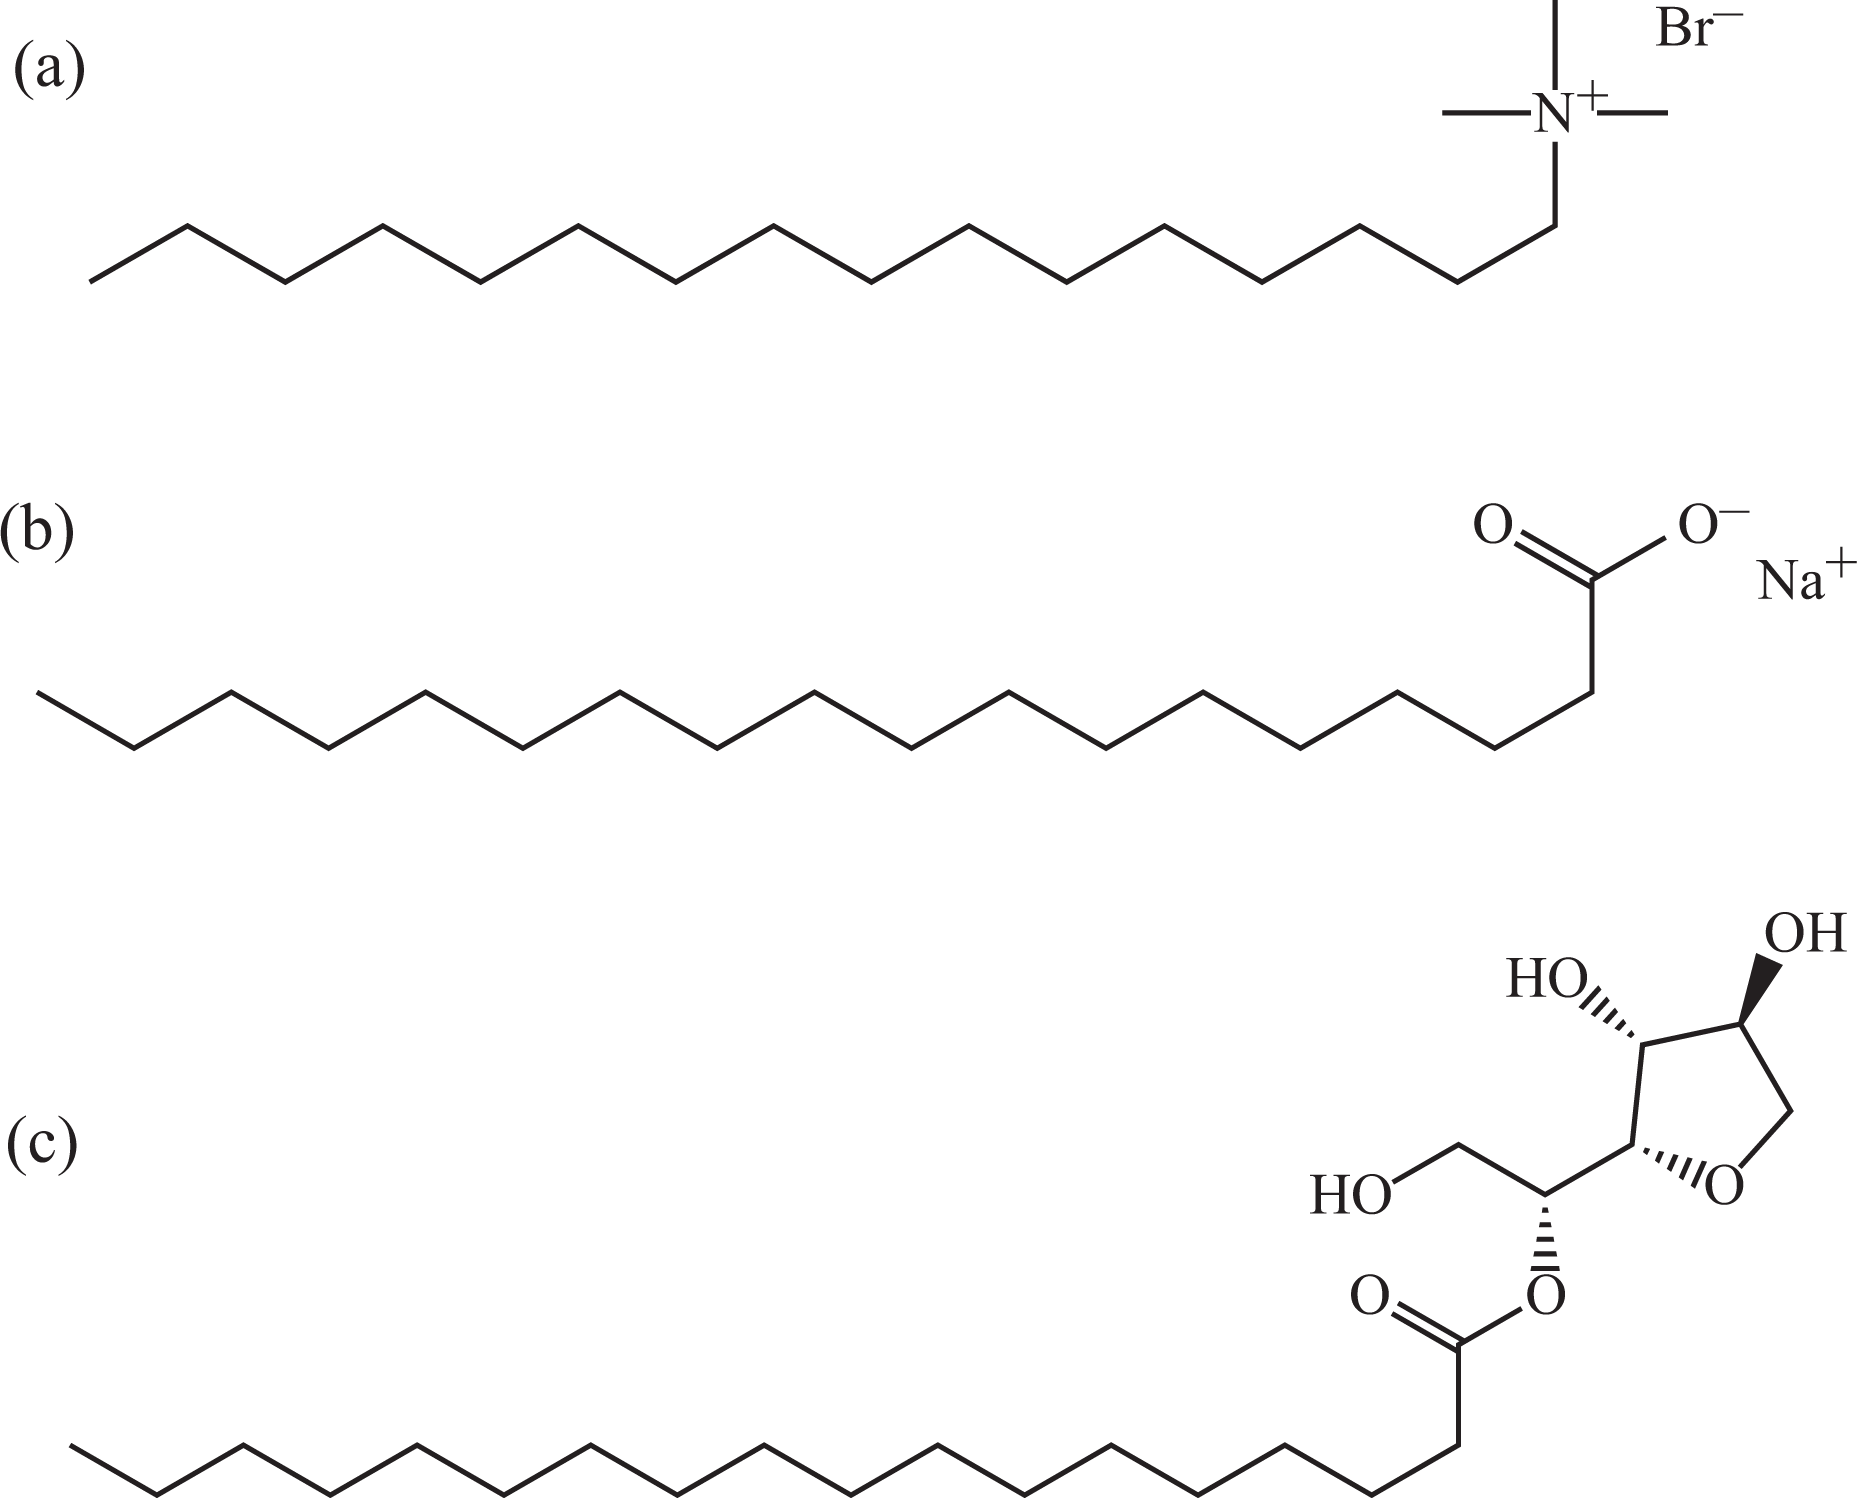
Chemical structures of (a) HTAB, (b) SS, and (c) SM surfactants.
The objectives of this research are to explore the compatibilizing effect of the surfactants (cationic, anionic, and nonionic) on the properties of HDPE/LDPE/cellulose biocomposites through mechanical testing, morphological examination, chemical characterization, and thermal analysis. As far as we are concerned, there are few published articles regarding the utilization of surfactants as compatibilizing agent for biocomposites. 3,15,20 Besides, these three types of surfactants that have been used in the prepared biocomposites were also studied and compared.
Materials and method
Materials
Cellulose microcrystalline powder with size of 20 µm was purchased from Sigma-Aldrich Malaysia Sdn. Bhd. LDPE (Titanlene LDC800YY) was acquired from Lotte Chemical Titan Malaysia Sdn. Bhd. HDPE (Etilinas HD5740UA) was obtained from Polyethylene Malaysia Sdn. Bhd. The surfactants used, HTAB (≥99%), SS (≥88%), and SM (≥98%), were also procured from Sigma-Aldrich Malaysia Sdn. Bhd. All the chemicals were used as received without further treatment.
Preparation of HDPE/LDPE/cellulose biocomposites
The biocomposites were prepared via melt mixing process using a Brabender internal mixer equipped with real-time processing torque recorder. The temperature, rotor speed, and time duration for melt mixing process were set at 150°C, 60 r min−1 and 12 min, respectively. The composition of premixed HDPE/LDPE and cellulose was fixed at 60/40 weight ratio. 3 The weight percentages of HTAB and SS were varied from 4, 8, 12, 16, and 20 wt%, whereas SM was varied from 1, 2, 3, 4, and 5 wt% relative to the content of biocomposites. First of all, the HDPE and LDPE (24 g) were premixed at 1:1 weight ratio. Then, they were added into the Brabender mixing chamber, followed by cellulose (16 g) and, finally, surfactant (HTAB, SS, or SM). Time interval for the addition of each material is 3 min. After that, the mixing time was extended to 3 min for plateau torque to achieve in this process. The biocomposite compounds obtained from internal mixer were molded into 1 mm sheet using a hot press machine. The compression molding procedures involved preheating of the biocomposite compounds at 150°C for 7 min and, subsequently, compressed for 2 min at the same temperature before they were cooled under pressure for 5 min. The sheet of HDPE/LDPE/cellulose biocomposite without the addition of surfactants was also prepared for comparison purpose. The weight proportion of HDPE/LDPE/cellulose biocomposites without and with the addition of HTAB, SS, and SM surfactants are exhibited in Table 1.
The weight proportion of HDPE/LDPE/cellulose biocomposites without and with the addition of HTAB, SS, and SM.
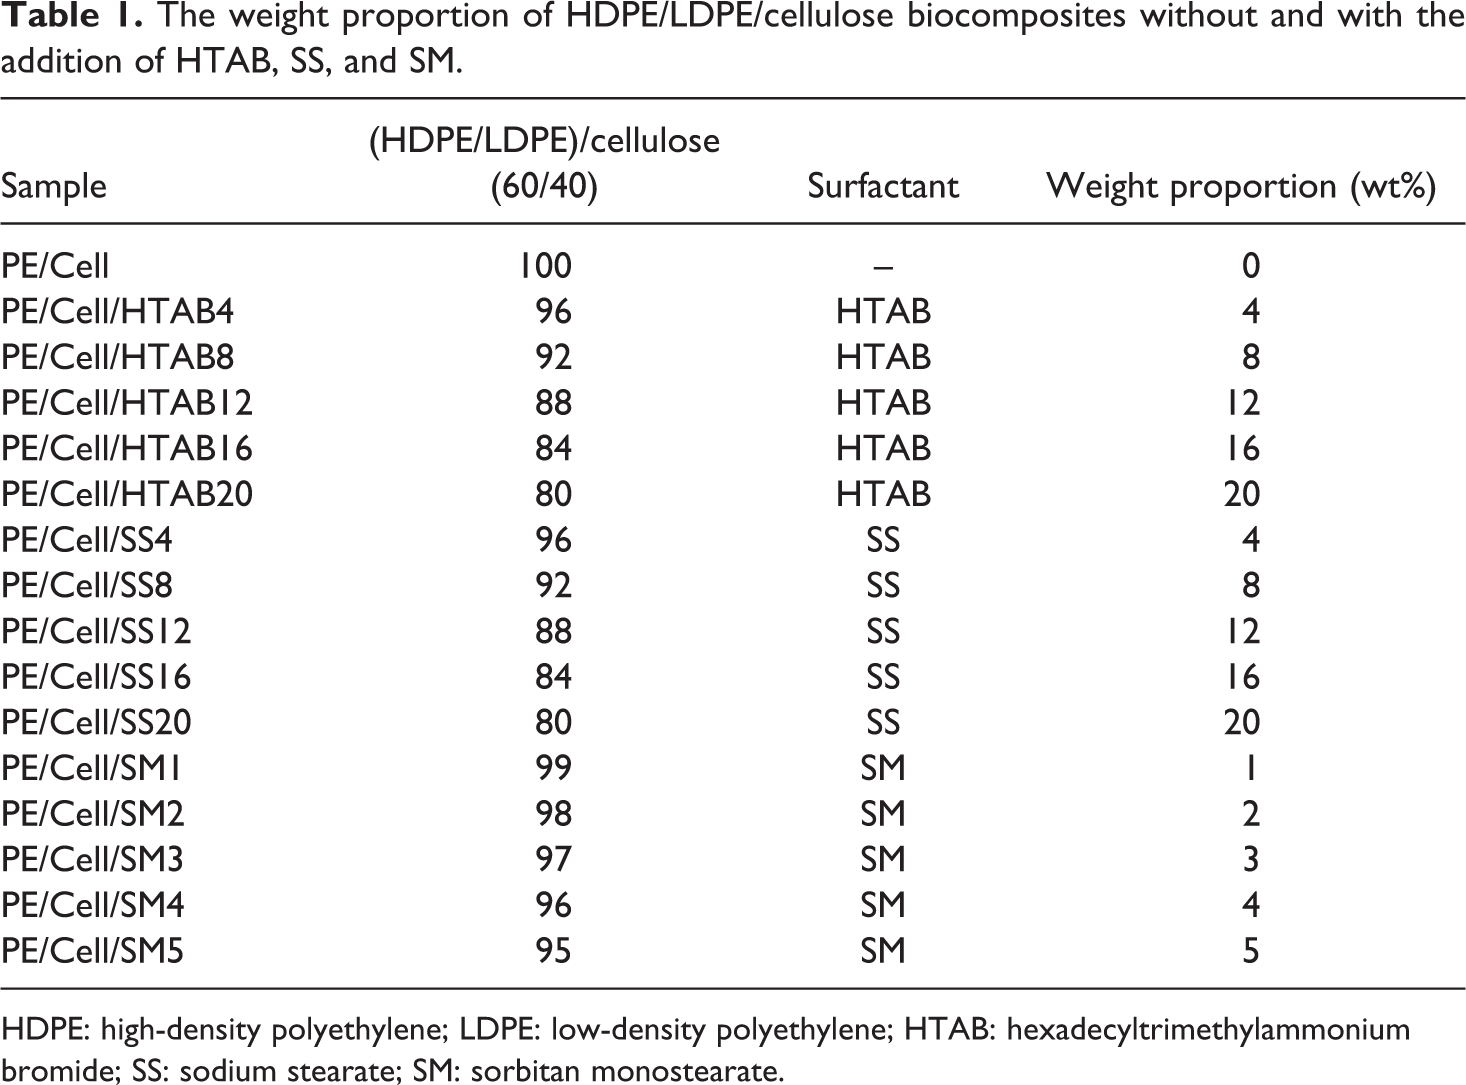
HDPE: high-density polyethylene; LDPE: low-density polyethylene; HTAB: hexadecyltrimethylammonium bromide; SS: sodium stearate; SM: sorbitan monostearate.
Mechanical testing
The impact strength of the biocomposites was determined via Izod impact test. It was carried out based on ASTM D256-10 standard 21 using a CEAST impact testing machine (model 9050). The biocomposite samples were cut into rectangular shapes with the dimension of 60 × 12.7 × 1.0 mm3 using a Makita scroll saw machine (model SJ401), and they were notched for 1 mm depth using a CEAST notch machine (Notchvis). To conduct the test, 0.5 J pendulum was used.
Tensile test was done according to ASTM D638-10 standard 22 at room temperature (25°C) using an Instron universal testing machine (model 5567; Norwood, Massachusetts, USA), equipped with a 30 kN load cell. It was carried out to determine the tensile strength, tensile modulus, and tensile extension of the biocomposites. The biocomposite samples were cut into a dumbbell shape (Type V). The initial gauge length and the crosshead speed were fixed to 50 mm and 5 mm min−1, respectively.
Scanning electron microscope
Morphology examination of the biocomposite samples was operated using a Hitachi (model S3400 N) SEM at magnification of 1000× with accelerating voltages of 20.0 kV. Fractured samples from Izod impact test were mounted on an aluminum stub and coated with a thin layer of gold before the examination for better morphological observation of the samples.
Fourier transform infrared
FTIR spectrometer (PerkinElmer Spectrum 100 Series, Waltham, Massachusetts, USA) was used to determine the functional groups and interactions between HDPE/LDPE/cellulose biocomposite components. The samples were scanned in wave number range of 4000 to 500 cm−1 and resolution of 4 cm−1 at ambient temperature. The FTIR spectra were obtained by means of universal attenuated total reflectance (UATR) and zinc selenide–diamond composite crystal accessory.
X-Ray diffractometer
X-Ray diffraction patterns of the biocomposite samples were attained using an X-ray diffractometer (APD 2000 PRO Diffractometer, Italy) with monochromatized copper Kα radiation (1.541 Å). The test was done at an operating voltage of 40.0 kV and current intensity of 40.0 mA. Angular range of scan was 18° to 28° at stage size and stage time of 0.01° and 0.2 s, respectively.
Thermogravimetric analysis
Thermogravimetric analysis (TGA) was done to examine the thermal decomposition of prepared biocomposites. Mettler Toledo TGA/SDTA 851e apparatus (Columbus, Ohio, USA) has been used for this analysis. The test was conducted from temperature of 40 to 600°CC with a heating rate of 10°C min−1 under nitrogen atmosphere with a flow rate of 50 ml min−1.
Differential scanning calorimetry
Differential scanning calorimetry (DSC) analysis was carried out using a Mettler Toledo DSC822e apparatus to determine the melting point temperature (Tm) of biocomposites. Preheating at 100°C for 7 min was done on the biocomposite samples to eliminate thermal history. The analysis was performed from 110 to 150°C with a heating rate of 10°C min−1. All biocomposite samples were analyzed under constant stream of nitrogen at a flow rate of 50 ml min−1.
Results and discussion
Melt processing characteristics
The processing torque–time curves of HDPE/LDPE/cellulose biocomposites with the addition of HTAB, SS, and SM are presented in Figure 2(a), (b), and (c), respectively. The torque has sharply increased at the first minute of mixing process due to the increasing resistance of unmelted HDPE/LDPE with internal mixer rotor movement. 23 However, the sharp peak started to drop to a certain point and remain stable along with the mixing time as the premixed HDPE/LDPE started to melt. From 3 to 6 min, another peak appeared again on the curves due to the addition of cellulose into internal mixer. The cellulose has caused difficulty in the mobility of HDPE/LDPE chains, and more rotational forces are needed for cellulose dispersion. 24 Then, the torque started to drop again as the cellulose is well dispersed in the molten biocomposites. 3,25 The torque for HDPE/LDPE/cellulose biocomposite (PE/Cell) remained stable until the end of mixing time. Nevertheless, the torque started to exhibit its distinct behavior after the addition of surfactants into the biocomposites at the 6 min. In Figure 2(a), the biocomposites exhibited gradual drop to a certain level of torque after the addition of HTAB, particularly at PE/Cell/HTAB4 to PE/Cell/HTAB16. This is due to the lubricating effect of the surfactant in biocomposites. 3 Nonetheless, a downward peak followed by upward peak was recorded in PE/Cell/HTAB20. The upward peak was due to high loading of the surfactant in the biocomposite, thus more rotational forces needed for the dispersion of surfactant. 3 However, the torque eventually became stable as the mixing time increased.
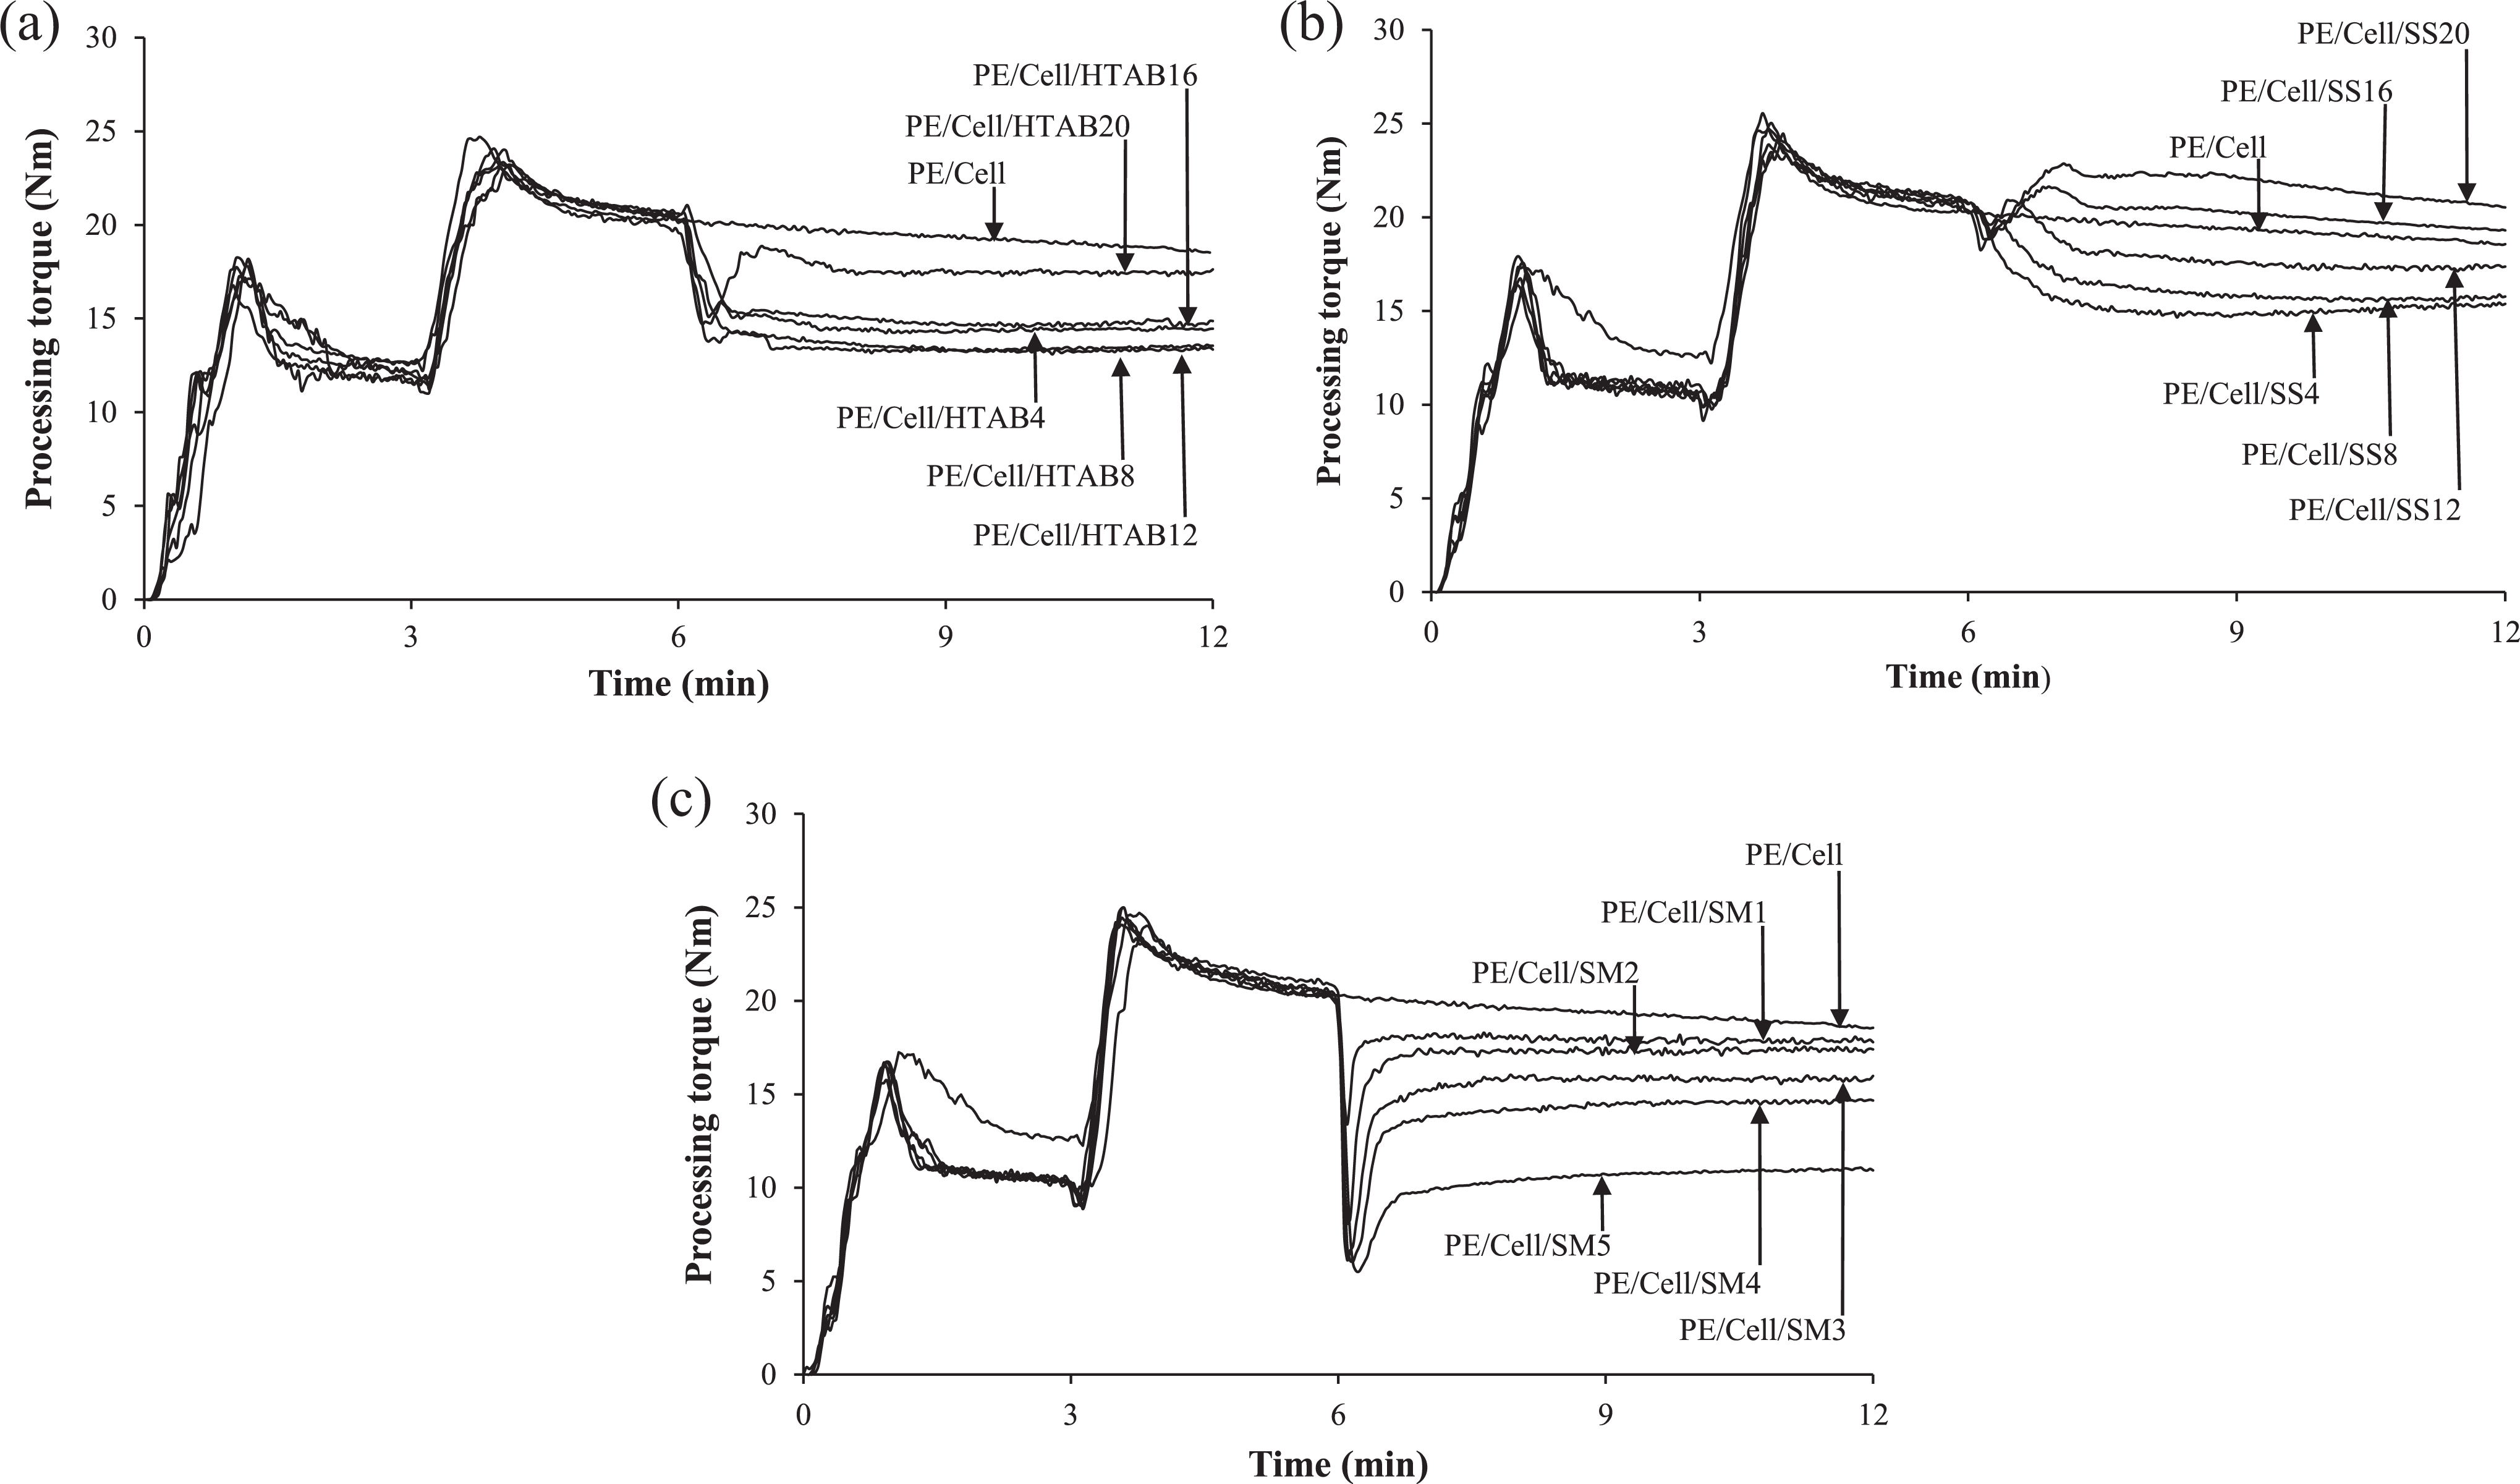
Processing torque–time curves of HDPE/LDPE/cellulose biocomposites with different weight percentages of (a) HTAB, (b) SS, and (c) SM.
For biocomposites with the addition of SS (Figure 2(b)), the torque of PE/Cell/SS4 gradually decreased before it is constant throughout the mixing time. On the other hand, PE/Cell/SS8 to PE/Cell/SS20 exhibited downward peaks, followed by upward peaks before they decreased to the stable torque. The decreases of torque are due to lubricating effect of the SS, while the increases are owing to the increment of rotational forces needed for SS dispersion. As can be seen in Figure 2(c), the weight percentages of SM were different from HTAB and SS because of the formation of bubbles in HDPE/LDPE/cellulose biocomposites after exceeding 5 wt% SM. The biocomposites added with SM displayed downward peaks before gradually increased to stable torques. The addition of SM has led to easy processing of the molten biocomposites, which eventually caused the torque to reduce. Nevertheless, the torque has increased due to the increasing rotational forces required for dispersion of SM in the biocomposites. From the obtained results, it can be seen that the surfactants can act as processing aid, which reduced the needed torque and thus lowering the consumption of energy for mixing process of the biocomposites.
The stabilization torque values of HDPE/LDPE/cellulose biocomposites at different weight percentages of HTAB, SS, and SM are shown in Figure 3(a), (b), and (c), respectively. The results are obtained from the torque value at the 12th min of melt mixing process. Figure 3(a) showed that the addition of HTAB has decreased the stabilization torque values of the biocomposites from PE/Cell/HTAB4 to PE/Cell/HTAB12. Generally, the addition of HTAB would increase the stabilization torque value of biocomposites due to the improvement of compatibility between polymer matrix and filler. 3 Interestingly, the stabilization torque value in this study was decreased with the addition of HTAB. This is probably due to different condition of HTAB that has been added into the biocomposites. The stabilization torque values of PE/Cell/HTAB16 and PE/Cell/HTAB20 are higher than PE/Cell/HTAB4 to PE/Cell/HTAB12 due to agglomeration of the surfactant. However, the increases of stabilization torque values of the biocomposites added with HTAB are still lower than PE/Cell.
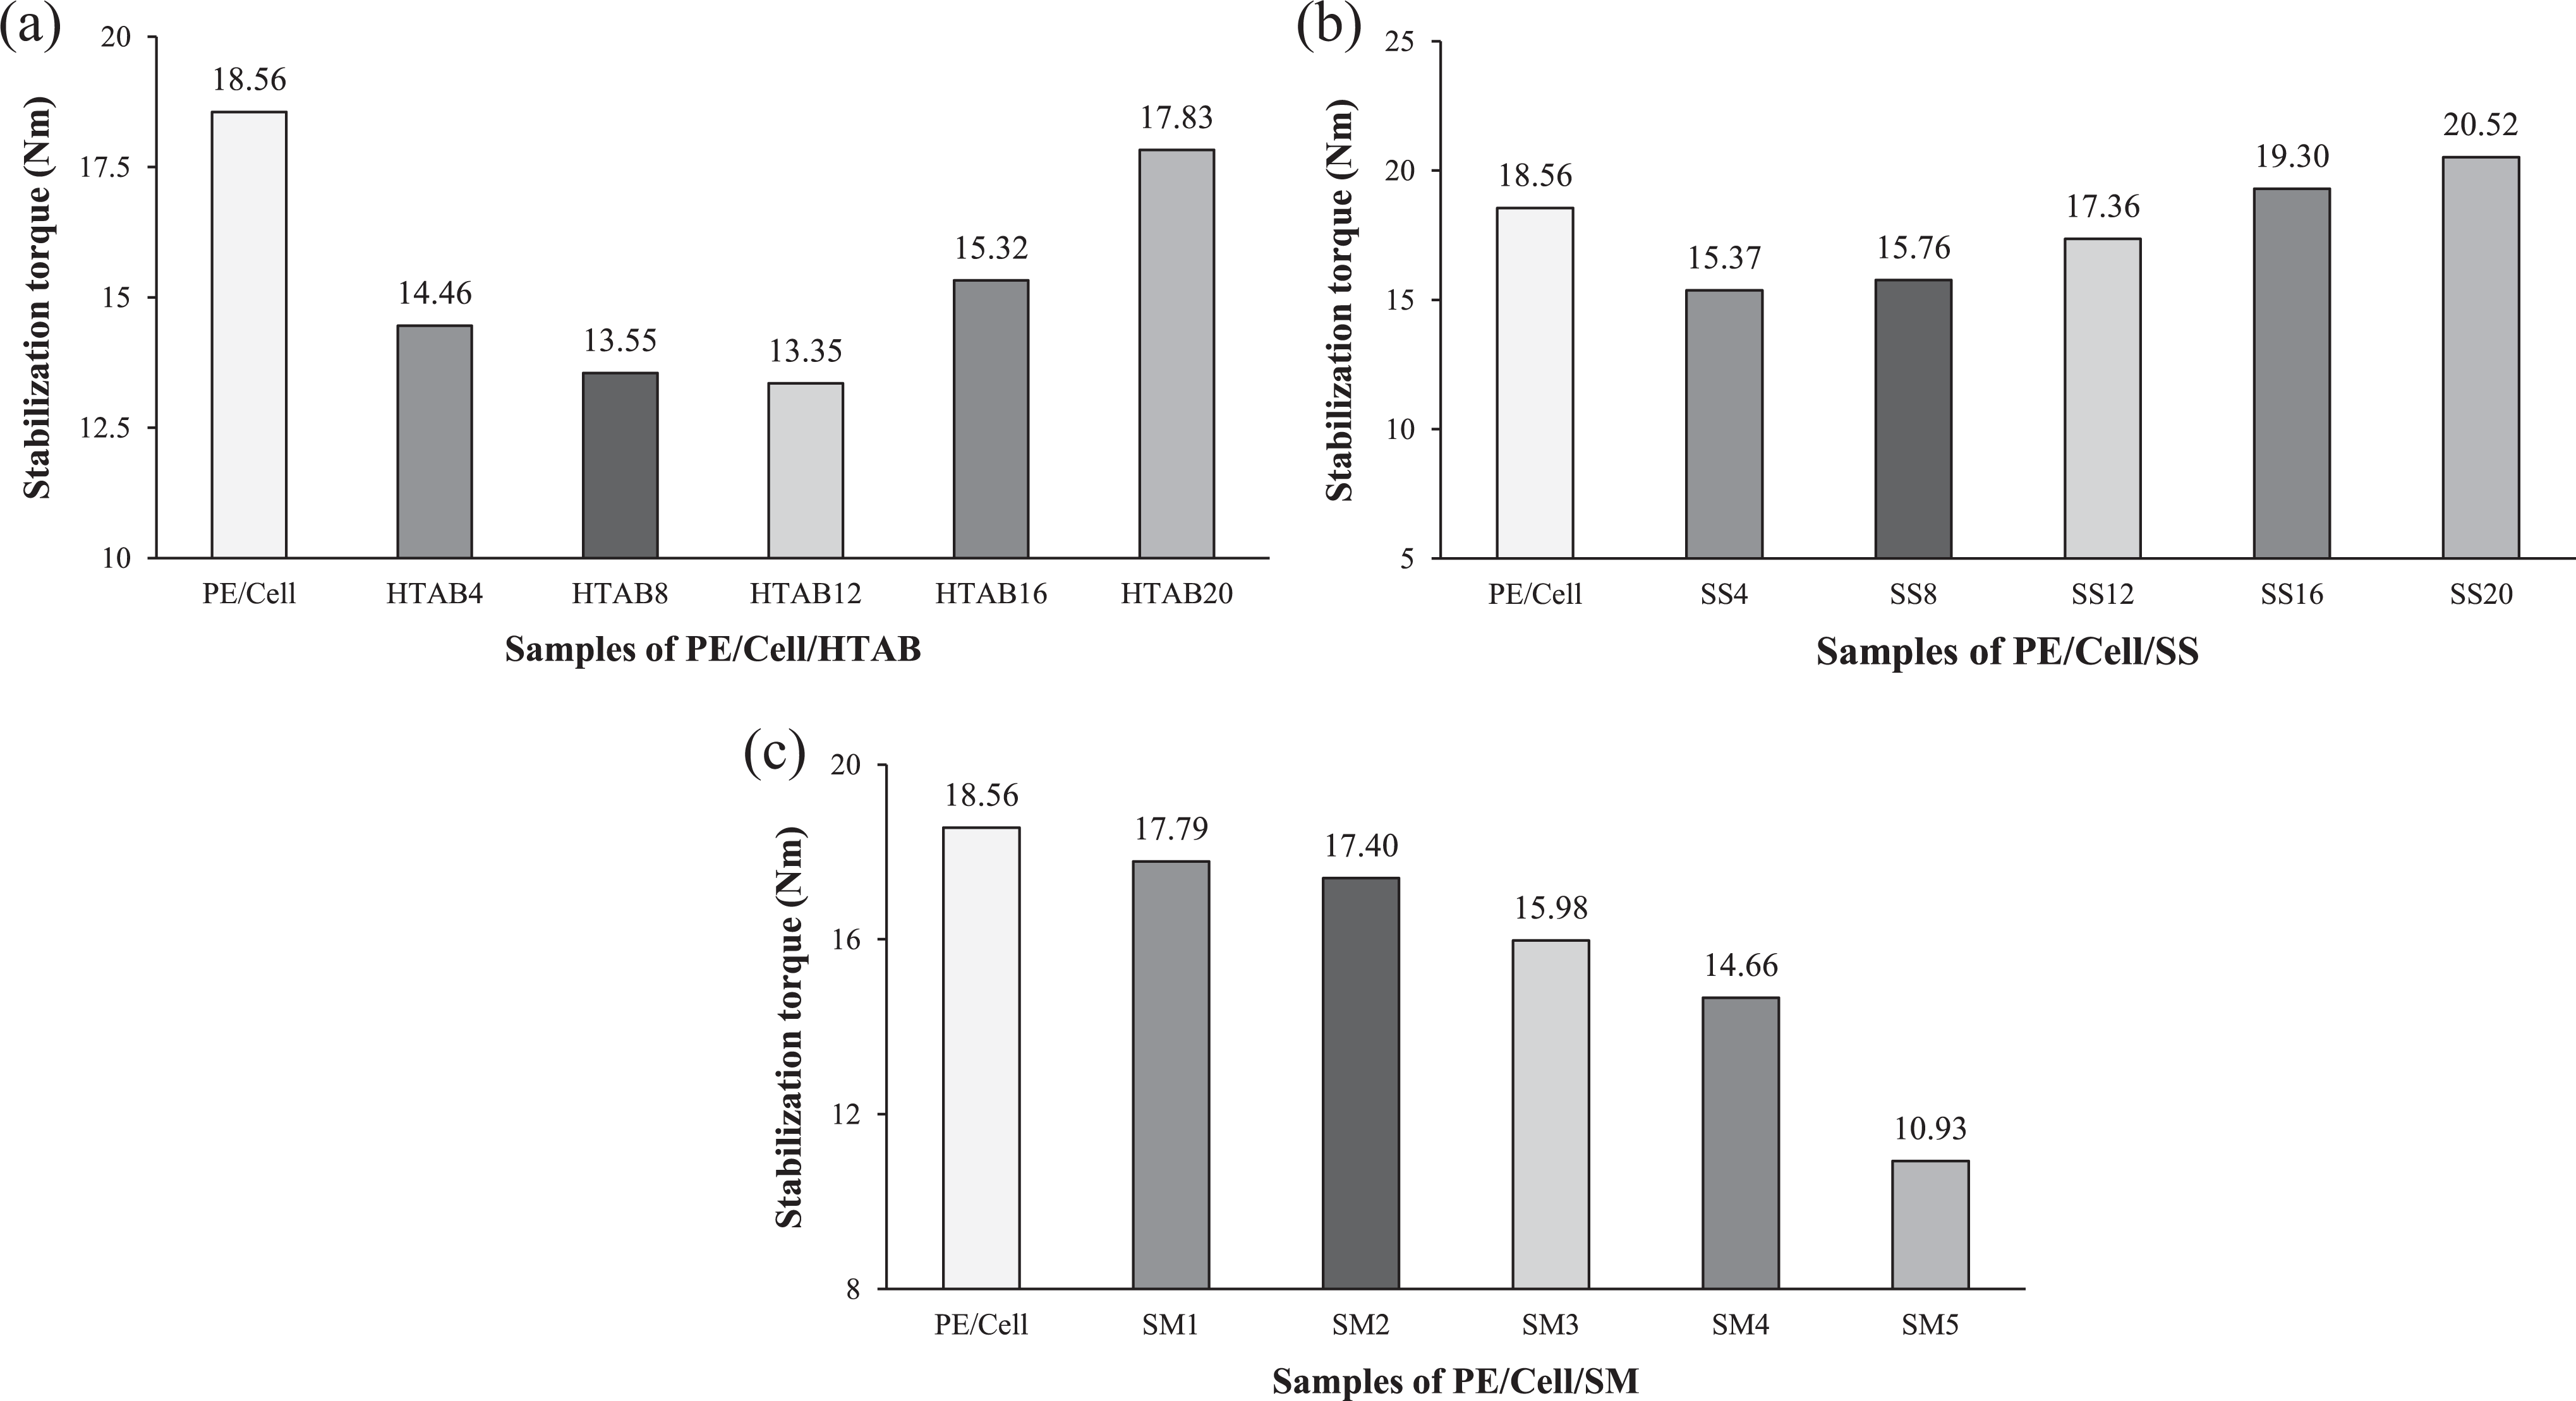
Stabilization torque values of HDPE/LDPE/cellulose biocomposites with different weight percentages of (a) HTAB, (b) SS, and (c) SM.
On the other hand, the addition of SS has decreased the stabilization torque value of PE/Cell/SS4 (Figure 3(b)). This is possibly due to phase transition of SS from solid to liquid at elevated temperature, which could affect the melt strength of the molten HDPE/LDPE/cellulose biocomposites. Nevertheless, further addition of SS in the biocomposites has increased the stabilization torque values, but they are not higher than PE/Cell. The increases of stabilization torque values were due to high content of SS in the biocomposites with fixed weight ratio of HDPE/LDPE and cellulose. This has decreased the mobility of HDPE/LDPE molecular chains, which eventually increased the stabilization torque value of the biocomposites. Conversely, the stabilization torque value was decreased with the addition of SM, and the values were continuously decreased as weight percentages of SM increased in the biocomposites (Figure 3(c)). The trend of results for stabilization torque of the biocomposites added with SM is parallel with HTAB-added biocomposites. This exhibited that there is also enhancement of compatibility between HDPE/LDPE and cellulose with the addition of SM into the biocomposites. Furthermore, it is seen that the addition of SM at low weight percentage has decreased the stabilization torque value of the biocomposites more than the addition of HTAB at higher weight percentage. On the contrary, stabilization torque value of SS-added biocomposites started to increase more than PE/Cell at much lower weight percentage than that of HTAB and SM.
Figure 4 displayed the stock temperature–time curves of HDPE/LDPE/cellulose biocomposites with the addition of HTAB (Figure 4(a)), SS (Figure 4(b)), and SM (Figure 4(c)) surfactants. It can be seen from Figure 4(a) to (c) that the stock temperature sharply decreased at the first minute of mixing time as HDPE/LDPE was added into the mixing chamber. This is due to heat exchange between the mixing chamber and the unmelted HDPE/LDPE, which most likely correlated with endothermic process. Then the stock temperature started to increase above the mixing temperature (150°C) because of the extensive shearing of internal mixer rotor on the molten HDPE/LDPE. 26 On the fourth minute, the stock temperature decreased with the addition of cellulose as the molten HDPE/LDPE exchanged heat with cellulose. Besides that, the decreases also took place due to the exchange of heat among the biocomposites and the mixing chamber. However, the stock temperature increased again as a result of friction heat from rotor shearing upon the molten biocomposites which caused exothermic process. Then, the stock temperature of HDPE/LDPE/cellulose biocomposite (PE/Cell) started to remain stable until the end of mixing time. This is an indication of balanced endothermic and exothermic processes of the molten PE/Cell in the mixing chamber. Nevertheless, downward peaks were recorded at the 7th minute when HTAB was added into mixing chamber (Figure 4(a)). The decreases are owing to heat exchange between the molten biocomposites and HTAB, which has led to the effectuation of endothermic process. A part of the decrease was also caused by heat exchange among HTAB-added biocomposites and mixing chamber. On top of that, the stock temperatures were gradually increased and settled at stable temperatures as the mixing time increased.
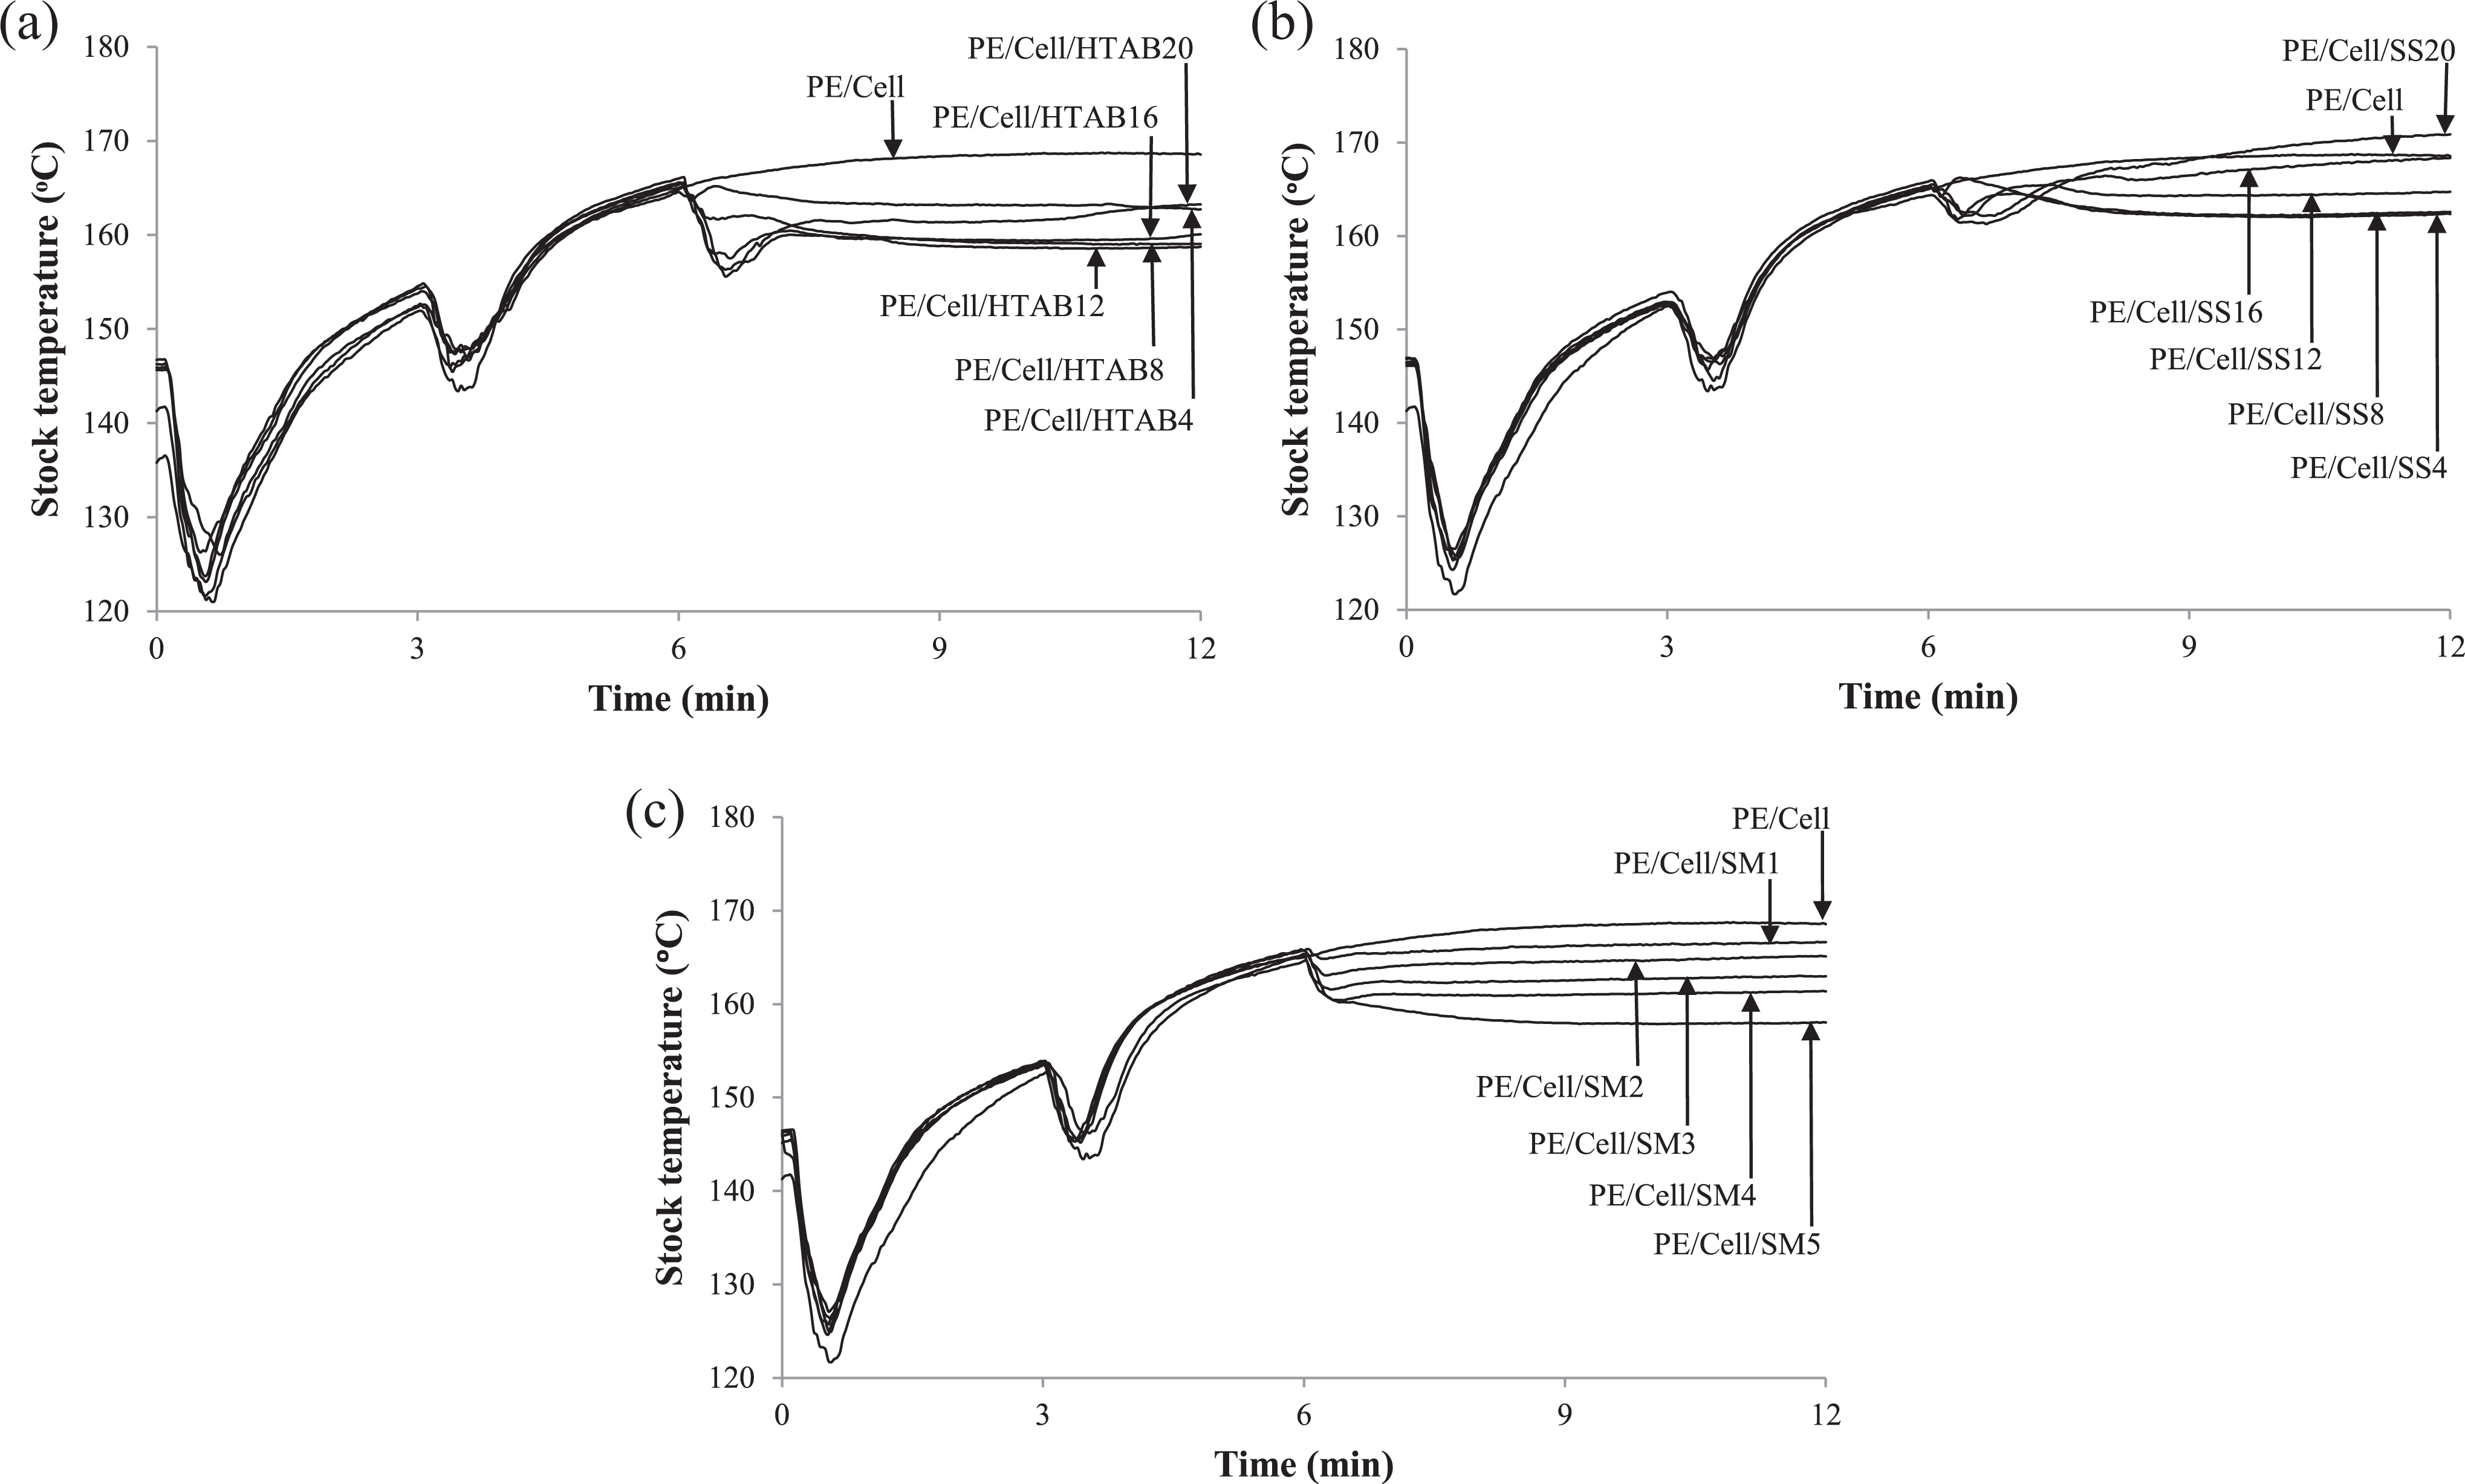
Stock temperature–time curves of HDPE/LDPE/cellulose biocomposites with different weight percentages of (a) HTAB, (b) SS, and (c) SM.
In Figure 4(b), the decreases of stock temperature also occurred after the addition of SS. This is due to heat exchange between molten HDPE/LDPE/cellulose biocomposites and SS which induced endothermic process. Furthermore, the heat exchange among the mixing chamber and the molten biocomposites added with SS also contributed to the decrease of stock temperature. Nevertheless, the stock temperature eventually increased after the addition of SS. This is an exothermic process that caused heat formation due to friction of the rotor with the molten SS-added biocomposites. However, the stock temperatures of PE/Cell/SS4 to PE/Cell/SS12 become stable until the end of mixing time as the endothermic process achieved equilibrium with the exothermic process. Nonetheless, the stock temperature of PE/Cell/SS16 and PE/Cell/SS20 continuously increased due to high loading of SS in the biocomposites. This has caused the friction of rotor with the molten biocomposites to increase and subsequently increased the heat generation in the mixing chamber and the exothermic process as well.
Figure 4(c) shows that the addition of SM into the biocomposites has decreased the stock temperature as a consequence of heat exchange between SM and HDPE/LDPE/cellulose biocomposites. The decrease also eventually initiated the endothermic process, which influenced by exchange of heat among the SM-added biocomposites and the mixing chamber. Finally, the stock temperature becomes stable until the end of mixing time. Additionally, there are no increases in stock temperature, implying that the addition of SM has eliminated the friction between the rotor and the molten biocomposites. Thus, the addition of the used surfactants into biocomposites has contributed to the decrease of stock temperature, which could prevent the decomposition of natural filler at high mixing temperature.
The effects of HTAB, SS, and SM surfactants on the stabilization temperature values of HDPE/LDPE/cellulose biocomposites are exhibited in Figure 5(a), (b), and (c), respectively. The stock temperatures at the final minute of mixing time are considered as the stabilization temperature values. As can be seen in Figure 5(a), the stabilization temperature values of the biocomposites were decreased with the addition of 4 to 12 wt% HTAB. This indicated that the addition at low amount of HTAB into the biocomposites has decrease of heat formation and thus reduced the stabilization temperature values compared to the biocomposite without adding the HTAB. Nevertheless, the addition of 16 to 20 wt% HTAB increased the stabilization temperature values of biocomposites. This could be related to the accretion of surfactant in PE/Cell/HTAB16 and PE/Cell/HTAB20 which caused heat formation to increase. Although the stabilization temperature values of PE/Cell/HTAB16 and PE/Cell/HTAB20 increased, the value of PE/Cell is higher than them. On top of that, PE/Cell/HTAB12 was perceived as having the lowest stabilization temperature values in comparison with others.
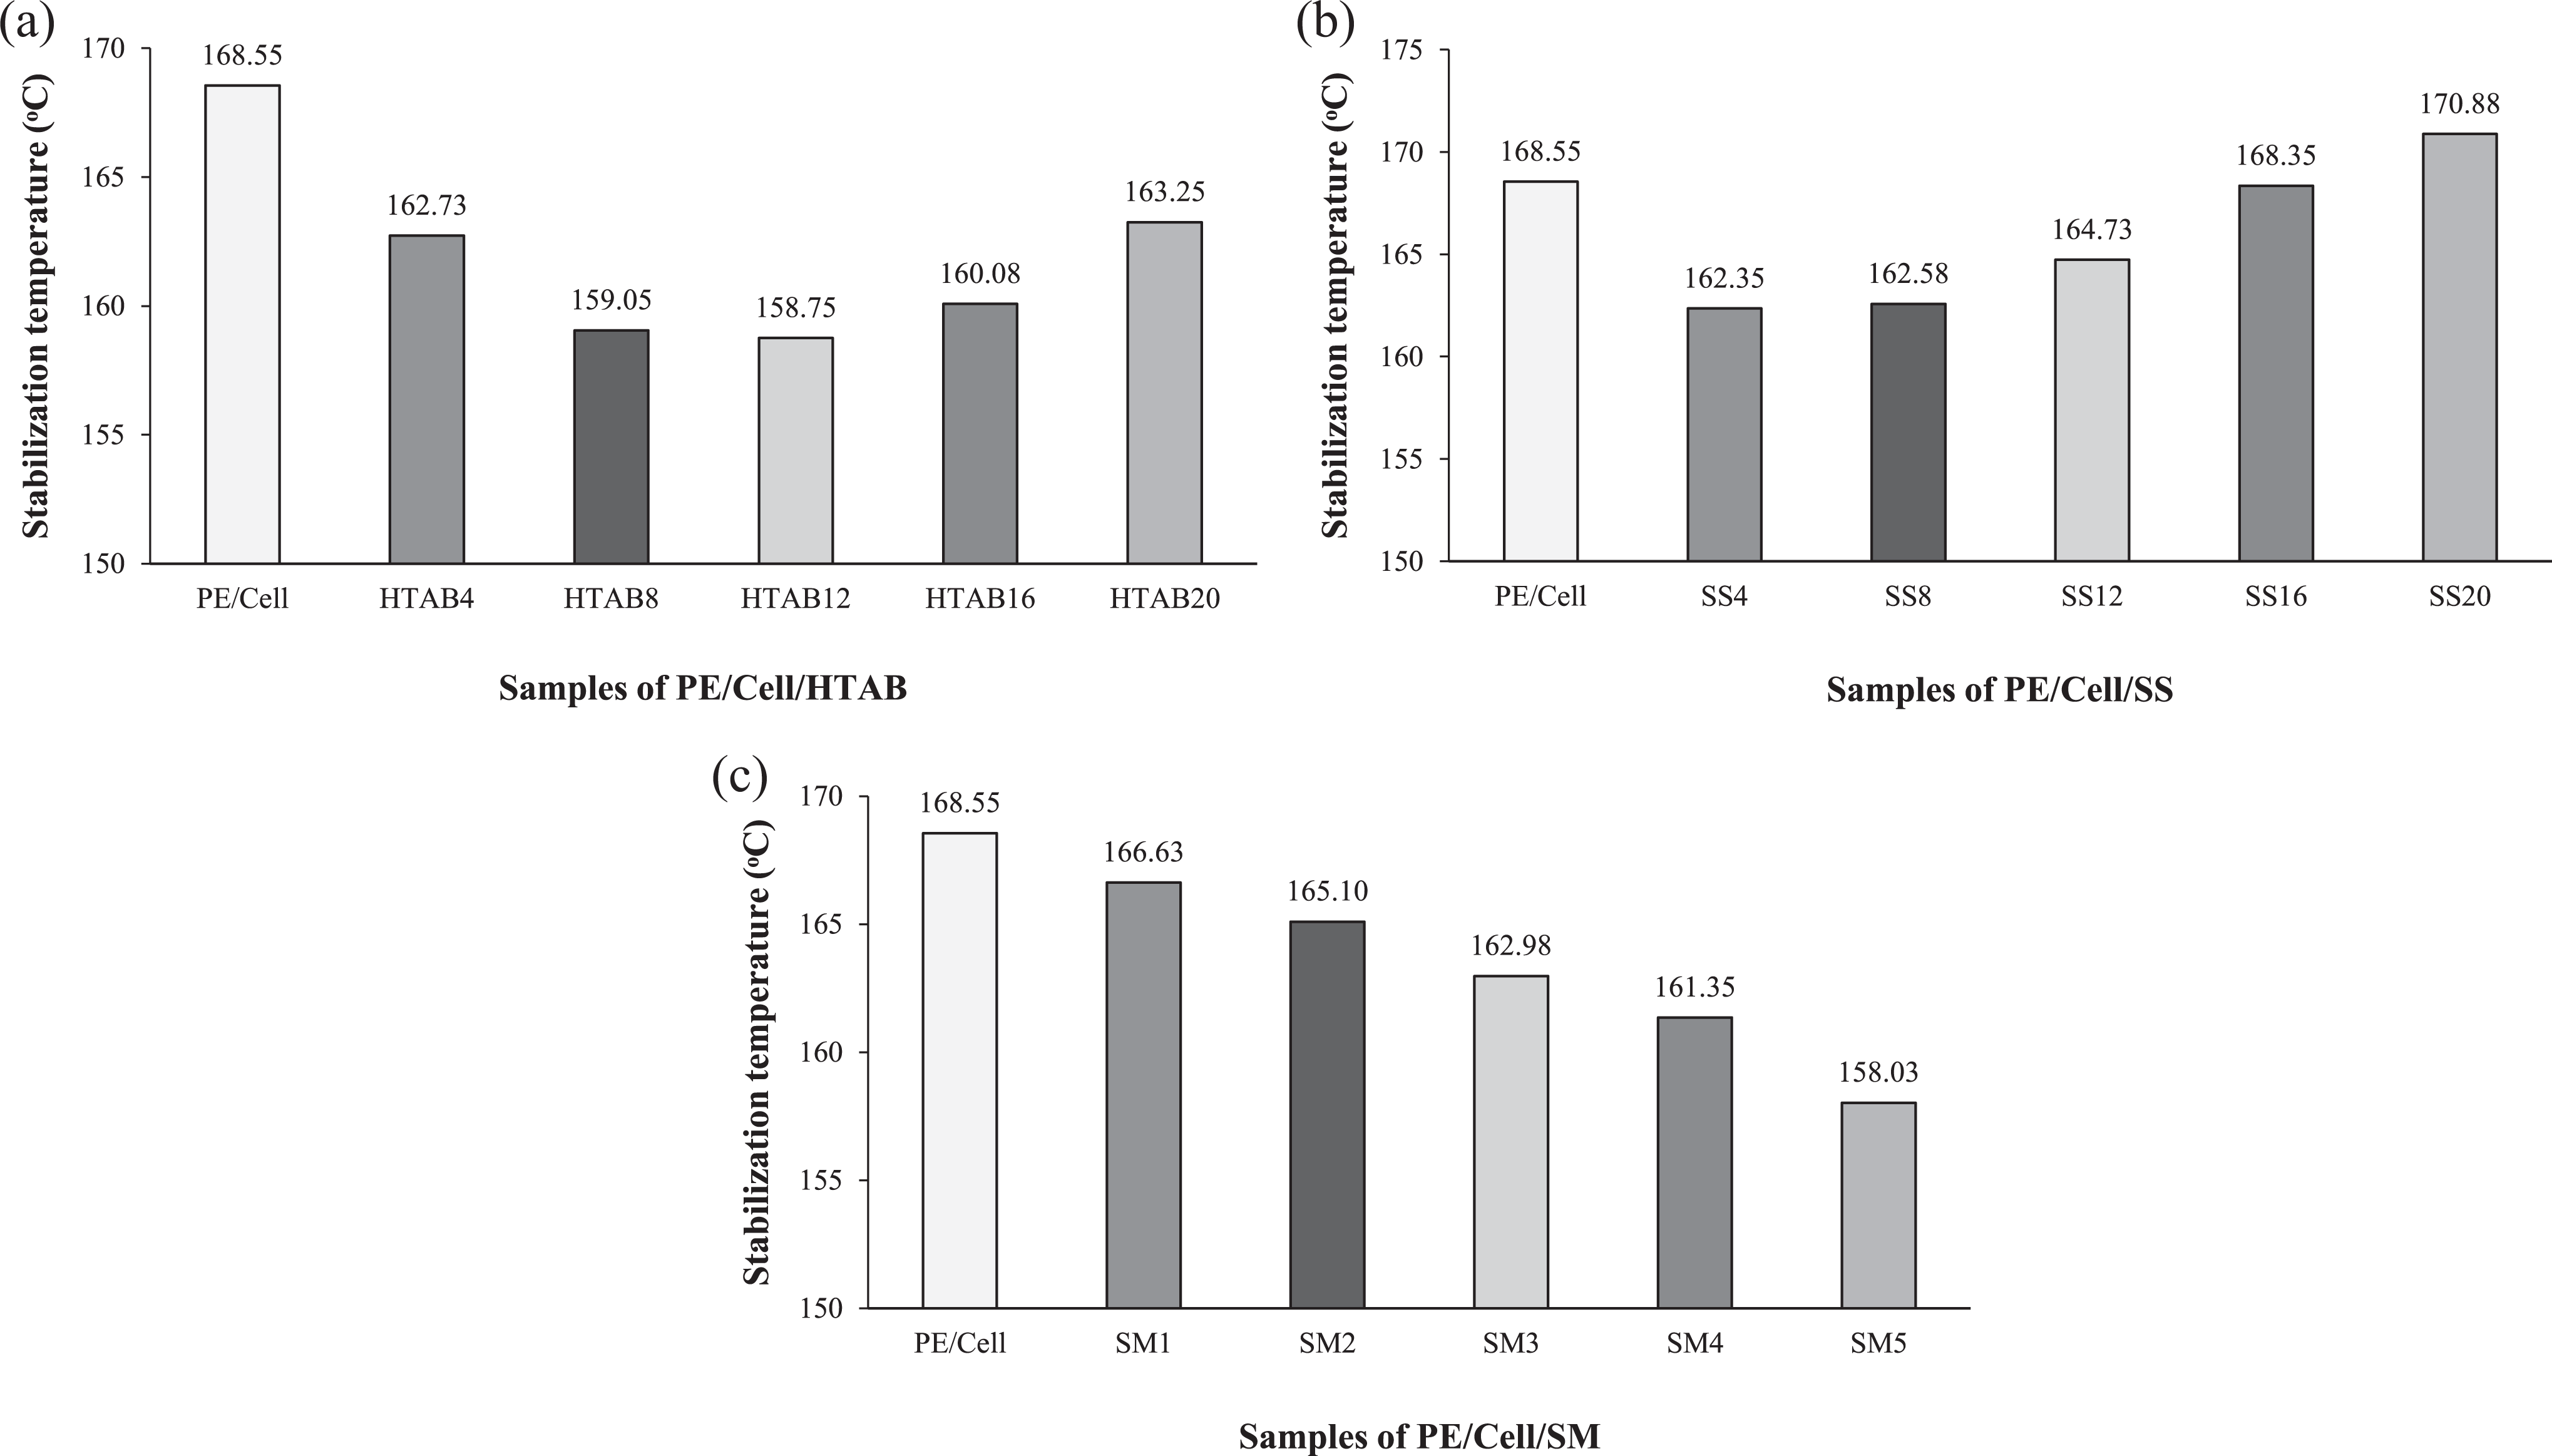
Stabilization temperature values of HDPE/LDPE/cellulose biocomposites with different weight percentages of (a) HTAB, (b) SS, and (c) SM.
In Figure 5(b), the addition of 4 wt% SS has decreased the stabilization temperature value of HDPE/LDPE/cellulose biocomposites. The trend of decrease in stabilization temperature value of PE/Cell/SS4 is similar with that of PE/Cell/HTAB4, implying the reduction of heat formation in the mixing chamber. Contrariwise, the stabilization temperature value is higher in PE/Cell/SS8 than PE/Cell/SS4, and it is continuously increased up to PE/Cell/SS20. This exhibited that the SS started to form aggregate at low weight percentage and caused heat formation to increase gradually. Among all of the biocomposites added with SS, only PE/Cell/SS20 has the higher stabilization temperature value than PE/Cell. On the other hand, it can be seen from Figure 5(c) that the stabilization temperature values of the biocomposites progressively decreased after the addition of SM from 1 to 5 wt%. In fact, this is due to the decrease of heat formation which could minimize heat exposure on the cellulose filler and thus prevent it from denatured. Additionally, at such low amount of surfactant, the stabilization temperature values were impressively reduced with the addition of SM compared to HTAB and SS. Hence, SM was observed to have better capability to reduce the stabilization temperature value than HTAB, whereas the least of all is SS.
Mechanical properties
The mechanical properties of HDPE/LDPE/cellulose biocomposites with the addition of HTAB, SS, and SM are displayed in Figure 6, 7, and 8, respectively. In Figure 6(a) and (b), tensile strength and tensile modulus of the biocomposites were increased from PE/Cell/HTAB4 to PE/Cell/HTAB12. This showed that the improvement of stress transfer from HDPE/LDPE to cellulose, indicating the addition of HTAB from 4 to 12 wt% has enhanced the interfacial adhesion between HDPE/LDPE and cellulose. 27,28 However, the tensile strength and tensile modulus of biocomposites continuously decreased with the addition of 16 and 20 wt% HTAB. The reduction of these properties in PE/Cell/HTAB16 and PE/Cell/HTAB20 occurred as an effect of surfactant oversaturation in the biocomposite systems. 29 At this level, extra amount of HTAB will form aggregates that would affect the homogeneity of the biocomposites 30 and consequently decrease their mechanical properties. 31 On the other hand, in Figure 6(c) and (d), the tensile extension and impact strength were continuously decreased with the addition of HTAB. Presumably, this is due to the escalating amount of crystal lattice of HTAB in the biocomposite systems, which eventually caused the brittleness of biocomposites to increase. 3 Additionally, the increases of tensile strength and tensile modulus of the biocomposites indicated that HTAB has the ability to act as a compatibilizing agent. Although the tensile strength and tensile modulus of PE/Cell/HTAB16 and PE/Cell/HTAB20 are decreased, the values still exceed that of PE/Cell. On top of that, the addition of 12 wt% HTAB was seen to give optimum compatibilizing effect on HDPE/LDPE/cellulose biocomposites. This is owing to the fact that the PE/Cell/HTAB12 possessed highest tensile strength and tensile modulus compared to other biocomposites added with HTAB, which is 3.27 MPa and 293.47 MPa, respectively. The tensile strength of PE/Cell/HTAB12 was improved by 25%, while its tensile modulus was also improved by 25%.
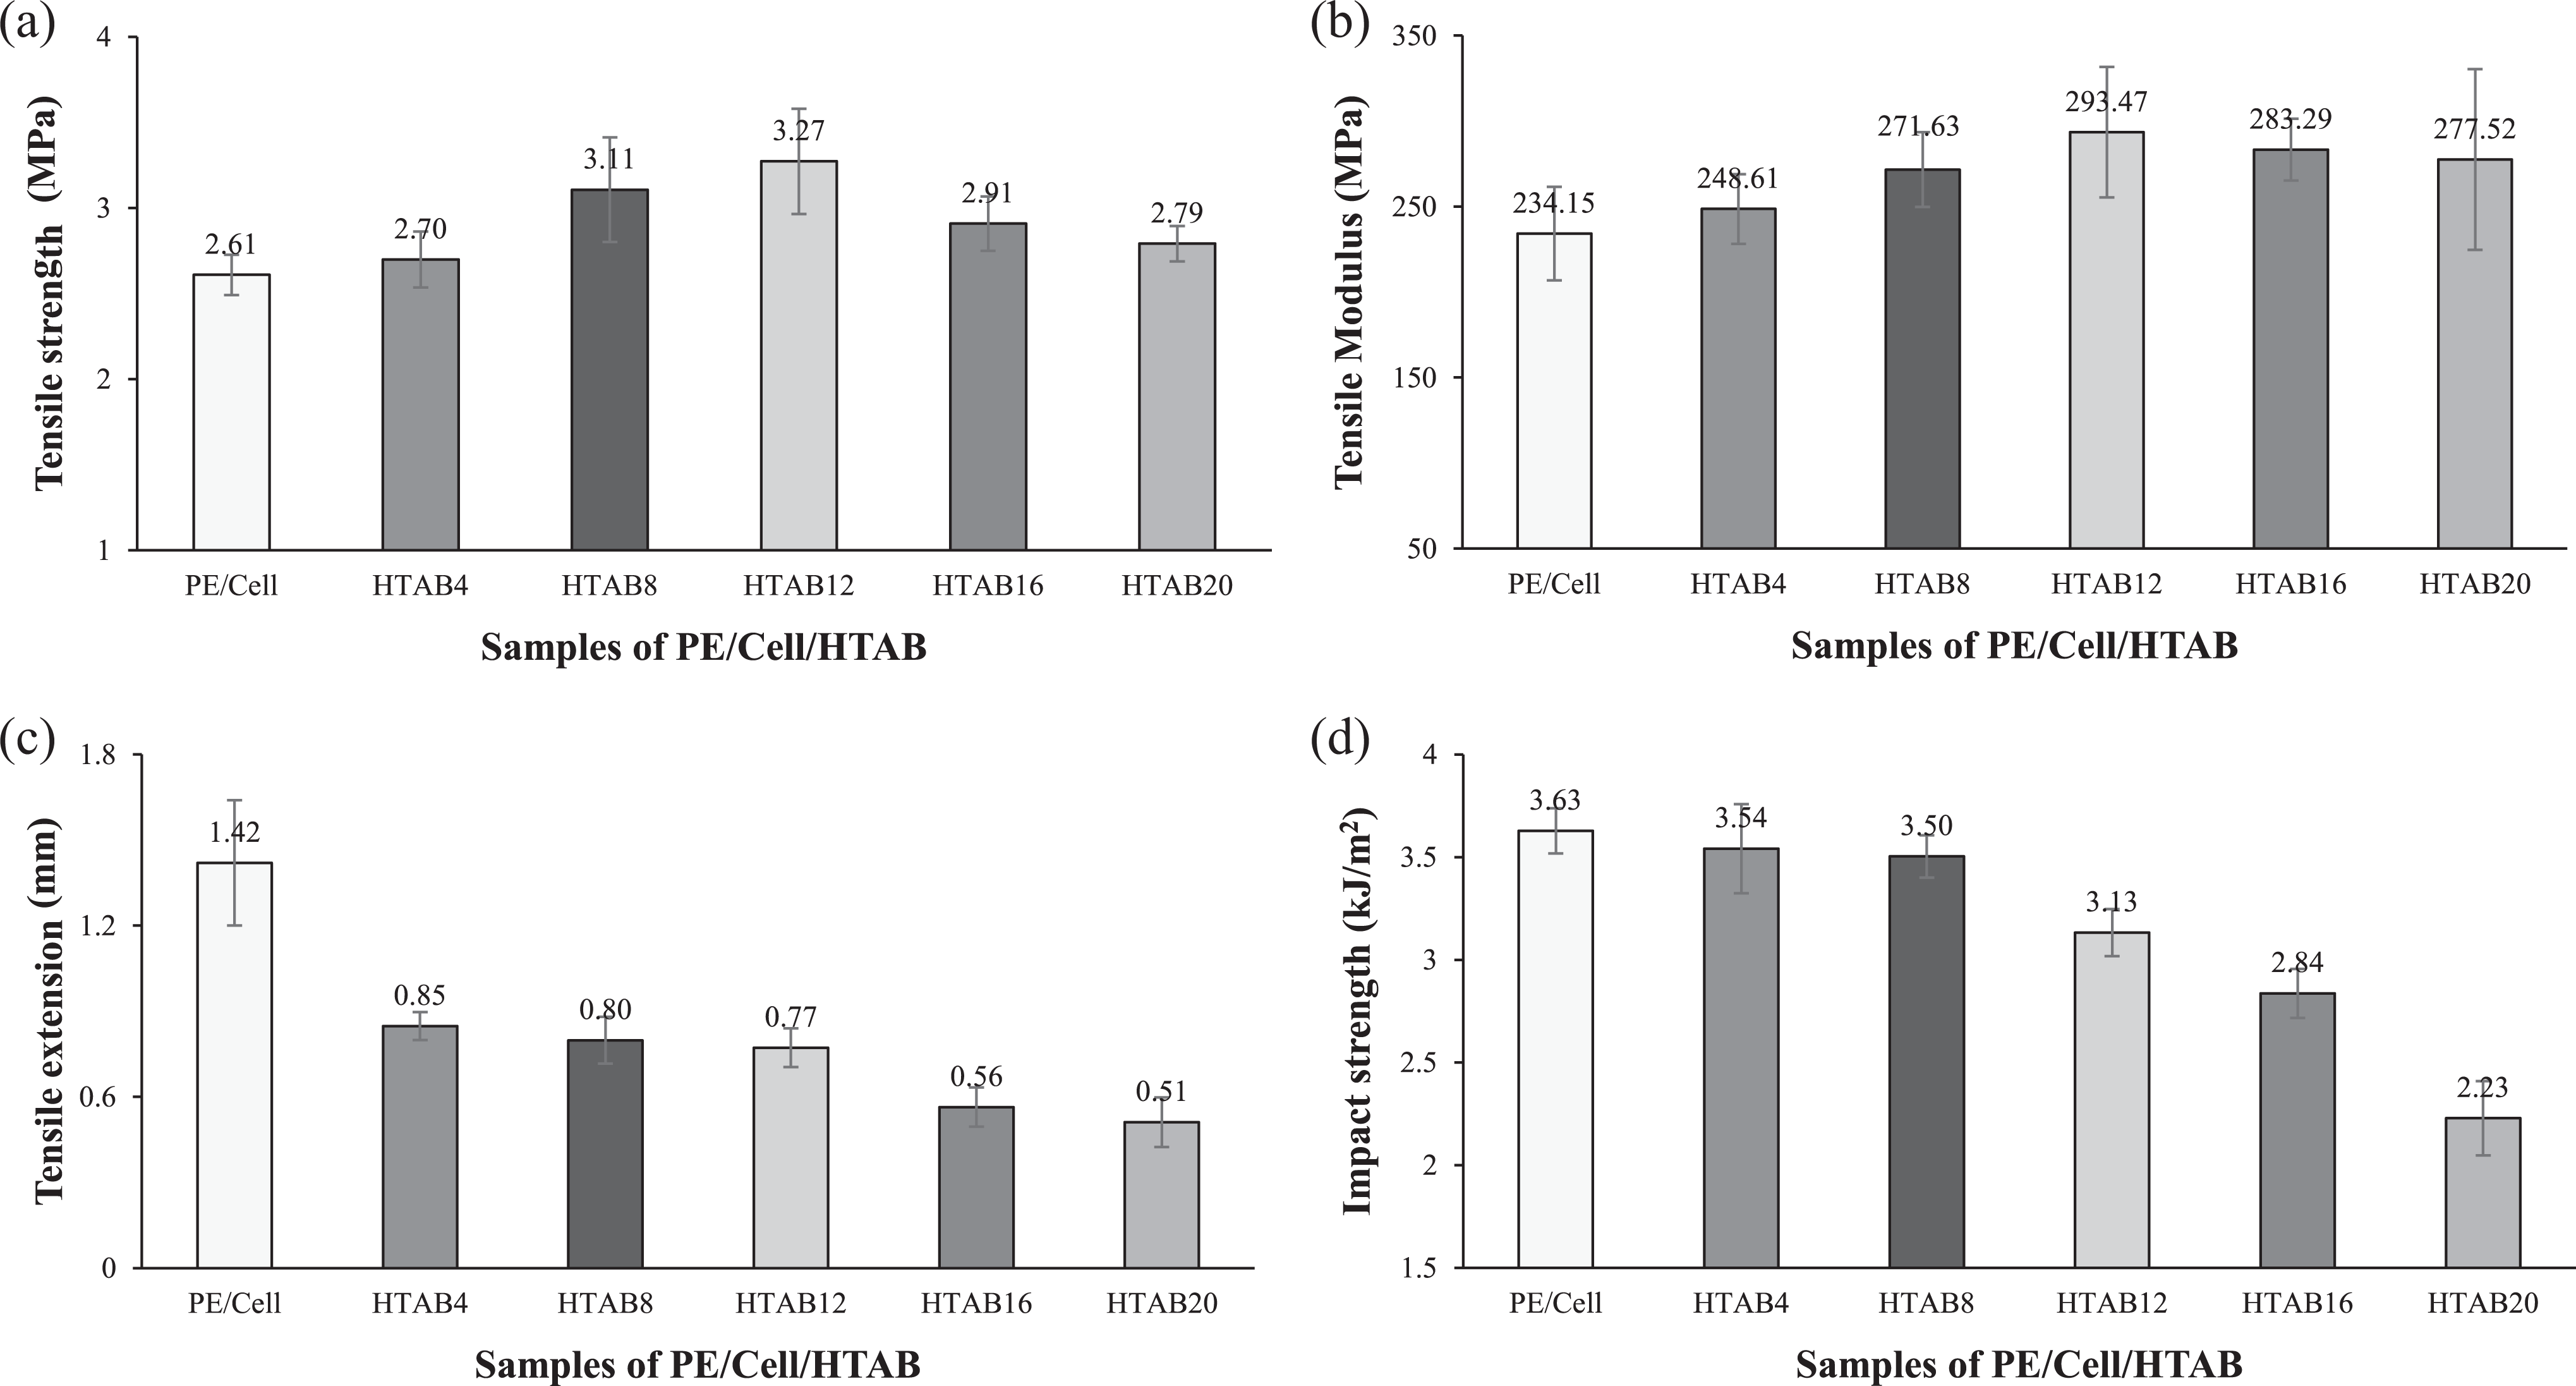
Mechanical properties of HDPE/LDPE/cellulose biocomposites with different weight percentages of HTAB.
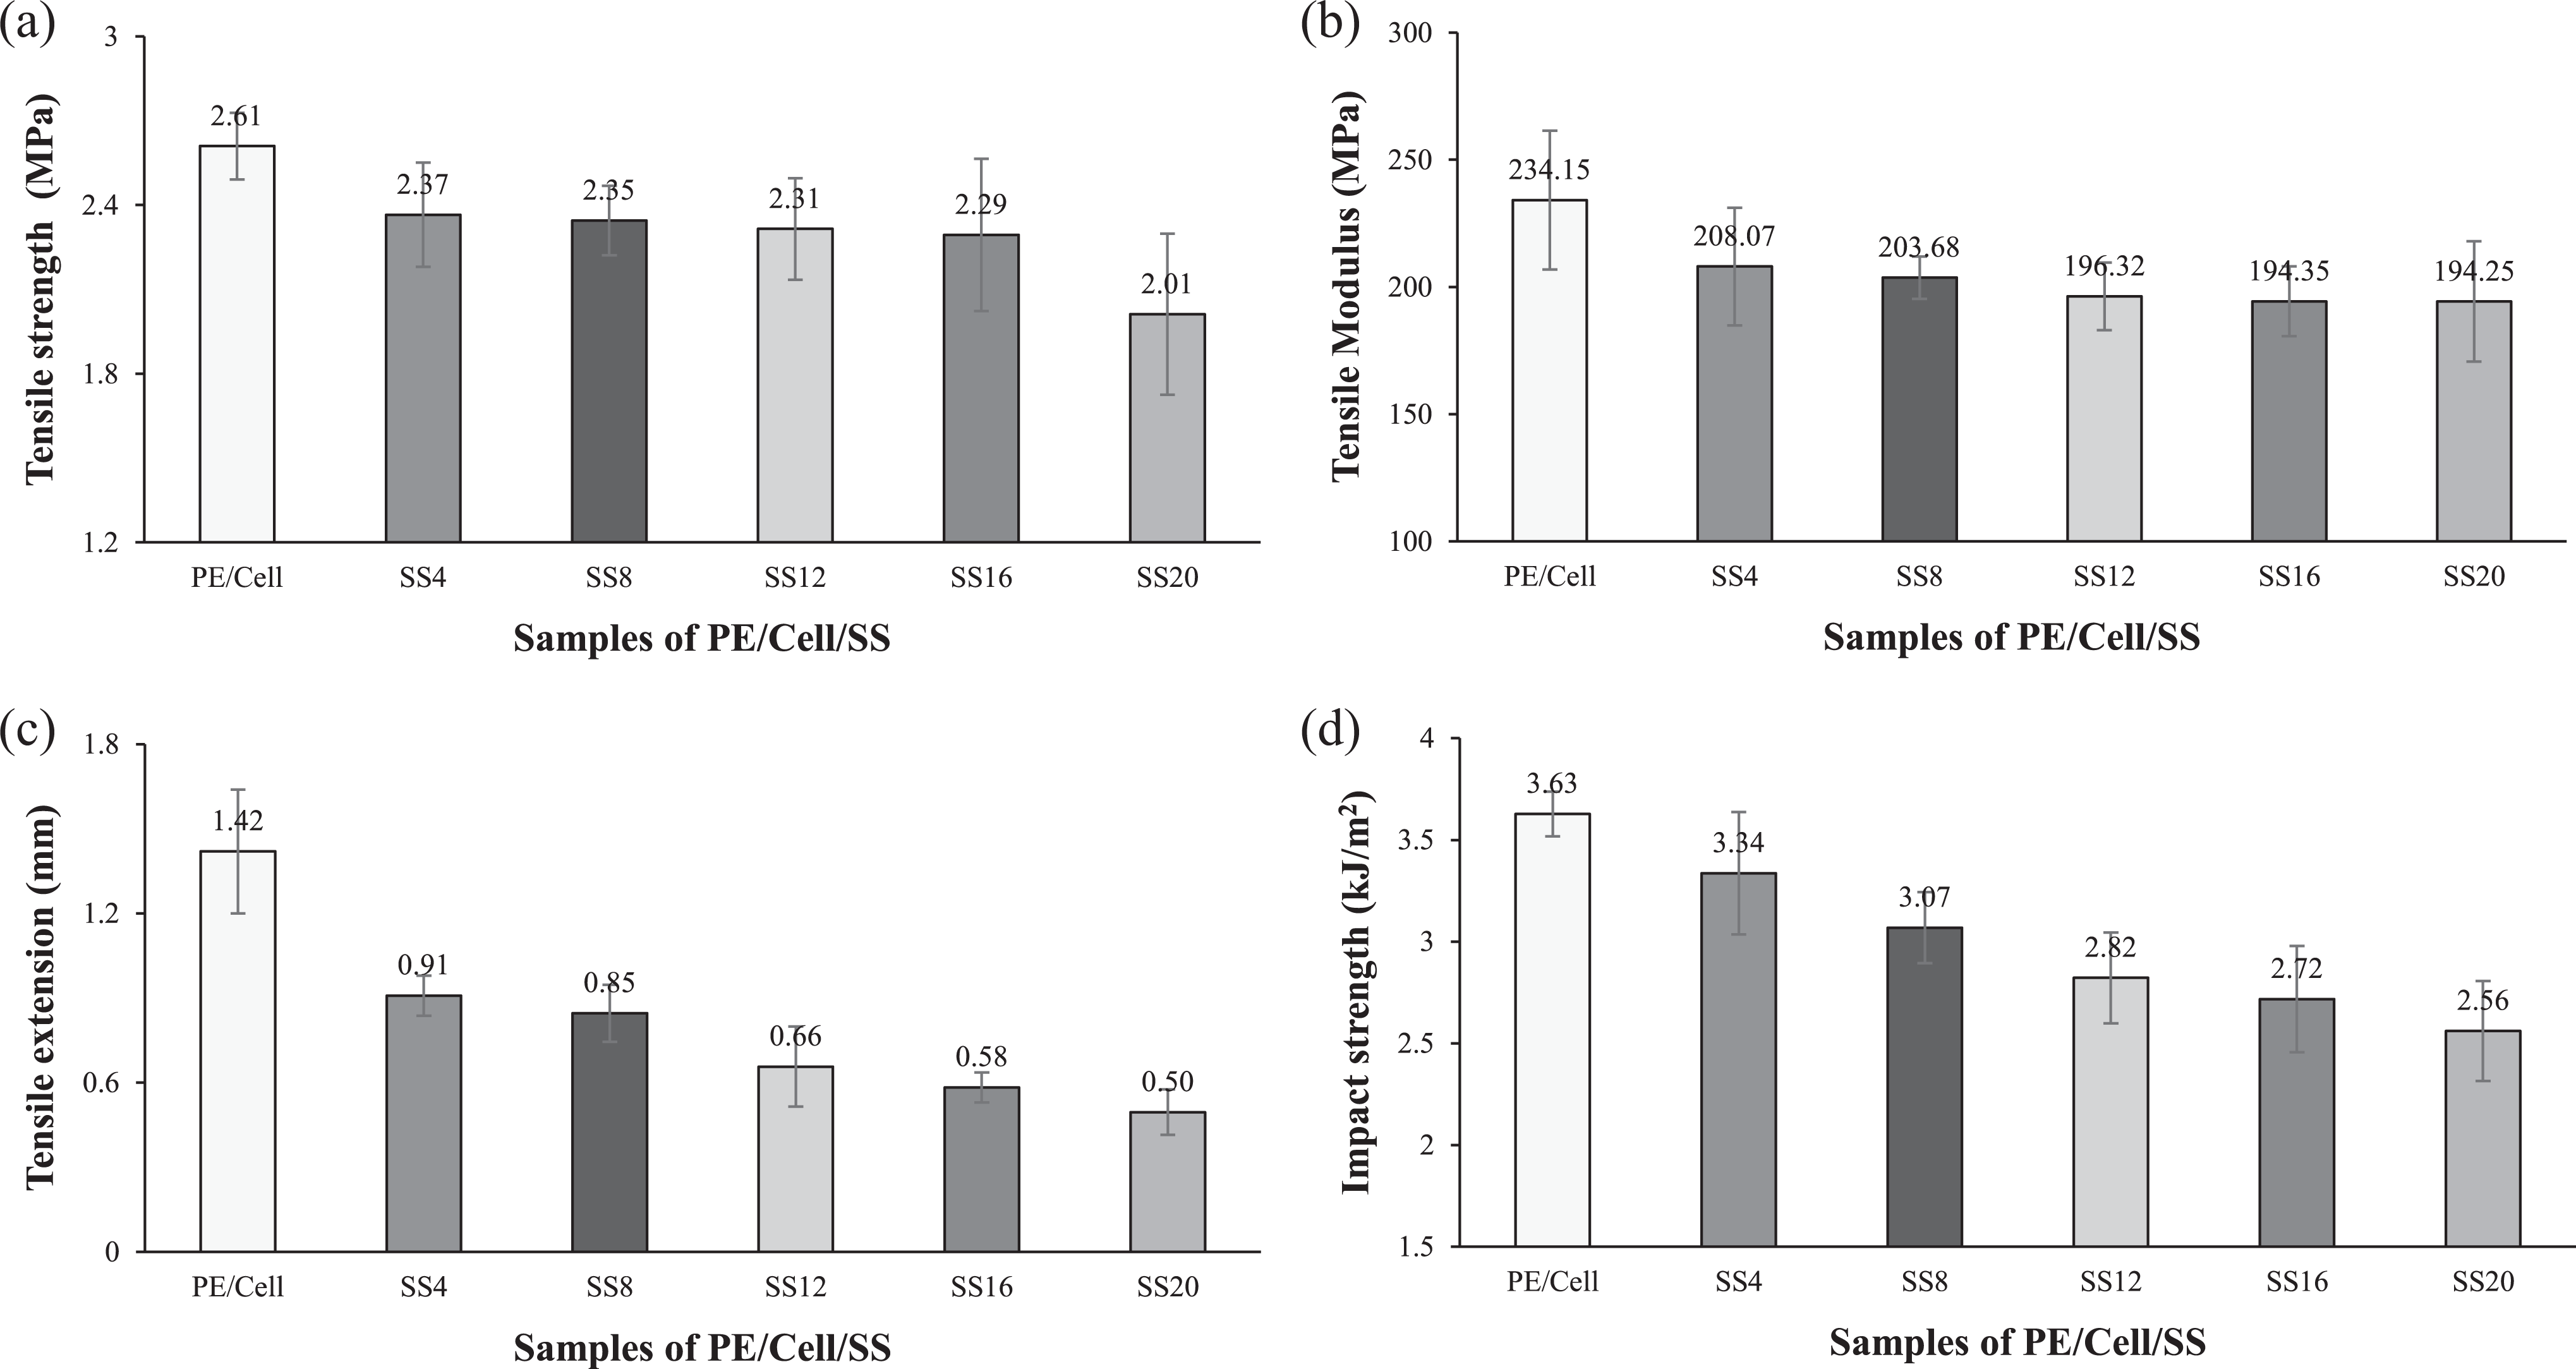
Mechanical properties of HDPE/LDPE/cellulose biocomposites with different weight percentages of SS.
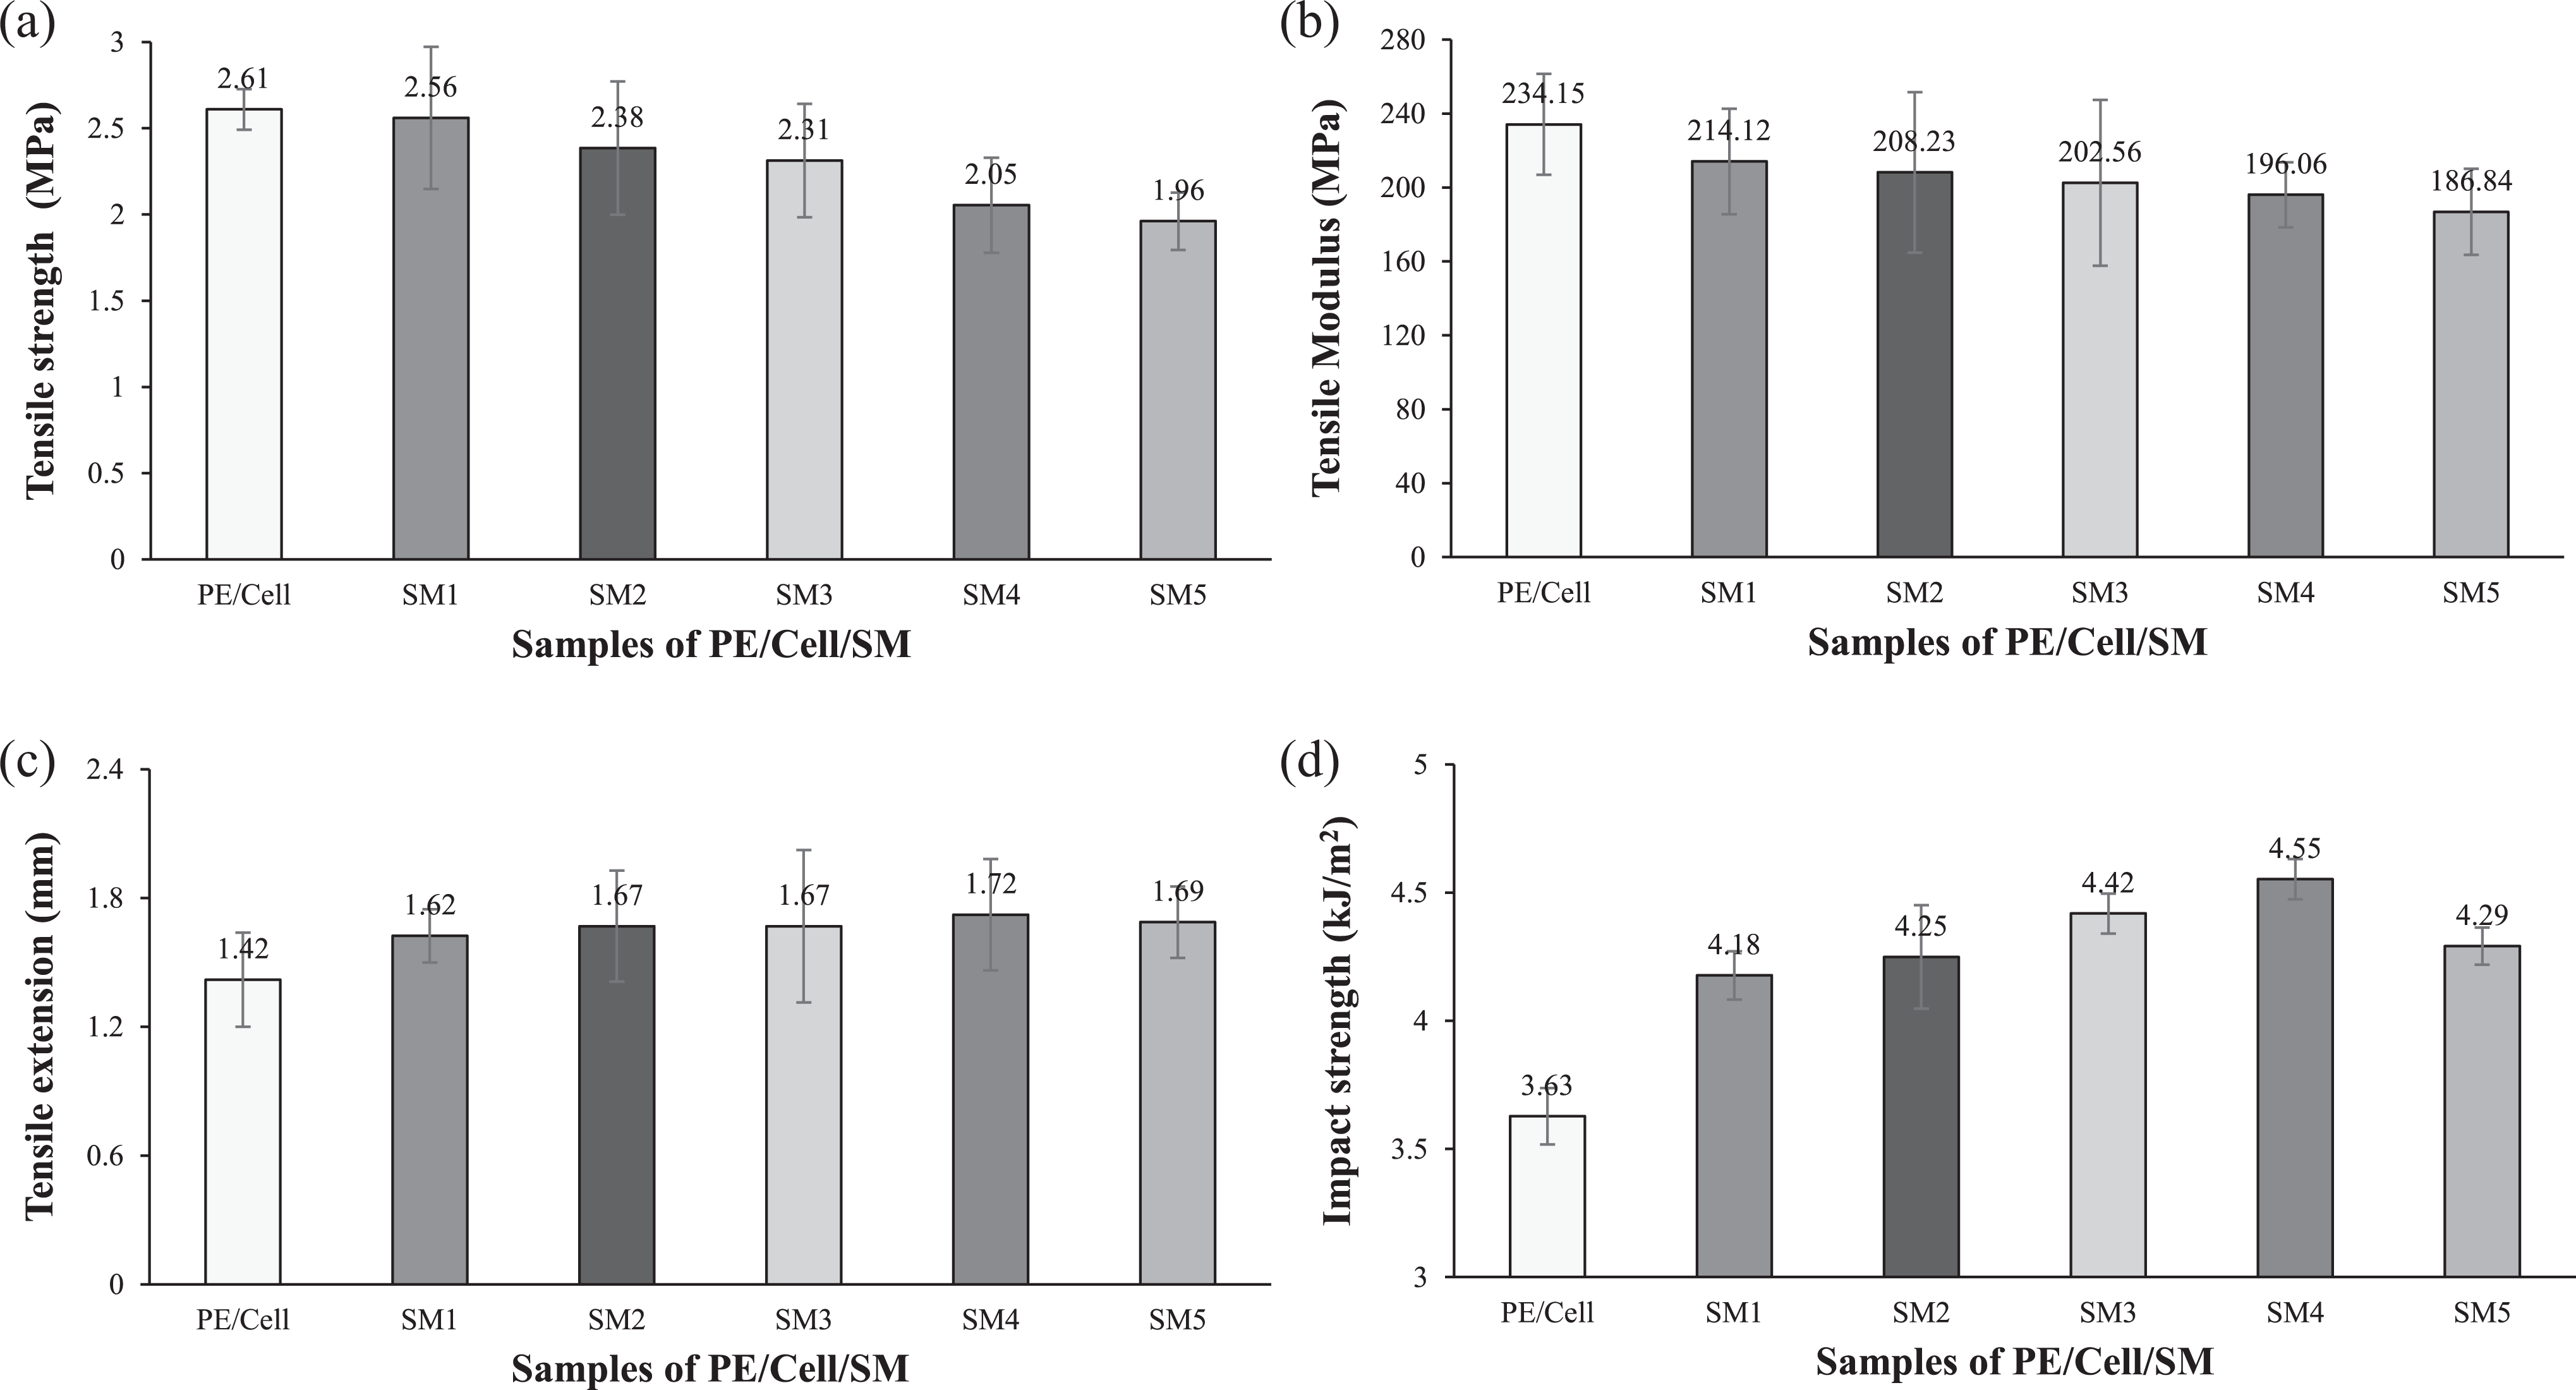
Mechanical properties of HDPE/LDPE/cellulose biocomposites with different weight percentages of SM.
In Figure 7(a) to (d), decreasing trends were seen in impact strength, tensile extension, tensile strength, and tensile modulus after HDPE/LDPE/cellulose biocomposites were added with SS. These showed that the applied tensile strength and impact energy on the biocomposites were unable to be transferred from HDPE/LDPE matrix to cellulose filler. The deterioration of these mechanical properties is an indication of unimproved interfacial adhesion between HDPE/LDPE and cellulose. This implied that SS was unable to provide compatibilizing effect on the biocomposite components. Furthermore, the additional amount of SS was also seen to cause diminution in mechanical properties of the biocomposites. In comparison with other SS-added biocomposites, only PE/Cell/SS4 has showed to have the least decrease of mechanical properties due to the low amount of SS added into the biocomposites. The main role of compatibilizer is to act as matrix/fiber interfacial adhesion enhancer, which result in the increase of stress transfer efficiency from matrix to fiber throughout the biocomposites. 32 The deterioration in mechanical properties of SS-added biocomposites clearly indicated that SS could not act as compatibilizer for the HDPE/LDPE/cellulose biocomposites.
On the other hand, the tensile strength and tensile modulus of SM-added HDPE/LDPE/cellulose biocomposites are shown in Figure 8(a) and (b). The addition of SM has caused the tensile strength and tensile modulus of the biocomposites to decrease continuously. On the contrary, the tensile extension and impact strength (Figure 8(c) and (d)) of the biocomposite were increased from 1 wt% to 4 wt% SM, despite decrement of tensile strength and tensile modulus. This exhibited that the addition of SM has softened the matrix of biocomposites and, thus, deteriorating their ability to withstand high tensile strength. 33 However, the increasing trend of impact strength signified the improvement of impact energy transfer in the biocomposites added with SM. Based on these results, it seemed that the addition of SM has provided plasticizing effect on HDPE/LDPE/cellulose biocomposites. PE/Cell/SM4 was shown to have the highest tensile extension and impact strength, which are increased by 21% and 25%, respectively. However, the addition of 5 wt% SM caused the tensile extension and impact strength to decrease. This is due to oversaturation of SM in the biocomposite, which caused the accumulation to occur and thus, forming a mild tough failure concentrator in the biocomposites. 3 Although the tensile extension and impact strength of PE/Cell/SM5 were lower than PE/Cell/SM4, however their values are still higher than that of the PE/Cell.
Other than that, it seemed that there is slightly large standard deviation for each biocomposite samples. The differences occurred due to the use of compression molding for the preparation of the biocomposite samples. The pressure that is vertically applied on the molten biocomposite compounds has made the HDPE polymer chains to disseminate at various directions of arrangement in the mold cavity. 34 Eventually, the prepared biocomposite samples would have nonlinear orientation of polymer chain. This has caused each of the biocomposite samples to have slightly different values for their tensile strength, tensile modulus, tensile extension, and impact strength.
Morphological observation
The SEM micrographs of the impact-fractured surface of PE/Cell, PE/Cell/HTAB12, PE/Cell/SS4, and PE/Cell/SM4 are shown in Figure 9(a), (b), (c), and (d), respectively. The PE/Cell/HTAB12 was selected, as it showed optimum compatibilizing effect compared with other HTAB-added biocomposites. On the other hand, PE/Cell/SS4 was chosen since it has least deterioration in mechanical properties. Besides that, PE/Cell/SM5 was examined due to its highest tensile extension and impact strength. There are number of holes (in white circle), which are formed by the cellulose fillers pullout, seen on the fractured surface of the biocomposites. The fillers pullout occurred due to the incompatibility of cellulose with most of synthetic polymer matrices. 35 Thus, this has prevented the cellulose from being wetted by the molten HDPE/LDPE, causing poor interfacial adhesion between them. Figure 9(a) exhibited that the number of pullout hole in PE/Cell is quite higher than PE/Cell/HTAB12 and PE/Cell/SM5. This implied that the cellulose was unable to adhere firmly with the HDPE/LDPE, which has led to easy cellulose fillers pullout. 36
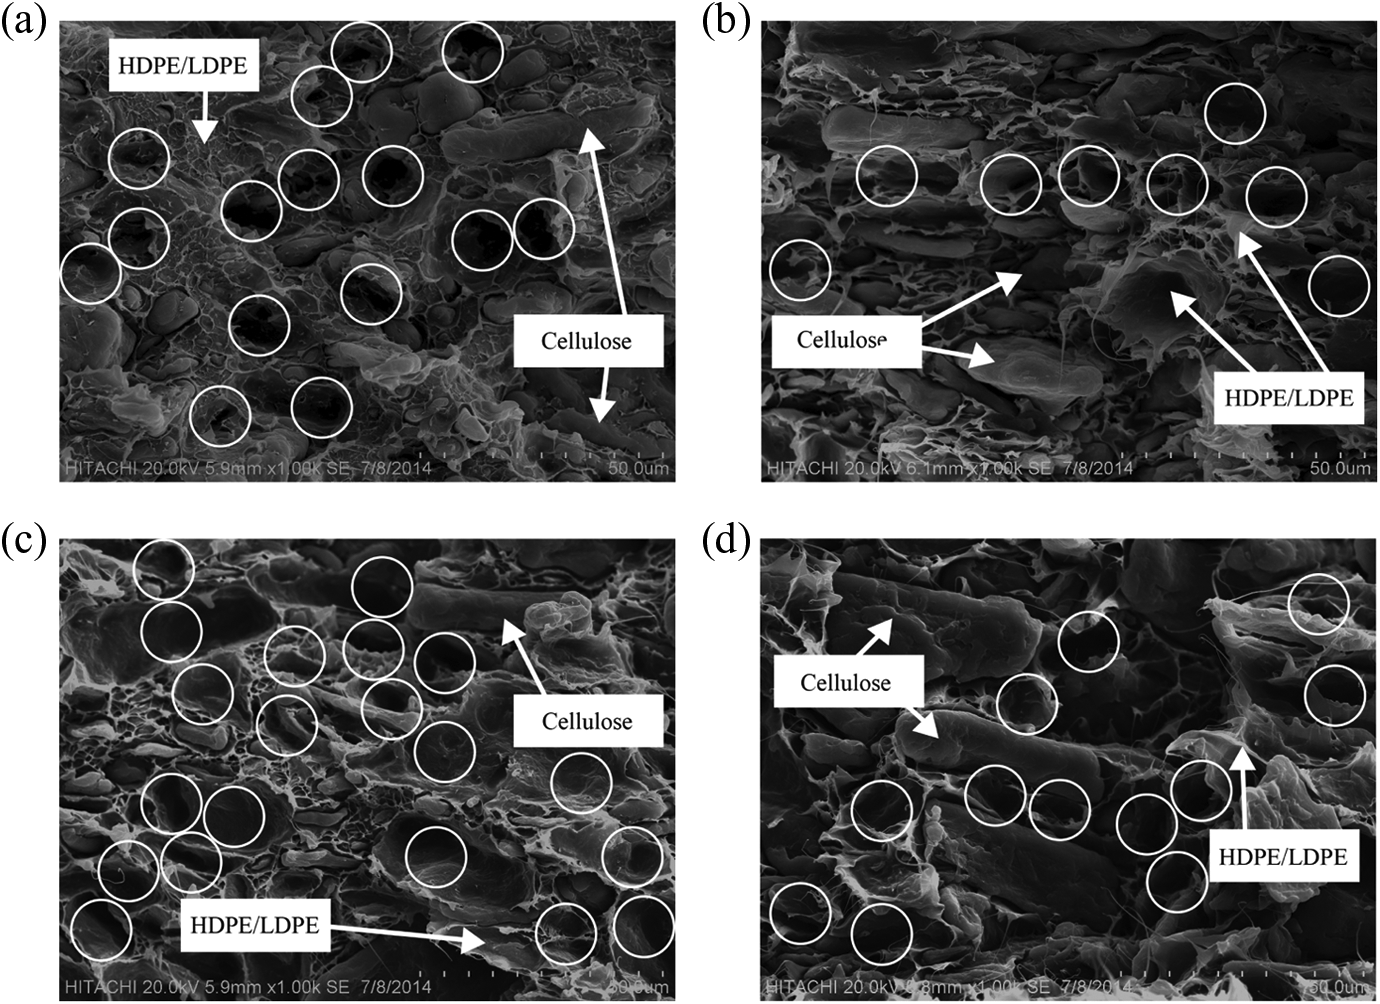
SEM micrographs of the impact fractured surface of (a) PE/Cell, (b) PE/Cell/HTAB, (c) PE/Cell/SS, and (d) PE/Cell/SM at magnification of ×1000.
Based on the SEM micrographs, the addition of HTAB, SS, and SM surfactants has changed the morphology of the fractured surface of HDPE/LDPE/cellulose biocomposites. For PE/Cell/HTAB12, the change in the morphology can be observed with the reduction of pullout holes on its fractured surface compared to PE/Cell. Additionally, the decrease in cellulose fillers pullout on the fracture surface of the biocomposites is related to the enhancement of compatibility between the natural fillers and polymer matrices. 3,4 Therefore, the results of biocomposites added with HTAB indicated that the compatibility of HDPE/LDPE and cellulose can be enhanced by HTAB. Other than that, the number of pullout holes on the fractured surface of PE/Cell/SS4 was greater than the others, which showed that SS was unable to enhance the compatibility between HDPE/LDPE and cellulose. Moreover, the addition of SS was only causing the interfacial adhesion between HDPE/LDPE and cellulose to be worse than that of PE/Cell. Nonetheless, the number of pullout holes in PE/Cell/SM4 was significantly reduced after the addition of SM. This indicated that the surface wettability of the cellulose has been enhanced by SM, allowing it to adhere with HDPE/LDPE in the biocomposites for better impact energy transfer. Less number of pullout holes on PE/Cell/HTAB12 was observed as compared to PE/Cell/SM4, implying that the wetting of the cellulose by the HDPE/LDPE was greatly improved with the addition of HTAB than SM. Hence, referring to the SEM micrographs, the substantial reduction of numbers of pullout holes in the biocomposites added with HTAB indicated that only HTAB has the ability in compatibilizing HDPE/LDPE and cellulose in comparison with SS and SM.
FTIR characterization
Figure 10 exhibited the FTIR spectra of HDPE/LDPE/cellulose biocomposites without and with different types of surfactant. The PE/Cell/HTAB12 and PE/Cell/SS4 were selected as it showed optimum compatibilizing effect and the least deterioration in mechanical properties, respectively. Moreover, PE/Cell/SM5 was chosen, as it has the highest tensile extension and impact strength properties. The spectra bands at 3337 to 3357 cm−1 represent the O–H stretching vibration of alcohol group. 37 The bands with strong intensity at 2913 and 2847 cm−1 are corresponding to CH2 asymmetric and CH2 symmetric stretching vibrations of methylene groups, respectively. 38 The bands at region of 1736 to 1707 cm−1 in PE/Cell/SS4 and PE/Cell/SM4, which have weak intensity are attributable to C=O stretching vibration of carbonyl group. 39,40 This is owing to the presence of ester group in SS and SM. Besides that, all of the biocomposites were seen to have similar appreciable band with strong intensity at 1464 cm−1, which ascribed to C–H bending deformation. 26 On the other hand, the noticeable bands at 1028 to 1027 cm−1 corresponded to C–O stretching of alcohol group were shown with medium to strong intensity. 41,42 The bands with strong intensity at 720 to 719 cm−1 are due to CH2 rocking of methylene group. 43 Additionally, the bands with weak intensity at 435 to 430 cm−1 are assigned to CH3 wagging, whereas the bands with medium intensity, which is found in the range of 344 to 342 cm−1 are due to C–C out-of-plane bending. 27
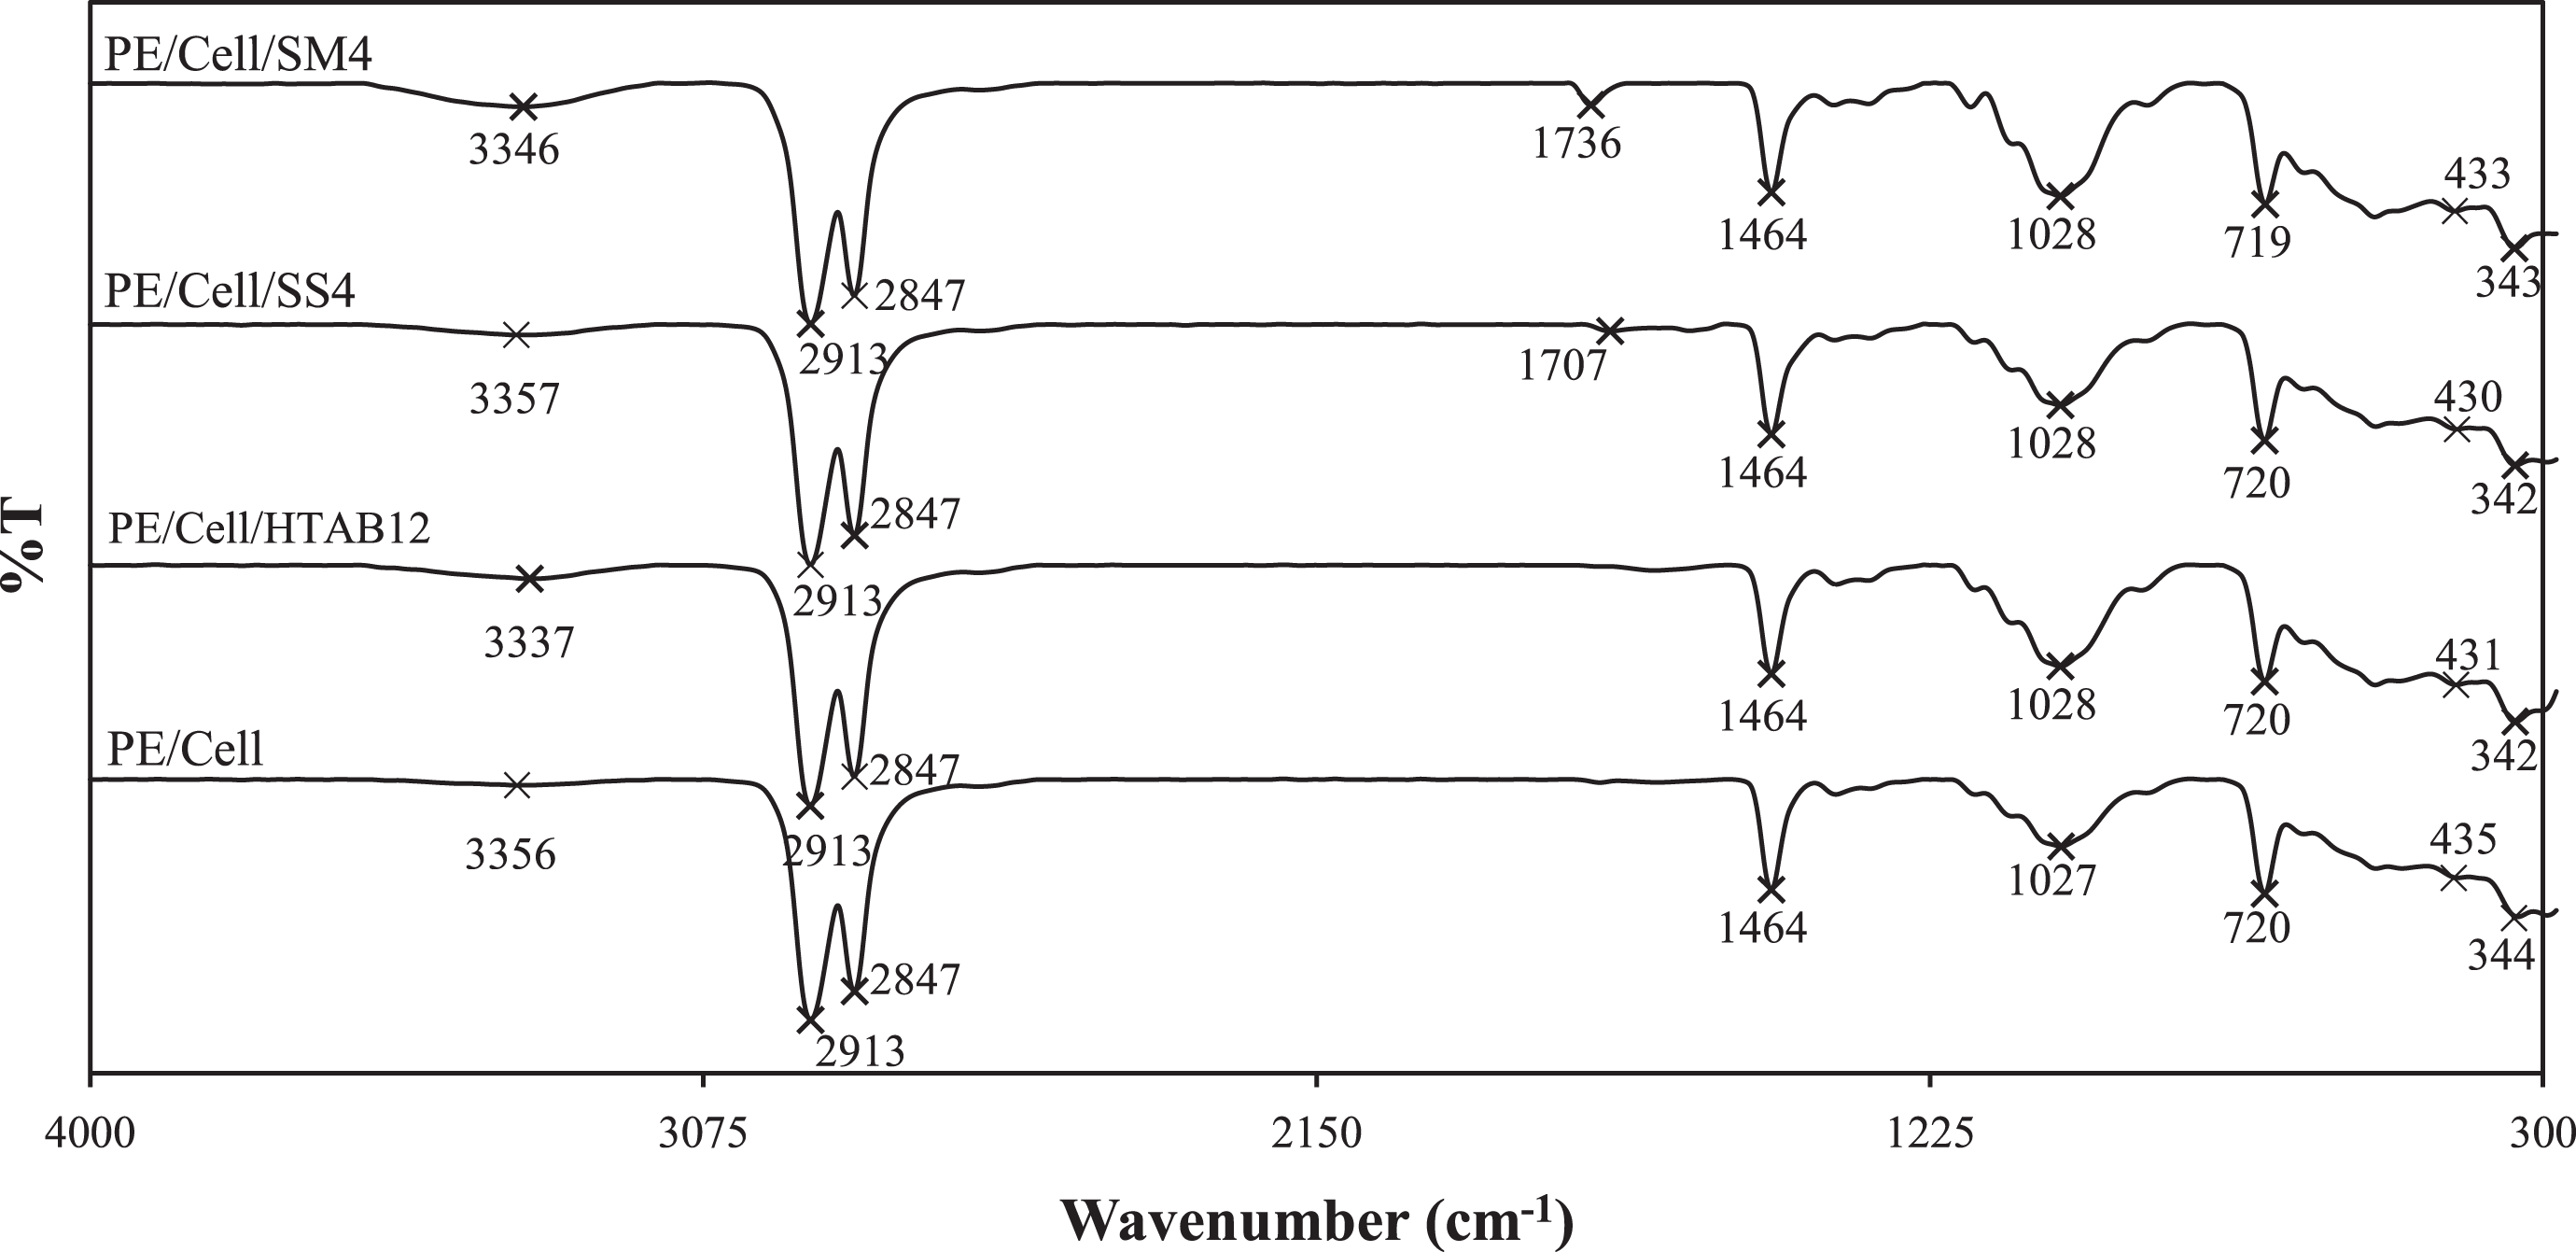
FTIR spectra of HDPE/LDPE/cellulose biocomposites with different types of surfactant.
The wave numbers of O–H stretching of alcohol group in PE/Cell/HTAB12 and PE/Cell/SM4 have shifted to lower wave numbers in comparison with PE/Cell. For PE/Cell/HTAB12, the shift was due to the interactions between the polar quaternary ammonium cationic groups (+) of HTAB 37 with the weakly negatively charged (δ−) of polar hydroxyl groups of cellulose via ion–dipole force. 27 Whereas, the obtained result for PE/Cell/SM4 indicated formation of hydrogen bonding between polar hydroxyl groups of SM and polar hydroxyl groups of cellulose. 3 However, the O–H stretching of alcohol groups in PE/Cell/SS4 was slightly shifted to higher wave number, implying that the polar carboxylate anionic groups (−) of SS has not formed any specific interactions with the hydroxyl groups of cellulose. The shift toward higher wave numbers for C–O stretching of alcohol group in PE/Cell/HTAB12, PE/Cell/SS4, and PE/Cell/SM4 demonstrated the decreases of intermolecular hydrogen bonding of cellulose. 44 On the other hand, the bands of CH2 rocking in PE/Cell/SM4 as well as the bands of CH3 wagging and C–C bending in PE/Cell/HTAB12, PE/Cell/SS4, and PE/Cell/SM4 have shifted to lower wave numbers due to hydrophobic–hydrophobic interactions between the nonpolar alkyl groups of surfactants with the nonpolar groups of HDPE/LDPE. 3 For that reason, the FTIR spectra have exhibited the presence of intermolecular interactions between HDPE/LDPE and cellulose by the addition of HTAB and SM surfactants. HTAB has the capability to form hydrophobic–hydrophobic interactions and ion–dipole force between HDPE/LDPE and cellulose, while the intermolecular interactions in the biocomposite added with SM occurred through hydrophobic–hydrophobic interactions and hydrogen bonding. The suggested interactional structures of the HDPE/LDPE/cellulose biocomposites with different types of surfactant are presented in Figure 11. Additionally, these interactions were also an indication of enhanced compatibility between HDPE/LDPE and cellulose. Nonetheless, no specific interactions were formed between the HDPE/LDPE and cellulose in the SS-added biocomposite since SS was unable to act as a mediator for intermolecular interactions in HDPE/LDPE/cellulose biocomposites. Besides that, there were also no additional bands in the FTIR spectra appeared, which indicated that the chemical structures of the biocomposite components were not changed after the addition of HTAB, SS, and SM.
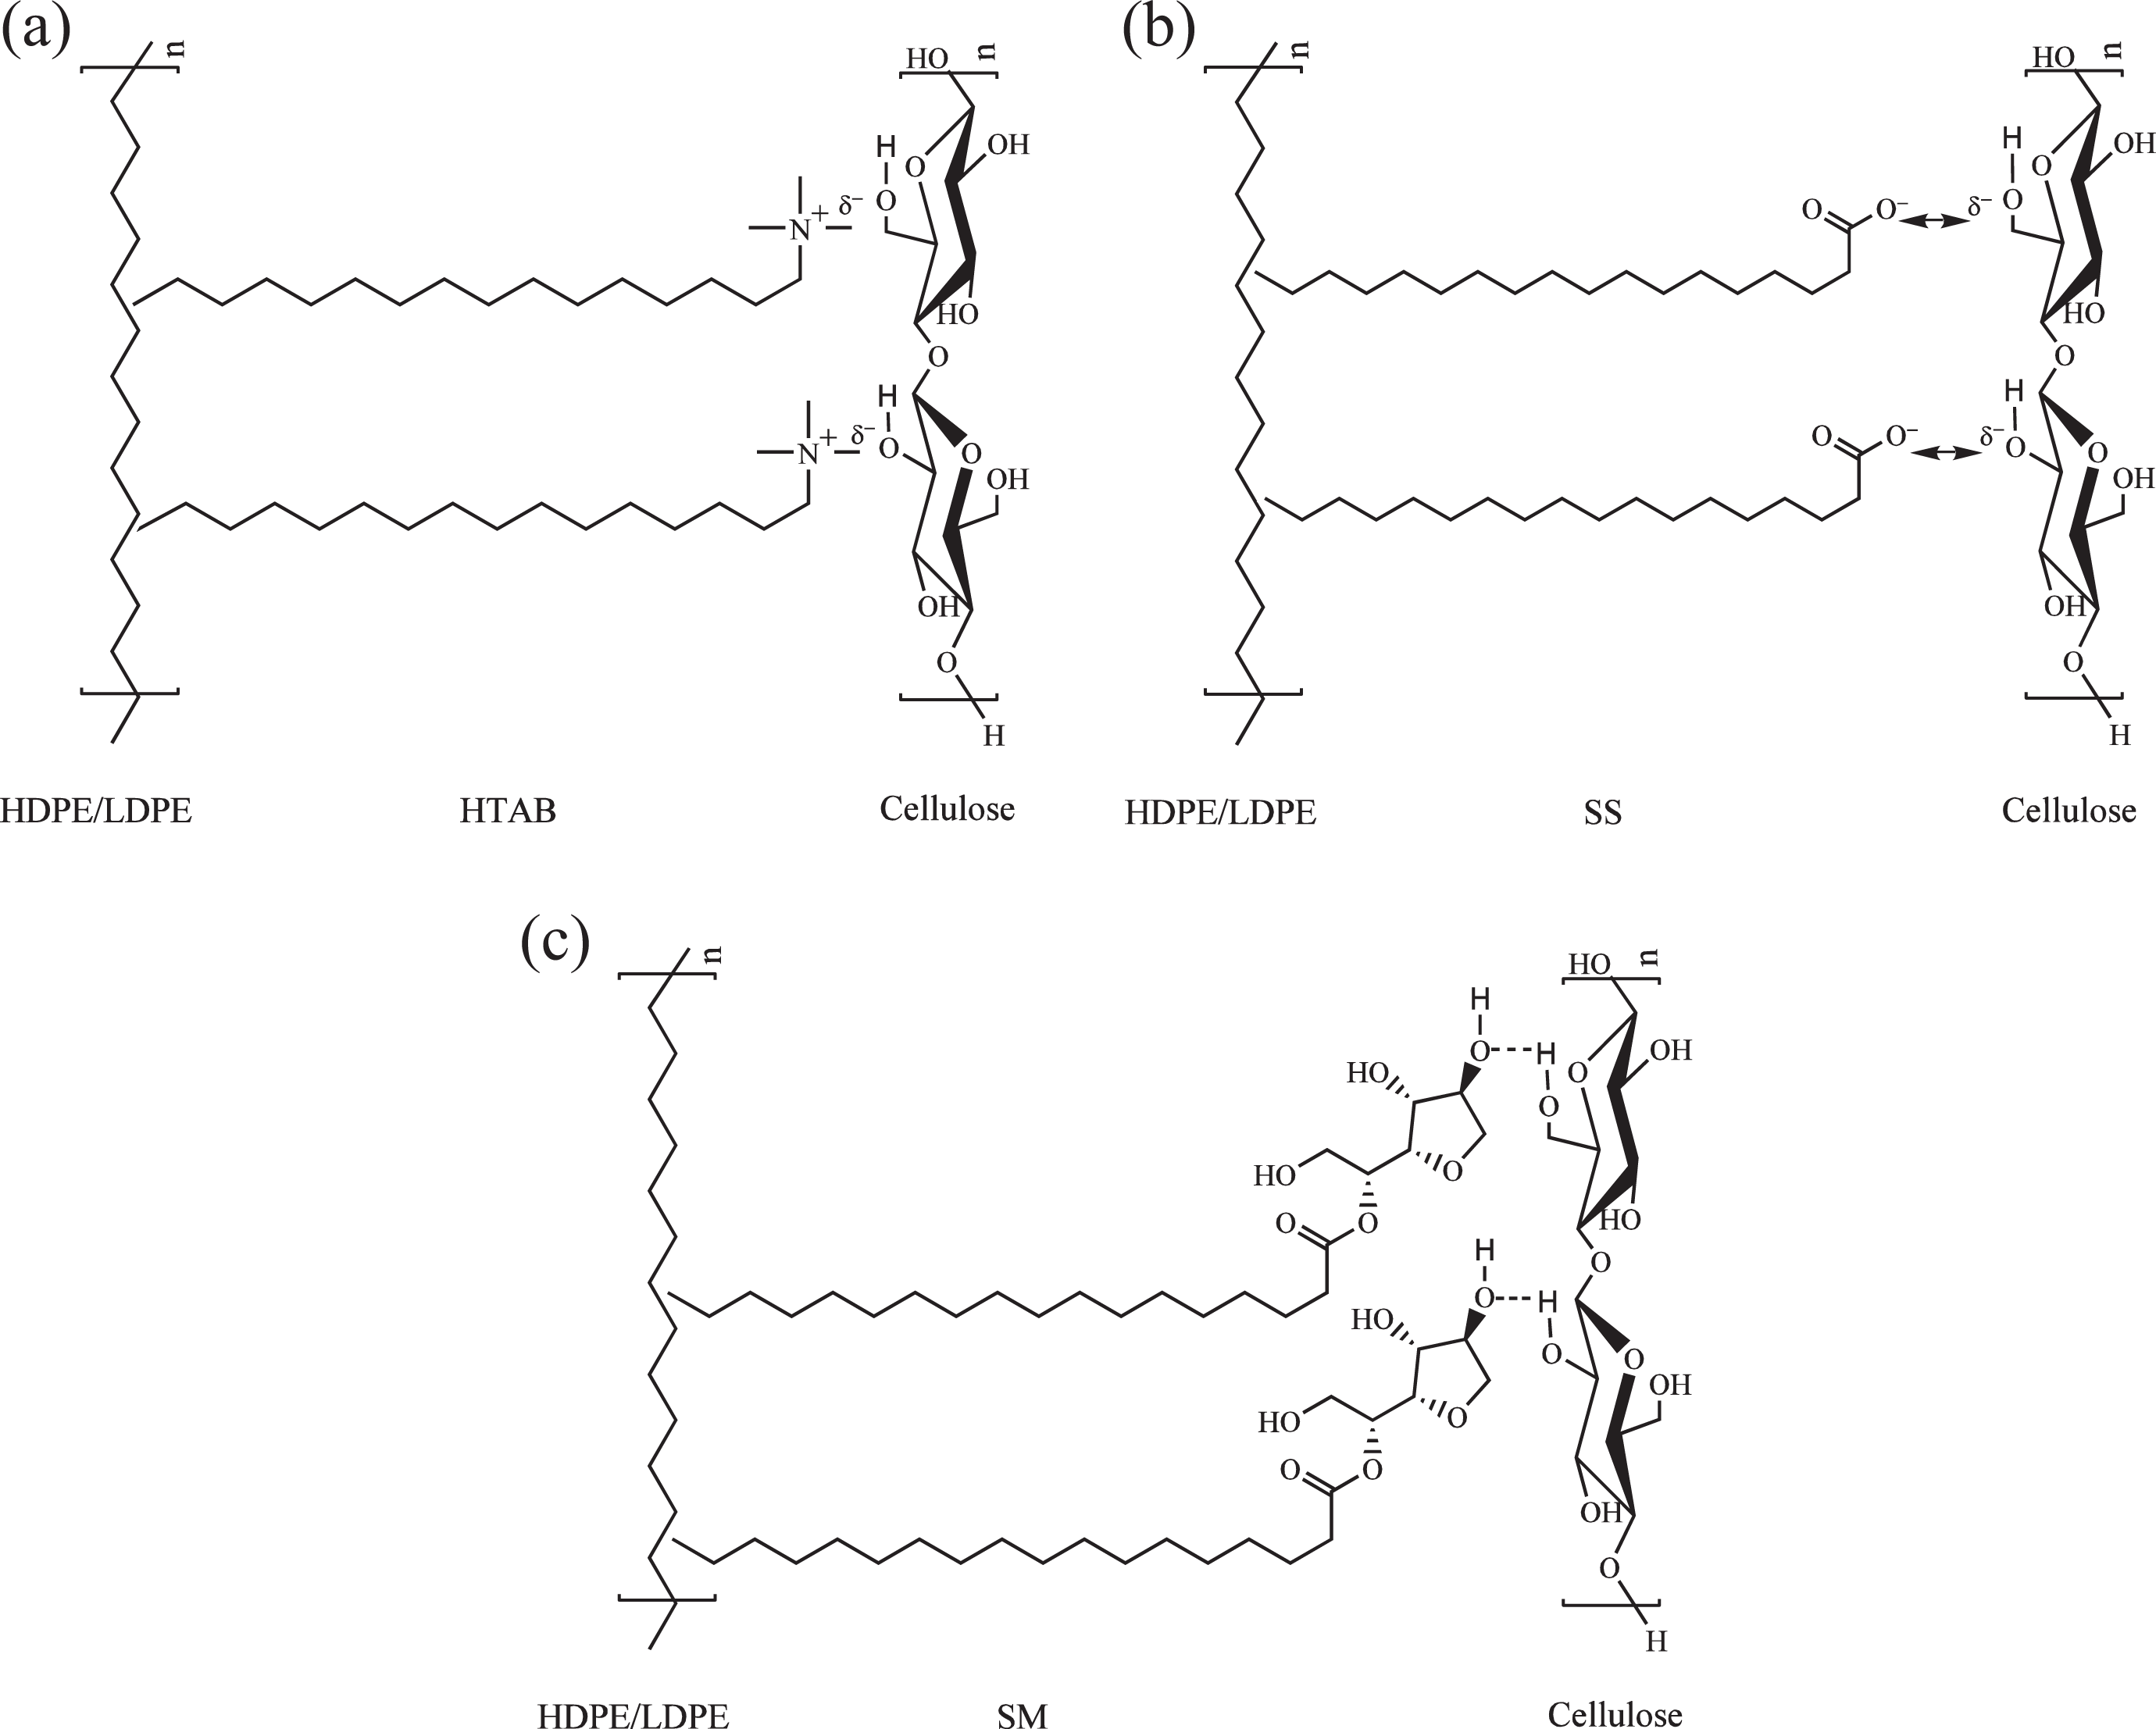
Suggested interactional structures of HDPE/LDPE/cellulose biocomposites with (a) HTAB 26 , (b) SS, and (c) SM.
XRD characterization
The XRD patterns of HDPE/LDPE/cellulose biocomposites with different types of surfactants are presented in Figure 12. From the results obtained, each of the biocomposites possessed two main diffraction peaks. The first peaks at 2θ values of 22.2° and 22.3° are the reflection of the (110) planes of PE. 45 Whereas, the second peaks at 24.5° and 24.6° represented the (200) planes of PE. 46 PE/Cell demonstrated highest intensity for both diffraction peaks, which exhibited that it possessed higher degree of crystallinity than the other biocomposites. This circumstance is related to the ordered structures of HDPE/LDPE chain segments in the biocomposites. 3 It is clearly seen that peak intensities of PE/Cell/HTAB12, PE/Cell/SS4, and PE/Cell/SM4 are lower compared to that of PE/Cell. These results indicated that the peak intensities have significantly reduced with the addition of the used surfactants, which also corresponded to the decrement of crystalline phase in the biocomposites. 47
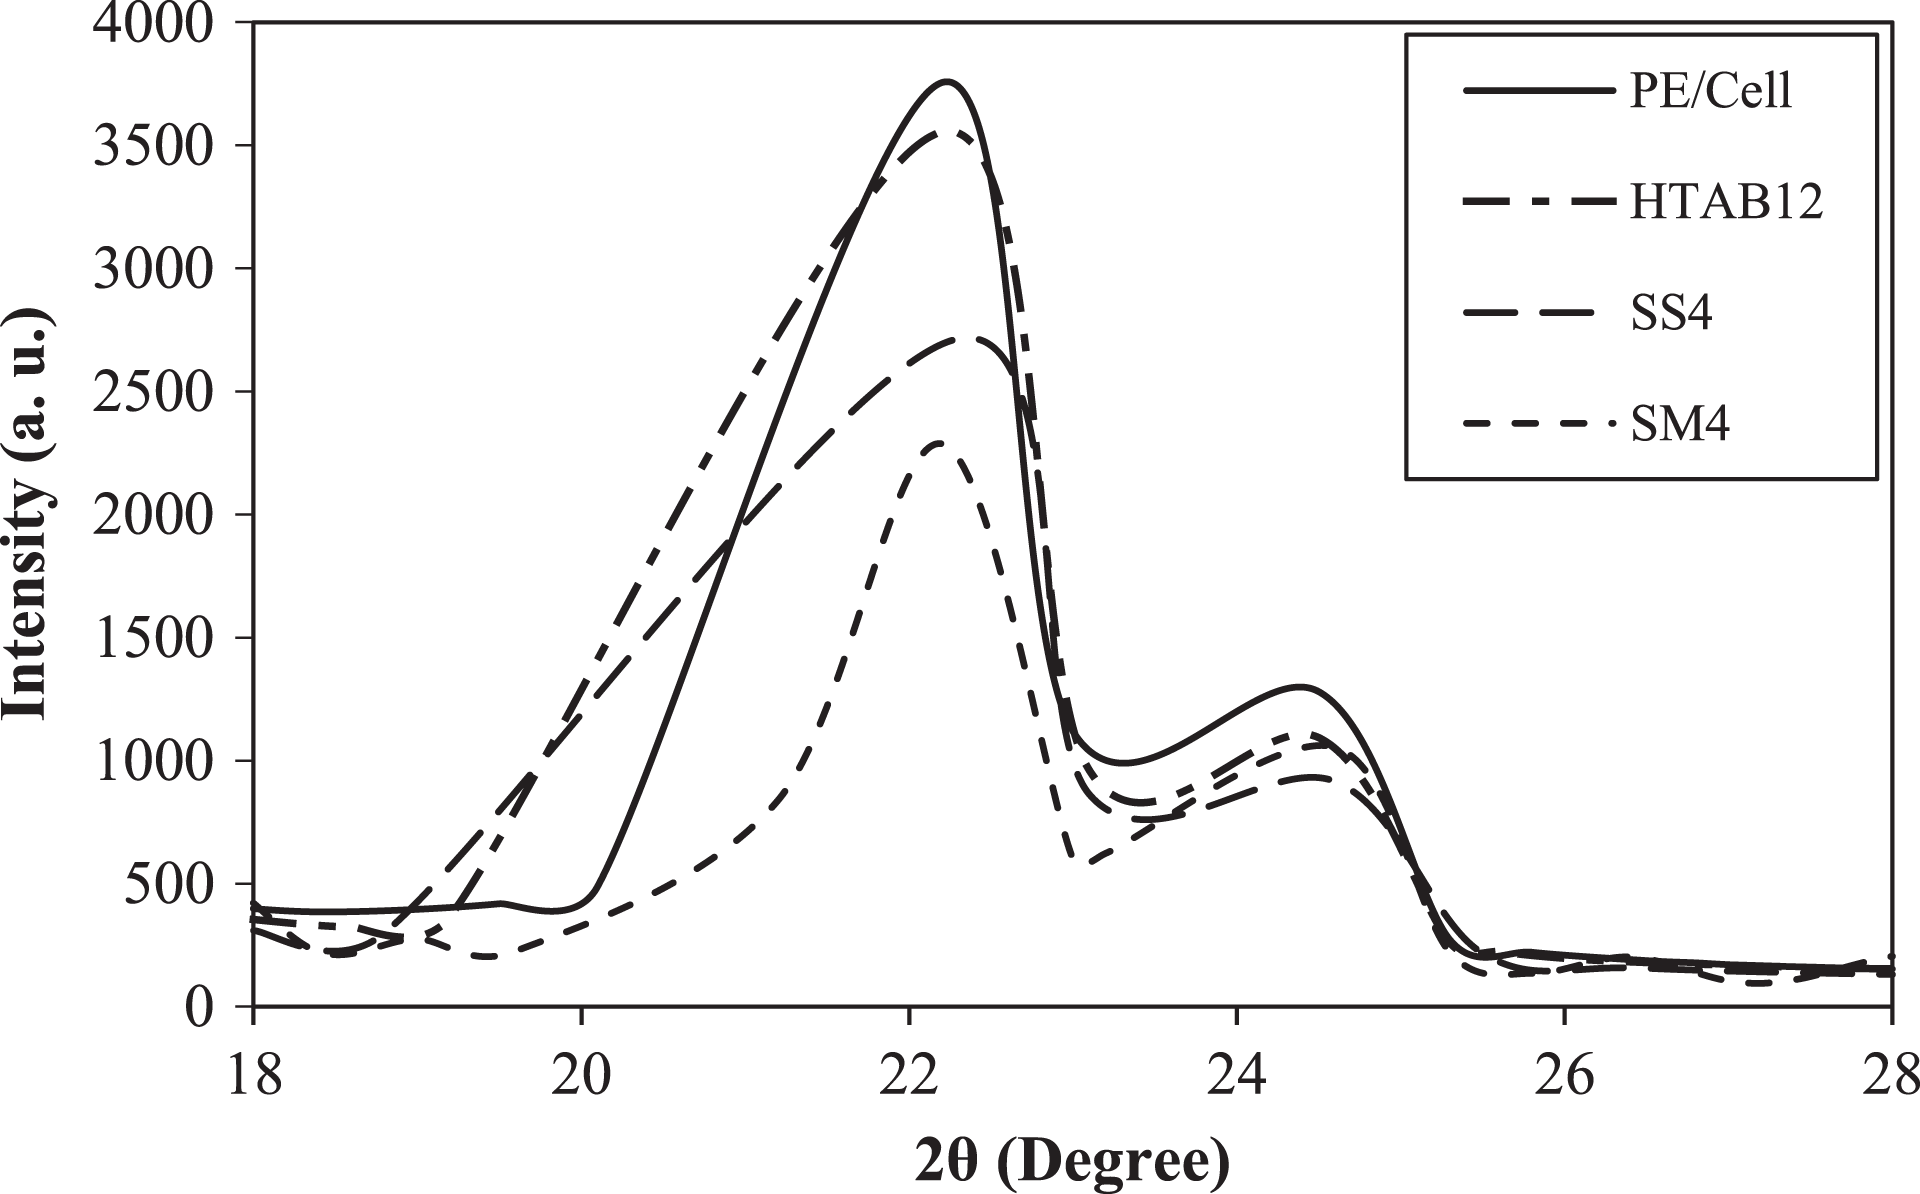
XRD patterns of HDPE/LDPE/cellulose biocomposites with different types of surfactant.
The degree of crystallinity decreased if there are any interactions between the natural filler and polymer matrix. 48 The decreases of peak intensity of both diffraction peaks of PE/Cell/HTAB12 signified the presence of interactions between the HDPE/LDPE and cellulose. The slight decrease in peak intensities in PE/Cell/HTAB12 was due to the presence of crystal structure of HTAB in the biocomposites. Nevertheless, the peak intensity of both diffraction peaks of PE/Cell/SS4 were also decreased, although no specific interaction between the HDPE/LDPE and cellulose was detected on the FTIR spectra in the previous discussion. This is possibly as a result of hydrophobic–hydrophobic interactions between the nonpolar alkyl groups of SS with the nonpolar groups of HDPE/LDPE that caused difficulties in crystallization of HDPE/LDPE molecular chain. 49,50 On the other hand, similar trend of decreases were also showed in PE/Cell/SM4, indicating the interfacial adhesion between HDPE/LDPE and cellulose was improved. On top of that, no additional isotropic peaks were observed on the XRD patterns for all the biocomposites. This specified that the interactions formed by the surfactant between the biocomposite components were in the form of physical interactions, instead of strong chemical bond (covalent bond), which would change the chemical structures of the biocomposite components. 3
TGA characterization
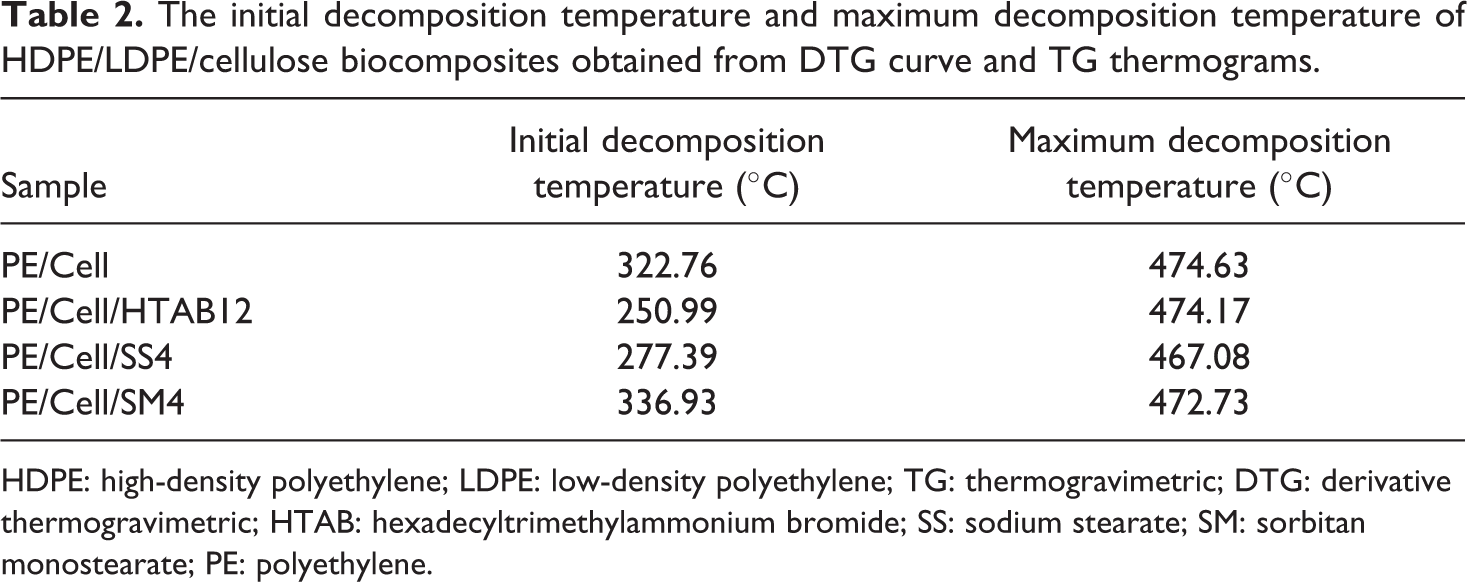
The thermal stability of the HDPE/LDPE/cellulose biocomposites with the addition of different types of surfactant was characterized using TGA. The derivative TG curves and TG thermograms of the biocomposites are shown in Figure 13(a) and (b), respectively. Table 2 presents the initial decomposition temperature (at 10% weight loss) and the maximum decomposition temperature of the biocomposites. The initial decomposition temperatures of PE/Cell, PE/Cell/HTAB12, PE/Cell/SS4, and PE/Cell/SM4 samples are 324.76, 250.99, 277.39, and 336.93°C, respectively. PE/Cell was exhibited to have two stages of decomposition. The first stage of decomposition for the PE/Cell is considerably attributed to the thermal decomposition of the cellulose, 51 while the second ones are the thermal decomposition of the HDPE/LDPE. 12 On the other hand, PE/Cell/HTAB12 and PE/Cell/SS4 were decomposed in three stages. The first and second stages are the decomposition of surfactants and cellulose, respectively, while the third stage is corresponding to the HDPE/LDPE. 3 It was seen that the addition of HTAB and SS have decreased the initial decomposition temperature values in comparison with PE/Cell. The decreases are correlated with the lower initial decomposition temperature of the surfactant compared to other biocomposite components. Moreover, the initial decomposition temperature value of PE/Cell/HTAB12 was lower than PE/Cell/SS4 due to the fact that HTAB decomposed at much lower temperature value than SS. 52,53 Conversely, the addition of SM has not affected the decomposition stages of the biocomposite as PE/Cell/SM4 decomposed in two stages, which is similar with the PE/Cell. The first stage of decomposition in PE/Cell/SM4 was related to cellulose, whereas the HDPE/LDPE and SM decomposed in the second stage. However, the initial decomposition temperature value of PE/Cell/SM4 was higher than that of PE/Cell. This is probably due to the addition of SM, which has higher initial decomposition temperature value relative to cellulose. 51,54
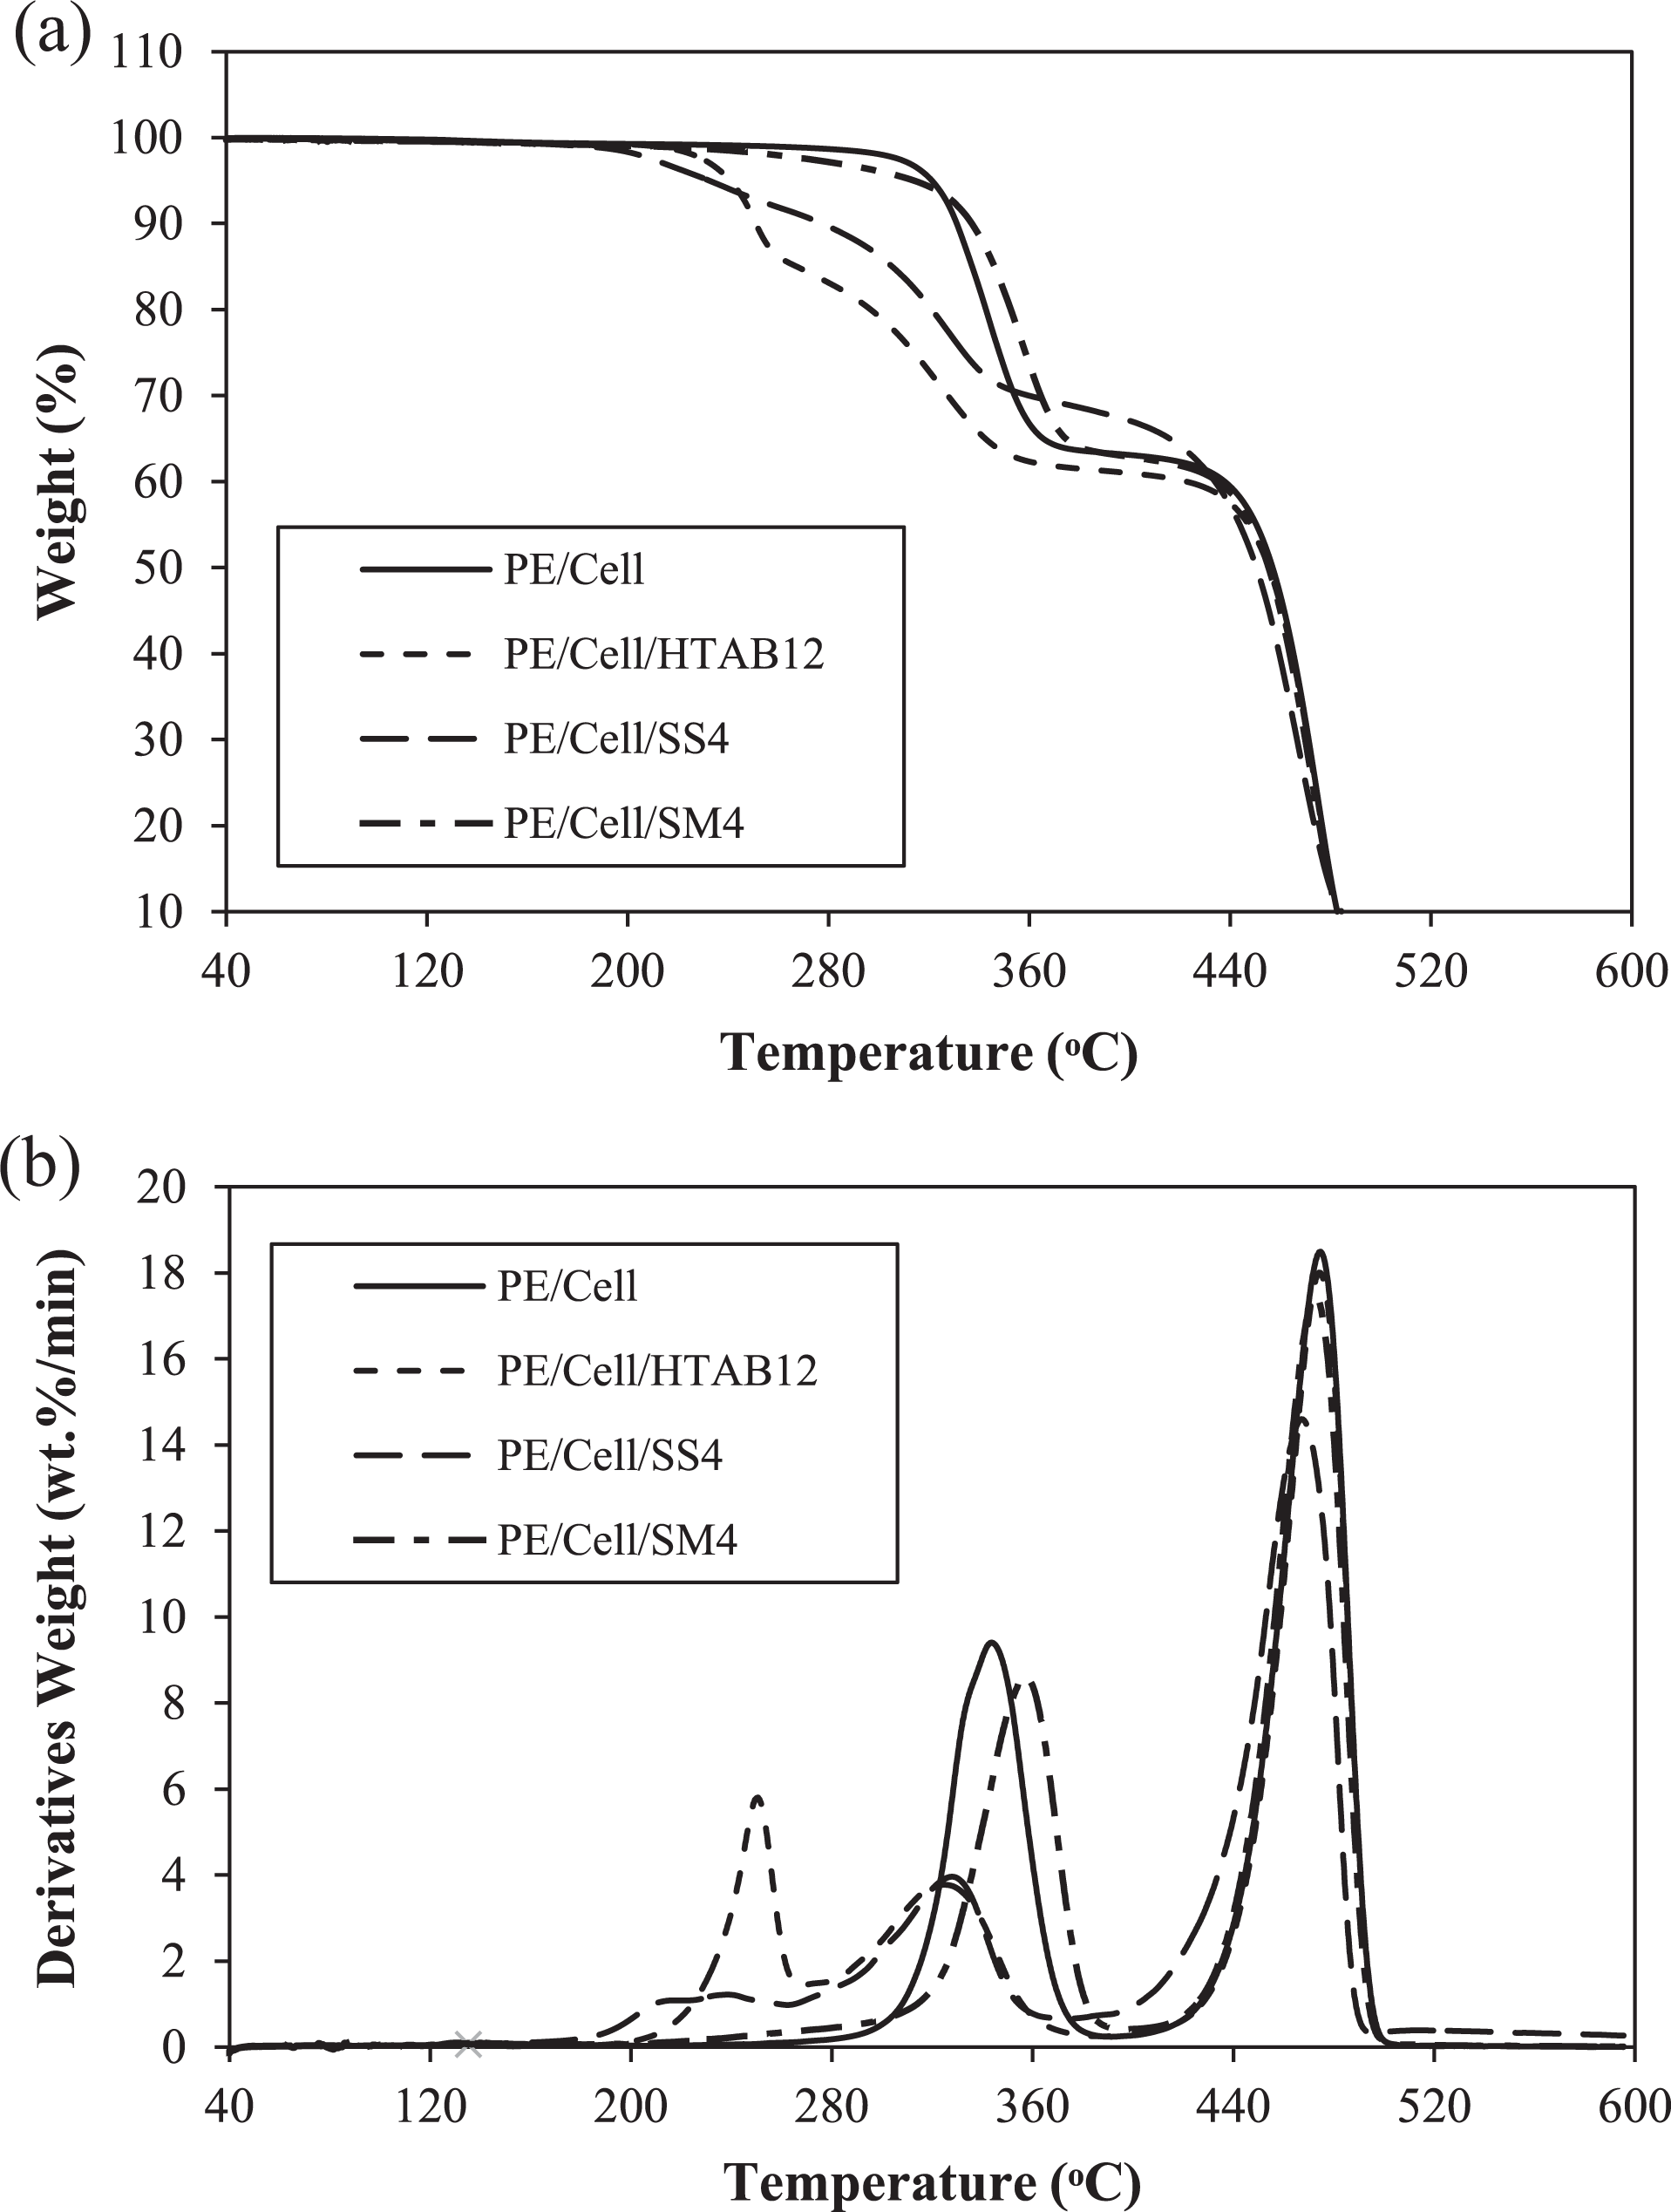
(a) TG thermograms and (b) DTG curves of HDPE/LDPE/cellulose biocomposites with different types of surfactant.
The initial decomposition temperature and maximum decomposition temperature of HDPE/LDPE/cellulose biocomposites obtained from DTG curve and TG thermograms.
HDPE: high-density polyethylene; LDPE: low-density polyethylene; TG: thermogravimetric; DTG: derivative thermogravimetric; HTAB: hexadecyltrimethylammonium bromide; SS: sodium stearate; SM: sorbitan monostearate; PE: polyethylene.
On the other hand, the maximum thermal decomposition temperature value of PE/Cell is 474.63°C, whereas for PE/Cell/HTAB12, PE/Cell/SS4, and PE/Cell/SM4 are 474.17, 467.08, and 472.73°C, respectively. The results indicated that the maximum decomposition temperature values of biocomposites were decreased with the addition of HTAB, SS, and SM. The decreases in PE/Cell/HTAB12 and PE/Cell/SM4 are commonly an indication of the presence of physical interactions between the HDPE/LDPE and cellulose. 3,55 However, the maximum decomposition temperature value of PE/Cell/SS4 was also decreased, although there was no specific interaction between the HDPE/LDPE and cellulose after SS was added. The decrease probably was caused by the addition of component with low thermal stability characteristic into the biocomposite systems. 3 Hence, this explained the relation between the addition of SS with the reduction of the maximum decomposition temperature value of the PE/Cell/SS4. Overall, it was found that the thermal stability of HDPE/LDPE/cellulose biocomposites with the addition of HTAB, SS, and SM were less than the PE/Cell. Therefore, this could contribute to the production of biocomposite products that can be thermally decomposed at much lower temperature.
DSC characterization
DSC analysis was done to determine the melting point temperature (Tm) of HDPE/LDPE/cellulose biocomposites with the addition of different types of surfactant. The DSC thermograms and Tm values are displayed in Figure 14 and Table 3, respectively. The specific Tm values of crystalline phase of the biocomposites are corresponding to the peaks in the DSC thermograms. 3 The glass transition temperature (Tg) values are usually used for the determination of the compatibility between the biocomposites components. 16 However, the Tg of the biocomposites was not observable in this analyzed temperature range since HDPE/LDPE has very low Tg value (<−100°C). 3 Nonetheless, the previous study reported that the enhancement of compatibility between the biocomposite components can be known indirectly with the changes in the Tm value. 56
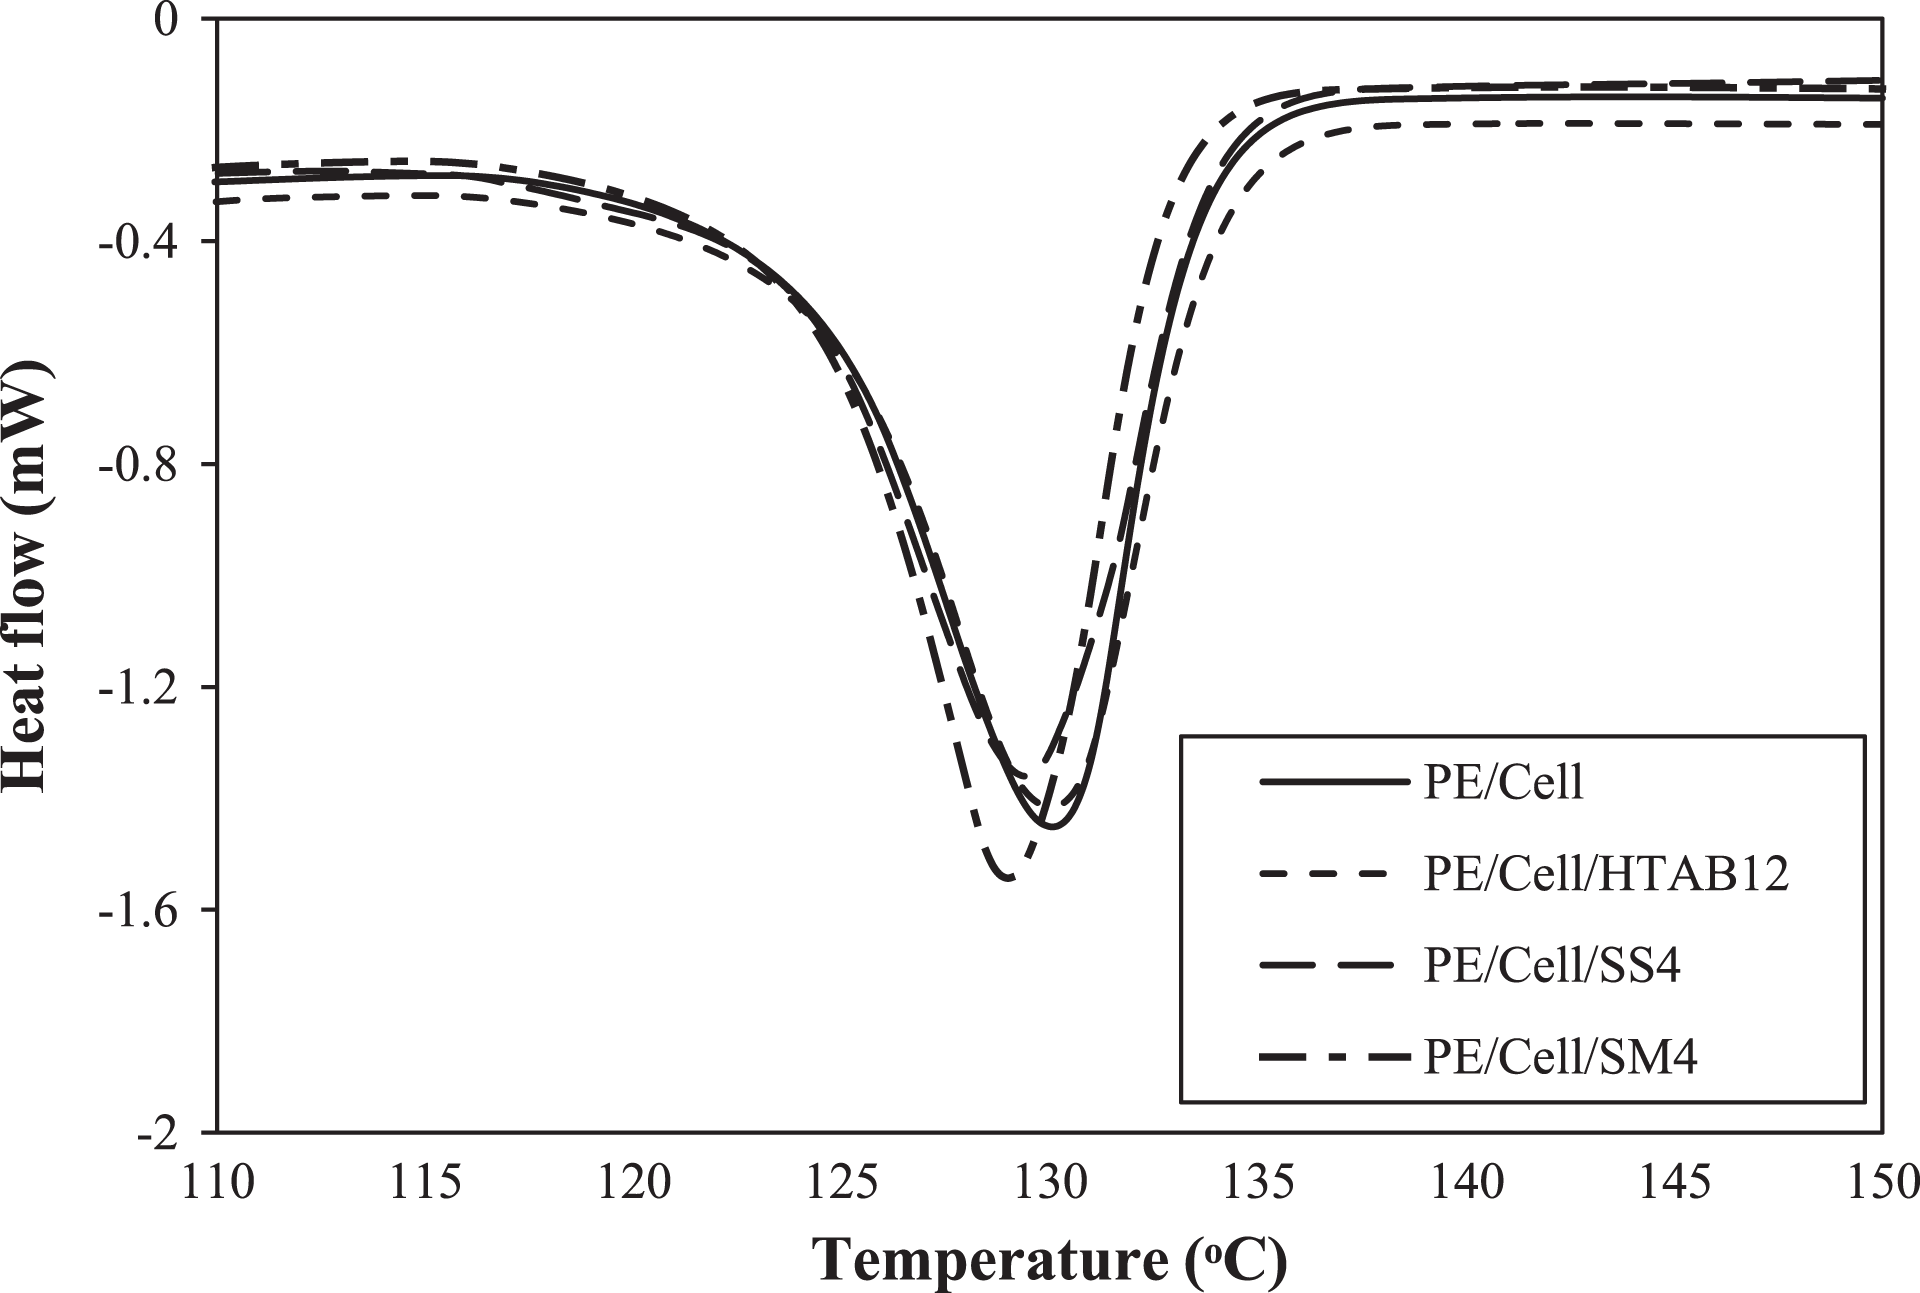
DSC thermograms of HDPE/LDPE/cellulose biocomposites with different types of surfactant.
Tm of HDPE/LDPE/cellulose biocomposites as obtained from DSC thermograms.
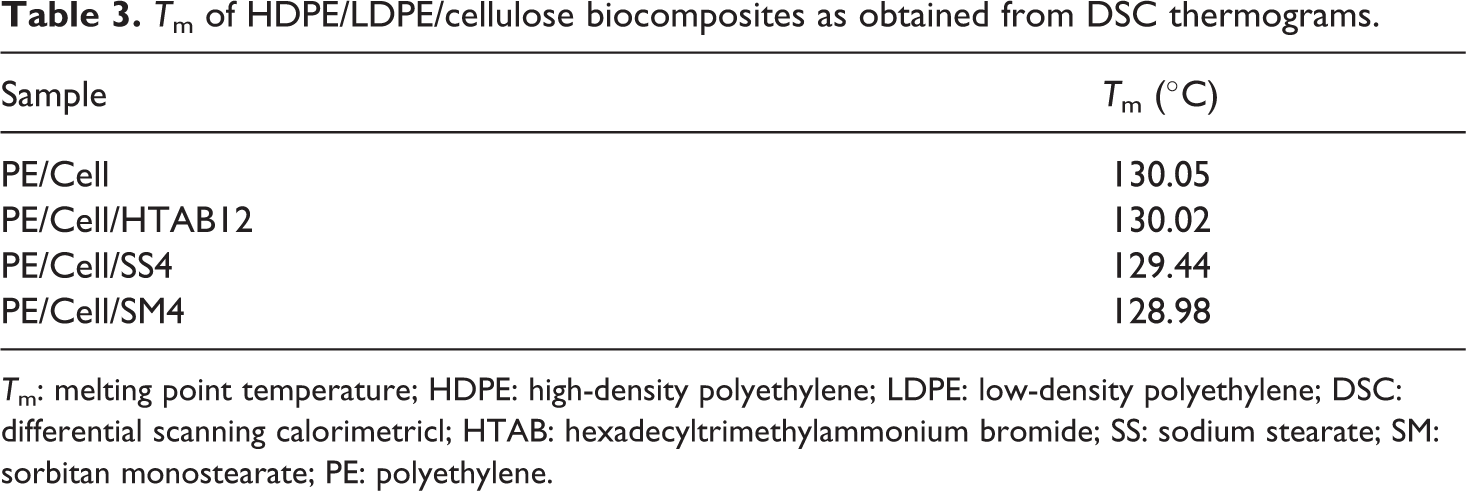
Tm: melting point temperature; HDPE: high-density polyethylene; LDPE: low-density polyethylene; DSC: differential scanning calorimetricl; HTAB: hexadecyltrimethylammonium bromide; SS: sodium stearate; SM: sorbitan monostearate; PE: polyethylene.
Based on the previous report, the Tm value of the HDPE/LDPE/cellulose biocomposite was predicted to be decreased with the enhancement of matrix/fiber interfacial adhesion of the biocomposite. 3 However, it can be seen in Table 3, the Tm value of the PE/Cell (130.05°C) was approximately same with the Tm value of PE/Cell/HTAB12 (130.02°C). This is due to the presence of crystal lattice of HTAB in PE/Cell/HTAB12, which has caused its Tm value to remain constant. On top of that, despite small difference in Tm values between PE/Cell and PE/Cell/SM4 (128.98°C), it was an insignificant decrease. Hence, this implied that the melting mechanism of the biocomposites was not affected although the composite components have been compatibilized with the addition of HTAB and SM. 57 On the other hand, the Tm value of the PE/Cell/SS4 which is 129.44°C has also not displayed any significant decrease from that of the PE/Cell. This result is as expected since the addition of SS could not improve the interfacial adhesion between HDPE/LDPE and cellulose. Therefore, it is clearly seen that the melting point temperature of the biocomposite could not be influenced with the addition of HTAB, SS, and SM.
Conclusion
This study showed that the addition of HTAB, SS, and SM has decreased the stabilization torque values which certainly due to the condition of the added surfactant has reduced the melt strength of the HDPE/LDPE/cellulose biocomposites. The stabilization temperature during melt mixing of the biocomposites was also reduced with the addition of HTAB, SS, and SM owing to the decrement of heat formation in the mixing chamber. The mechanical properties of the biocomposites were improved with the addition of HTAB and SM, nevertheless the properties were deteriorated with the addition of SS. The optimum weight percentages of HTAB and SM were 12 and 4 wt%, respectively, due to their highest enhancement of mechanical properties compared to other biocomposites. Besides that, the SEM micrographs showed that the amount of pullout holes was decreased with the addition of HTAB and SM, but it increased when SS was added into the biocomposites. On the other hand, the FTIR spectra and XRD patterns exhibited the presence of physical interactions between HDPE/LDPE and cellulose after the addition of HTAB and SM. However, no specific interaction was detected with the addition of SS. The TGA results of the HDPE/LDPE/cellulose biocomposites reflected that the addition of HTAB, SS, and SM decreased the thermal decomposition temperature. However, based on the DSC results, the addition of HTAB, SS, and SM could not influence Tm of the biocomposites. Overall, it can be concluded that both HTAB and SM have provided certain effects on the HDPE/LDPE/cellulose biocomposites. Nonetheless, there was neither compatibilization nor plasticization effect occurred after SS was added into the biocomposites.
Footnotes
Acknowledgments
The authors are thankful to the staff of the Laboratory of Biocomposite Technology, Institute of Tropical Forestry and Forest Products, Universiti Putra Malaysia, Malaysia, for providing the facilities as well as technical assistance.
Declaration of Conflicting Interests
The author(s) declared no potential conflicts of interest with respect to the research, authorship, and/or publication of this article.
Funding
The author(s) disclosed receipt of the following financial support for the research, authorship, and/or publication of this article: This research article has been fully funded under the Exploratory Research Grant Scheme (project code: ERGS/1-2013/5527185) by the Ministry of Education Malaysia.