
Abstract
Graphene/zinc oxide (ZnO) hybrid was prepared using biosafe
Introduction
Recently, among various types of carbon-based nanomaterials, graphene has received lots of attention. Graphene is a two-dimensional (2-D) member of graphitic material family, which consists of sp2 carbon atoms arranged in a honeycomb structure. Due to its remarkable properties such as ultrathin thickness, huge surface area, and exclusive electrical and mechanical properties, which is a developing category of nanomaterials, graphene can be applied in several fields such as nanoelectronic and bioelectronic devices, flexible displays and touch screens, biosensors, drug carriers, and transistors. 1 –3 Also, graphene has been utilized as an alternative carbon-based nanofiller in polymer nanocomposite (NC) construction. 4 –14 Graphene-based polymer NCs showed improvement in mechanical, thermal, and electrical field properties. However, due to π–π stacking interaction and strong attraction between graphene sheets, direct aggregation of two graphene nanosheets was observed, limiting its application. To prevent this limitation, functionalization of graphene is an important aspect. In this way, the attached functional groups avoid graphene sheets aggregation and help its dispersion in a hydrophilic or hydrophobic media as well as in the polymer matrix. 15 –25
Currently, the most promising functionalized graphene derivatives is graphene oxide (GO) which comprises a range of reactive oxygen functional groups (epoxide and hydroxyl groups on the basal planes and carboxyl groups at the edges). Further treatments of graphene are achievable via these oxygen groups. There are several comprehensive research works around for the production of covalent or noncovalent-functionalized GO and about the mechanisms of reaction between GO and functional groups. Some suitable functional groups, like terminal amines and amides, or some biosafe molecules including amino acids, peptides, proteins, lipids, carbohydrates and nucleic acids can be applied to improve graphene binding with polymer matrix. 26 –31
In recent decades, graphene has received much attention for its potential applications in industrial areas. Acceptable applications of applied materials depend significantly on the intrinsic properties of graphene. So, graphene hybridization using different materials is a powerful technique for increasing its usage. Recent examinations revealed that numerous metals and metal oxides such as platinum, silver, gold, palladium, titanium dioxide, ferric oxide, tin dioxide, cadmium selenide, and zinc oxide (ZnO) were utilized to hybridize with pure graphene or GO and improve their capacitance. In addition, graphene can act as a support to disperse and stabilize these metal and metal oxide nanoparticles (NPs). 32 –45 Among several choices, ZnO NPs have been extensively studied as graphene or GO hybridizing agent. ZnO NPs are valuable materials and biofriendly absorbers that are employed for an extensive range of applications, owing to their unique electrical, optical, photocatalytic, and antibacterial properties. Consequently, it is expected that attaching well-organized ZnO NPs onto the graphene sheets can efficiently utilize the advantages of both graphene and ZnO and especially can attain high photocatalytic performance. 46 –48
The aim of this work is the preparation of novel
Experimental
Materials
Natural graphite (diameter 5–10 µm, thickness 4–20 nm, layers <30, and purity >99.5 wt%) and ZnO NPs with an average particle size of about 25–30 nm were purchased from Neutrino Co. (Iran). The silane coupling agent (KH550) was purchased from Merck Chemical Co. (Germany). Other chemicals used in this study were obtained from Fluka Chemical Co. (Switzerland) and Merck Chemical Co. and used as received. Sulfuric acid (H2SO4, 98%), hydrogen peroxide (H2O2), and hydrochloric acid (HCl), also obtained from Merck, were used for the synthesis of mediators.
Measurements
Fourier transform infrared (FTIR) spectra of the samples were recorded on Jasco-680 (Japan) spectrometer at 4 cm−1 resolution using pressed potassium bromide (KBr) pellets and scanned at wave number range of 400–4000 cm−1. The band intensities were classified as weak (w), medium (m), strong (s), and broad (br). Proton nuclear magnetic resonance (1H-NMR) spectrum was recorded on a Bruker Avance 400 MHz spectrometer (Billerica, Massachusetts, USA) with deuterated dimethyl sulfoxide (DMSO-d 6) as the solvent. Chemical shifts are given in the δ scale in parts per million (ppm). Elemental analyses were performed by a CHNS-932 elemental analyzer (Leco Corporation, St Joseph, Michigan, USA). Raman spectroscopy was recorded from 0 to 3500 cm−1 on an Almega Thermo Nicolet Dispersive Raman spectrometer using a 532 nm of a neodymium-doped yttrium lithium fluoride laser. Thermogravimetric analysis (TGA) is performed with an STA503 Win TA (Bahr-Thermoanalyse GmbH, Hüllhorst, Germany) analyzer at the heating rate of 10°C min−1 from 25°C to 800°C under nitrogen atmosphere. X-Ray diffraction (XRD) was used to characterize the crystalline structure of composites. XRD patterns were collected using a Bruker D8 Advance diffractometer with a copper (Cu) K α target at the wave length λ = 1.54 Å, tube voltage of 40 kV, and tube current of 35 mA, in the range of 10°–100° at the speed of 0.05° min−1. Ultraviolet–visible (UV-Vis) spectra of samples were measured on UV/Vis/near-infrared spectrophotometer (Jasco, V-570) in the spectral range between 200 nm and 800 nm. NC morphology was observed using field-emission scanning electron microscopy (FESEM, model S-4160, Hitachi, Japan). Transmission electron microscopy (TEM) image was obtained using Philips CM 120 operated (Netherlands) at the voltage of 150 kV.
GO synthesis
GO was synthesized from oxidation of natural graphite through Hummers’ method. 49 Graphite powder (0.5 g) was poured into solution of concentrated H2SO4 (12 mL) and sodium nitrate (0.25 g) at 0°C. Potassium permanganate (1.5 g) was slowly added, and the temperature of the mixture should be below 20°C. The mixture was then stirred at 35°C for 30 min, and as the reaction proceeded, the color of mixture turned from black to light brownish. Then, distilled water (25 mL) was added, and the temperature was elevated to 98°C and maintained at this temperature for 15 min. The reaction was terminated with the addition of a great amount of distilled water (70 mL), followed by treatment with 30% H2O2 (2 mL), and the mixture changed into bright yellow color. The mixture was filtered and washed with distilled water and 10% HCl solution in order to remove metal ions. The obtained GO powder was dispersed in deionized water. The resulting yellow brownish suspension was centrifuged at 3000 r min−1 for 1 h to eliminate unexfoliated graphitic plates. Finally, an aqueous suspension containing GO sheets was obtained through exfoliation of the filtered GO suspension through its sonication at frequency of 2.25 × 10⁴ Hz and power of 100 W for 1 h. Finally, the GO powder was dried at 60°C.
Phe functionalization of GO
GO powder (0.1 g) was dispersed in distilled water (10 mL) and Phe amino acid (0.3 g) and an equimolar amount of sodium hydroxide in distilled water (10 mL) was added. The mixture was stirred for 24 h at ambient temperature. At the end of the reaction, the colloidal dispersion was treated with ethanol, and the resulting precipitate was centrifuged, washed well with water/ethanol (EtOH) mixture. 50 In addition, the solids were stirred and ultrasonicated in 5% HCl solution to change the carboxylate groups into carboxylic acid groups and finally dried at 60°C.
Modification of ZnO NPs with KH550
Dry ZnO NP (0.2 g) was added into absolute EtOH (10 mL) and was ultrasonicated for 15 min. Then, 0.042 mL of KH550 (20 wt% ZnO) was added to the dispersed solution. The mixture of NPs and KH550 was irradiated under ultrasonic radiation for 30 min. The amino-functionalized ZnO (f-ZnO) NPs were filtrated and washed several times with EtOH to remove unreacted KH550. The solid was dried at 60°C under vacuum.
Preparation of Phe-GO/f-ZnO hybrid
Phe-GO (0.05 g) and f-ZnO NPs (0.05 g) were completely dispersed into dimethylformamide (DMF; 50 mL) by sonication. Then, an excess amount of N,N′-dicyclohexylcarbodiimide (DCC) was added into this solution. The mixture was stirred at room temperature for 48 h. The resultant product was centrifuged and washed repeatedly with absolute EtOH to remove the unattached ZnO NPs until the filtrate was transparent. The final solid was dried at 60°C under vacuum.
PEA synthesis
At first, diol
FTIR (KBr, cm−1): ν = 3425 (NH, s, br), 1773 (imide C=O, m), 1740 (ester C=O), 1714 (imide C=O, s), 1641 (amide C=O, s), 1602 (w), 1561 (m), 1507 (m), 1380 (m), 1216 (s), 1192 (s), 719 (m), 680 (m). 1 H NMR (400 MHz, DMSO-d 6): δ = 10.45 (1 H, amidic NH), 9.13 (2 H, amidic NH), 7.27–8.71 (aromatic H area), 5.01 (1 H, chiral center), 4.76 (2 H, chiral center), 3.69 (6 H, OCH3), 3.24 (4 H, aliphatic CH2), 2.06-2.17 (2 H, aliphatic CH2), 1.47 (1 H, aliphatic CH), 0.95 (6 H, aliphatic CH3) ppm. Elemental analysis calculated for (C50H44N4O13) n : Calculated (%) = C: 66.07; H: 4.88; N: 6.16; Found (%) = C: 65.84; H: 4.86; N: 6.06.
Preparation of PEA/Phe-GO/ZnO NCs
For the synthesis of PEA/Phe-GO/ZnO NCs, two stock solutions were prepared: PEA (0.1 g) was dissolved in DMAc (2 mL) and Phe-GO/ZnO hybrid was separately dispersed in DMAc (2 mL) and stirring for 1 day at ambient temperature. Then, two stock solutions were mixed to attain the desired weight percentages of hybrid (5, 10, and 15 wt%). The NC solutions were stirred for 1 day at room temperature and then ultrasonicated in water bath for 1 h. To remove DMAc solvent, NC solutions were poured into an uncovered preheated petri glass. The obtained NC solids were further dried in vacuum at 120°C for 8 h.
Results and discussion
Synthesis and characterization of Phe-GO/ZnO hybrid
Phe-GO/ZnO hybrid was prepared via three steps, as shown in Figure 1. At first, GO was produced according to Hummers’ technique, which leads to introducing variety of oxygen-containing functional groups onto the surface of graphene sheets. Then, GO was further functionalized via Phe molecules by a simple and green procedure. In the second step, ZnO NPs were functionalized with KH550 coupling agent to introduce –NH2 functional group on their outer wall for using in hybrid synthesis. Finally, in the third step, f-ZnO NPs were anchored on Phe-GO sheets via a facile reaction between carboxylic acid groups, which exists on the Phe-GO surface, and f-ZnO amino groups in the presence of DCC as an acid activator. The Phe-GO functional groups can act as anchor sites to enable ZnO NPs attaching on the graphene sheets. The structure and surface morphology of the as-prepared samples were analyzed by several techniques.
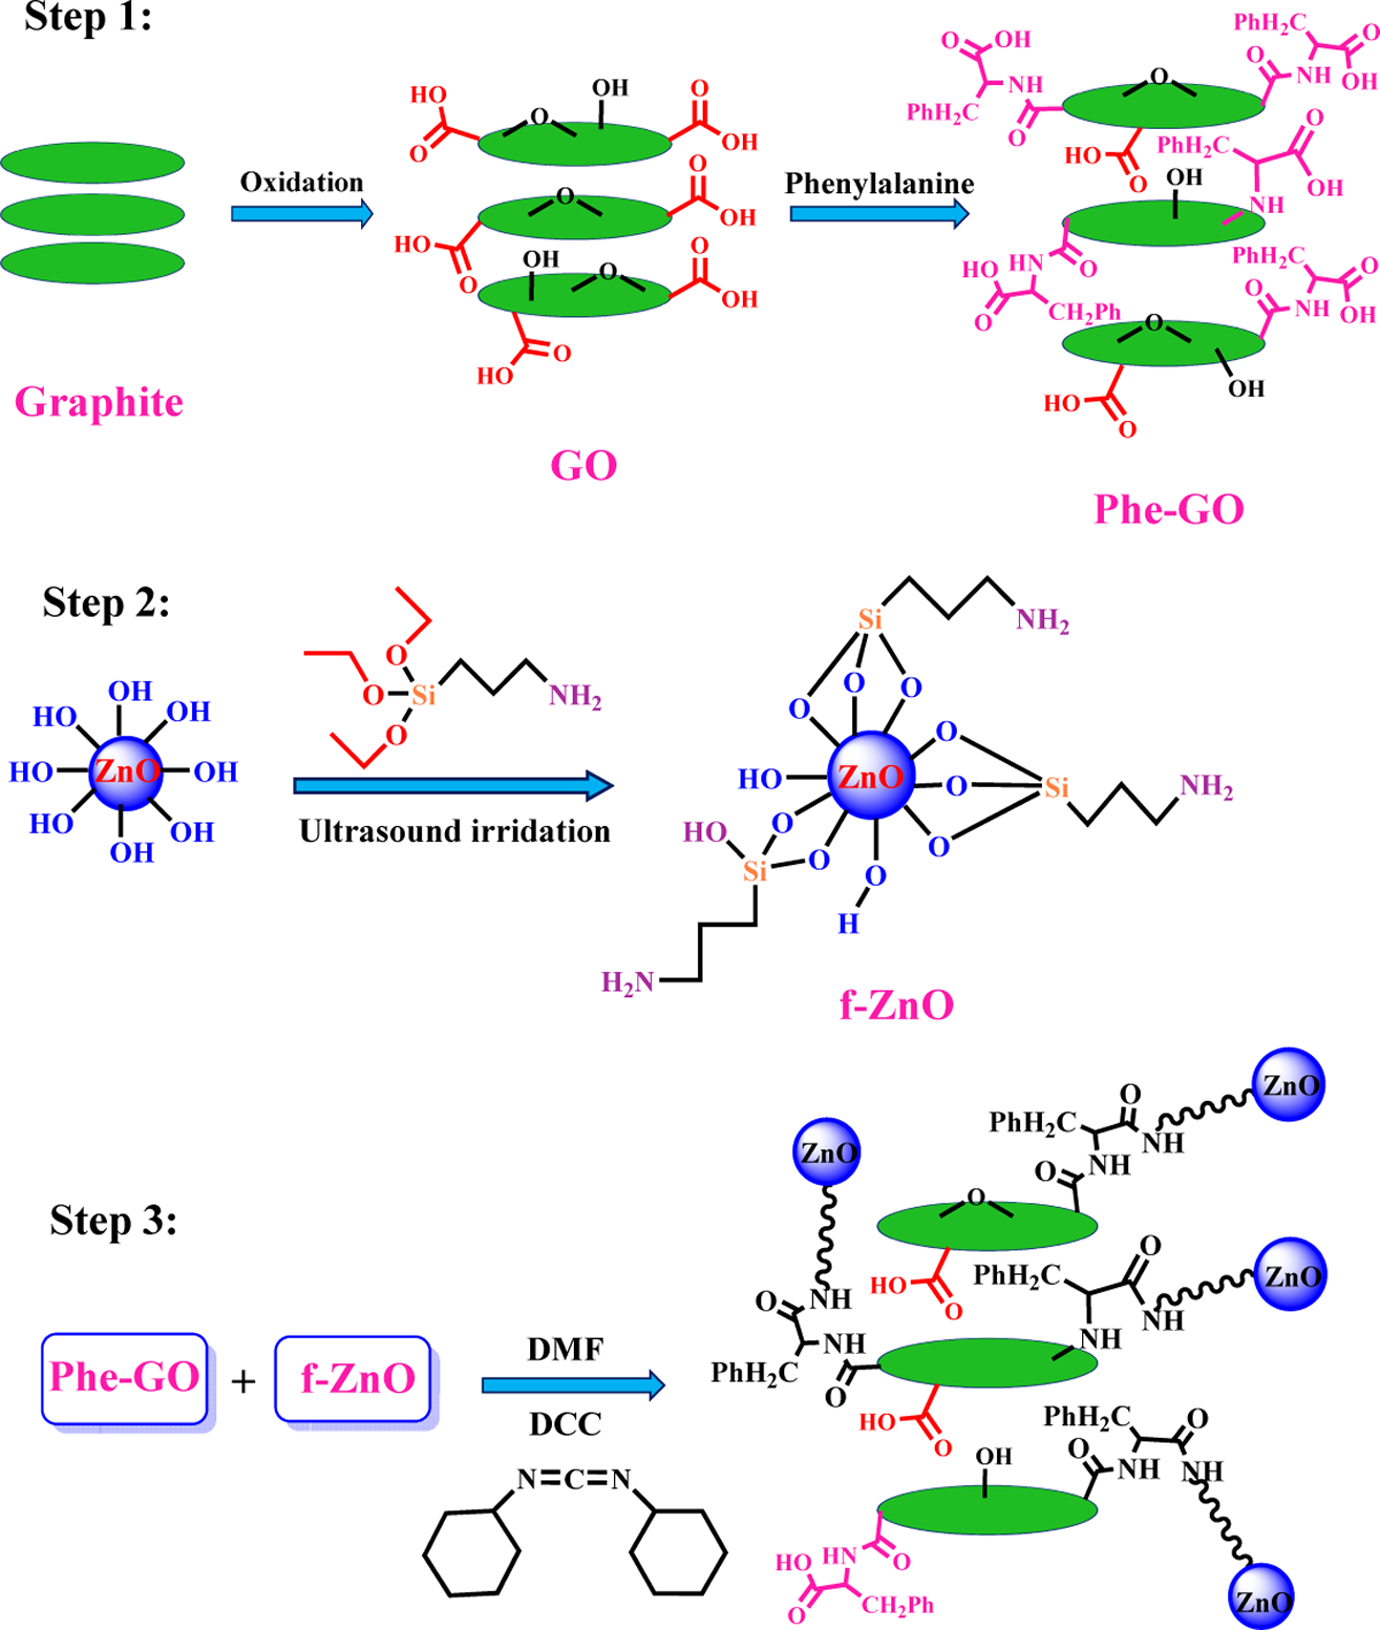
Preparation of Phe-GO/ZnO hybrid. Phe:
The surface functionalization of graphene nanosheets, ZnO NPs, and the hybrid production were confirmed using FTIR analysis. Figure 2 displays FTIR spectra of GO, Phe-GO, pure ZnO, f-ZnO, and Phe-GO/ZnO hybrid. In GO spectrum (Figure 2(a)), the peaks at 3430, 2922, 1719, 1624, and 1046 cm−1 are assigned to the –OH stretching vibration of hydroxyl and carboxylic acid moieties, aliphatic sp3 C–H stretching, C=O stretching vibration in carboxylic acid, skeletal vibration of unoxidized graphitic domains, and the C–O bond, respectively. In contrast with GO, Phe-GO presented obvious evidence of desired functionalities (Figure 2(b)). Observation of carboxylic acid and amidic C=O stretching vibration at 1725 and 1640 cm−1, respectively, and the N–H groups that existed on the Phe-GO sample and the appeared band at 1383 cm−1 which is attributed to the C–N–C axial stretching bands could specify that the amidation reactions occurred between the amino groups of Phe and carboxyl groups on the GO surfaces.
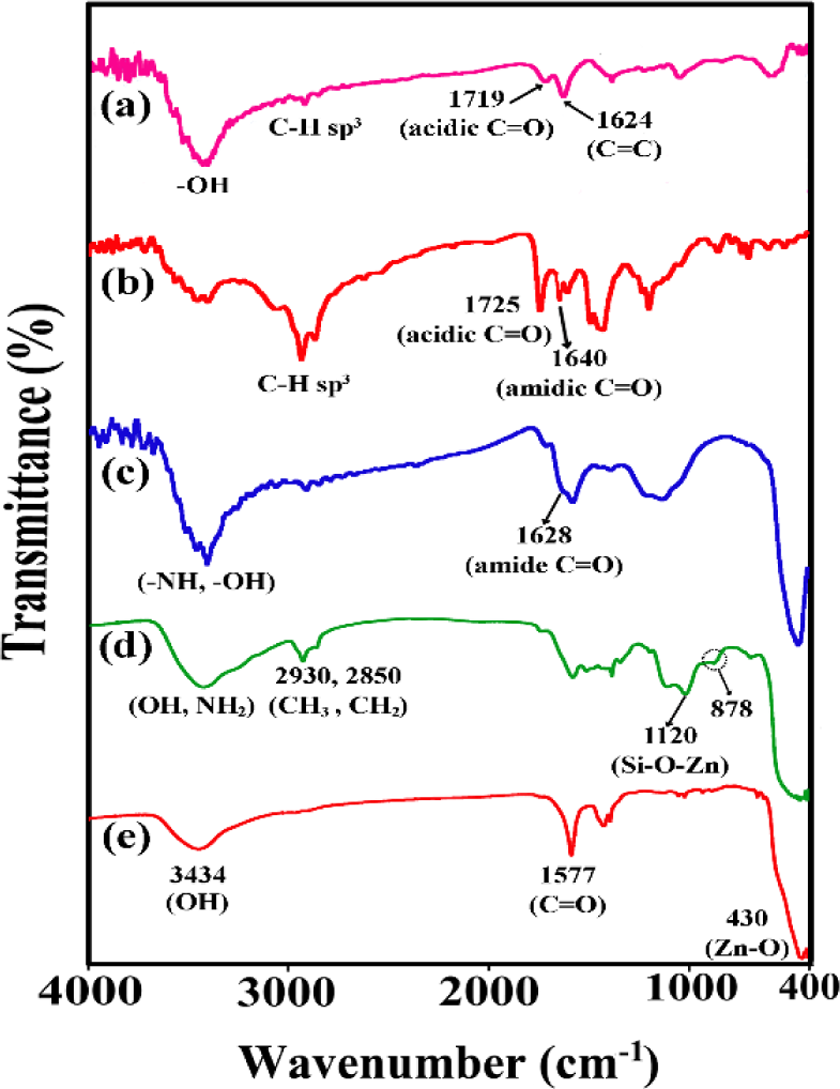
FTIR spectra of (a) GO, (b) Phe-GO, (c) Phe-GO/ZnO hybrid, (d) f-ZnO, and (e) pure ZnO. FTIR: Fourier transform infrared; Phe:
For pure ZnO NPs (Figure 2(e)), the peak at 3434 cm−1 is assigned to hydroxyl groups on the ZnO surface, and the peaks at 1577 cm−1 is owing to the zinc acetate at the ZnO surface. Additionally, the peak at 430 cm−1 is recognized to the Zn–O vibration. After functionalization with KH550 coupling agent, numerous new peaks are observed in the spectrum of f-ZnO (Figure 2(d)). The bands at 2930 and 2850 cm−1 are assigned to stretching vibration of C–H bonds (CH3 and CH2 groups. The N–H bending vibration of primary amine appeared at approximately 1578 cm−1, and the peaks at 1017, 1120, and 444 cm−1 are attributed to Si–O–Si, Zn–O–Si, and Zn–O bonds, respectively. Such modification introduces active sites onto the outer wall of ZnO NPs, which cause combining ZnO NPs with other materials via covalent bonds. Compared with f-ZnO and Phe-GO, the spectrum of Phe-GO/ZnO hybrid (Figure 2(c)) is a combination of the above two spectra with disappearance of the characteristic peak of N–H at 878 cm−1. Furthermore, a new amidic C=O band generated from dehydration of –NH2 functional groups on the f-ZnO surface and –COOH groups on the Phe-GO is observed in 1628 cm−1, which confirmed that ZnO NPs were attached onto the graphene sheets via covalent coupling.
In order to further analyze the chemical compositions, Raman spectroscopy has been used. Figure 3 displays Raman spectra of GO, Phe-GO, and Phe-GO/ZnO hybrid. In general, graphitic materials possess three major peaks of D, G, and 2D bands. D band is assigned to local defects and disorders, especially the defects that are located at the edges of graphene sheets. G band is generally attributed to sp2 bonds of carbon atoms. The D/G intensity ratio is a convenient factor to determine the sp2 domain size of a carbon material comprising sp3 and sp2 bonds. According to Figure 3, I D/I G increased from GO (0.90) to Phe-GO/ZnO hybrid (1.36) due to decrease of the sp2 in-plane domain caused by the introduction of defects and disorder of sp2 domain. 53,54 The Raman spectrum of Phe-GO/ZnO hybrid (Figure 3(c)) presents two additional peaks located at 420 and 170 cm−1, which are assigned to Zn–O vibrations, signifying the formation of ZnO nanostructure on amino acid-based graphene surface and they are the characteristic peak of the hexagonal wurtzite phase. 55,56 Furthermore, the 2D peak shape, position, and intensity exhibits the layer numbers of graphene sheets. Raman spectra of GO and Phe-GO display broad and asymmetrical shape of 2D band, which confirm the presence of both single and multilayer graphene sheets in these samples. As reported in literatures, the 2D band for the five-layer graphene sheet was located at about 2755 cm−1. Thus, the number of the graphene layers in Phe-GO/ZnO hybrid is five layers. 56,57
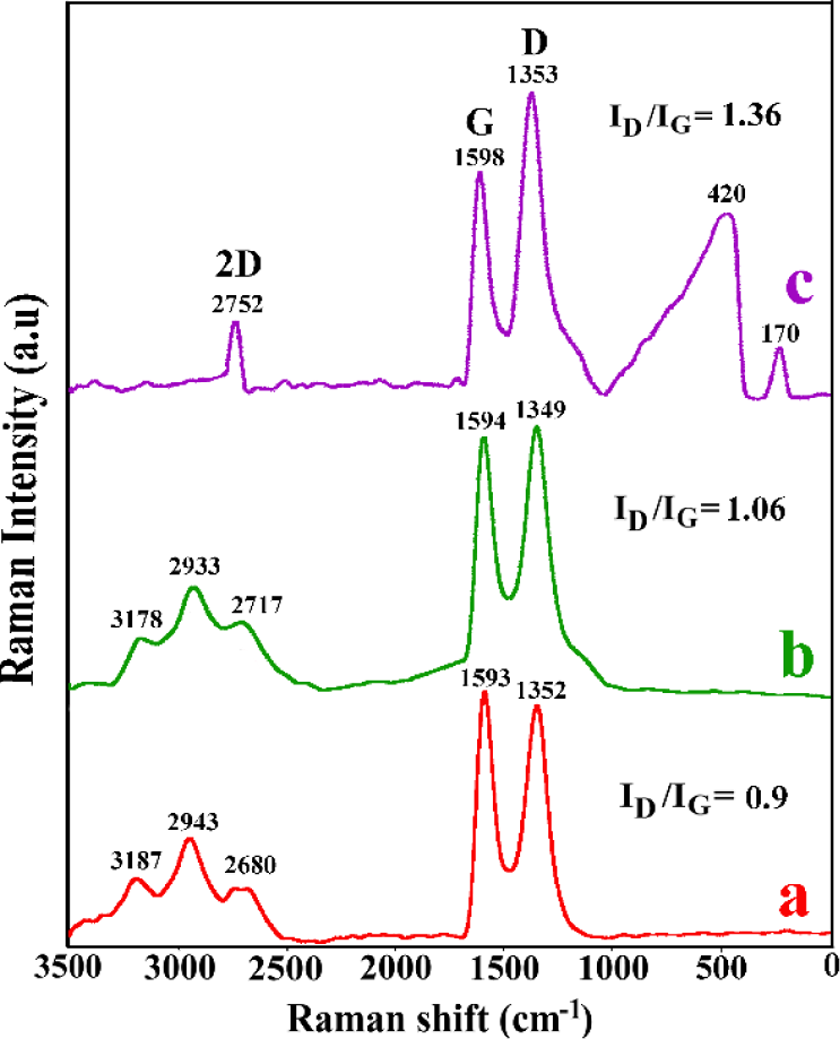
Raman spectra of (a) GO, (b) Phe-GO, and (c) Phe-GO/ZnO hybrid. Phe:
In order to examine the morphology changes in Phe-GO/ZnO hybrid, FESEM imaging of the sample was carried out and compared with pure graphite, GO, and Phe-GO FESEM images. Figure 4 exhibits the FESEM results for graphite, GO, Phe-GO, and Phe-GO/ZnO hybrid. Compared to graphite, the general morphology of GO is greatly changed. The thickness of graphene sheets increase during oxidization process, which can be attributed to the formation of oxygen groups on the edge and basal plane of graphene. After functionalization with Phe, the graphene surface became rough, and the space of layers was increased. Phe-GO is bearing lots of densely small-sized groups, which is an evidence of the presence of Phe moieties on the graphene sheets. As shown in the FESEM micrographs of Phe-GO/ZnO hybrid, the graphene sheets were well decorated by ZnO NPs. According to the images, ZnO NPs were attached on both sides of graphene sheets through a nonuniform distribution on the sheet. This occurrence can be due to nonhomogeneous dispersion of the active sites on the Phe-GO surface. f-ZnO NPs are attached onto Phe-GO surface via covalent coupling, and most particles are distributed on the edge or rough area of graphene sheets, demonstrating an inhomogeneous decoration of graphene sheets with f-ZnO NPs. Furthermore, some f-ZnO NPs entered into the interlayers of Phe-GO sheets and form a sandwich-like structure. This type of structure can avoid the stacking of graphene sheets, which can prevent the loss of their high active surface area. In addition, the particle size histogram of ZnO NPs attributed to 500 nm magnefication shows the mean diameter of 61 nm with a 13 nm standard deviation for about 100 particles which were taken into account to draw the histogram.
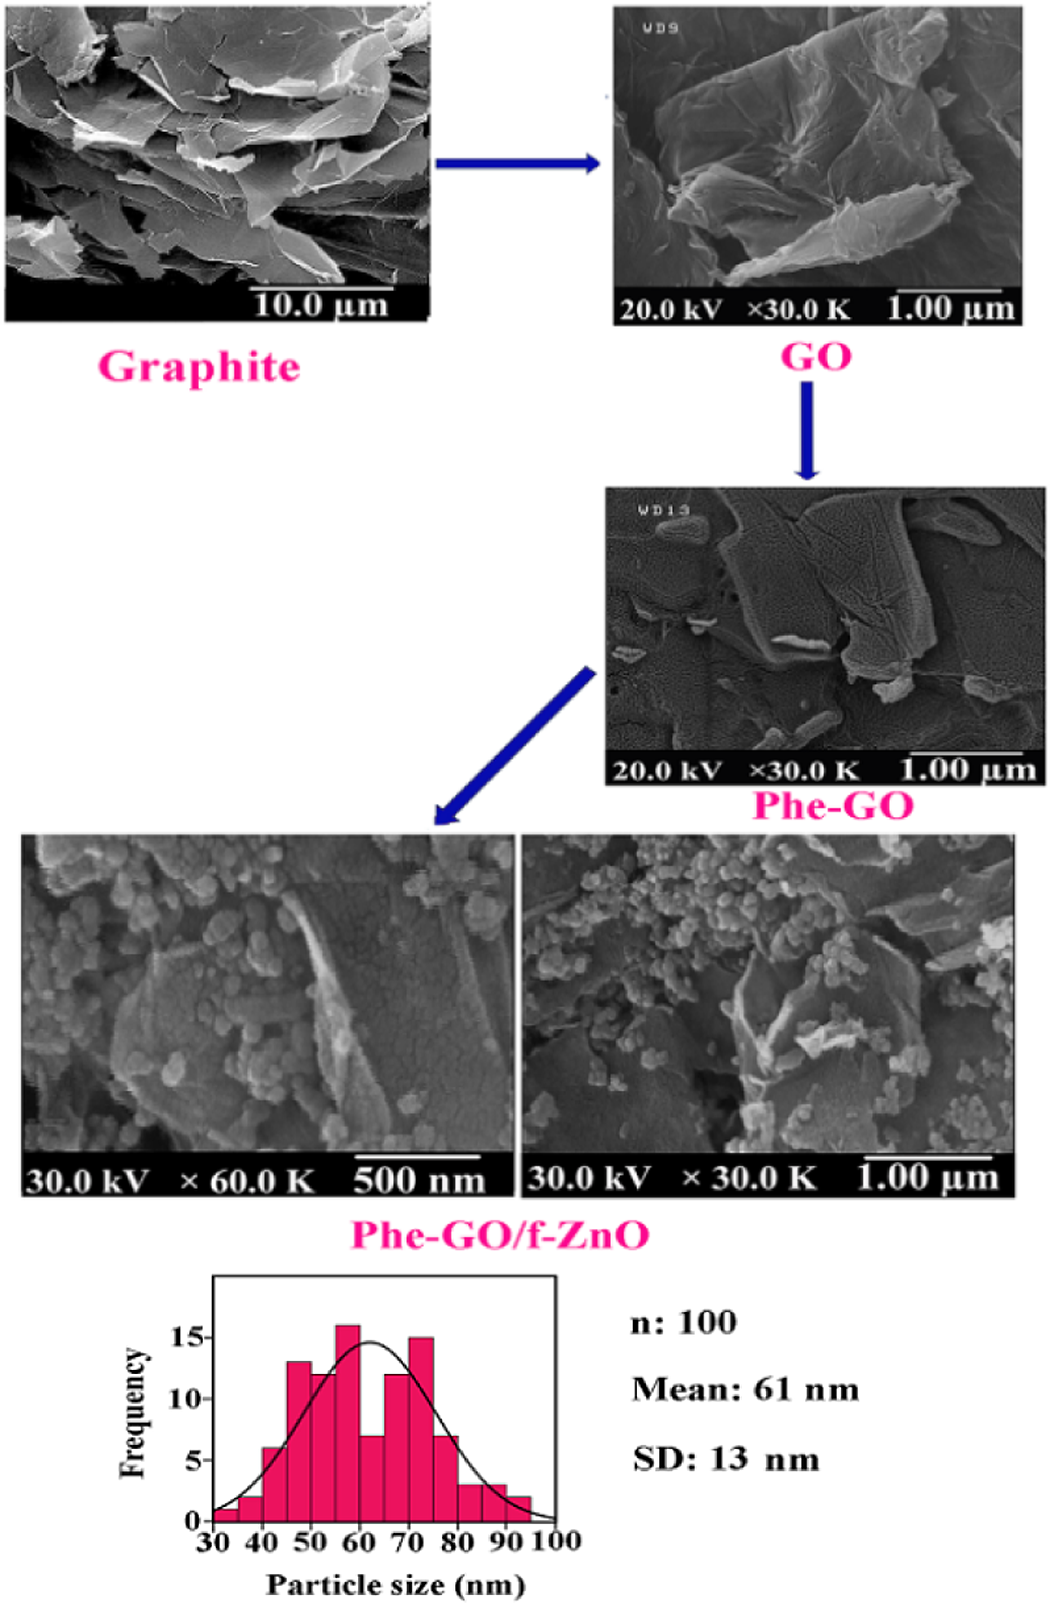
FESEM micrographs of graphite, GO, Phe-GO and Phe-GO/f-ZnO hybrid with the histograms of ZnO NPs. FESEM: field-emission scanning electron microscopy; Phe:
The comprehensive architecture study of f-ZnO and Phe-GO/ZnO hybrid was achieved by TEM analysis. Figure 5 presents TEM images of f-ZnO and Phe-GO/ZnO hybrid in different magnification. f-ZnO TEM images (Figure 5(a)) confirm good distribution of f-ZnO in nanoscale range (10–40 nm). In Phe-GO/ZnO hybrid TEM images (Figure 5(b)), the light gray thin films are graphene sheets, and the dark sphere particles on the graphene layers are due to the presence of f-ZnO NPs. As shown in the figure, the exfoliated graphene sheet was decorated with ZnO NPs with 20–50 nm sizes. Additionally, since the synthesized hybrid experienced ultrasonic treatment before TEM observation and no separated ZnO NPs were detected outside of graphene sheets in the TEM image, it can be concluded that the f-ZnO NPs were tightly attached onto the graphene layers through covalent bonding and were more endurable compared with those by physical absorption.
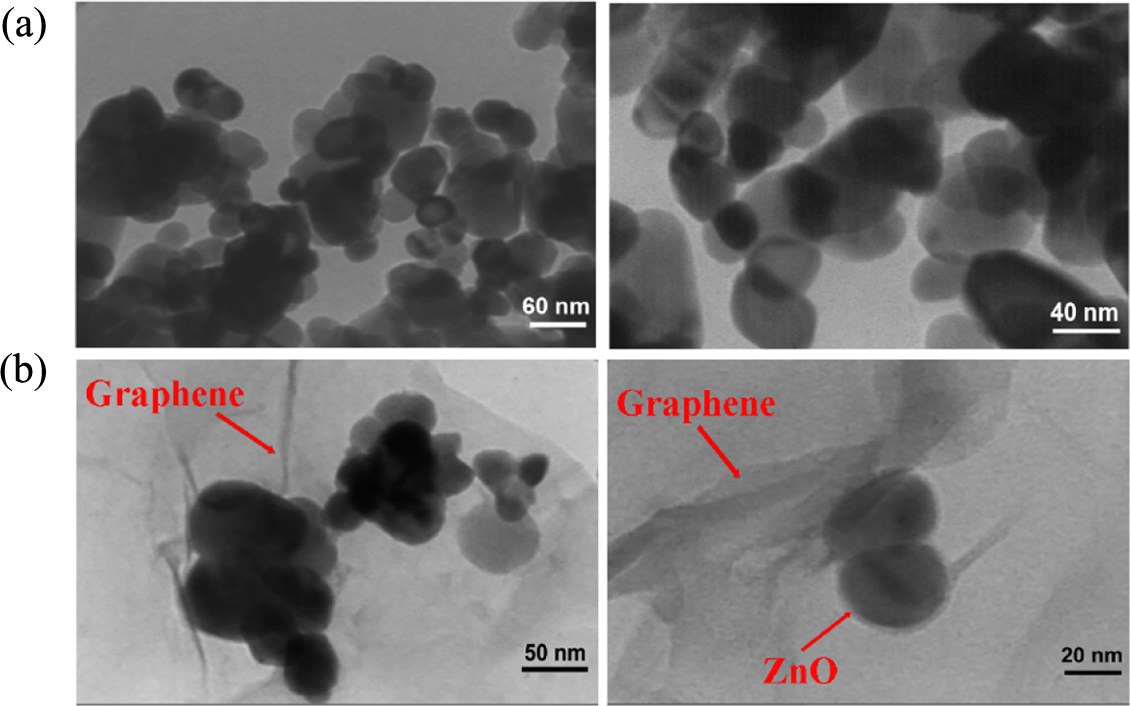
TEM images of (a) f-ZnO and (b) Phe-GO/ZnO hybrid in different magnification. TEM: transmission electron microscopic; f-ZnO: functionalized zinc oxide; Phe:
The crystalline structures of the prepared samples were examined by XRD measurements. Figure 6 displays the XRD patterns of graphite, GO, Phe-GO, and Phe-GO/ZnO hybrid. As shown in the XRD pattern of graphite, a distinctive peak was observed at 26.6°, with an interlayer spacing of 0.32 nm. For exfoliated GO, owing to the presence of oxygen-containing functional groups, the interlay space became greater than that of graphite (11.6°, 0.77 nm). 58,59 The XRD pattern of GO-Phe indicates two peaks at 7.22° and centered at 25°. These increasing and decreasing layer distances can be attributed to the different kinds of interaction between Phe molecules and GO sheets. The two peaks in the GO-Phe spectrum (7.22° and 25°) can be attributed to the unreduced GO in the middle core and the highly reduced GO on the surfaces by phenylalanine. 60 The diffraction peaks of f-ZnO NPs can be assigned to pure ZnO with hexagonal structure (JCPDS, no. 36-1451). The XRD pattern of Phe-GO/ZnO hybrid is parallel to those of hexagonal (wurtzite) ZnO. The strong and sharp diffraction peaks of ZnO propose that the f-ZnO NPs anchored onto the Phe-GO sheets were still extremely crystalline like the pure ones. However, the diffraction peak at 7.22° for Phe-GO is almost undetectable, which could reveal that the ordered layer structure of graphene has been destroyed and exfoliated graphene sheets are formed as a result of ZnO nanocrystals growth. 46,61
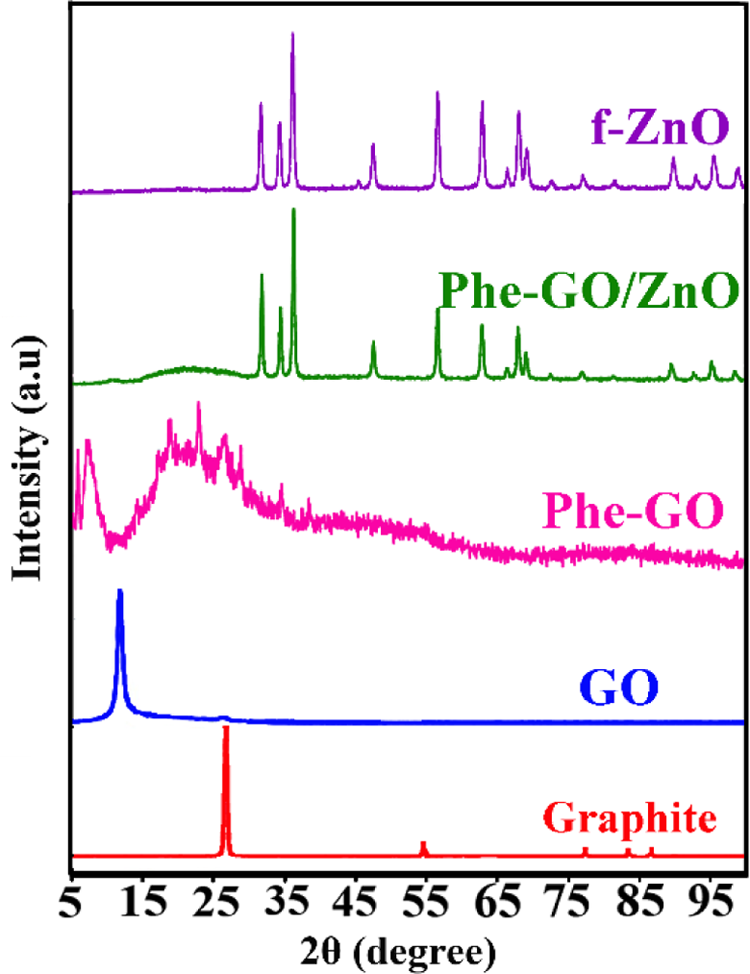
XRD patterns of graphite, GO, Phe-GO, f-ZnO and Phe-GO/ZnO hybrid. XRD: X-ray diffraction; Phe:
TGAs were performed to investigate the thermal stability of prepared GO, Phe-GO, and Phe-GO/ZnO hybrid compared to pure graphite (Figure 7). Unlike the pure graphite with no weight loss, GO exhibited three weight loss steps. The first step around 100°C is related to the adsorbed water elimination; the second step around 200°C, which is sharp, is associated to pyrolysis of the labile oxygen-containing functional groups on the GO layers; and the last step, which is resulted from pyrolysis of the carbon skeleton, takes place around 650°C. 4,62,63 Compared to GO, an improvement in the thermal stability was observed for Phe-GO, which indicates oxygen-containing functional groups decreasing in GO sheets through amidation process. According to the TGA curve of Phe-GO, the amino acid moieties were removed from graphene sheets at around 150°C and the char yield at 800°C was increased from 41% for GO to 53% for Phe-GO. Based on the TGA curve of Phe-GO/ZnO hybrid, the weight loss occurred at higher temperature compared to GO and Phe-GO. The –N–CO– bands in Phe-GO/ZnO hybrid are more stable compared with the existing bands in GO and Phe-GO, so more energy is required to break them up. Consequently, the postponement in the pyrolysis of functional groups signifies the successful covalent bonding between Phe-GO sheets and f-ZnO. In addition, due to the attachment of ZnO NPs onto the graphene layers, the char yield was increased and reached to 63%.
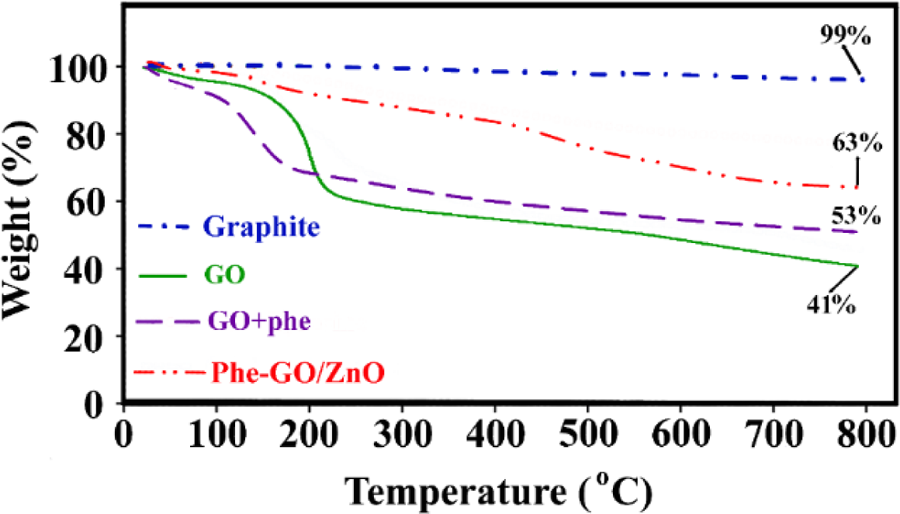
TGA curves of pure graphite, GO, Phe-GO and Phe-GO/ZnO hybrid. TGA: thermogravimetric analysis; Phe:
UV-Vis spectra of f-ZnO, GO, Phe-GO, and Phe-GO/ZnO are shown in Figure 8. GO exhibits a maximal absorption at 230 nm and a tiny shoulder at about 300 nm, which is attributed to π–π* transitions of aromatic C=C bonds and n–π* transitions of C=O bonds. f-ZnO indicates an absorption peak at 368 nm, which is also observed in GO-Phe/ZnO hybrid. A maximum absorption obtained for Phe-GO was observed at about 286 nm, which was shifted to 203 nm in GO-Phe/ZnO hybrid. The blueshift of this peak is attributed to strong coupling effect between graphene sheets and the semiconductor nanoparticles. Furthermore, this blueshift can be assigned to a loss of GO stacking and conformational disordering caused by mixing with the ZnO nanoparticles. 64 –68
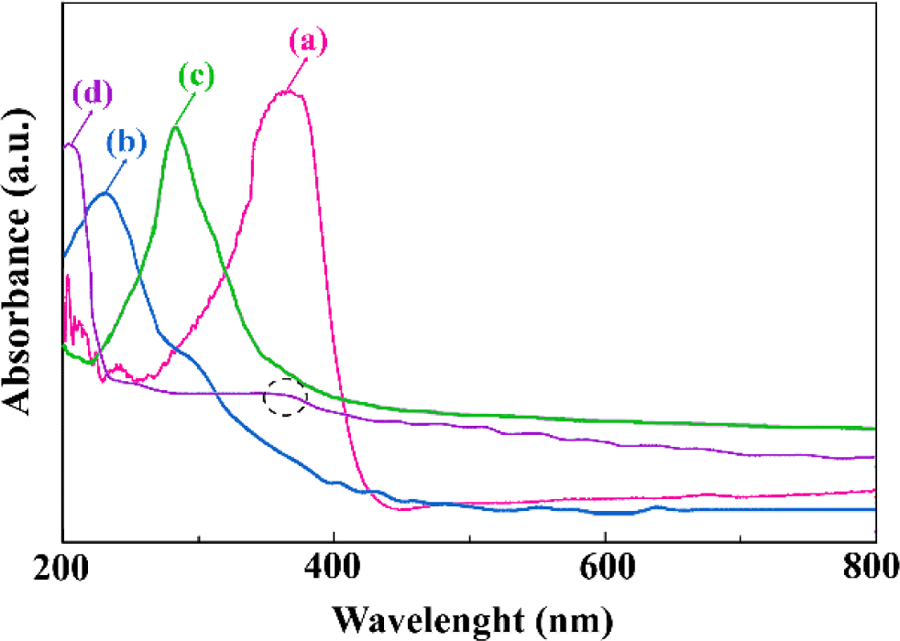
UV-Vis spectra of (a) f-ZnO, (b) GO, (c) Phe-GO and (d) Phe-GO/ZnO hybrid.
Synthesis and characterization of PEA/Phe-GO/ZnO NCs
For the synthesis of polymeric NCs, in this study, a novel optically active PEA-containing amino acid moieties was fabricated and used as a polymer matrix. For this aim, PEA was constructed through direct polycondensation of S-tyrosine-based diol and
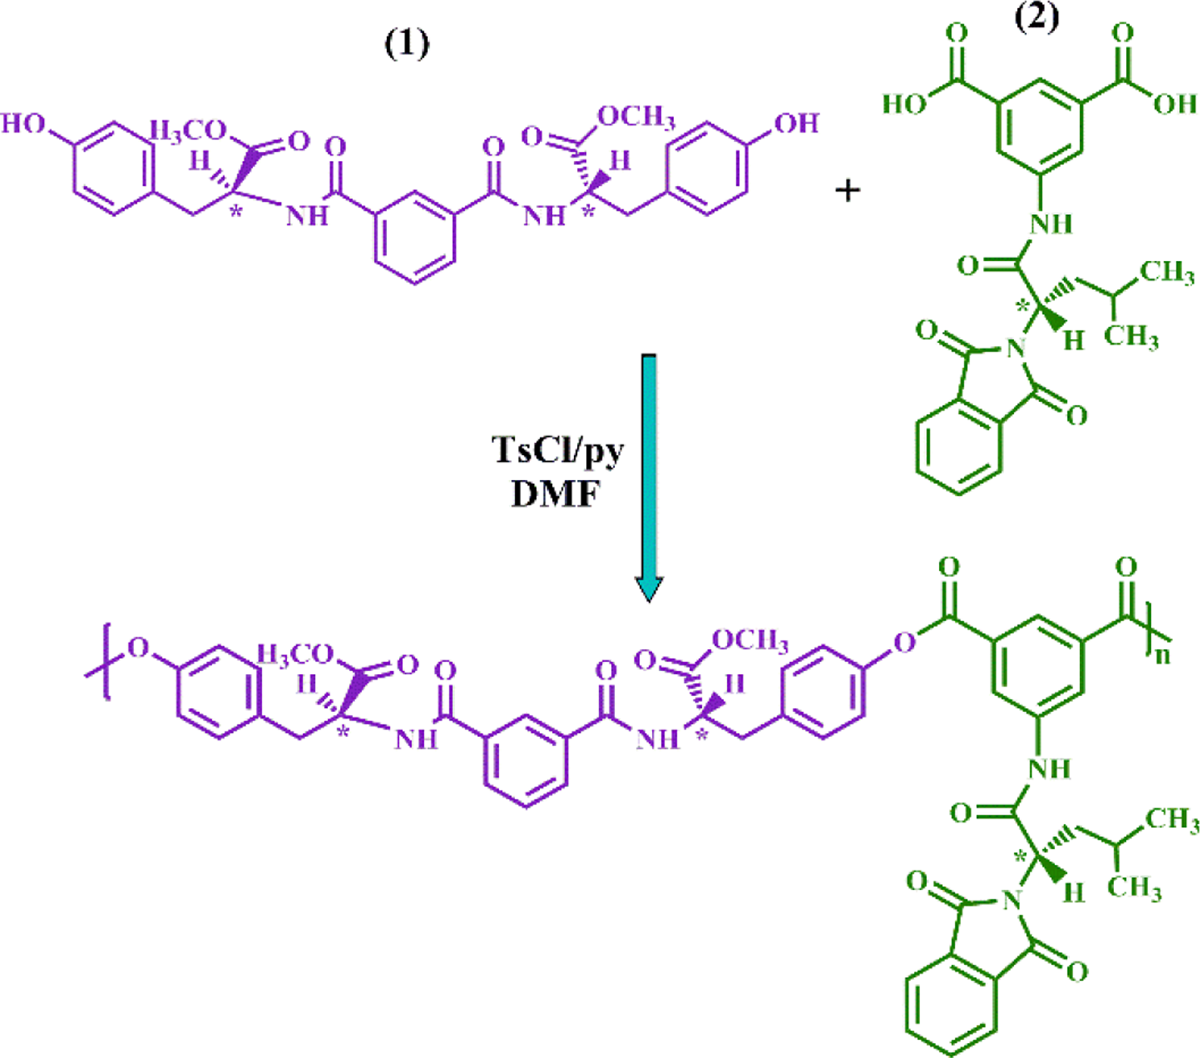
PEA synthesis. UV-Vis: ultraviolet–visible; Phe:
PEA/Phe-GO/ZnO NCs were prepared by dispersion of the Phe-GO/ZnO hybrid in 5, 10, and 15 wt% solutions of PEA in DMAc via a vigorous stirring for 1 day, followed by ultrasonication for 1 h. In this research, to achieve good dispersion and suitable interfacial adhesion between the polymer matrix and graphene, first, graphene sheets were functionalized, which lead to good dispersion of synthesized hybrid into PEA matrix. Introduction of abundant functional groups into the polymer backbone performs hydrogen bonding with Phe-GO/ZnO hybrid, which causes tightly attachment of PEA chains with modified graphene layers.
The structure of prepared PEA was confirmed by 1H NMR. The 1H NMR spectrum of PEA is shown in Figure 10. Two types of amidic NH were observed, which appeared at 10.45 and 9.13 ppm. The aromatic protons appear in the region of 7.27–8.71 ppm. Due to the existence of two types of amino acid in the polymer backbone, there should be two chiral centers, which can be observed at 5.01 and 4.75 ppm. The adsorption of –OCH3 proton groups appeared at 3.69 ppm and –CH2 groups of S-tyrosine apeared at 3.23 ppm. The adsorption of –CH2, C–H, and –CH3 groups of L-leucine appeared at 2.06–2.19, 1.47, and 0.95 ppm, respectively. The elemental analysis results were also in good agreement with calculated percentages of carbon, hydrogen, and nitrogen contents in the polymer repeating units, demonstrating that the expected compound was obtained.
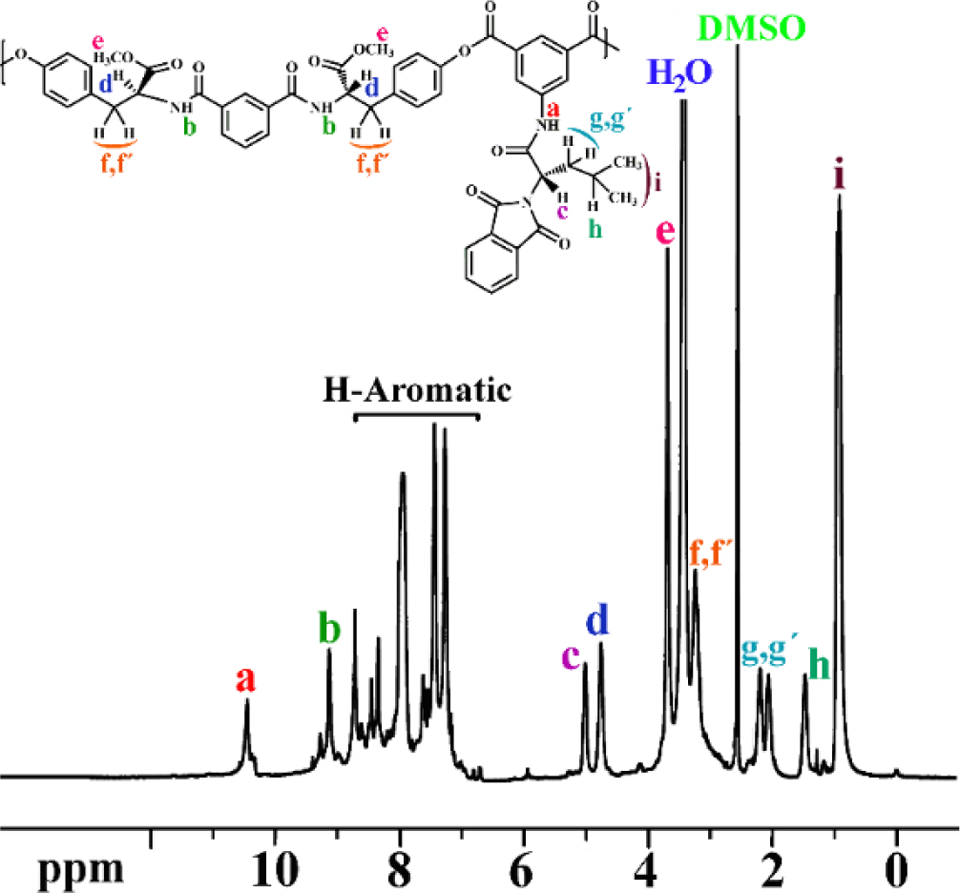
1H NMR spectrum of PEA in DMSO-d 6 at RT. 1H NMR: proton nuclear magnetic resonance; PEA: poly(ester–amide); DMSO-d 6: deuterated dimethyl sulfoxide; RT: room temperature.
FTIR was used as another tool to examine the structure of synthesized PEA and its NCs. The FTIR spectra of pure PEA and three kinds of PEA/Phe-GO/ZnO NCs (5, 10, and 15 wt%) are shown in Figure 11 and are compared with Phe-GO/ZnO hybride. The FTIR spectrum of resulting PEA showed the presence of the characteristic peaks for imide, ester, and amide functional groups. Absorption of amide –NH bond appeared at 3424 cm−1, and the peaks at 1773 and 1716 cm−1 confirm the presence of imide group. In addition, the carbonyl groups of ester and amide functions appeared at 1740 and 1641 cm−1, respectively, and the absorptions at 1380 and 719 cm−1 were assigned to the presence of the imide heterocycle in the polymer. The presence of prepared hybrid in the polymer matrix exhibited very little changes in the NCs FTIR spectra, probably due to the low hybrid composition and the weak vibration signals of hybrid. Moreover, compared to pure polymer, the Zn–O–Zn absorbance intensity in the spectra of NCs increased by increasing of Phe-GO/ZnO hybrid content.
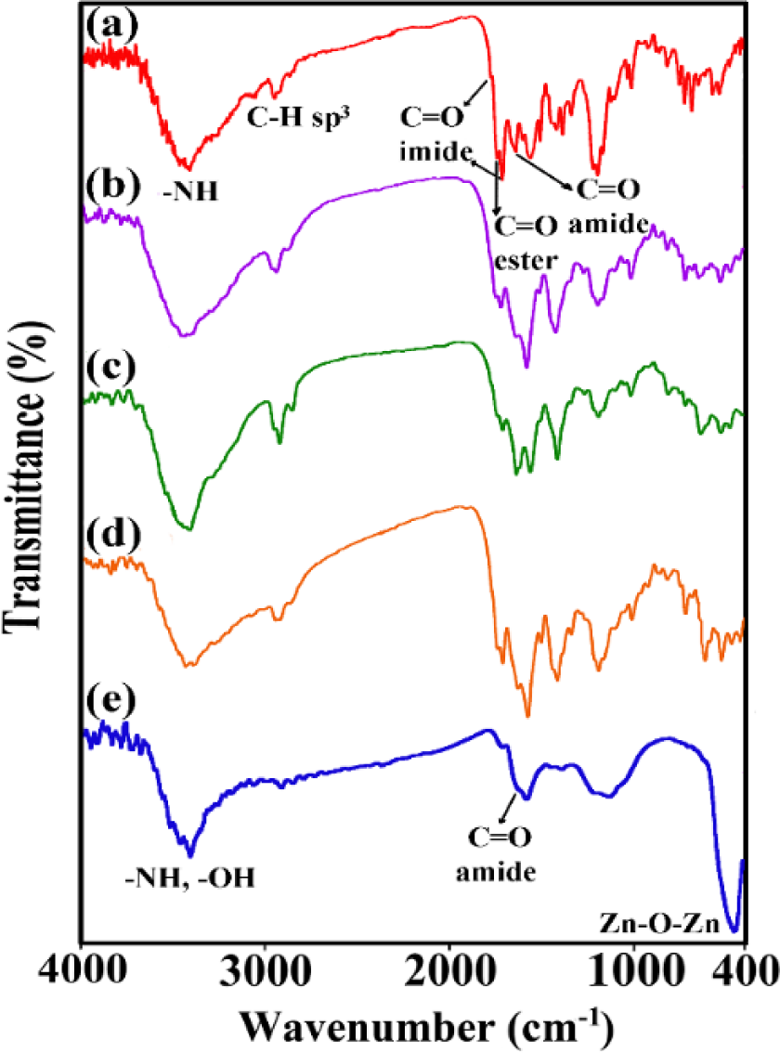
FTIR spectra of (a) pure PEA, (b to d) PEA/Phe-GO/ZnO NCs (5, 10, and 15 wt%), and (e) Phe-GO/ZnO hybrid. FTIR: Fourier transform infrared; PEA: poly(ester–amide); Phe:
The structure of pure PEA and PEA/Phe-GO/ZnO NCs (5, 10, and 15 wt%) was examined by XRD. XRD patterns of the PEA/Phe-GO/ZnO NCs are presented in Figure 12 and compared with Phe-GO/ZnO hybrid and pure polymer. Pure PEA demonstrates a broad reflection centered at a 2θ value around 20°, which is the feature of the amorphous polymer. NC samples exhibited similar XRD patterns like both pure polymer and GO/ZnO hybrid. All NCs display similar XRD patterns with different intensity of crystalline peaks of ZnO NPs. With comparing the spectra of NCs, the enhancement in crystalline peaks intensity was observed. Furthermore, the average size of the ZnO NPs in NCs is calculated to be 25–30 nm, which is obtained with the Debye–Scherrer formula:
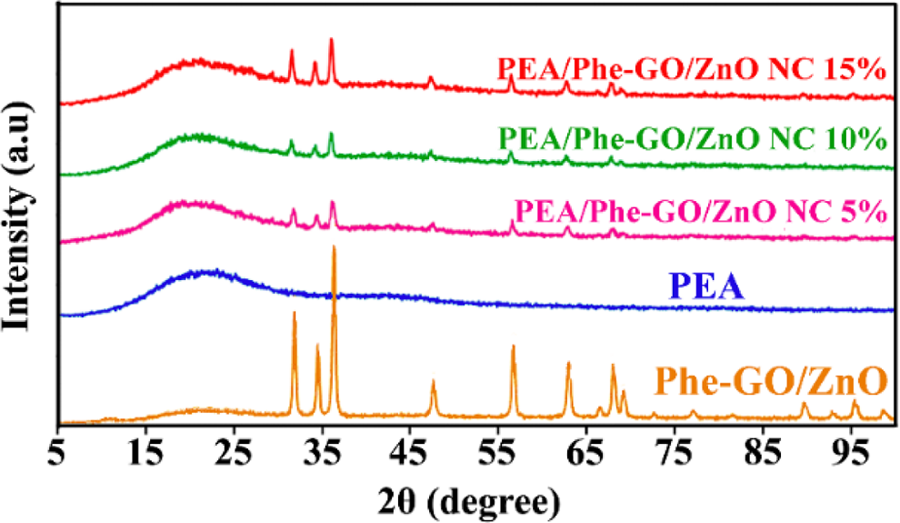
XRD patterns of pure PEA, Phe-GO/ZnO hybrid, and PEA/Phe-GO/ZnO NCs (5, 10, and 15 wt%). XRD: X-ray diffraction; PEA: poly(ester–amide); Phe:

For further consideration, the effect of Phe-GO/ZnO hybrid on PEA thermal properties was examined by TGA technique. Figure 13 presents the TGA curves of pure PEA, Phe-GO/ZnO hybrid, and PEA/Phe-GO/ZnO NC 15 wt%. Neat PEA exhibited single-step thermal degradation between 300°C and 600°C and a char yield of 37% at 800°C. By adding Phe-GO/ZnO hybrid into the polymer matrix, the thermal stability of polymer was increased and the char yield reached to 42%. According to the TGA curve of NC, a significant mass loss is detected around 100–300°C, which does not observe in TGA curve of pure polymer. This weight loss could be assigned to the decomposition of oxygen-containing functional groups and amino acid moieties on the surface of prepared hybrid.
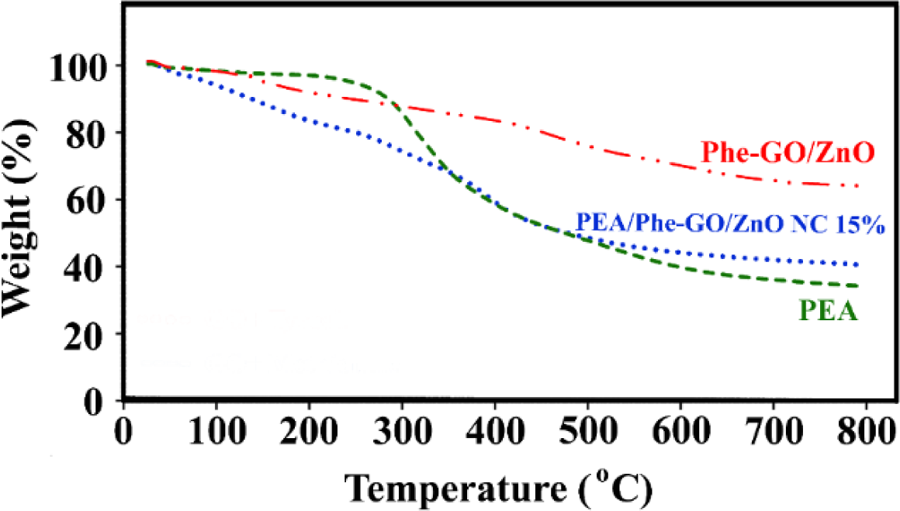
TGA curves of pure PEA, Phe-GO/ZnO hybrid and PEA/Phe-GO/ZnO NC 15 wt%. TGA: thermogravimetric analysis; PEA: poly(ester–amide); Phe:
The surface morphology of pure polymer and NCs are investigated by FESEM for further verification of morphology changes. Figure 14 displays the FESEM photographs of pure PEA and PEA/Phe-GO/ZnO NCs (5, 10, and 15 wt%) in different magnification. FESEM images of neat PEA (Figure 14(a) and (b)) exhibited approximately spherical-shaped particles, which are distributed uniformly and randomly. The polymeric particle diameter is ranging from 100 nm to 500 nm. By adding Phe-GO/ZnO hybrid into the polymer matrix, the polymer morphology was completely changed. As shown in the FESEM images of NCs, the prepared graphene hybride was interconnected in the polymer matrix and dispersed homogeneously through interfacial interactions of functional groups on the graphene and polymer surface. In some FESEM images of NCs, the graphene sheets came out of the polymer. Furthermore, by increasing the content of Phe-GO/ZnO hybrid, the amount of ZnO NPs was enhanced on the polymer surface.
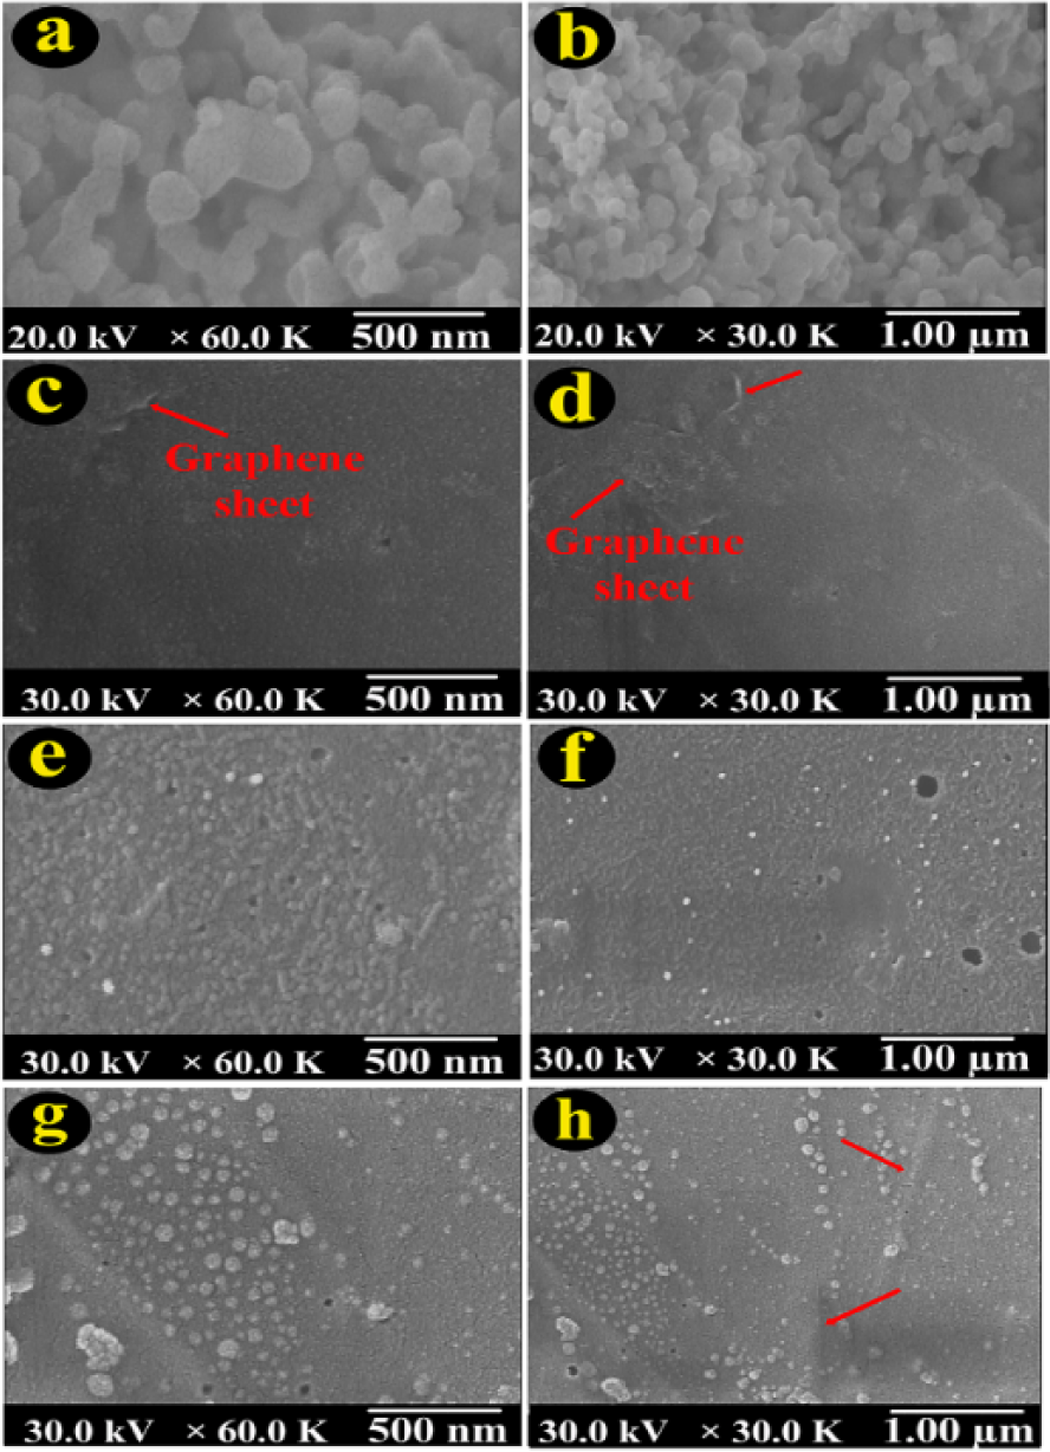
FESEM photographs of pure PEA (a, b); PEA/Phe-GO/ZnO NC 5 wt% (c, d); PEA/Phe-GO/ZnO NC 10 wt% (e, f), and PEA/Phe-GO/ZnO NC 15 wt% (g, h). FESEM: field-effect scanning electron microscopy; PEA: poly(ester–amide); Phe:
The dispersion quality of Phe-GO/ZnO hybrid in the PEA matix was evaluated by TEM observation. Figure 15 presents TEM images of PEA/Phe-GO/ZnO NC 15 wt% in different magnification. The light gray thin films are the graphene sheets, and the dark sphere particles on the graphene layers are f-ZnO NPs. f-ZnO NPs were dispersed uniformly on the graphene sheets with no aggregation. The f-ZnO NPs size distribution in the prepared NC was obtained from a histogram, which was attained by measuring the diameter of all particles from different fractions of the grid. The obtained histograms revealed that the ZnO size distribution is a narrow normal one with 12 and 13 nm average value and 2 and 3 nm standard deviations.
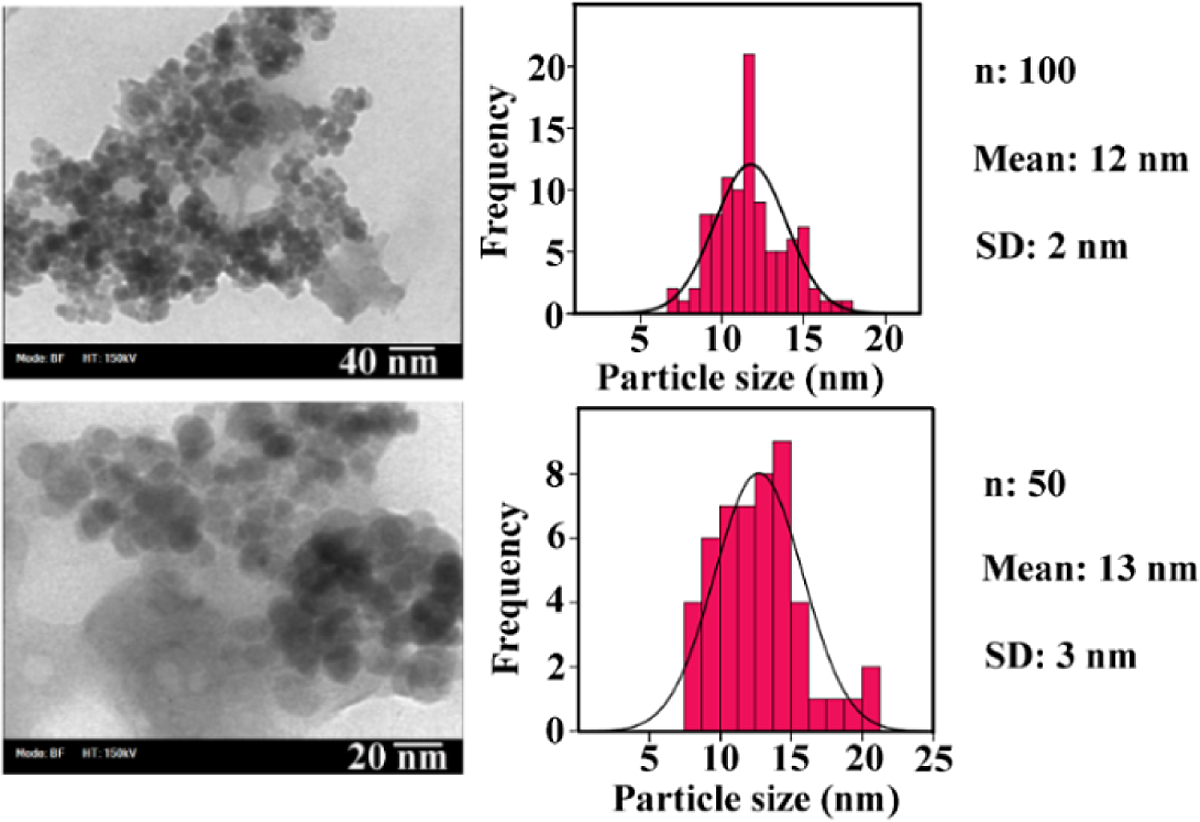
TEM photographs of PEA/Phe-GO/ZnO NC 15 wt% with the histograms of ZnO NPs. TEM: transmission electron microscopic; PEA: poly(ester–amide); Phe:
Conclusions
Amino acid-based graphene decorated by ZnO NPs was fabricated via attaching of ZnO NPs onto graphene sheets. To achieve this, graphene sheets were functionalized with
Footnotes
Acknowledgments
We gratefully acknowledge the partial financial support from the Research Affairs Division Isfahan University of Technology (IUT), Isfahan. Further partial financial support of Iran Nanotechnology Initiative Council (INIC), National Elite Foundation (NEF) and Center of Excellency in Sensors and Green Chemistry (IUT) is also gratefully acknowledged.
Declaration of Conflicting Interests
The author(s) declared no potential conflicts of interest with respect to the research, authorship, and/or publication of this article.
Funding
The author(s) received no financial support for the research, authorship, and/or publication of this article.