
Abstract
Paulownia wood flour (PWF), a by-product of milling lumber, was employed as a biofiller and blended with high-density polyethylene (HDPE) via extrusion. Paulownia wood (PW) shavings were milled through a 1-mm screen and then separated via shaking into various particle fractions (600–≤74 µm) using sieves (#30–>#200 US Standards). The influence of a commercial coupling agent, maleated polyethylene (MAPE), used at various concentrations (0, 1, 3, 5, or 10% w/w) with HDPE and wood particles obtained from a #50-mesh sieve, is examined. Incorporation of high concentrations of MAPE (approximately 5%) in HDPE-PWF blends improved tensile strength compared to lower MAPE concentrations (≤3%). Particle size of wood significantly influenced the mechanical properties of the biocomposite. HDPE-MAPE blends containing smaller wood particles (<180 µm) had higher tensile strength than neat HDPE or blends containing larger particles (>300 µm). Young’s modulus for all HDPE-PWF-MAPE blends was 14–27% higher than that of neat HDPE. Generally, incubation of tensile bars of various HDPE-PWF blends in 95% humidity for 28 days reduced the mechanical properties approximately by 5%. Differential scanning calorimetry analysis showed a slight reduction in the percentage crystallinity among various HDPE-PW blends.
Keywords
Introduction
In 2009, over 1.5 million tons of wood–plastic composites (WPC) were manufactured worldwide, with the leading producers as follows (tons): North America (1 million tons), China (200,000 tons), Japan (100,000 tons), and Germany (70,000 tons). 1 Based on 2006 data, the US WPC products are as follows (%): decking (38%), molding and trim (35%), windows and fencing (13%), doors (4%), and other applications (6%). 2 The demand for solid wood decking in the US is projected to increase at <1% per annum through 2013 while the alternative WPC decking grows at 10% per annum. 2 Consumers are attracted to WPC over solid wood decking because of long life span, minimal maintenance requirements, and imperviousness to degradation by wear and tear and moisture exposure. 2 It is estimated that in 2013, WPC decking manufacturing will achieve 3.6 billion linear feet and be valued at $5.2 billion. 2 The demand for WPC materials is achieving even higher growth rates in Europe and rest of the world. 1 For example, Germany’s WPC that is primarily used in automotive interiors and decking is expected to increase 15% per annum through 2014. 2 China is projected to increase its WPC production to 5 million tons by 2015. 1,3
Most WPC consists of petroleum-based thermoplastics such as polyethylene (PE) or polypropylene (PP) mixed with up to 50% wood flour (WF; w/w) depending on its availability, mechanical and physical properties, and industrial acceptance. 4 –7 PE and PP are sold for nearly US$0.41–0.51 per kilogram (US$0.91–1.12 lb−1) and nearly $0.50–0.55 per kilogram ($1.10–1.22 lb−1), respectively. 8 Inorganic (glass fibers and calcium carbonate) and natural (wood flour (WF) and lignocellulosic agricultural byproducts) fillers are employed in plastic composites to reduce the cost and improve its mechanical and physical properties. 5 –7 Commercial hardwood WF is produced by pulverization and sieving lumber milling byproducts (sawdust and shavings). Typically, WF is composed of blends containing various hardwood tree species (maple, birch, and ash), and sold for nearly US$0.04–0.10 per kilogram (US$0.08–0.22 lb−1; Personal Communication, Fred Faehner/President, P.J. Murphy Forest Products, Montville, New Jersey, USA, March 3 2012). 5,6 Several investigators have studied the uses of various filler sources with PE to obtain unique composites. 9,10 The incorporation of WF into US WPC industry has increased from 45,459 million tons in 1995 to 816,466 million tons in 2007. 5
Sawdust and shavings are essentially generated by the housing construction industry and are sold to a variety of markets including bioenergy (fuel pellets), agriculture (animal bedding and composting), and building/construction (fiber reinforcement products, tiles, and cement). Wood waste material prices fluctuate on the basis of availability (housing demand) and the demand for their utilization, 11 for example, between 2006 and 2008 when the US housing market contracted sawdust prices quadrupled due to lack of supply. 11 Currently, 85% of wood waste is consumed for energy production (fuel pellets and direct combustion). 12 The Energy Independence and Security Act of 2007 13 mandates that 36 billion gallons of biofuels be produced by 2022. To satisfy this requirement, it is estimated that 22.2–55.5 million acres be devoted to grow biofuel-based crops. Approximately 5.5 billion gallons of biofuels are produced annually. A number of government subsidy programs are being implemented to divert the sale of woody biomass to bioenergy facilities. 14 Dramatic changes in terms of cost, availability, and utilization of the biomass and wood waste markets will likely occur in the near future. 14,15 Since the demand for WF needed by the WPC industry will increase, and the cost of WF will increase due to the bioenergy mandates, there are opportunities for alternative sources of woody biomass to be utilized.
Alternative sources of woody biomass to provide WF are being developed. 16 –21 For example, harvesting small diameter trees obtained from forest understories or brush conditions offers a source of wood waste materials for bioenergy as well as WF for WPC. 17,18 Short rotational woody crops (SRWC) utilizing “fast-growing trees” are another option to obtain inexpensive sawdust and WF. 20 Utilization of marginal land has been suggested as the potential sites for bioenergy woody tree crops. 7,20,22,23
Trees of Paulownia elongata S.Y. Hu, Family Paulowniaceae, are native to Mainland China. Paulownia trees are fast-growing coppicing hardwoods grown in plantation cultivation in China and Japan where their wood is highly valued in the building/construction and furniture industries. 24 –28 In addition, Paulownia has been suggested as a bioenergy crop since a 2000-tree per hectare planting can yield up to 150–300 tons of wood within 5–7 years. 28 Paulownia trees are amenable to be established on marginal lands and have deep tap roots that make them drought resistant. 28 Growth rate heights up to 3.7–4.6 m in a year is common. 24 Characteristics of Paulownia wood (PW) include: light weight, soft texture, insect resistance, pale coloration, and heat resistance. 24 –28 Paulownia species, such as P. elongata, Paulownia Kawakamii, and Paulownia tomentosa, are currently being grown and evaluated in the US and are being evaluated for their commercial wood properties. 24,28 Studies conducted at Fort Valley State University, Fort Valley, Georgia, USA, has shown that 2- to 4-year-old trees can grow up to a diameter of 16.5 cm and achieved a height of 10 m. These trees could offer an inexpensive source of woody biomass for energy as well as lumber and provide the wood wastes needed for manufacture of WF. 24,25,28 To date, Paulownia WF (PWF) has not been blended with high-density polyethylene (HDPE) to produce a WPC. Therefore, we are interested in evaluating the mechanical, physical, and thermal properties of WPC derived from various PW particle sizes blended with PE. Of particular interest to us was the employment of WF derived from juvenile trees since small diameter SRWC are increasingly likely to be a source of woody biomass needed by the US for various applications in the future. Hence, this study was conducted to produce a WPC using PWF of various particle sizes derived from juvenile tree biomass (i.e. 36 months old).
Experimental
Materials
HDPE employed as the matrix material was Petrothene LS 5300-00 (Equistar Chemicals LP, Houston, Texas, USA) and had melt flow index of 40 g/10 min, density of 0.950 g cm−1, and melting point of 129°C. The binding agent, maleated polyethylene (MAPE, NE542013) was supplied by Equistar Chemicals LP and had a melting point of 104–138°C.
P. elongata (Family Paulowniaceae) wood material was obtained from 36-months-old trees grown in Fort Valley, Georgia, USA. Chemical composition of PW shavings obtained from board processing was conducted at National Renewable Energy Lab (Golden, Colorado, USA). The analytical protocols we used have been described in the literature 29,30 and are available from the website (http://www.nrel.gov/biomass/analytical_procedures.html). This analysis involves a series of analytical protocols to summatively measure the components in biomass (i.e. individual component measurements followed by a summation). These components are measured on a whole biomass and dry mass (105°C) basis. Samples are extracted with water and ethanol to remove soluble materials. The remaining extracted solids are hydrolyzed using a 72:4% H2SO4 protocol to convert the structural polymer carbohydrates to monomer sugars, which are detected using high-performance liquid chromatography. The material remaining after hydrolysis is measured as lignin. Additional testing is performed to determine ash (reported as structural and nonstructural inorganics), protein (measured as 4.7 × normality percentage), and acetyl groups. We sum up the components to determine the analytical component closure, which is reported in the “total percentage” column. This normally falls in the range of 100 ± 5%. As an internal standard, bagasse material (NIST RM 8491) with each hydrolysis batch was also run. We have found normal variability for the carbohydrates to be about 1.5% (absolute) and for the remaining components to be about 1%.
Shavings were ground with a Thomas-Wiley mill grinder (Model 4, Thomas Scientific, Swedesboro, New Jersey, USA) equipped with six stationary steel cutting knives within a grinding chamber (197 (inner diameter) × 76 mm2 deep) and sheared with four steel knives bolted to a removal rotor operated at constant 800 r min−1 speed. Wood particles exited through a 2-mm diameter stainless screen and were collected. Particles were then reground and collected using a 1-mm screen and then reground a second time. Particles were then sized through a Ro-Tap™ Shaker (model RX-29, Tyler, Mentor, Ohio) employing 203 mm diameter stainless steel screen/sieves. Sieve/screens employed were #10, #30, #40, #50, #60, #80, #140, and #200 of US standards (Newark Wire Cloth Company, Clifton, New Jersey, USA). To obtain particle separation, the shaker was operated for 60 min intervals at 278 r min−1. A composite PWF mix composed of particles obtained from the #40 mesh and finer (≥#40) sieves was also employed. Additional grinding to obtain fine powder (>#200) was carried out by taking 1-mm milled PWF and ball grinding in a laboratory bench top ball mill (Model 801CVM, U.S. Stoneware, East Palestine, Ohio, USA). Images of various sieved fractions used in this study are shown in Figure 1. Ball mill was equipped with 91.44 cm long rollers. PWF was ground in alumina mill jar containing Burundum cylindrical grinding media pellets (13 mm diameter, nearly 7.3 g wt; U.S. Stoneware) at a speed of 50 r min−1 for 60 h. Each screen fraction was then removed and oven dried for 48 h at 100°C to obtain a moisture content of nearly 1–2%. In this work, as summarized in Table 1, the particle size of the PW is inversely related to the screen size; thus, the #40 screen has the largest particles (425–600 µm) and #200 screens has the finest particles (74–106 µm). Density (in gram per cubic centimeter) for each PW fraction was determined by transferring 5 g of each oven dried wood fraction into a volumetric cylinder, tapping five times to facilitate settling and then recording the volume.
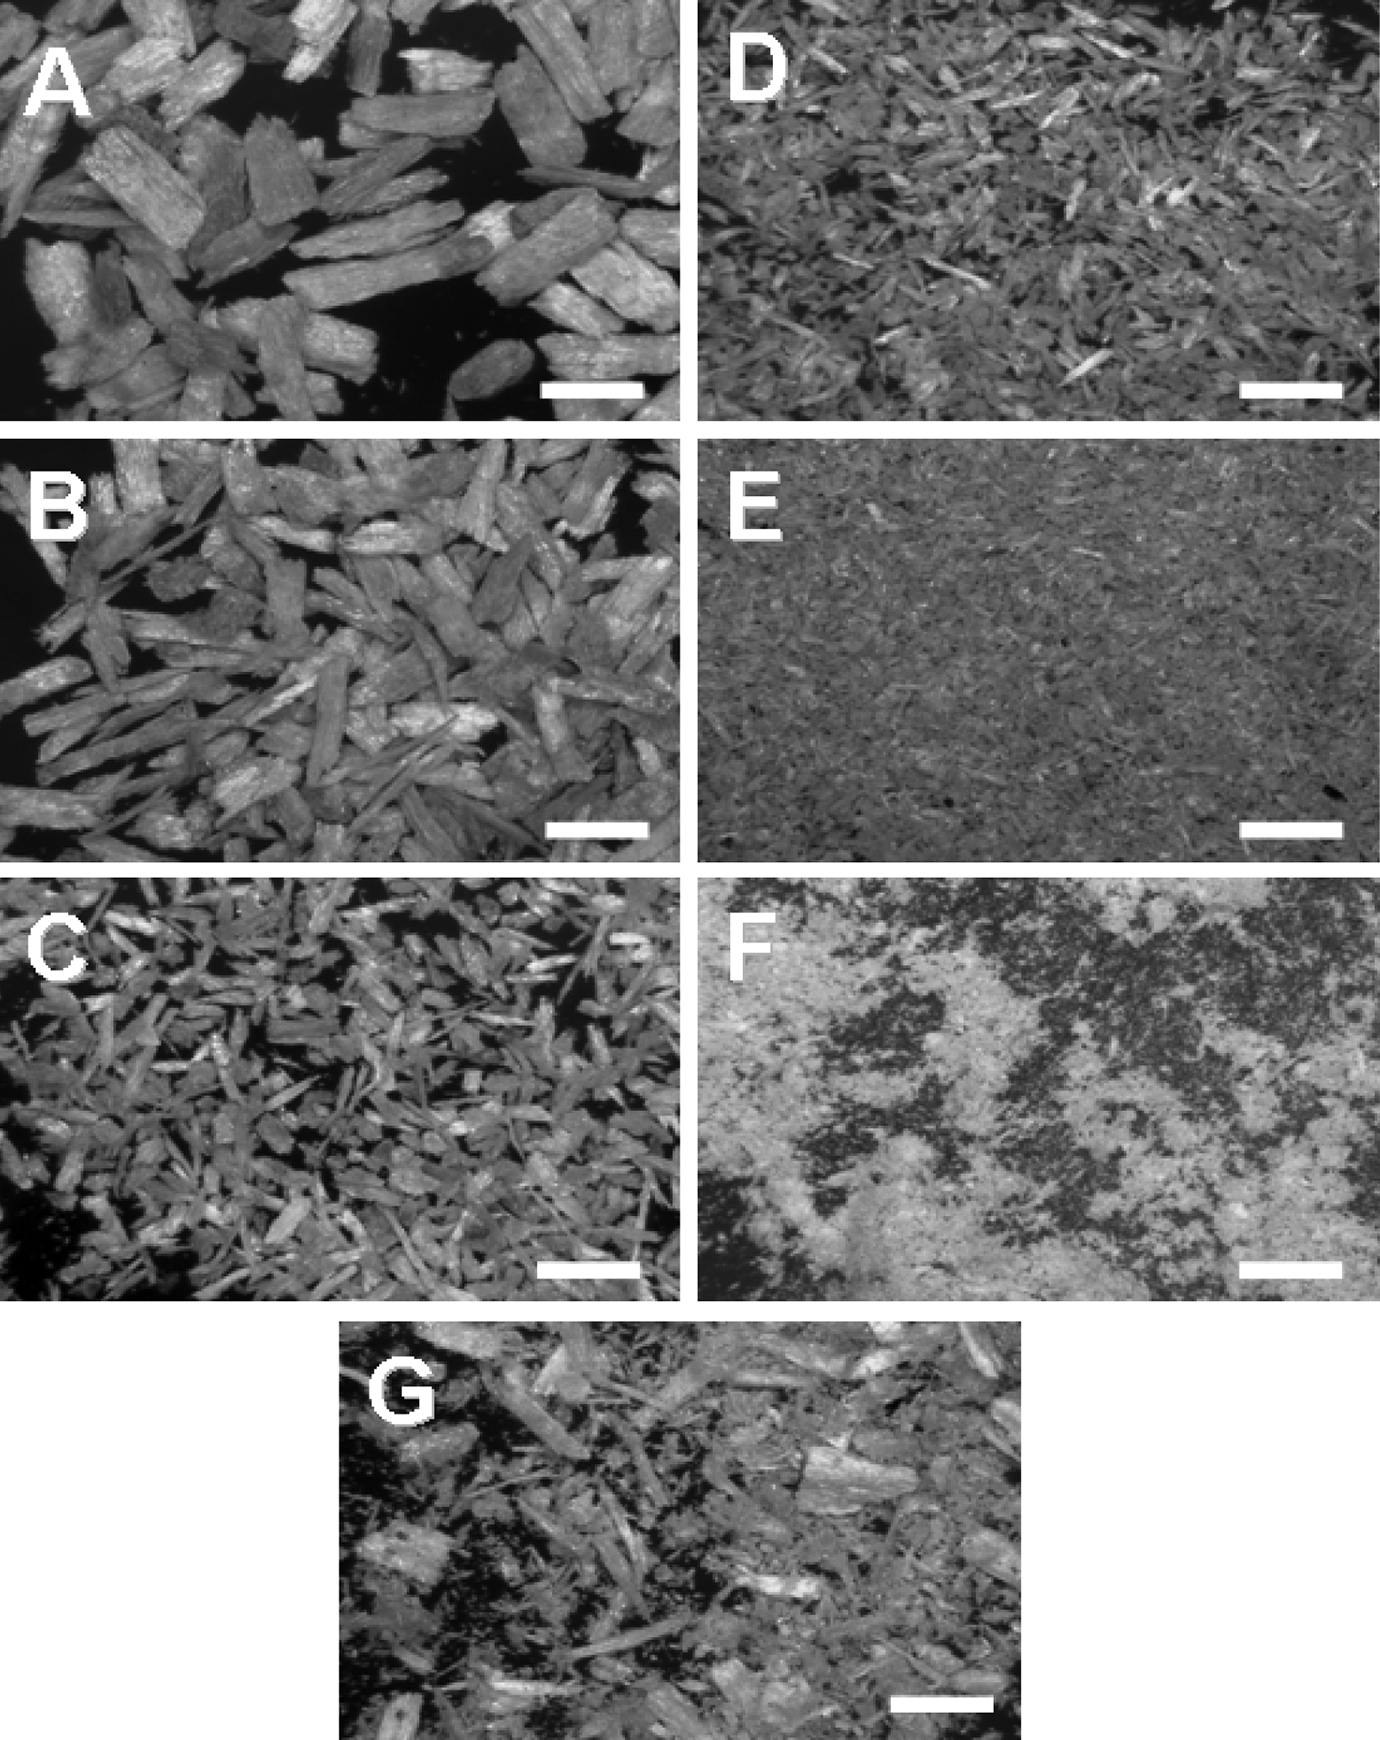
Examples of PW-sieved fractions and particle sizes. (A) #40 sieve (425–600 µm); (B) #50 sieve (300–425 µm); (C) #80 sieve (180–250 µm; PW; (D) #140 sieve (106–180 µm); (E) #200 sieve (74–106 µm); (F) >#200 ball ground (≤74 µm); and (G) ≥#40 sieve (≤600 µm). Bar = 100 µm. PW: Paulownia wood.
Distribution percentages of screened wood.
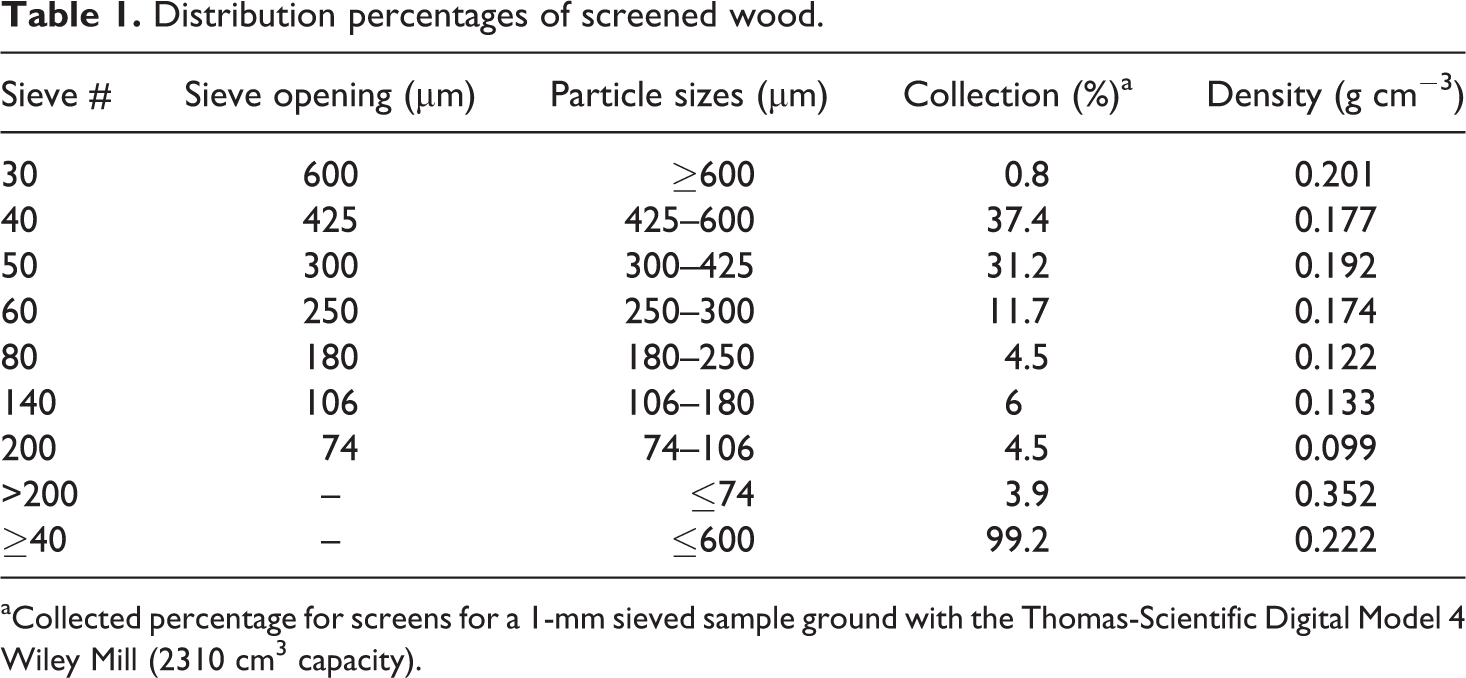
aCollected percentage for screens for a 1-mm sieved sample ground with the Thomas-Scientific Digital Model 4 Wiley Mill (2310 cm3 capacity).
Extrusion runs
To investigate the influence of the coupling agent concentration on the mechanical and thermal properties of HDPE-PWF composites, blends of HDPE-PW-MAPE by weight percentage were prepared that are summarized in Table 2. PWF from the #50 mesh sieve was employed in all blends of varying MAPE concentrations. In addition to the coupling agent concentration, the effect of the PWF loading was evaluated by creating a composite blend with 50% PWF loading at 0 and 5% MAPE.
Percentage by weight composition of HDPE-PW composites.
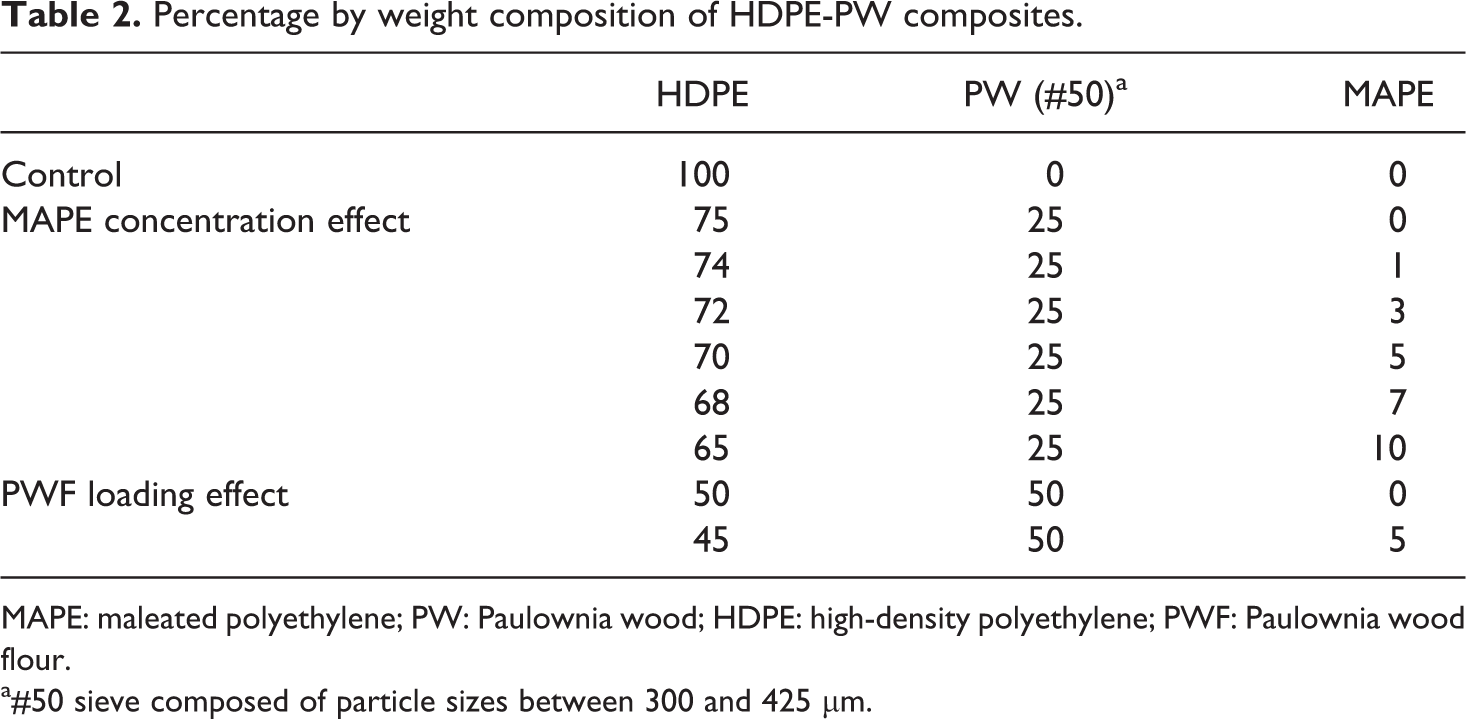
MAPE: maleated polyethylene; PW: Paulownia wood; HDPE: high-density polyethylene; PWF: Paulownia wood flour.
a#50 sieve composed of particle sizes between 300 and 425 µm.
To determine the influence of PWF particle size on the mechanical and thermal properties of HDPE-PWF composites, PWF from #40, #50, #60, #80, #140, and #200 meshes, <#200 (ball ground), and ≥#40 (composite mixture) were employed. Table 1 shows the correlation of particle size to US mesh screen/sieve sizes. Preparations with different particle sizes used a blend of 70% HDPE–25% PW–5% MAPE by weight percentage.
The composite blends for all studies were compounded with a corotating twin screw extruder (model Micro-18 30/l L/D, American Leistritz Extruder, Branchburg, New Jersey, USA). The screw configuration was:

Mechanical and moisture uptake evaluations
Ribbons obtained from extrusion were die cut into ASTM D638-99 Type V tensile bars (6.2 (length) × 1.0 (width) cm2) and evaluated using a universal testing machine (Model 1122, Instron Corporation, Norwood, Massachusetts, USA). Initial samples (dry) were conditioned for approximately 72 h at standard room temperature and humidity (23°C and 50% relative humidity (RH)).
To determine the influence of moisture uptake on composite blends, tensile bars were initially dried for 48 h at 90°C, weighed, and then conditioned for 600 h under 95% RH environment and periodically weighed to determine moisture uptake. Tests were conducted in an incubator at 25 ± 2°C under a photosynthetic photon flux density of 180 µmol m2 s−1 using a photoperiod of 12-h light–dark. At the end of the moisture treatments, the mechanical properties of bars were evaluated as described previously.
Thermal property evaluation with DSC
Thermal analysis of the extruded specimens was conducted using a differential scanning calorimeter (DSC; Auto DSC-7 calorimeter with a TAC/DX controller, TA Instruments, New Castle, Denver, USA). Samples of 5–7 mg were sliced from the extruded specimens, weighed, and sealed hermetically in aluminum DSC pans. The calorimeter was programmed to increase the temperature from 0 to 180°C at a rate of 10°C min−1, kept isothermal for 3 min, cooled to −50°C at a rate of 10°C min−1, and reheated to 180°C. Data from the second heating cycle were used to determine the melting temperature (T
m) and enthalpy of melting (▵H
m) for HDPE-PW blended samples. The heat flow rate corresponding to the crystallization of HDPE in composites was corrected for the content of the WF and MAPE. The value of crystallization heat was also corrected for the crystallization heat of MAPE. The crystallinity level (χ
c) of the HDPE matrix was evaluated from the following relationship
10
:
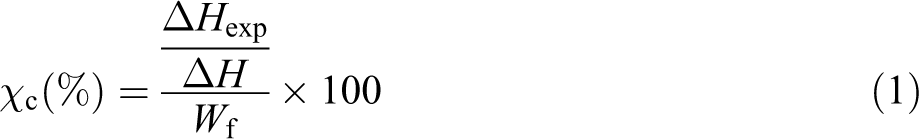
where ▵H exp is the experimental heat of fusion (▵H m) or crystallization determined by DSC, ▵H is the assumed heat of fusion or crystallization of fully crystalline HDPE (293 J g−1), and W f is the weight fractions of HDPE in the composites.
Scanning electron microscopy
Sputter-coated material was viewed under a variable pressure scanning electron microscope (Model 3400 N II, Hitachi High Technologies America Inc., Pleasanton, California, USA). Samples were freeze fractured to reveal original composition/configuration of resin and WF in the biocomposite prior to gold coating. Sample fragments were mounted with two-sided adhesive carbon disc to specimen stubs, and sputter coated using a Denton Vacuum Desk V Cold Sputter/Etch Unit (Denton Vacuum, LLC, Moorestown, New Jersey, USA). Coating was carried out for 60 s using 30 mA current at 10 kV. Unaltered surfaces and fractured surfaces of HDPE and HDPE-PW samples were examined, and digital images were collected at magnifications of 50, 100, 200, and 1000×. Figure 2 shows images for neat HDPE and two composite blends made with the finest and most coarse fibers used in this study. All scanning works were conducted at the Agricultural Research Station, Fort Valley State University, Fort Valley, Georgia, USA.
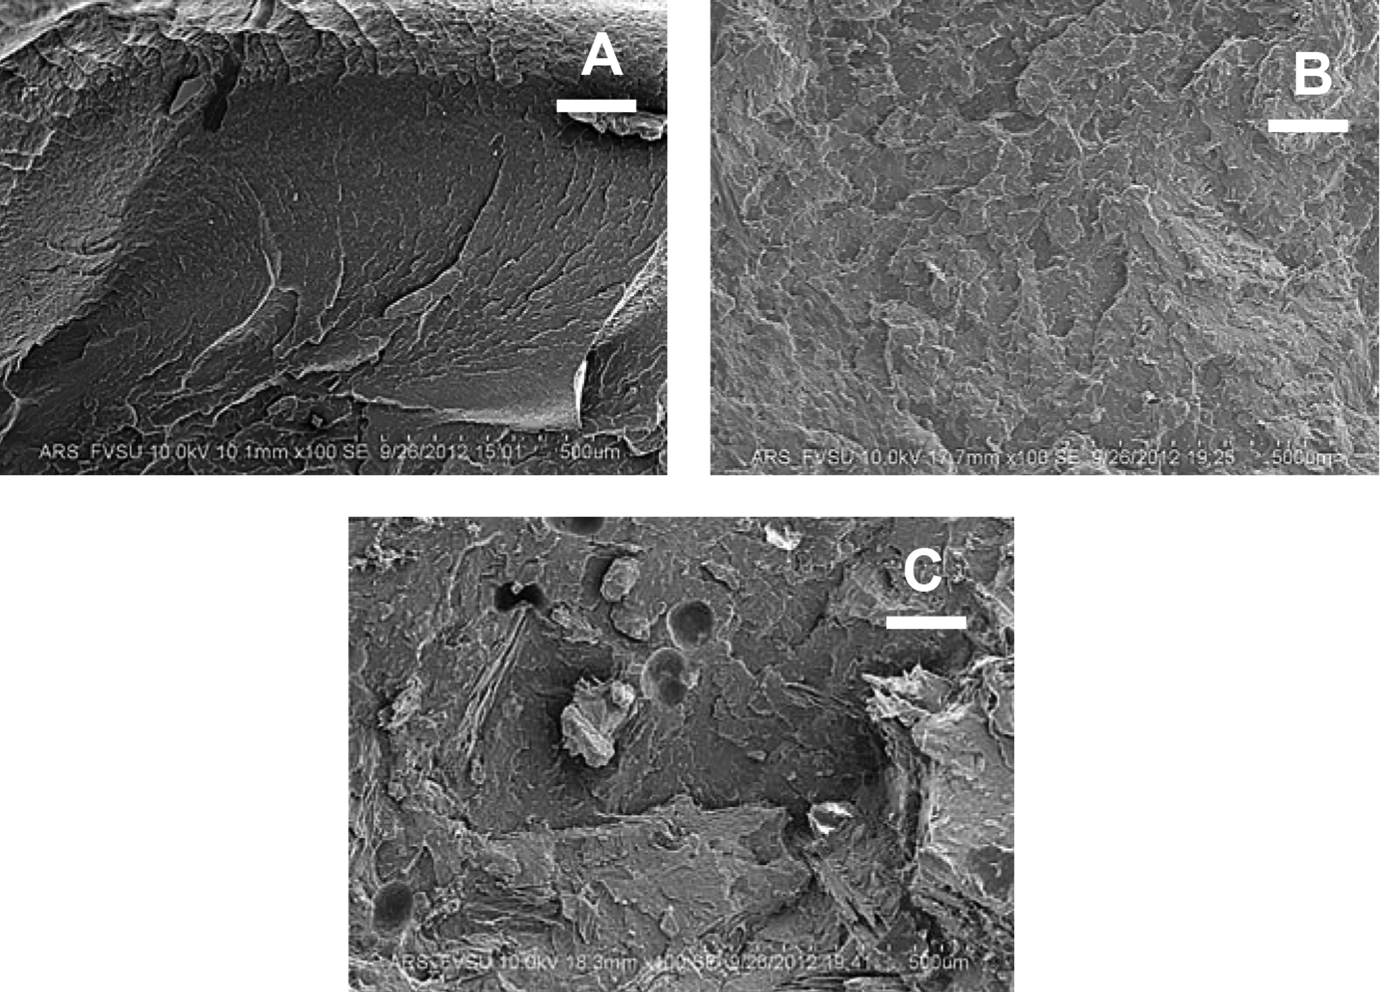
SEM micrograph of fractured neat HDPE and HDPE-PW blends containing various wood fractions. (a) HDPE only; (b) HDPE-PW >#200 (ball ground); and (c) HDPE-PW #≥40. Bar = 150 µm. SEM: scanning electron microscopy; HDPE: high-density polyethylene; PW: Paulownia wood.
Statistical analysis
Experimental data obtained were analyzed statistically using analysis of variance for statistical significance, and multiple comparisons of means were accomplished with Duncan’s multiple range test (p ≤ 0.05).
Results and discussion
Milling, sieving, and processing of HDPE-PW composites
Each species produces a WF with its own specific physical, chemical, and processing properties that uniquely interact with thermoplastics (Personal Communication, Fred Faehner/President, P.J. Murphy Forest Products, Montville, New Jersey, USA, March 3 2012). 5,6 Red oak WF, for example, contains high concentrations of phenolic compounds, which may cause WPC to exhibit undesirable oxidization and staining when wet. 5 Popular commercial hardwood WF blends are often composed of mixtures of maple, birch, beech, and ash flours (American Wood Fibers, Schofield, Wisconsin, USA; P.J. Murphy Forest Products Corporation). Softwoods such as pine (gymnosperm) WF are also commercially employed but are noted for their high levels of secondary products that may affect thermoplastic resin behavior. 5 Chemical analysis of PW revealed that it contains water and ethanol extractables (nearly 12% w/w). How these extractables and thermoplastic resins interact is unclear.
Commercially, WF is produced from a variety of grinding and processing techniques that involve size reduction and size classification. 5 As shown in Table 1, the PWF obtained through the 1-mm screen of the Model 4 Wiley mill grinder produces a mixture of particle sizes when the WF was subsequently sieved through various meshes. Photographs of representative particles are shown in Figure 1. The majority of PW particles were collected in the #40 to #80 sieves (nearly 85%). Density of various wood fractions is shown in Table 1. Generally, sieved fractions that contained larger particles had higher densities. For example, the #40 fraction had a density of 0.177 g cm−3, while the #200 fraction had a density of 0.099 g cm−3. Interestingly, the ball ground fraction (>#200), which is composed of the smallest particles, had the highest density (0.352 g cm−3) observed. Commercial WF is sold with a known size classification, and the #40 to #80 sieve fractions are common WF products (American Wood Fibers, USA; P.J. Murphy-Forest Products Corporation). During the extrusion of ribbons employing HDPE-PW that contained various particle sizes, we noted that uniform particle mixing (i.e. lack of WF clumping) occurred for all fractions employed.
Coupling agent concentration effects
The mechanical properties of tensile strength (σ U), elongation at break (%El), and Young’s modulus (E) of the HDPE-PW composites containing various concentrations of PW and MAPE are shown in Table 3. Furthermore, the data in Table 3 are plotted in Figures 3 and 4 as normalized mechanical properties relative to neat HDPE. These presentations clearly show the benefit of using PW and MAPE. When 25% PW is added to HDPE and no coupling agent is used, the E value increases by 47%, which is attributed to the particles impeding the relative motion of the macromolecules. The tensile strength, however, is reduced by 30%. Tensile strength is a measure of how well a material can support a stress field without developing internal microcracks, also called crazes. 31 Additives that can reduce the intermolecular bonding between the spherulites in the HDPE matrix will lower the stress needed for craze formation. 31 The reduction in tensile strength is attributed to the occurrence of localized defects at the interface of the polar wood particles and the nonpolar HDPE matrix. These areas of material inhomogeneity are nucleation sites for small cracks that form in the composite when the composite is put under a stress during loading. 32 The addition of MAPE functions by binding the polar wood fiber to the HDPE and this apparently reduces the number of defect sites as evidenced that the resultant tensile strength for PW composites with MAPE is comparable to the neat HDPE as shown in Table 3 and Figure 3. Higher levels of the MAPE, from 5 to 10%, improved the tensile strength on the order of 10%.
Effect of MAPE on mechanical properties of PW-HDPE composites.
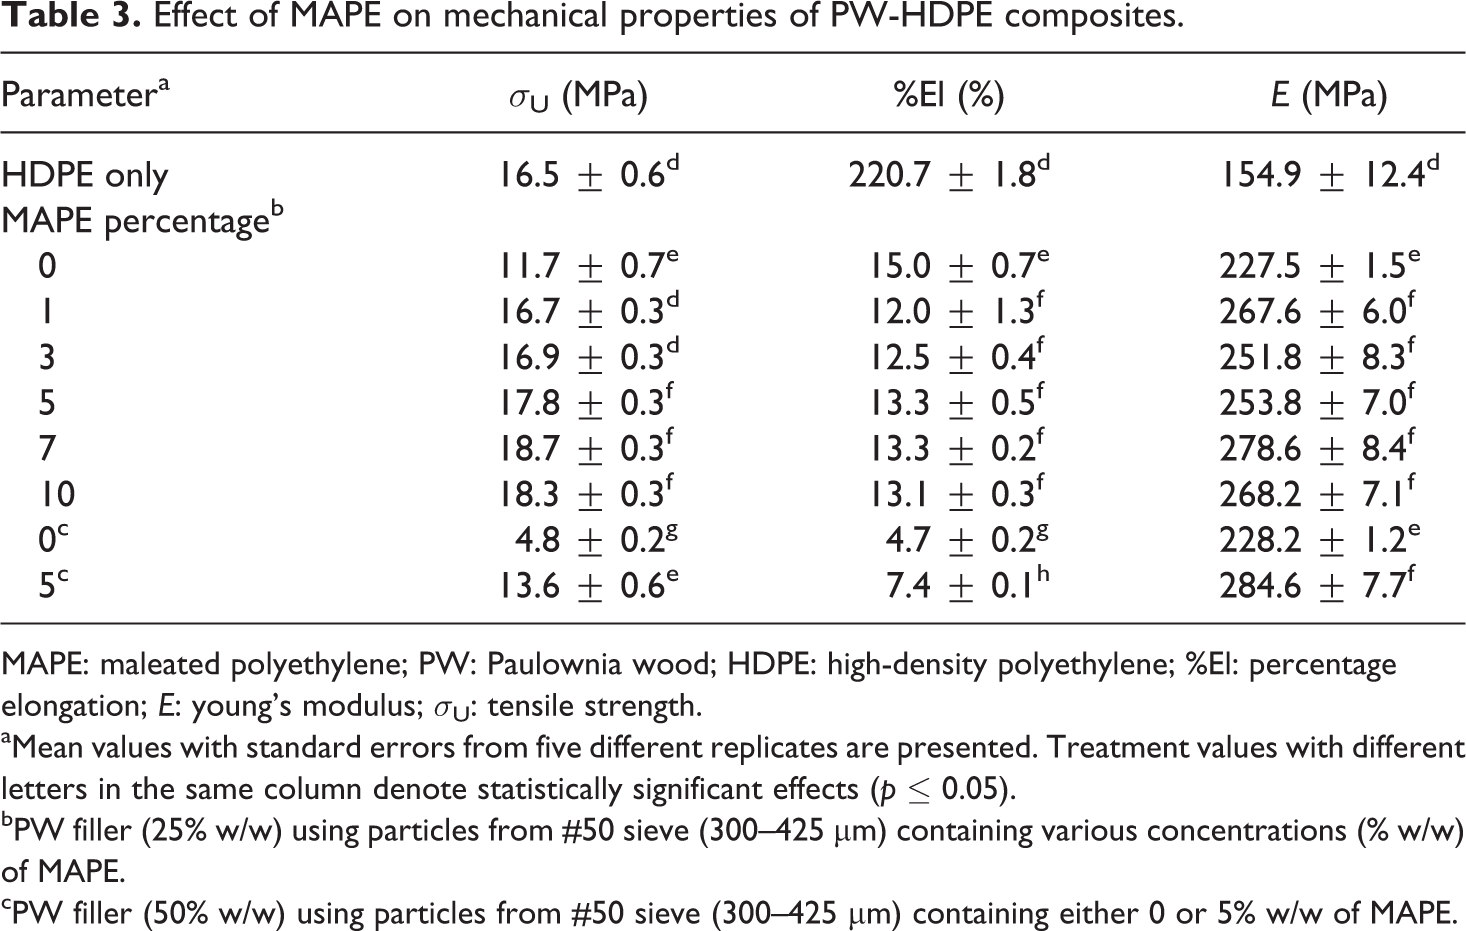
MAPE: maleated polyethylene; PW: Paulownia wood; HDPE: high-density polyethylene; %El: percentage elongation; E: young’s modulus; σU: tensile strength.
aMean values with standard errors from five different replicates are presented. Treatment values with different letters in the same column denote statistically significant effects (p ≤ 0.05).
bPW filler (25% w/w) using particles from #50 sieve (300–425 µm) containing various concentrations (% w/w) of MAPE.
cPW filler (50% w/w) using particles from #50 sieve (300–425 µm) containing either 0 or 5% w/w of MAPE.
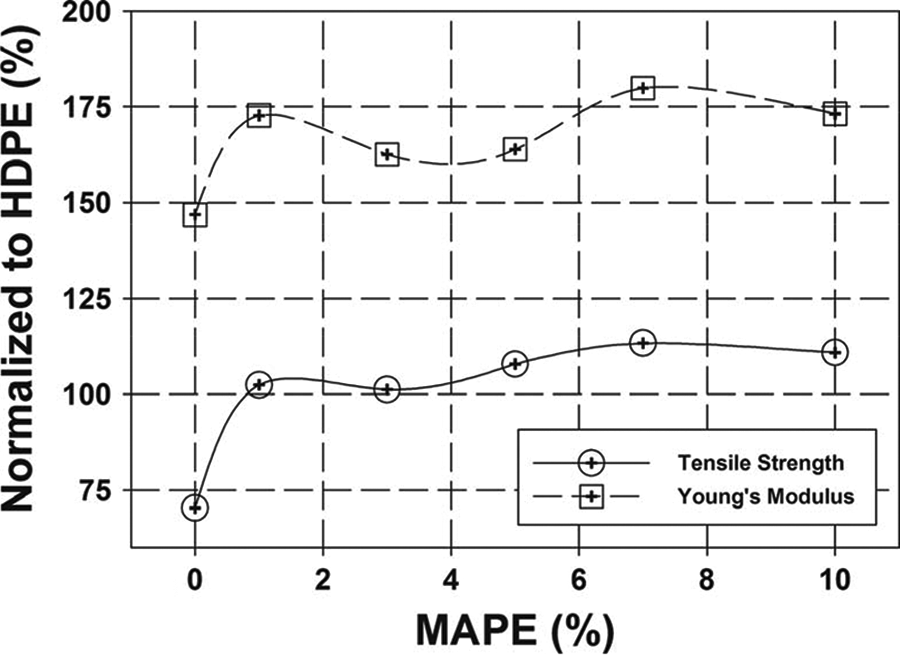
Normalized effects of MAPE concentrations on tensile strength and Young’s modulus properties of PW composites. MAPE: maleated polyethylene; PW: Paulownia wood.
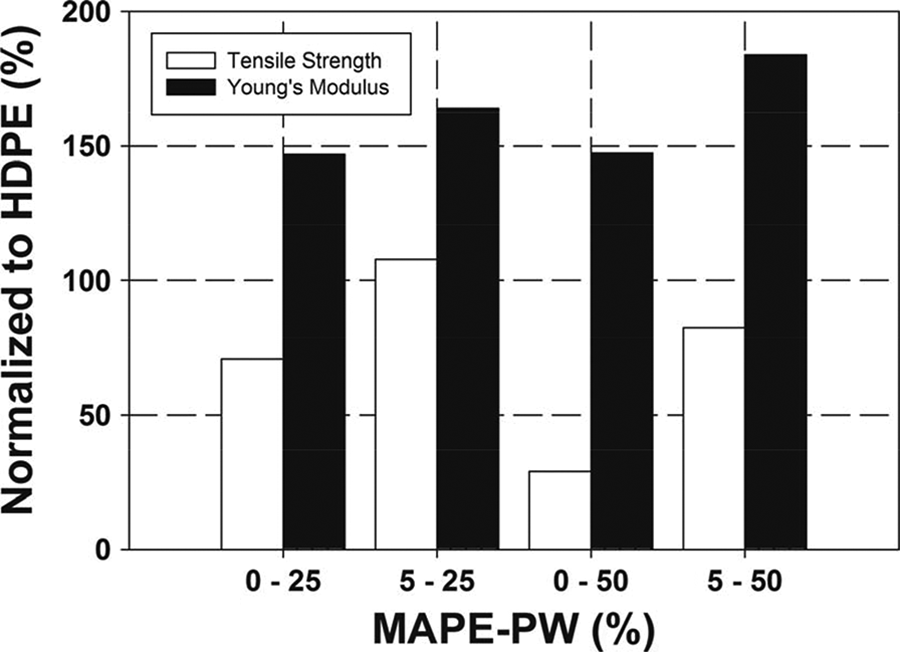
Normalized effects of MAPE and PW loading on tensile strength and Young’s modulus properties of PW composites. MAPE: maleated polyethylene; PW: Paulownia wood.
The E value of composites is improved by the addition of MAPE. The PW-MAPE-HDPE composites have on average 24% higher tensile modulus than the PW-HDPE composites without MAPE. The increase in the modulus is attributed to the binding of the HDPE molecules to the stiffer wood fiber material. However, this study did not show any significant changes in the tensile modulus as the levels of MAPE varied from 1 to 10%. Apparently, a saturation level reached with the commercial coupling agent used in this study.
Coupling agents act as intermediates to bind the hydrophobic polyolefin to the hydrophilic cellulosic material (e.g. wood). 10,33 –37 The most common coupling agents used to aid in the adherence of wood to plastic is maleated polyolefins. 11,18,36 –40 Biocomposites are blended using a twin screw extruder with a percentage of maleated polyolefin added, typically varying from 1 to 9%. 10,36 –40 A number of commercial sources of proprietary maleated polyolefins are available (e.g. Epolene E-43 (Eastman Chemical Products, Kingsport, Tennessee, USA); Moplen HP740H, HP648N, and HP644T (HMC Polymers Co. Ltd, Thailand); Licocene PP MA 6452 (Clarienat, Muttenz, Switzerland); Fusbbond P MD353D (DuPont, Wilmington, Delaware, USA). 35 –40
When the PW loading is increased to 50%, the benefit of adding MAPE is clearly evident as shown in Figure 4. Higher fiber loading results in even more defective cites, which allow for stress cracks to form more readily when the sample is subject to a stress; hence, there is an expected reduction in tensile strength with higher fiber loading even though the tensile modulus may increase. At 50% PW by weight and no MAPE, the tensile strength is reduced to only 30% of the neat HDPE. Adding 5% MAPE with 50% PW improves the tensile strength to a value that is 82% of the neat HDPE. In summary, the addition of MAPE significantly improves the tensile strength of the composite.
The percentage elongation before failure is significantly reduced with the addition of PW fibers, which has been shown in other wood plastic composite studies. 33 The data in Table 3 clearly shows this trend. The results of this study show that at 25% PW loading, the addition of MAPE does not improve the elongation to breaking. However, at 50% PW loading, the %El is reduced to under a 5% strain, and the addition of 5% MAPE does yield a significant improvement in the elongation to breaking, although only to 7.4%.
Influence of particle size
Stark and Berger 33 noted that the particle size of filler can affect the mechanical properties of PP and pine wood (PP-pine WF) composites. For example, they noted the tensile strength increased in a PP-pine WF composite when using #70 mesh-sieved particles (200 µm) verses using #35 mesh-sieved particles (450 µm). A similar trend is observed in this study as shown in Table 4 and Figure 5. As the particles size drops below 200 µm, the tensile strength of the composite is about 25% greater than neat HDPE. However, when composite is composed of particles that are between 250 and 300 µm, the resultant tensile strength is on par with the neat HDPE. The data from this study trend like that of Stark and Berger in that there is no monotonic increase in tensile strength with decreasing particle size. The increase in tensile strength for smaller particles is attributed the effect of the fiber length to diameter ratio of the filler. 33 Figure 1 depicts the images of various fiber particle sizes used in this study. As the particle size decreases, there is a noticeable increase in the length to diameter ratio.
Effect of particle size on mechanical properties of PW-HDPE composites.a
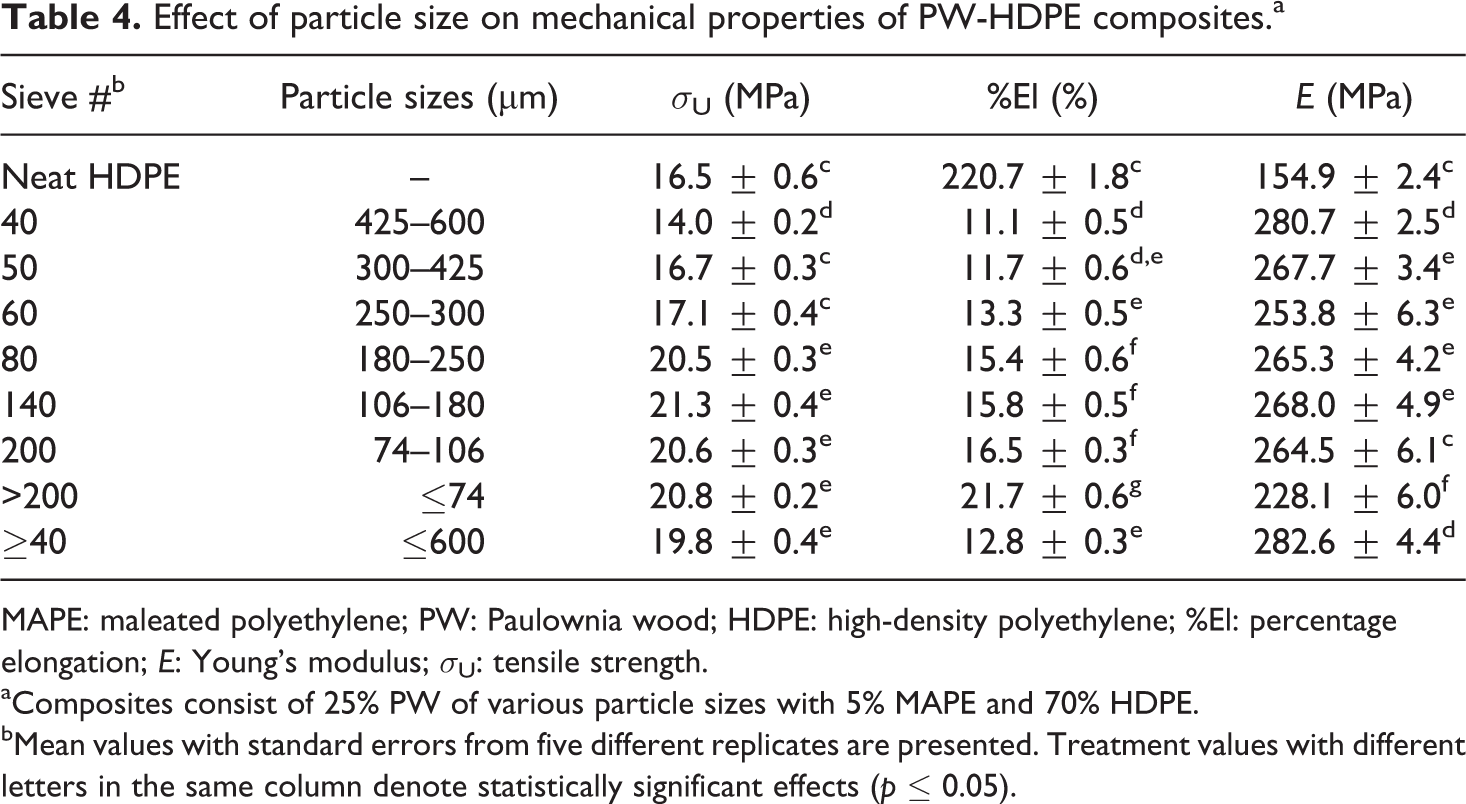
MAPE: maleated polyethylene; PW: Paulownia wood; HDPE: high-density polyethylene; %El: percentage elongation; E: Young’s modulus; σU: tensile strength.
aComposites consist of 25% PW of various particle sizes with 5% MAPE and 70% HDPE.
bMean values with standard errors from five different replicates are presented. Treatment values with different letters in the same column denote statistically significant effects (p ≤ 0.05).
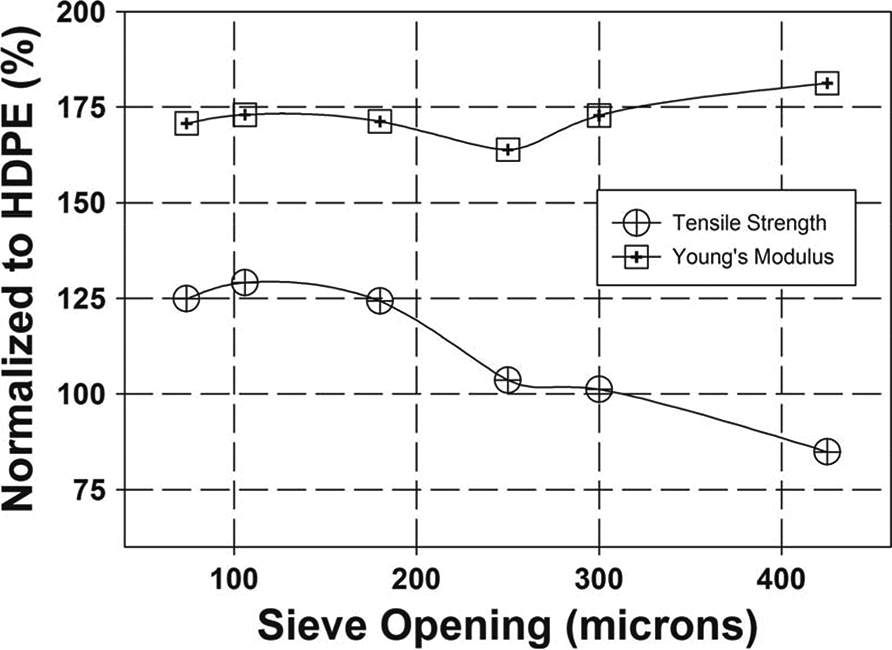
Normalized effects of particle sizes on tensile strength and Young’s modulus properties of PW composites. PW: Paulownia wood.
Particle size range examined in this study had a modest effect on the value of E and only so at the extreme range of sizes as seen in Table 4. The PW composite with the largest particle, from the #40 sieve that are between 425 and 600 µm, exhibits the highest E, which is 80% greater than the neat HDPE. As the particle size decreased, between the relatively wide ranges of 74–425 µm, the modulus drops to only 70% greater than the neat HDPE. Finally, the PW composite composed of the finest particles (i.e. ball ground flour with particle sizes <74 µm) had only a 47% improvement in the value of E over the neat HDPE. A plausible explanation for this trend is the effect of binding the spherulites (50–500 µm) to the wood particles. 32 Spherulites bound to the largest wood particles will require more energy to deform because the larger wood particles require more energy to be displaced in the composite matrix than smaller wood particles in the composite matrix.
Elongation values increased as the size of PW particles decreased (Table 4). For example, PW composites containing ≤74 µm particles exhibited the %El value that was 100% greater than the PW composite containing ≤600 µm particles (Table 4).
Interestingly, the ≥#40 mesh particle blend (≤600 µm) produced a biocomposite that exhibited high tensile strength and E (Table 4). This blend, a mixture of all the particle sizes tested, was the simplest to prepare and yet had excellent mechanical properties when compared to the other composites that utilized more specific particle sizes (Tables 1 and 4).
Humidity treatment results
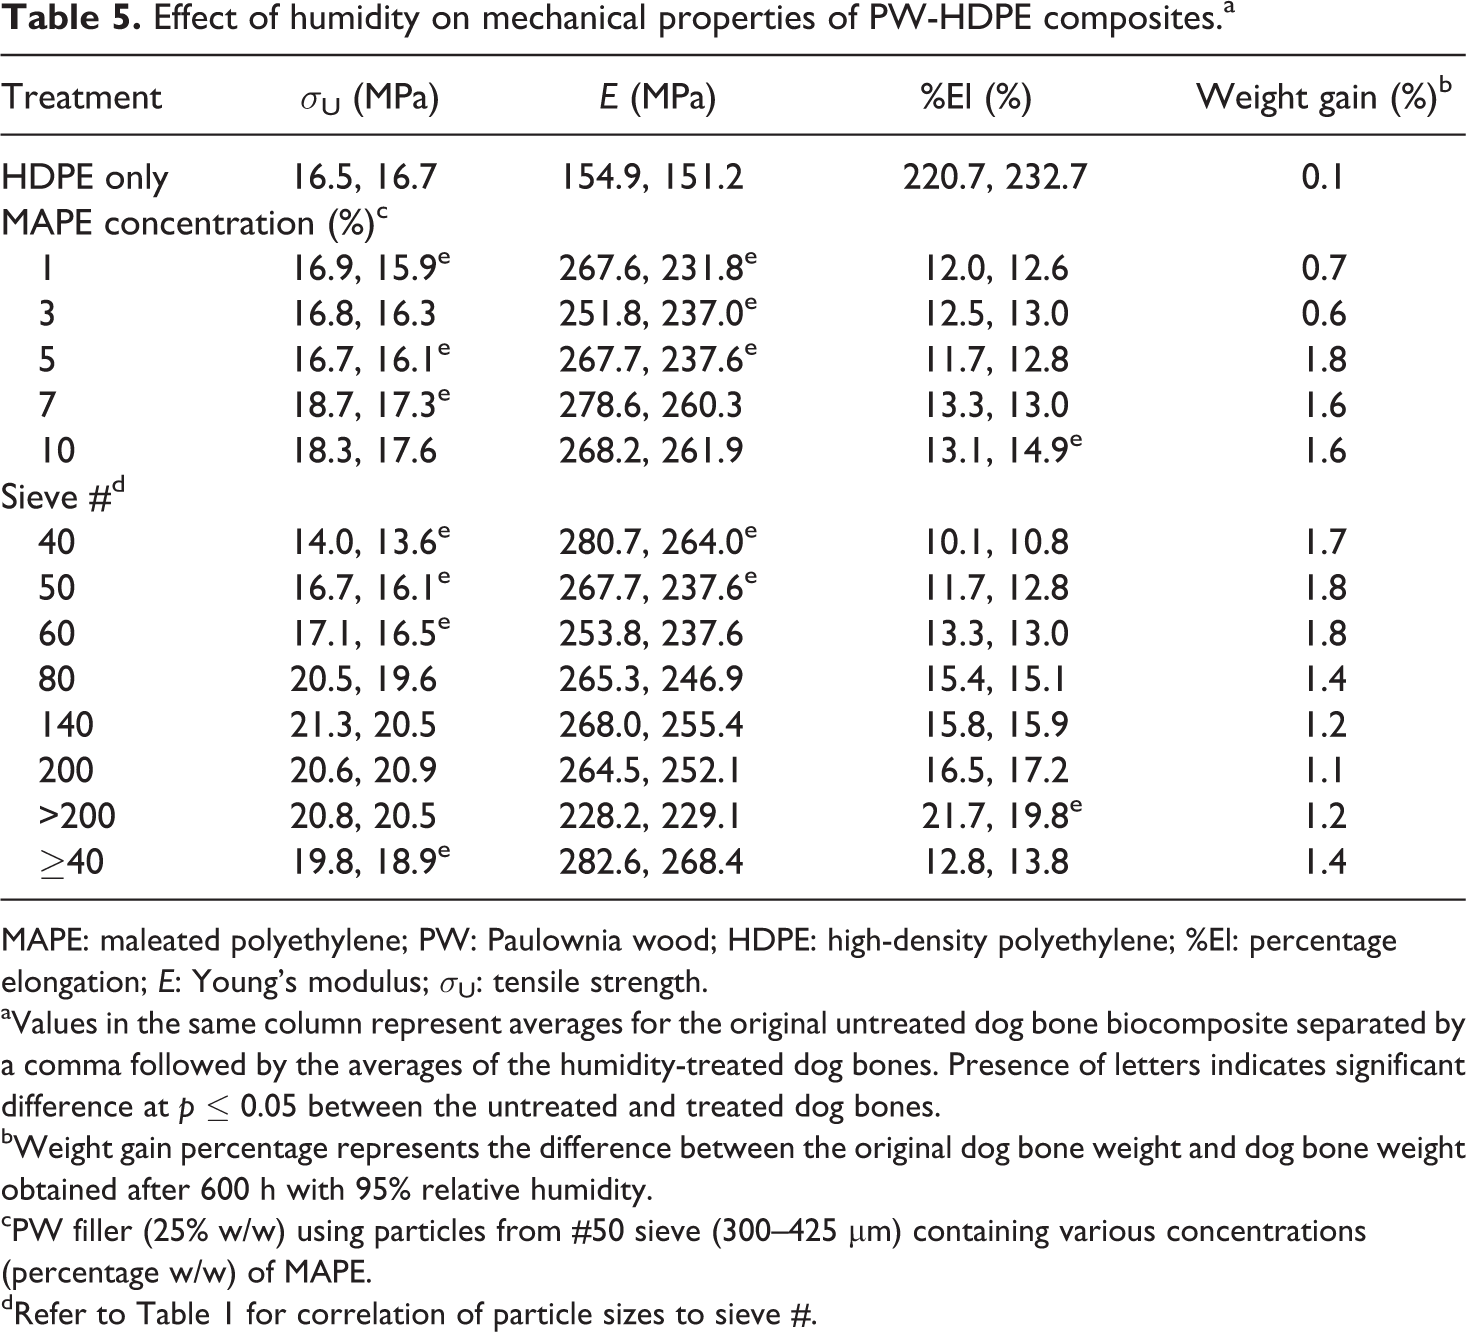
The importance of determining the mechanical properties of WPC after exposure to environmental stress is paramount in ascertaining its commercial value. 40 –42 Moisture uptake by WPC is an important aspect to understand its durability. 40 –42 A common method used to evaluate the effect of moisture is short-term immersion from 2 to 24 h. 41 RH treatments are also used to determine the response of biocomposites to weathering. 41,42 Short-term accelerated environmental testing for up to 4000 h utilizing ultraviolet light and 34 and 90% RH is an effective method to determine WPC durability. 43 In this study, the HDPE-PW composite bars containing varying concentrations of MAPE (1–10%) were exposed to 95% RH atmosphere for 28 days to evaluate their weight change and changes in mechanical properties as shown in Table 5. In addition, HDPE-PW composite bars containing 5% MAPE with various particle sizes were subjected to the 95% RH test to determine the weight gain and changes to their mechanical properties. The resultant mechanical properties data is presented in Table 5. Weighing samples periodically over a 28-day period (600 h) resulted in the determination of a weight equilibrium time, which normally occurred around 200–500 h of incubation (data not shown). Each HDPE-PW and MAPE concentration or particle size fraction blend equilibrated at a different weight gain percentage seen in the far right column of Table 5.
Effect of humidity on mechanical properties of PW-HDPE composites.a
MAPE: maleated polyethylene; PW: Paulownia wood; HDPE: high-density polyethylene; %El: percentage elongation; E: Young’s modulus; σU: tensile strength.
aValues in the same column represent averages for the original untreated dog bone biocomposite separated by a comma followed by the averages of the humidity-treated dog bones. Presence of letters indicates significant difference at p ≤ 0.05 between the untreated and treated dog bones.
bWeight gain percentage represents the difference between the original dog bone weight and dog bone weight obtained after 600 h with 95% relative humidity.
cPW filler (25% w/w) using particles from #50 sieve (300–425 µm) containing various concentrations (percentage w/w) of MAPE.
dRefer to Table 1 for correlation of particle sizes to sieve #.
Composites containing higher concentrations of MAPE (5–10%) exhibited higher weight increases than composites containing lower MAPE concentrations (1 and 3%). There is no discernible trend observed in the mechanical properties of the specimens tested associated with the humidity treatments.
Humidity tests conducted on HDPE-PW containing various particle sizes showed slightly higher increases in weight gains for composites containing larger particles than composites containing smaller particles. The mechanical properties of the HDPE-PW composites made with various particle sizes exhibited around a 4% reduction in tensile strength and a 6% reduction in the value of E after 28 days of incubation at 95% RH. Changes in %El did not exhibit any discernible trend following the same treatment.
DSC analysis
The thermal properties of the composite blends containing different concentrations of MAPE and PW particle fractions are shown in Table 6. The addition of PW to HDPE resulted in lower crystallization values that trend with the concentration of PW filler employed. For example, blends containing 25 and 50% PW exhibited crystallization levels that were 7 and 14% lower, respectively, than neat HDPE. This may be attributed to an increase in the matrix viscosity at melting temperature resulting in reduction in the diffusion rate of the HDPE chains, that is, an increase in amorphous HDPE content versus crystalline HDPE content. 10 Increasing the concentration of MAPE generally resulted in a decrease in the crystallinity level as shown in Table 6. For example, the lowest crystallinity level occurred in composites containing 10% MAPE (−11% of HDPE), while the highest occurred in composites containing 1 or 3% MAPE (−1% of HDPE). In general, crystallinity was not influenced by PW particle size fraction employed in the HDPE-PW blends. Composite blends of 25% PWF, regardless of the concentration of MAPE or particle fractions, exhibited multiple T ms compared to only a single T m expressed in neat HDPE as shown in Table 6. The occurrence of additional T m peaks has been reported in different composite blends. 44 –46 These additional peaks have been attributed to semi-crystalline spherulites trapped between filler particles that alter the energy required to make their melting transition. 44 These additional T m peaks were both lower and higher when compared with neat HDPE (Table 6). However, composite blends containing 50% PW exhibited only a single melt temperature and that temperature was higher than blends containing 25% PWF or neat HDPE.
Thermal properties of PW-HDPE composites.
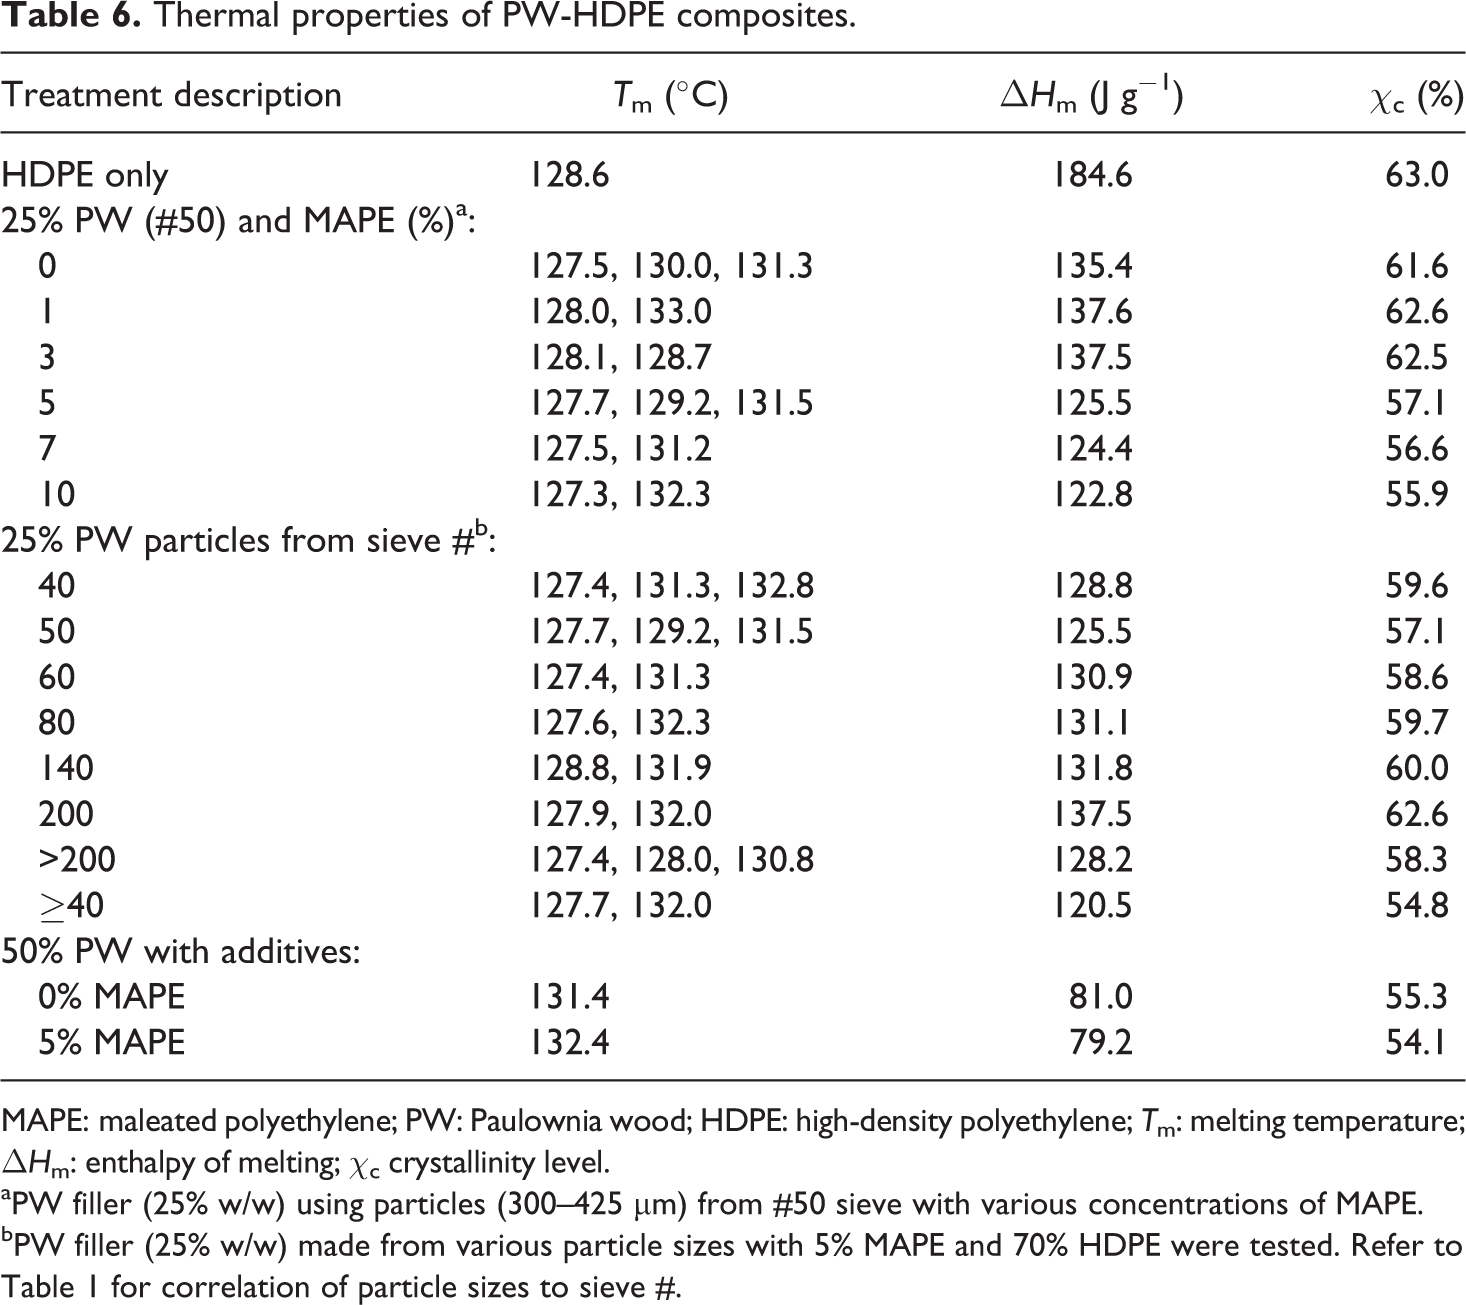
MAPE: maleated polyethylene; PW: Paulownia wood; HDPE: high-density polyethylene; T m: melting temperature; ▵H m: enthalpy of melting; χ c crystallinity level.
aPW filler (25% w/w) using particles (300–425 µm) from #50 sieve with various concentrations of MAPE.
bPW filler (25% w/w) made from various particle sizes with 5% MAPE and 70% HDPE were tested. Refer to Table 1 for correlation of particle sizes to sieve #.
Conclusions
Wood fiber obtained from 36-months-old Paulownia trees could be milled and sieved and employed as wood filler without additional chemical or physical treatments, aside from oven drying. Wood plastic composites of HDPE and PW with as little as 1% MAPE can produce a composite material that has comparable tensile strength and a 70% improved E value compared to neat HDPE. PW particle size had a significant influence on the mechanical properties of the resultant composite. Wood fiber that is ground to a size of 74 µm with the addition of 5% MAPE exhibits tensile strength and E value that were 25 and 71% greater, respectively, than neat HDPE. PW composites composed of smaller wood particles had higher tensile strength and elongation values but lower E values than PW composites composed of larger wood particles. Excellent mechanical properties were obtained from PW blends containing a mixture of particle sizes (≤600 µm) when compared with other particle blends employed. Although mechanical strength properties can be improved with the addition of wood fibers, the elongation to break is always significantly reduced compared with neat HDPE.
Humidity moisture tests demonstrated that incubating various HDPE-PW composites used in this study at 95% RH for 28 days resulted in approximately 4% reduction in tensile strength and 8% reduction in E value. There were no discernible trends seen for the concentration of MAPE or the particle sizes of wood flour on their resultant mechanical properties.
Future work with these materials will involve injection molding of promising compositions. The material preparation required for injection molding trials is significantly greater than that required for extrusion trials. The extrusion compounding and the use of dog bones stamped from extruded ribbons, as performed in this study, provided a relatively low-cost method to screen compositions for potentially useful wood fiber composites. Findings from this study will direct future injection molding trials on the selection of MAPE concentrations and fiber loadings to use with other polyolefin matrices.
Footnotes
Mention of trade names or commercial products in this publication is solely for the purpose of providing specific information and does not imply recommendation or endorsement by the US Department of Agriculture (USDA). USDA is an equal opportunity provider and employer.
Acknowledgements
The authors acknowledge Laura Duvall, Xavier Holford, Kathy Hornback, and Paulette Smith for technical assistance.
Funding
This research has been supported partly by Evans Allen grant (GEOX 5213; to N.J.) at Fort Valley State University, Fort Valley, Georgia, USA.