
Abstract
Tailored structures of Ni-Ti shape memory alloys for micro-electro-mechanical systems can be fabricated using laser additive manufacturing, and requisite homogeneous microstructure for predictive design and fabrication of micro-electro-mechanical systems devices can be achieved by annealing. Investigation has been performed on the laser annealing of laser additive–manufactured Ni-Ti structures using a pulsed green laser through numerical simulation and experimental studies. The parametric dependence showed that a laser energy density of 1100 mJ cm−2 has a considerable influence in annealing of Ni-Ti structures. The surface morphology, phase transformation temperature and microstructure of laser-annealed Ni-Ti structures were studied with scanning electron microscopy, differential scanning calorimetry, X-ray diffraction and atomic force microscopy. Laser energy density of 1100 mJ cm−2 was used for annealing the samples as identified in the simulation. Surface annealing of Ni-Ti led to a uniform surface of the material with an increase in grain size and surface roughness. A decrease in the micro-hardness of the samples was obtained as a result of laser annealing. Thus, the investigations demonstrated the improved properties of laser additive–manufactured Ni-Ti structures by laser annealing.
Keywords
Introduction
Among shape memory alloys (SMAs), nickel titanium (Ni-Ti) alloy is a preferred choice for the fabrication of micro-electro-mechanical systems (MEMS) due to distinct behaviours of super elasticity and thermal shape memory effect.1–4 The uniformity of microstructures and desired purity during alloying are some of the pre-requisites for predictive design and fabrication of MEMS devices. Hence, these alloys are typically made in the shape of ingots by casting, using vacuum arc melting or induction melting ensuring minimum impurities and uniform alloying. Subsequently, these ingots are hot rolled into longer sections and drawn into wires. On one hand, high cost of the metals (Ni and Ti) and their processing requirements make it difficult and expensive to implement SMAs into a design. On the other hand, the wire form of Ni-Ti poses limitation in fabrication of complex-shaped devices.
In view of the above, the laser additive manufacturing (LAM) technique was investigated as an alternative fabrication method in one of our previous efforts.5–7 Although LAM is one of the best options in fabricating the complex shapes, process control yielding homogeneous microstructure is difficult due to in situ alloying and local heating–cooling. As conventional furnace annealing yields limited surface homogeneity for varying thicknesses, local annealing is opted as better option for developing complex-shaped micro-devices. 8 Earlier researchers have demonstrated annealing by continuous-wave CO2 laser of sputtering-deposited Ni-Ti thin films using a zero-contact line scan approach.9,10 Wang et al. 11 investigated crystallization on Ni-Ti shape memory thin films in which amorphous films are annealed by a scanning laser and found that the laser annealing process produces polycrystalline films with a random crystallographic texture. Annealing of Ni-Ti structures by diode laser yielded remarkable stress recovery effects. 12 Also, there are some published literature reporting laser annealing of Ni-Ti structure by repeated scanning of continuous-wave infrared laser systems.13,14 There are also reports that pulsed Nd:YAG laser is deployed for annealing Ni-Ti thin film with various power spots at a wavelength of 1064 nm developed by sputtering on silicone substrate. 15
During the literature survey, it is found that there are no published reports on usage of Nd:YAG laser at 532 nm wavelength for annealing bulk Ni-Ti structures developed using LAM. In this work, an attempt has been made for the first time to investigate the influence of laser-assisted annealing using spot overlap and its effect on the shape memory effect. This methodology achieved the homogeneity of crystallization over the entire sample surface. To the best of our knowledge, the laser annealing of laser additive–manufactured Ni-Ti structures has not been investigated. As laser annealing of laser additive–manufactured structures is important for shape memory effect, we undertook a comprehensive investigation of laser annealing of three different compositions of Ni-Ti structures. The temperature distribution during laser annealing was simulated using commercial software COMSOL™ Multiphysics 5.1 to get a better process insight. Subsequently, the laser-annealed laser additive–manufactured samples were subjected to various characterizations to investigate the change in surface morphology and phase transformation.
Numerical simulation
Annealing process is primarily governed by heating rate, soaking period and cooling rates. In laser annealing, there is no soaking period due to self-quenching of the substrate/object and the heating and cooling rate are predominantly governed by laser parameters and substrate properties. We deployed finite element (FE) software to simulate the process and estimate the local temperature distribution at different processing parameters. Subsequently, these distributions were extrapolated to understand the mechanism of laser annealing. The simulation is carried out using the software COMSOL Multiphysics 5.1 and in-house developed code with the following.
Governing equation
Following equation presents generalized heat equation applicable for laser annealing process
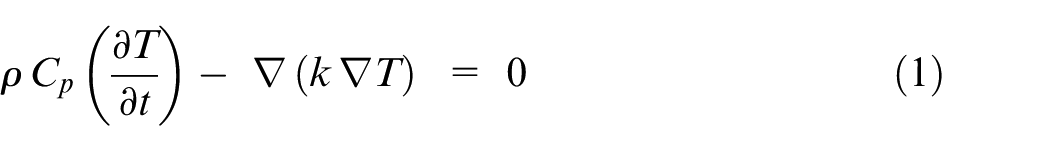
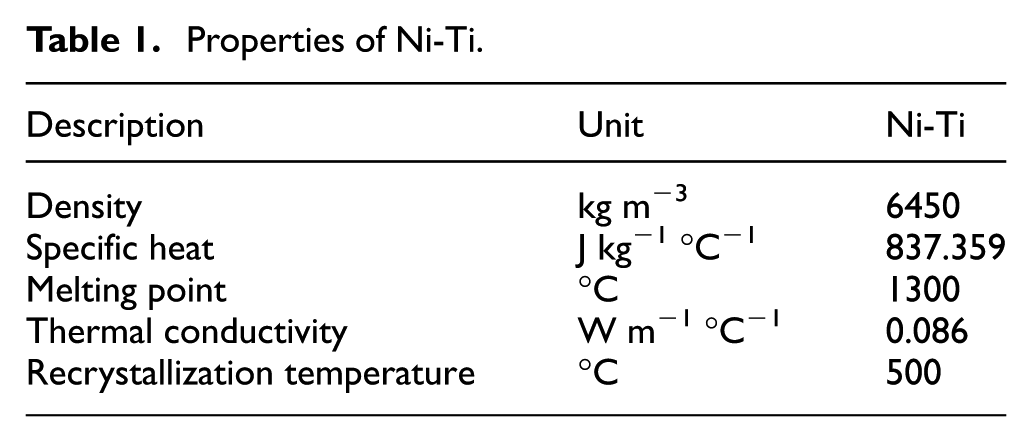
where k (W m−1 K−1) is the thermal conductivity, Cp (J kg−1 K−1) is the specific heat capacity, ρ (kg m−3) is the density and t (s) is the time.
Boundary conditions and associated simplifications
The initial temperature of the substrate and powder particles is room temperature (T0). So, the initial and final conditions are

The effect of the various processes is modelled using Lagrangian formulation, and the associated boundary conditions are expressed as
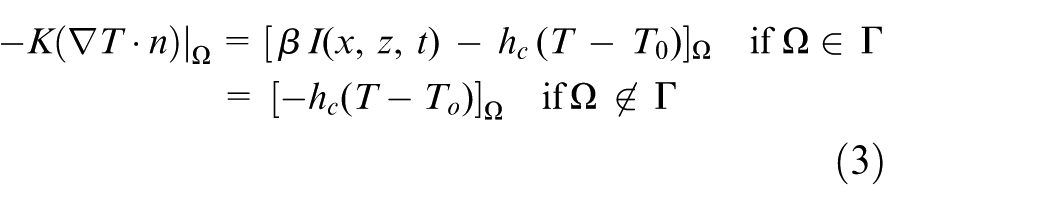
where n is the normal vector of the surface, β is the absorption factor, I (W m−2) is the laser intensity, hc is the heat convection coefficient (W m−2 K−1), Ω (m2) is the area of workpiece surface, Γ (m2) is the area with unit depth (perpendicular to the plane of paper in Figure 1) under laser beam irradiation and T0 (K) is the ambient temperature. Ω and Γ are shown in Figure 1. The value of absorption factor β is 0.3 as calculated by the similar method reported by the researchers in the past. 16 The value of heat convection coefficient 17 hc = 150 W m−2 K−1.
Laser energy distribution is assumed to be Gaussian. 18 It is mathematically presented as
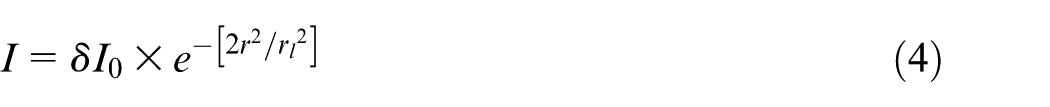
where rl stands for radius of laser (m) and
The material properties are assumed to be constant for all the temperature. The values used for the calculations are tabulated in Table 1. 20
The wall thickness is assumed to be equal to the laser beam diameter, which in turn is much less than the length and height, so that heat conduction is restricted to the (x, z) plane. It converts the simulation into two-dimensional analyses.
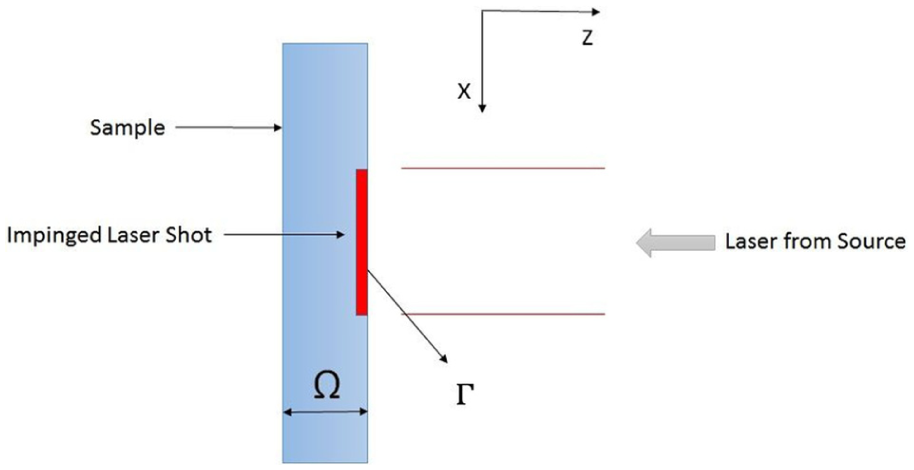
Schematic arrangement for laser annealing.
Properties of Ni-Ti.
Numerical computation
Prior to implementation of the proposed model, the mesh size independency was checked using standard technique of employing least geometric dimension (DL) of the model and element size (e). It was observed that the temperature difference in successive runs of reduced element size by a factor two becomes less than 10−3 for DL/e > 30. In the present simulation study, DL/e = 40 is used and it corresponds to an element size of ~50 µm. 21 In addition, all required element quality checks of the FE model were performed as shown in Figure 2.
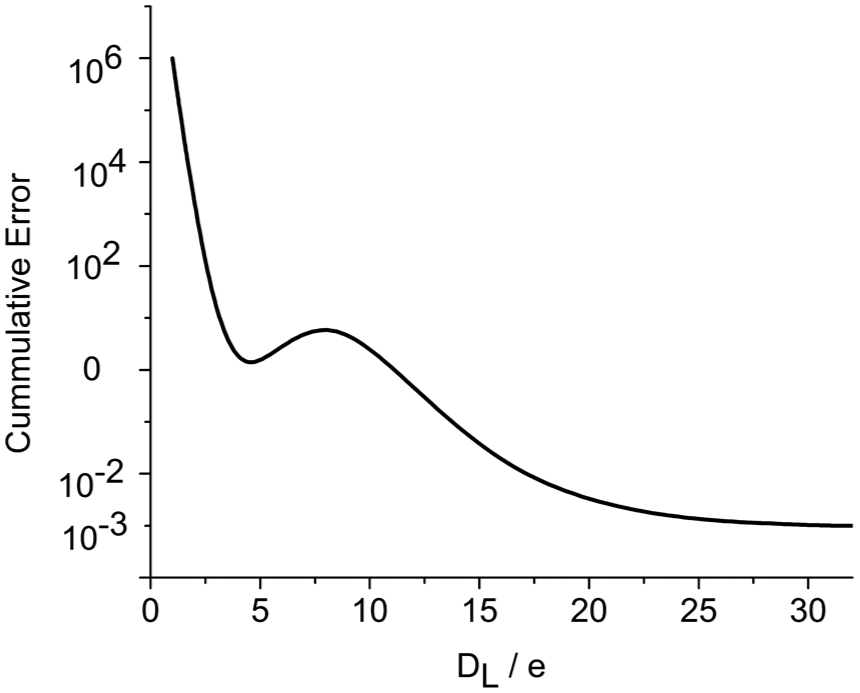
Mesh independency test.
The developed numerical methodology was deployed to study the effect of various laser intensity levels on annealing by predicting the temperature distribution.
Experimental work
A 2-kW fibre laser–based additive manufacturing system was used to fabricate the Ni-Ti structures. The system details and detailed procedure of fabricating Ni-Ti structures are described in our previous works.22,23 Figure 3 presents a typical structure used for annealing. The dimensions of Ni-Ti structures fabricated using LAM were 200 mm length, 75 mm width and 1 mm thickness. The substrate used was a titanium plate of 100 mm × 100 mm × 10 mm, as it is earlier reported that the de-bonding coefficient between Ni-Ti and titanium is very small and it enables easy partition of deposit during manufacturing.
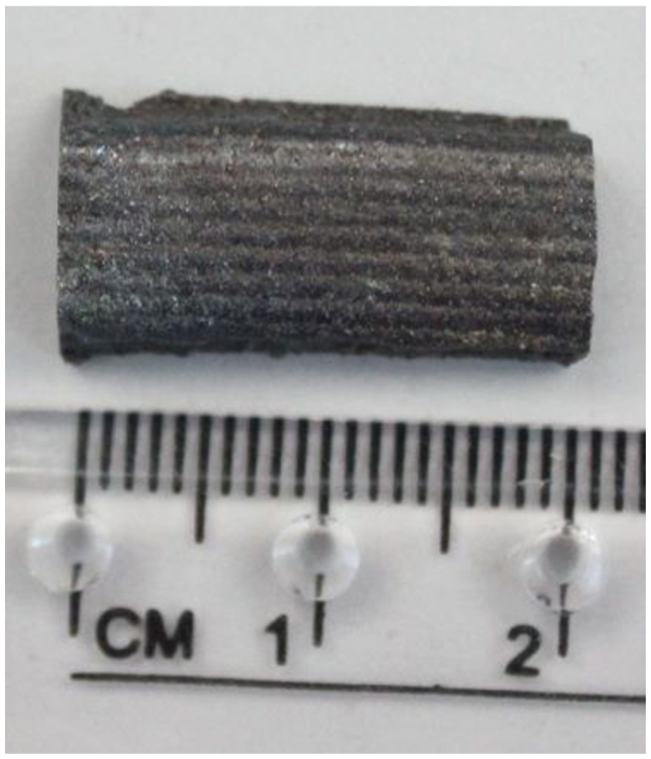
Typical laser additive–manufactured Ni-Ti structure used for laser annealing.
The laser annealing experiments were carried out by shining the second harmonic of Nd:YAG laser (Quanta-Ray INDI) on the Ni-Ti structure mounted on X-Y manipulator. The schematic arrangement of laser annealing set-up is presented in Figure 4. The second harmonic of Nd:YAG laser was used, as it yields improved performance due to shorter wavelength. 24 The process parameters used for laser annealing experiments are presented in Table 2.
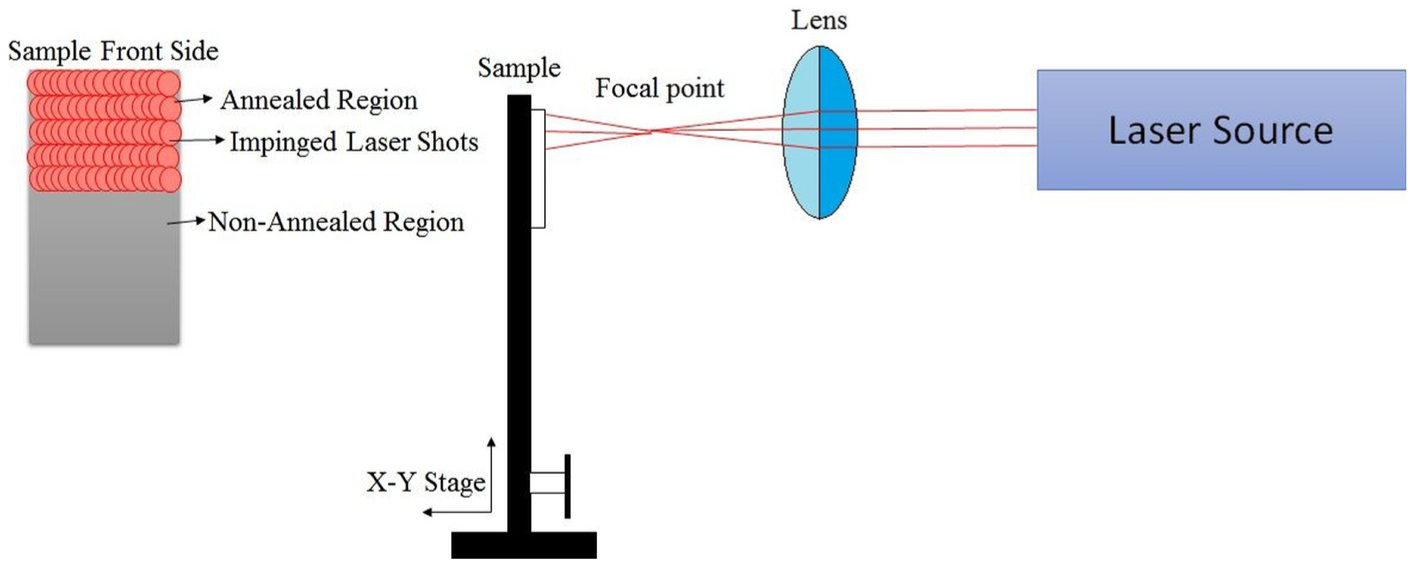
Experimental set-up for laser annealing.
Processing parameters used in the laser annealing experiments.
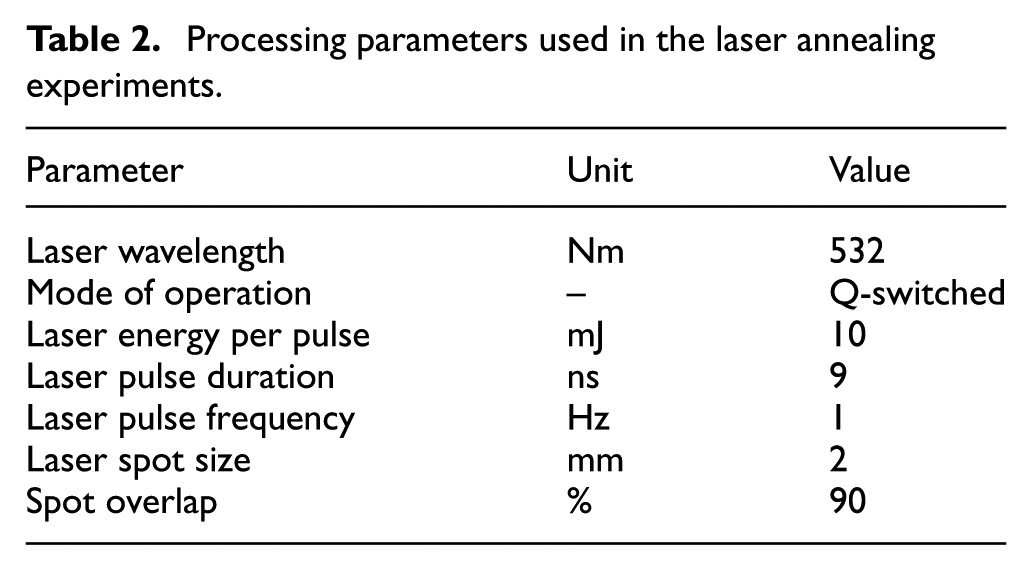
The frequency and the spot overlap are the parameters that affect the reduced cooling rate and uniform heat absorbing zone during laser annealing. They, also, result in reduced dilution and crack elimination. In general, the frequency of 1 Hz and spot overlap of 90% indicated good laser annealing. 24 The annealed samples were characterized using a number of techniques. First, the surface morphological analyses of the samples were carried out using scanning electron microscopy (SEM; Model: Supra55; Zeiss) attached with energy-dispersive spectrograph (Model: X-mas; Oxford Instruments). Subsequently, the structural analysis was carried out by X-ray diffractometer (Model: SmartLab Automated Multipurpose; Rigaku). At last, the phase transformation temperatures were analysed using differential scanning calorimetry (DSC; Model DSC 2910; TA Instruments). The various compositions used in this study, that is, Ni-45%Ti-55%, Ni-50%Ti-50% and Ni-55%Ti-45%, are designated as Ni-Ti55, Ni-Ti50 and Ni-Ti45, respectively.
Results and discussion
Simulation and validation
As the effect of laser processing of Ni-Ti structures is predominantly governed by processing parameters and substrate properties, it was attempted to simulate the process condition to reduce the number of experimental trials. A thermal model was simulated to find the impact of laser wavelengths and laser beam intensity profiles on the formed Ni-Ti thick film. First, the entire sample was meshed and converted into smaller elements. The heat flux was fed based on the laser input energy. The convective boundary conditions were considered as described above. The temperature distribution was calculated in the Ni-Ti deposit and part of the substrate. The starting of the phase transformation was considered when local temperature is 50 °C above the recrystallization temperature.
Figure 5 presents the temperature distribution of various laser spot sizes. Figure 5(a)–(d) presents temperature distribution for various beam spot sizes of 1, 2, 3 and 4 mm, respectively. Although it is fundamentally known that the smaller the focused laser beam yields the higher intensity and temperature gradient, the objective of simulation in the present case was to estimate the temperature distribution along the depth and width of the workpiece and identify the optimum beam diameter for the annealing. Following the obvious trend, the temperature difference between the maximum temperature and substrate temperature was reduced as the beam size had increased. Although there was significant drop in the difference between the maximum temperature and the substrate temperature, the depth for maximum to substrate temperature remained the same. It was primarily due to two competitive phenomena, that is, heat conduction and local increase in enthalpy. The smaller beam size provides smaller heat front for conduction and results in more increase in enthalpy. Hence, beam size had to be chosen judicially for efficient laser energy utilization. A beam diameter of 2 mm was selected for the remaining simulations.
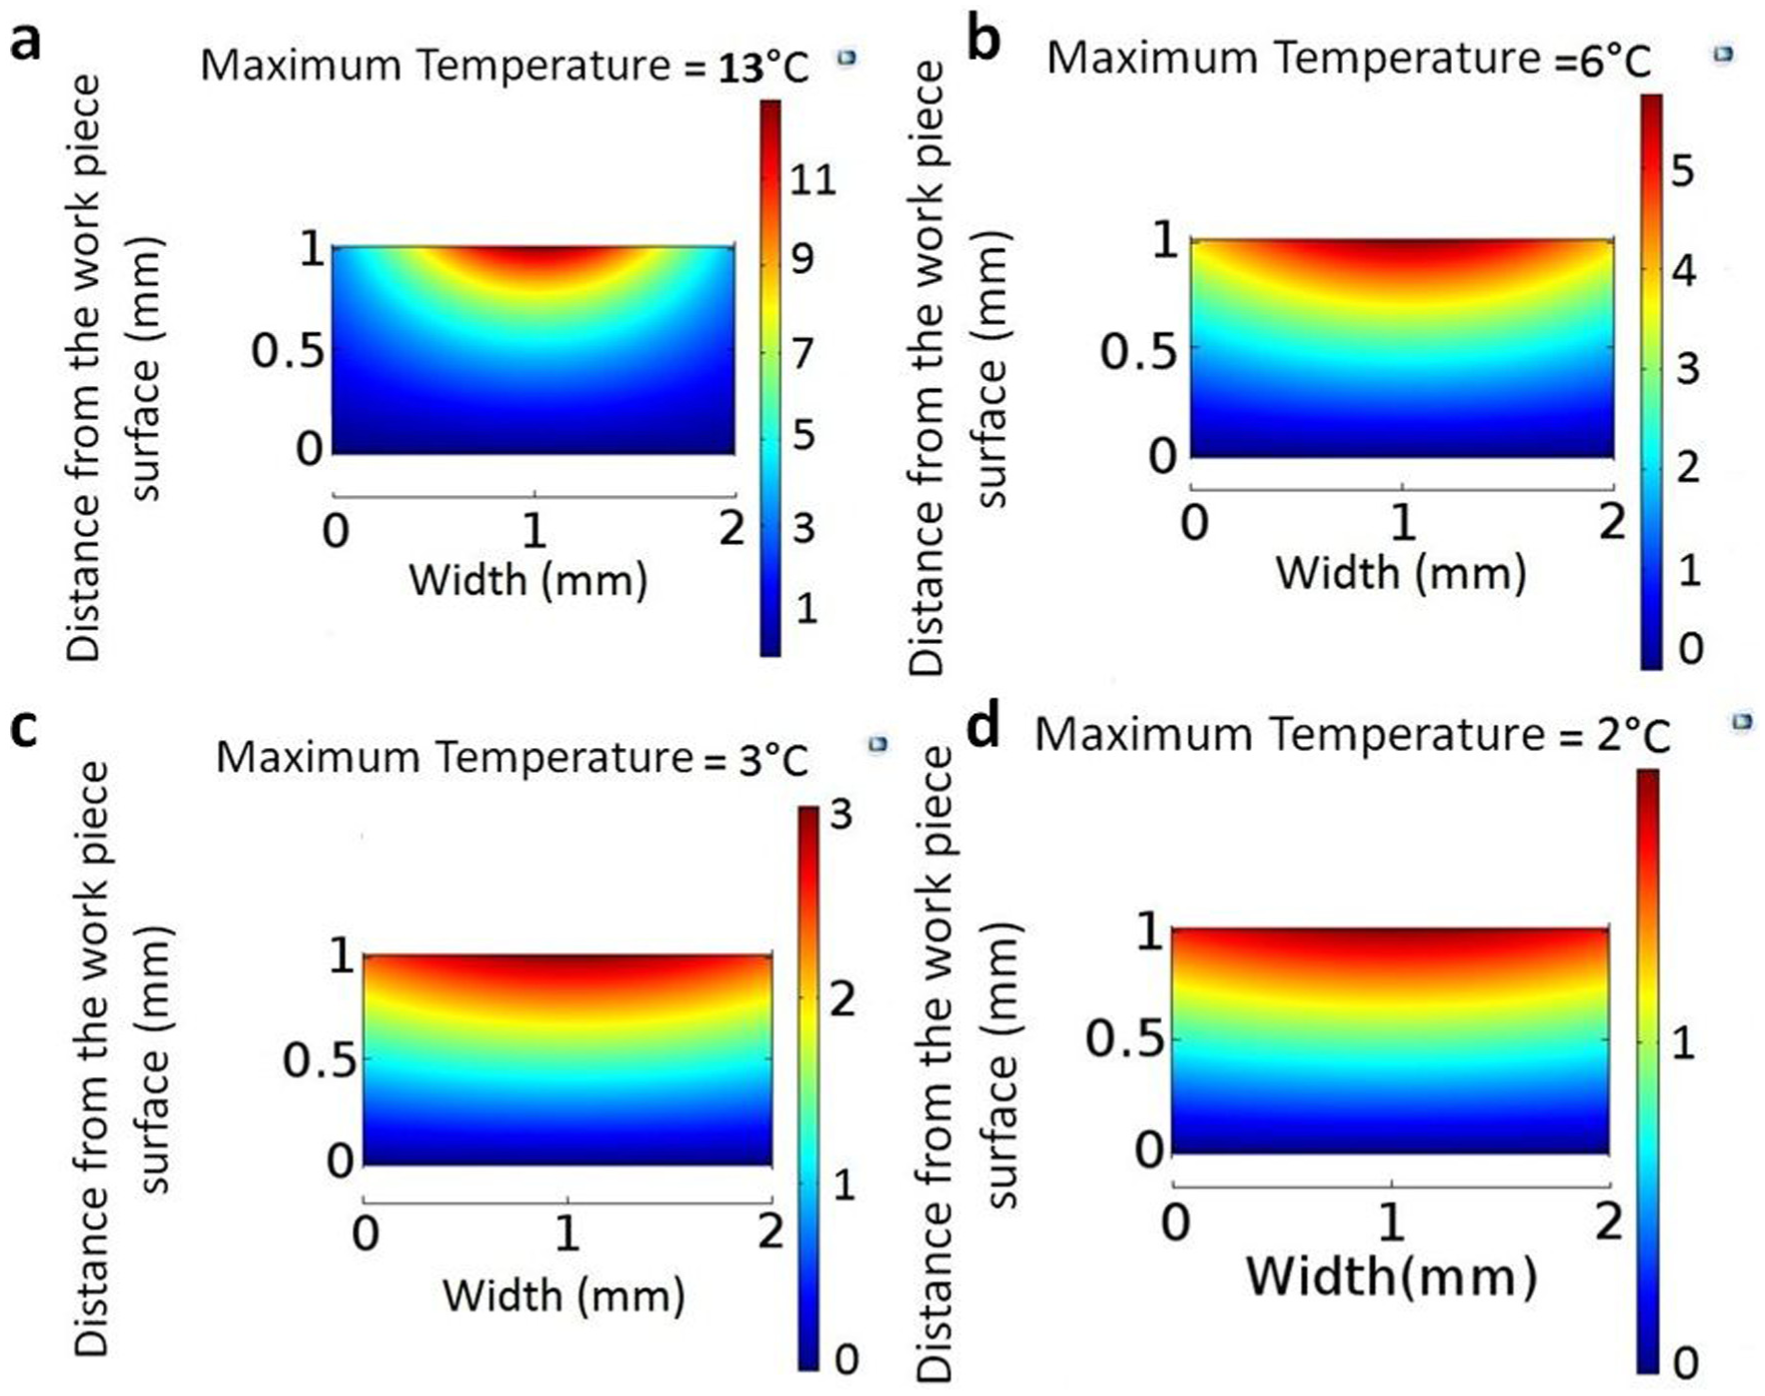
Temperature distribution of various spot sizes: (a) 1 mm, (b) 2 mm, (c) 3 mm and (d) 4 mm.
The temperature profile of various laser intensities was simulated with the chosen spot diameter of 2 mm, and their impact on the sample was analysed, in parallel, using SEM. Figure 6 presents the temperature distribution of various laser intensities and their corresponding SEM image. Figure 6(a) shows the surface of the as-manufactured sample. Figure 6(b), (d), (f) and (h) presents the temperature distribution for various laser energy density of 900, 1000, 1100 and 1200 mJ cm−2, respectively. Figure 6(c), (e), (g) and (i) presents the SEM images of Ni-Ti samples after facing a single laser shot at the mentioned laser energy density. The predominant effect of varying intensities was seen in the SEM images. The maximum temperatures observed in these simulation results were 463 °C, 514 °C, 563 °C and 605 °C, respectively. It was seen that the temperature difference increases with the increase in the laser energy density, but there is no visible change in the depth of temperature distribution. At laser energy density of 900 mJ cm−2, there was no visible effect on the specimen surface (refer Figure 6(b)). In Figure 6(d), laser energy density of 1000 mJ cm−2 shows a blend of partial annealing and impact of laser as a thin layer of Ni-Ti material, which was in excess at the outer surface, has formed a paste-like structure evenly spread on the specimen. Likewise in Figure 6(f), the laser energy density of 1100 mJ cm−2 reveals a complete blend of the materials on the surface which had formed a pool of lava-like structures with molten Ni-Ti surface material. When the laser energy density was more than 1100 mJ cm−2, the dark patch was observed (refer Figure 6(h)), confirming complete ablation at 1200 mJ cm−2.
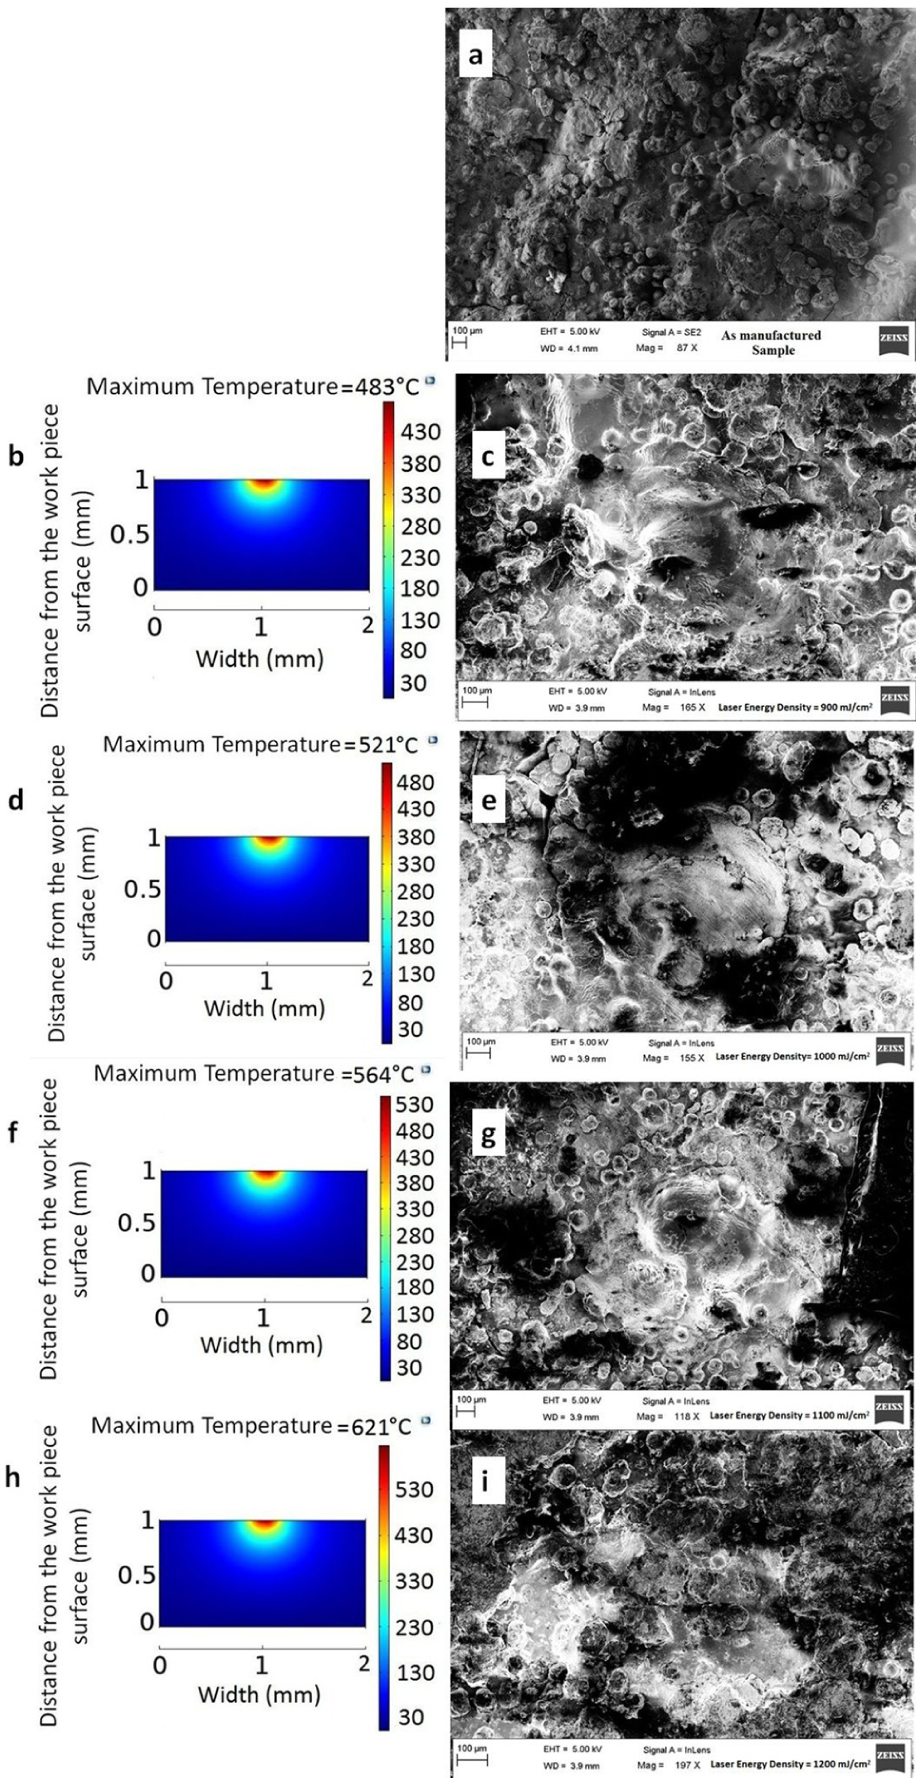
Temperature profile of (b) 900 mJ cm−2, (d) 1000 mJ cm−2, (f) 1100 mJ cm−2 and (h) 1200 mJ cm−2 and SEM images of (a) non-annealed sample, (c) 900 mJ cm−2, (e) 1000 mJ cm−2, (g) 1100 mJ cm−2 and (i) 1200 mJ cm−2.
To validate the simulation, temperature measurement experiments were carried out using set-up shown in Figure 7. The set-up consisted of a ‘K’-type thermocouple connected to a data acquisition system (Model no. 34970A; Agilent) and a computer using a general-purpose interface bus (GPIB). This methodology is as per one of the earlier experiments. 25 The sample of equiatomic composition (Ni-Ti50) was chosen for the experiment as it displayed better results than the remaining two compositions in the as-manufactured state. The thermocouple was clamped on the sample exactly at minimum distance of 10 µm from the laser impinging spot to avoid the laser spot’s direct contact with the thermocouple head. As mentioned by the researchers in the earlier approach, 25 the diameter of the thermocouple head (1.8 mm) was less than the diameter of the laser spot (2 mm) for obtaining precise results. 25 The temperature of the workpiece was measured using the above set-up for various laser energy density and compared with the simulated results (refer Figure 8). It is seen that the simulated and experimental results are fairly close (±20 °C). The variation may be attributed to the other heat losses during the real-time experiments. As per the simulation results and the SEM images shown in Figure 6, laser energy density of 1000 mJ cm−2 shows improper annealing and laser energy density of 1200 mJ cm−2 confirms ablation. Since the annealing temperature of Ni-Ti is in the range of 500 °C, the results in Figure 6 show good annealing by laser energy density of 1100 mJ cm−2. This value was opted for the annealing process of the samples.
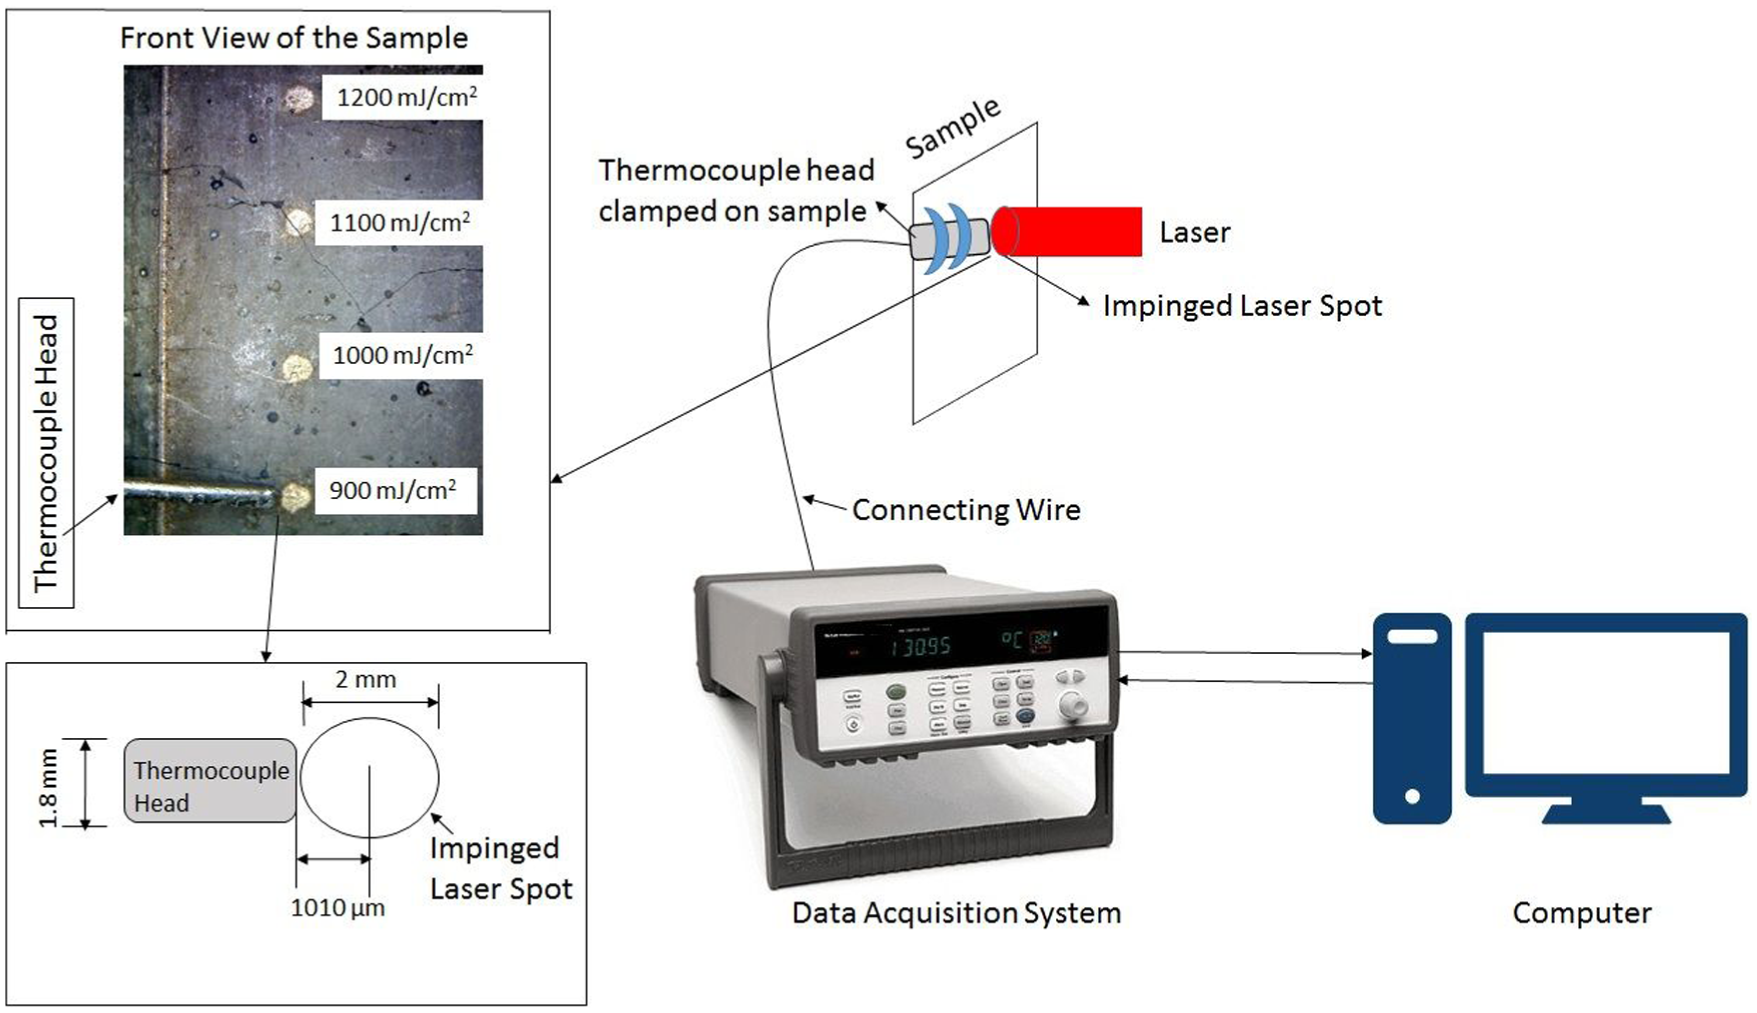
Experimental set-up for measuring the temperature of single laser shot of various energy density.
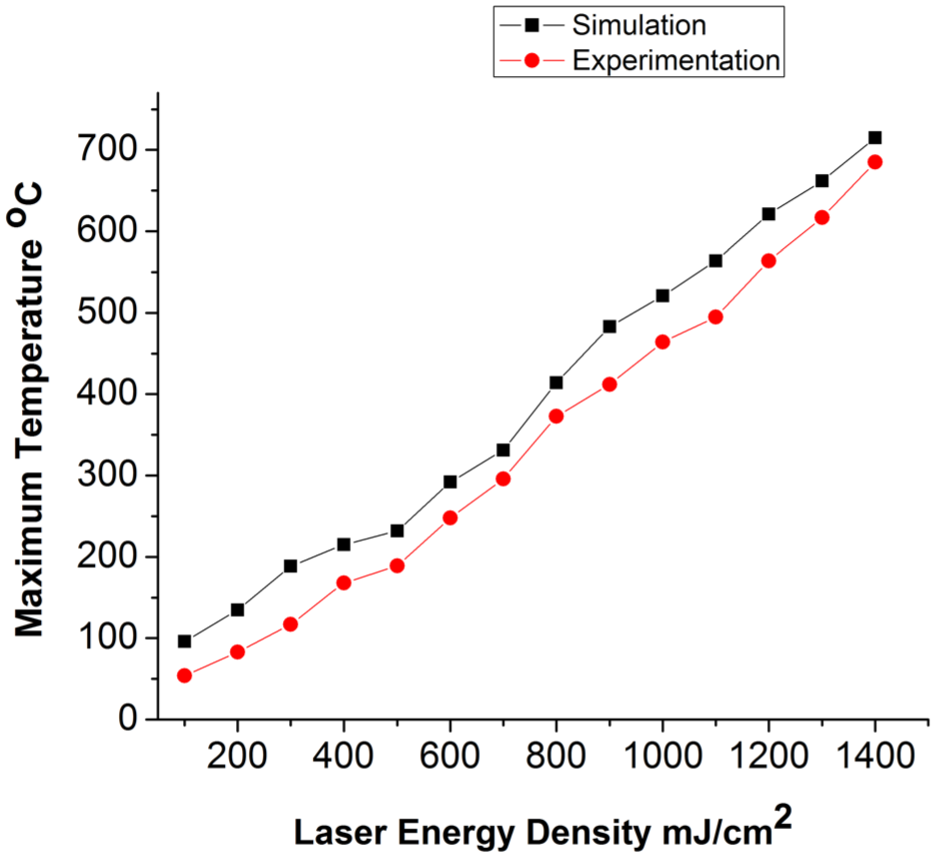
Laser energy density versus maximum local temperature of simulation and experimental results.
Surface morphology
Figure 9 shows the three-dimensional atomic force microscopy (AFM) images recorded for the annealed samples. Globular microstructures arrayed uniformly throughout the sample are seen in all images. This indicates good quality of deposition and homogeneity of annealing with laser. The average height difference lies between 10 and 20 nm. The uniqueness of the samples is seen from their corresponding surface roughness values and grain size values. The measured grain sizes of laser annealed Ni-Ti55, Ni-Ti50 and Ni-Ti45 are 64.09, 36.23 and 48.73 nm, respectively. The variations in the grain size values and surface roughness values are mainly due to the impact of compositional variances of Ni and Ti. 26
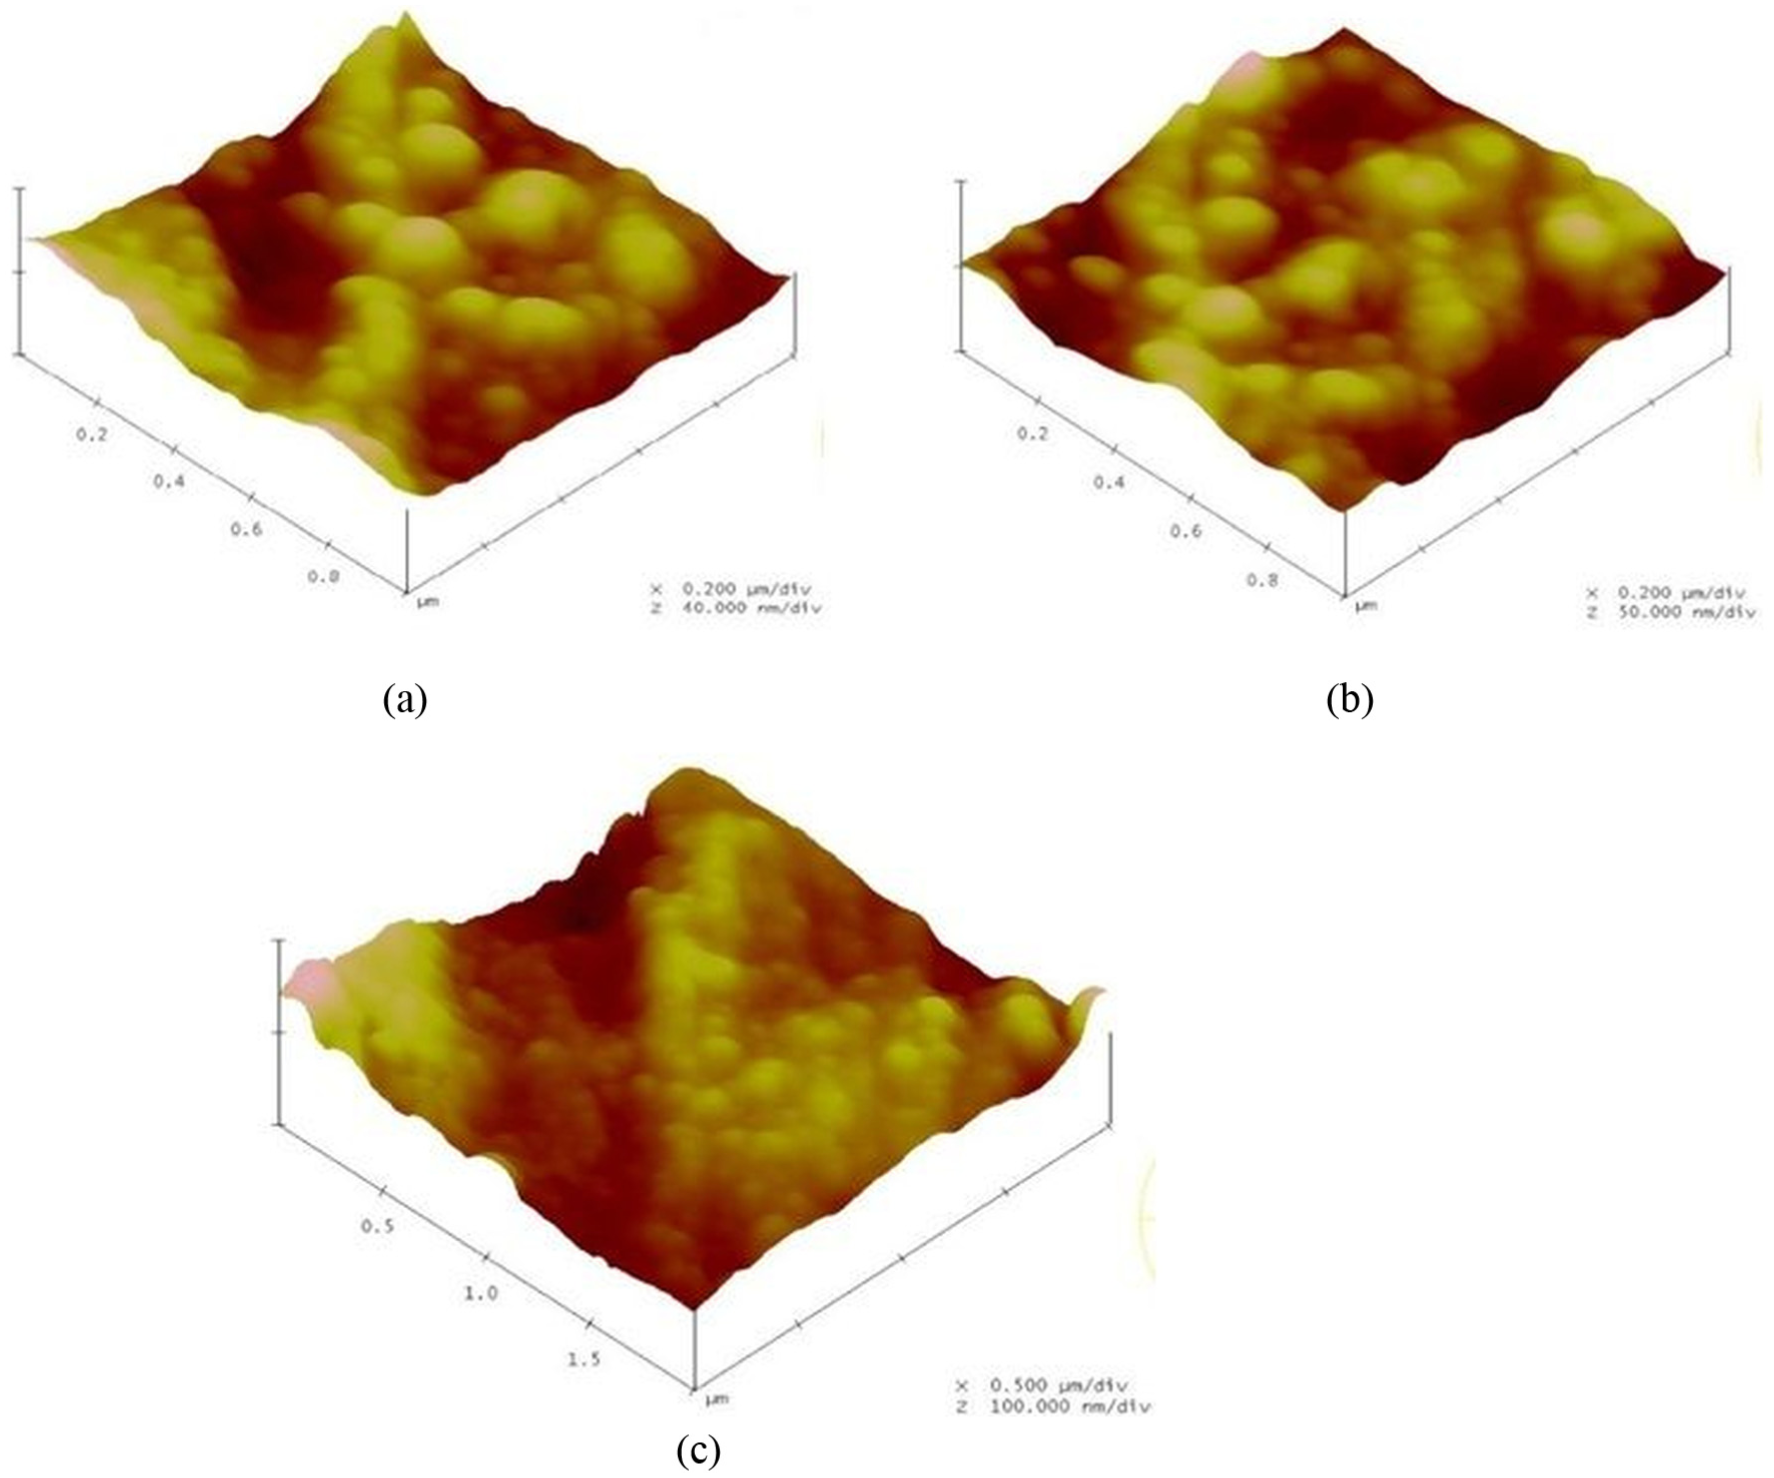
AFM images of (a) Ni-Ti55, (b) Ni-Ti45 and (c) Ni-Ti50.
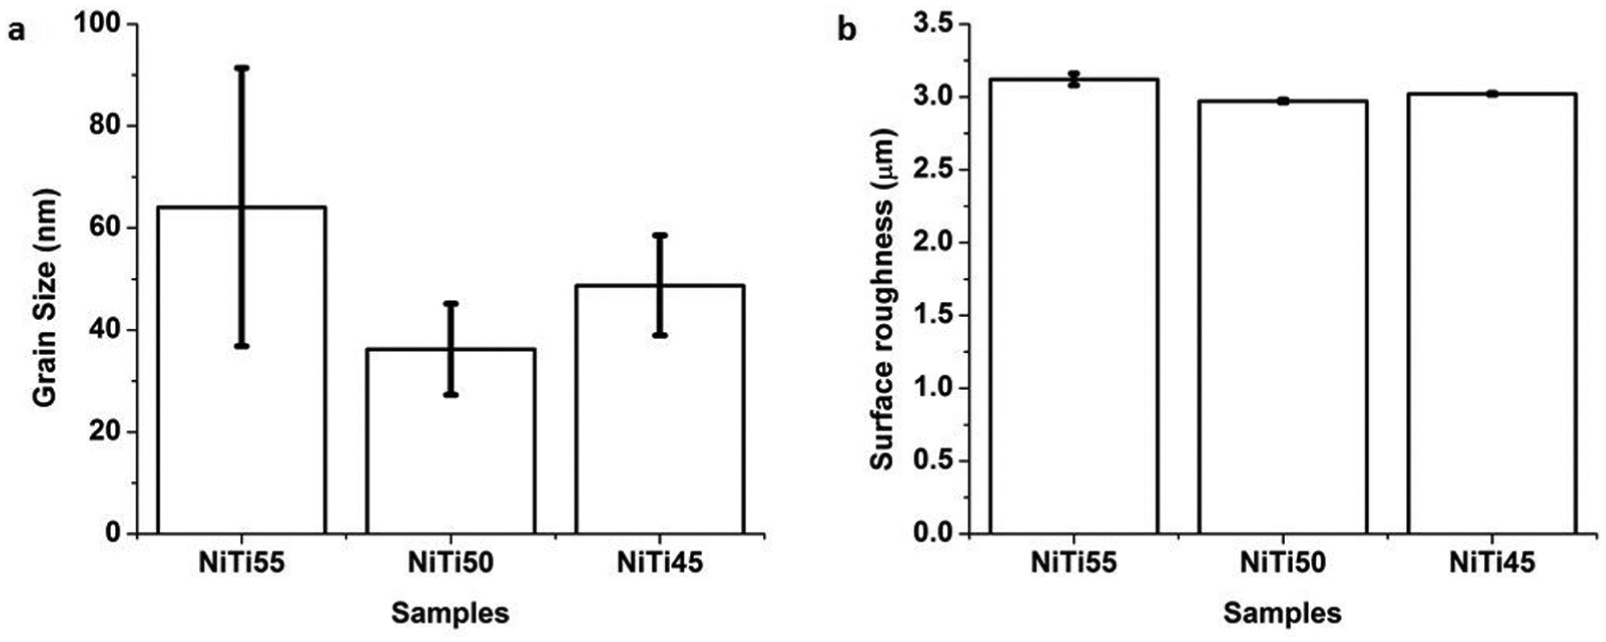
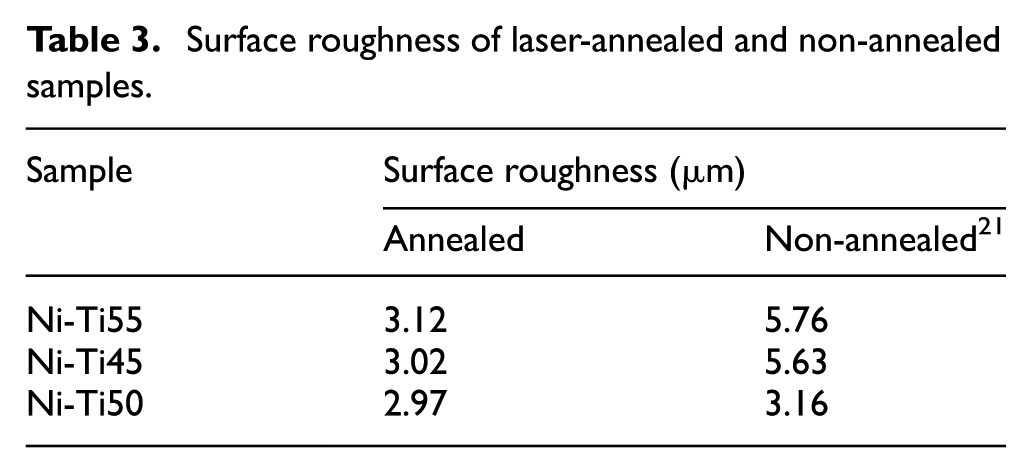
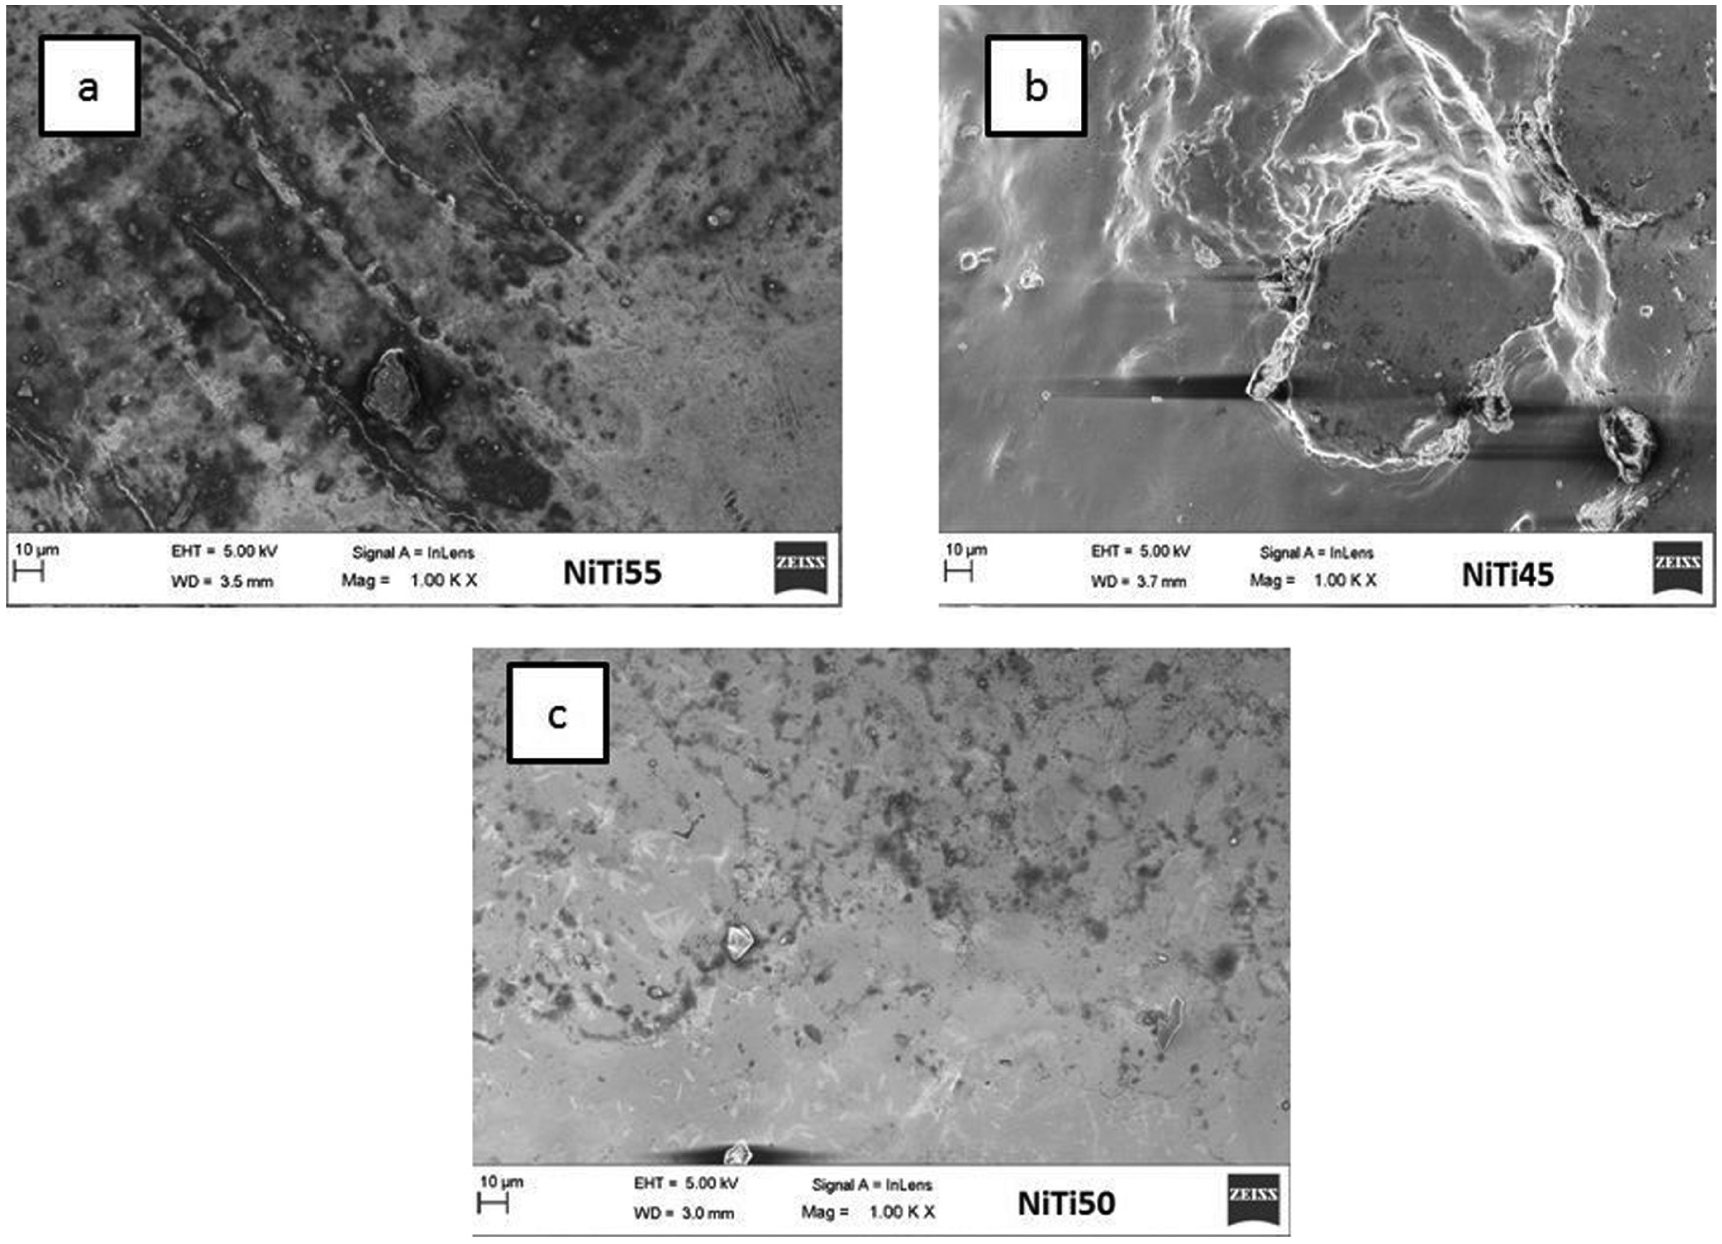
Figure 10 shows the SEM images of laser-annealed samples, and it was noted that the surface of all the samples has become smoother. The variation in surface roughness was investigated using a profilometer. Ni-Ti55, Ni-Ti50 and Ni-Ti45 have a surface roughness (Ra) value of 3.12, 2.97 and 3.02 µm, respectively. This variation is due to the impact of interaction between impinged laser spots and the surface of the formed samples. Effect of mild porosity and improper bonding between the Ni-Ti are also the factors to be considered.22,23 From Table 3, it is very clear that the value of surface roughness has increased due to the impact of laser annealing. Very few pores were observed on the surface. All the measured grain size and surface roughness values were plotted with error bar in the graph shown in Figure 11(a) and (b), respectively. As per the energy-dispersive spectroscopy (EDS), results showed that Ni-Ti55 has Ni-57.64% and Ti-42.36% in weight. Similarly, Ni-Ti45 has Ni-48.86% and Ti-52.34% in weight. Finally, Ni-Ti50 has Ni-48.86% and Ti-51.14% in weight. Reason behind the increase in Ni weight percentage in Ni-Ti55 is due to the formation of Ni-Ti2 phases in the product.26,27 Similarly, the increase in Ti weight percentage in Ni-Ti45 might be due to the diffusion of Ti from the titanium substrate used during the process of sample development, as mentioned in our initial work. 23
SEM of (a) Ni-Ti55, (b) Ni-Ti45 and (c) Ni-Ti50.
Surface roughness of laser-annealed and non-annealed samples.
Measured values of (a) grain Size and (b) surface roughness of all three samples.
In Figure 10(a), our sample Ni-Ti55 shows some pimple-like structures on the surface as a result of re-melting of the sample after laser annealing. The dark region on the surface of the sample is Ti. 28 It was found that Ti has uniformly accumulated in particular regions rather than getting uniformly distributed throughout the surface. In Figure 10(b), Ni-Ti45 shows that there is not much Ti accumulation but mild settlements were seen here and there almost throughout the sample, spread uniformly. But in Figure 10(c), it was so clearly seen that the blend between nickel and titanium is so uniform throughout the sample. EDS results confirm that the amount of nickel and titanium present in this mixture is very close to each other unlike the remaining two samples. Figure 12(a) shows the microstructure of annealed Ni-Ti55 samples. The grain size seemed to be quite similar with little increase in the samples before they were annealed as shown in our earlier works. 23 Remarkable improvement is visible when Ni-Ti is treated above 600 °C. 29 The structure seems to be tightly packed and well organized with much of irregularity in their shape. Similarly, in Figure 12(b), the grain size of Ni-Ti45 shows that they are arrayed in such a way that there is no much space between each other and most importantly they are uniform in size and shape unlike Ni-Ti55. The Ni-rich Ni-Ti, in general, has a fine grain structure due to the suppression of the Ni4Ti3 precipitate during the development of the samples. 30 The Ti-rich Ni-Ti has bigger grain size due to the increase in Ti2Ni precipitate which is formed due to the difference in diffusivity between Ni and Ti during the fabrication process. 30 The increase in grain size is directly proportional to the increase in surface roughness in Ni-Ti alloy. This can more clearly be confirmed by comparing the values of grain size obtained by AFM results in section ‘Surface morphology’ with the surface roughness results quoted in Table 3. After annealing, the microstructure image seems to have gained an organized alignment because image shows more uniform structures than before they were annealed. From Figure 12(c), it is so clear that it has the finest microstructures among all the three. Ni-Ti50 seems to be the best combination with good qualities of SMA as reported earlier with SEM image in Figure 10(c).
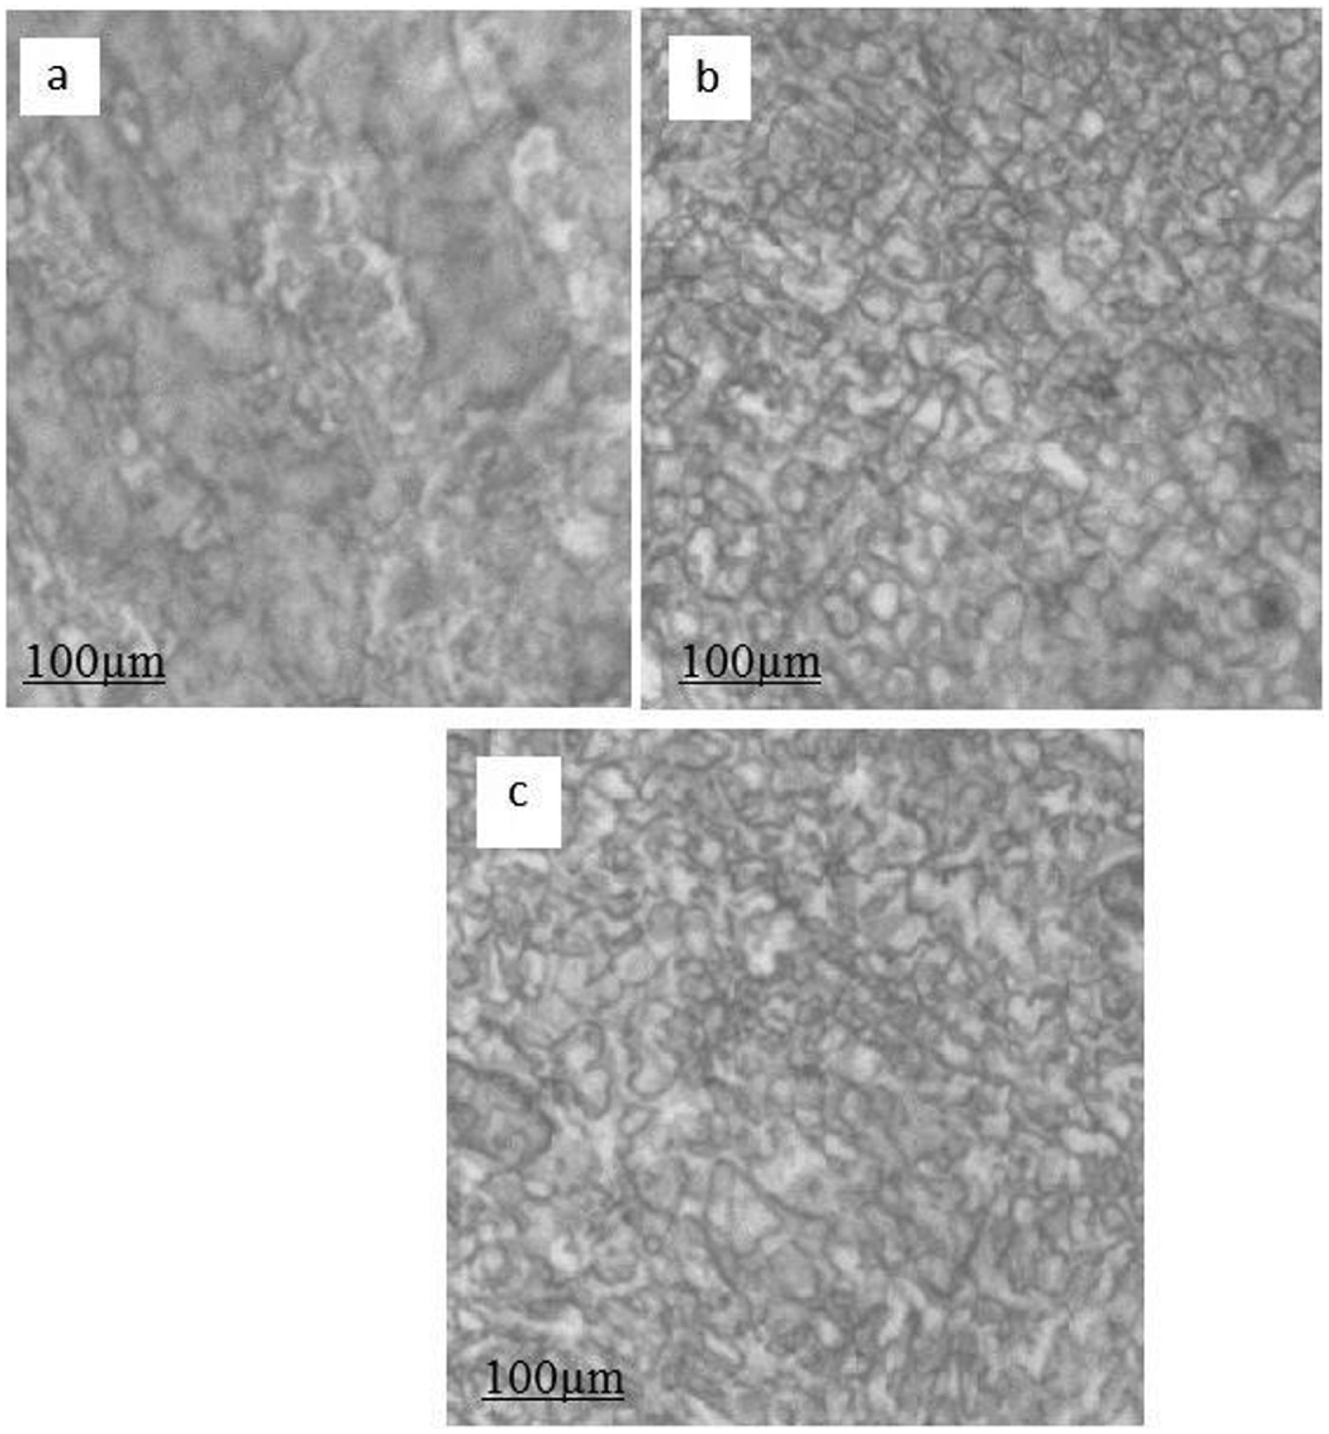
Microstructure of (a) Ni-Ti55, (b) Ni-Ti45 and (c) Ni-Ti50.
Mechanical properties
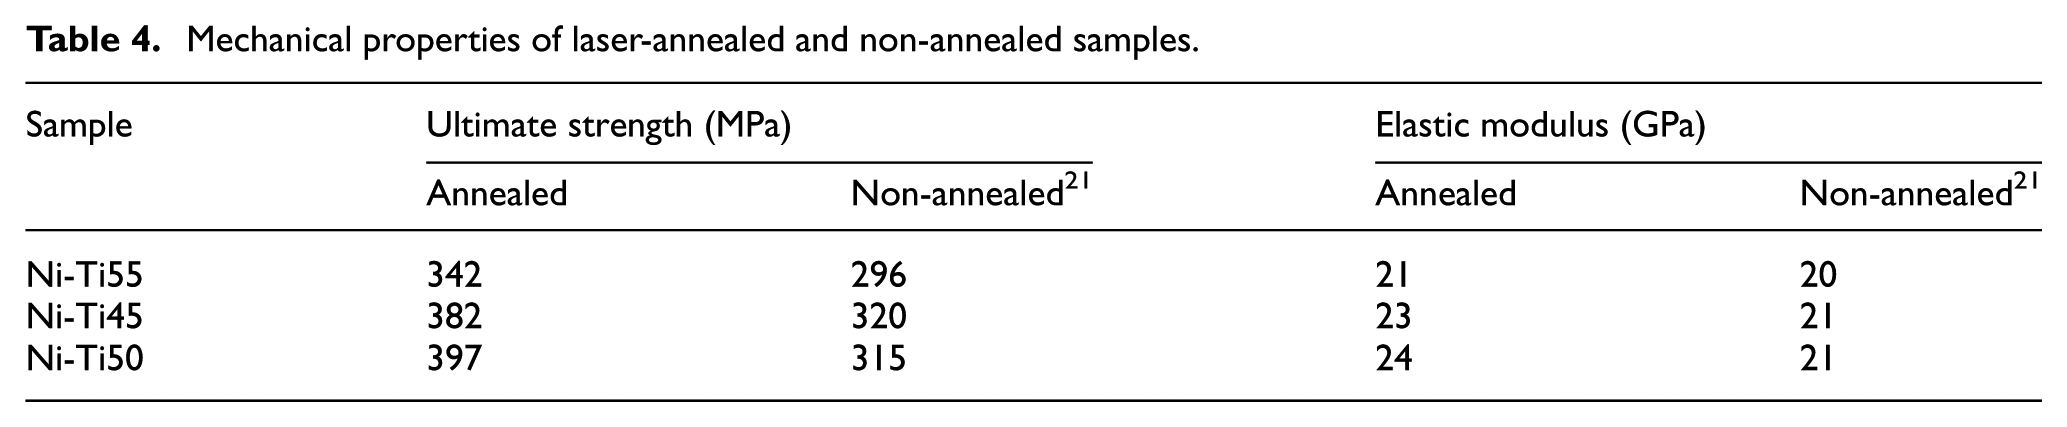
The laser-annealed samples were bisected transversely to the direction of lying and prepared using standard metallographic techniques, and micro-hardness measurement was carried out at an incremental distance of 25 µm at a load of 500 g. Figure 13 presents the results of micro-hardness measurements of both annealed and non-annealed samples. The average value of micro-hardness was found to be 397.33, 342 and 382.33 HVN for annealed Ni-Ti55, Ni-Ti50 and Ni-Ti45, respectively. The value of average micro-hardness was more for Ti-rich samples. As per the indications earlier in the EDS results this is because of the Ti weight percentage’s impact in the alloys, resulting in the formation of hard phases. Similar effects were seen in non-annealed samples too. 23 Since the micro-hardness is more for Ni-Ti55 samples, the ductility is likely to be less. A similar observation was seen for the Ni-rich sample Ni-Ti45. From the results obtained in the graph shown in Figure 13, it is very clear that the Ni- and Ti-rich samples have high micro-hardness that lies between 380 and 400 HV. The tensile strength and the corresponding modulus values of laser-annealed and non-annealed samples are quoted in Table 4. The values of non-annealed samples were taken from our previous work. 23 From Figure 14, mild variations in the engineering stress–strain curve before and after annealing can be seen. After annealing, the samples have faced an increase in ultimate strength and elastic modulus obtained by tensile tests. In spite of brittleness being a hindrance to ductility, mild improvement was observed uniformly for all samples as a result of laser annealing. The elasticity and ultimate tensile strength were found to be good for the equiatomic composition. Thus, the obtained results prove that the Ni-Ti50 has better mechanical properties as compared to the other compositions.
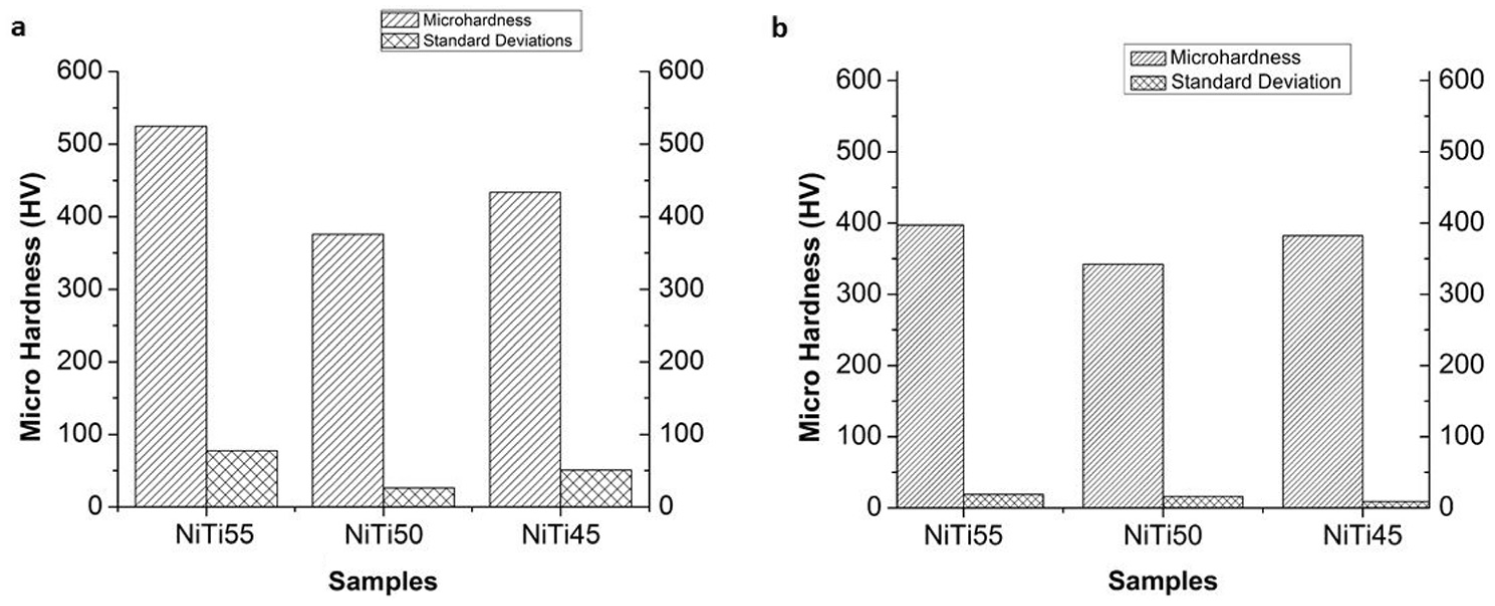
Micro-hardness and standard deviation of (a) non-annealed 21 and (b) annealed samples.
Mechanical properties of laser-annealed and non-annealed samples.
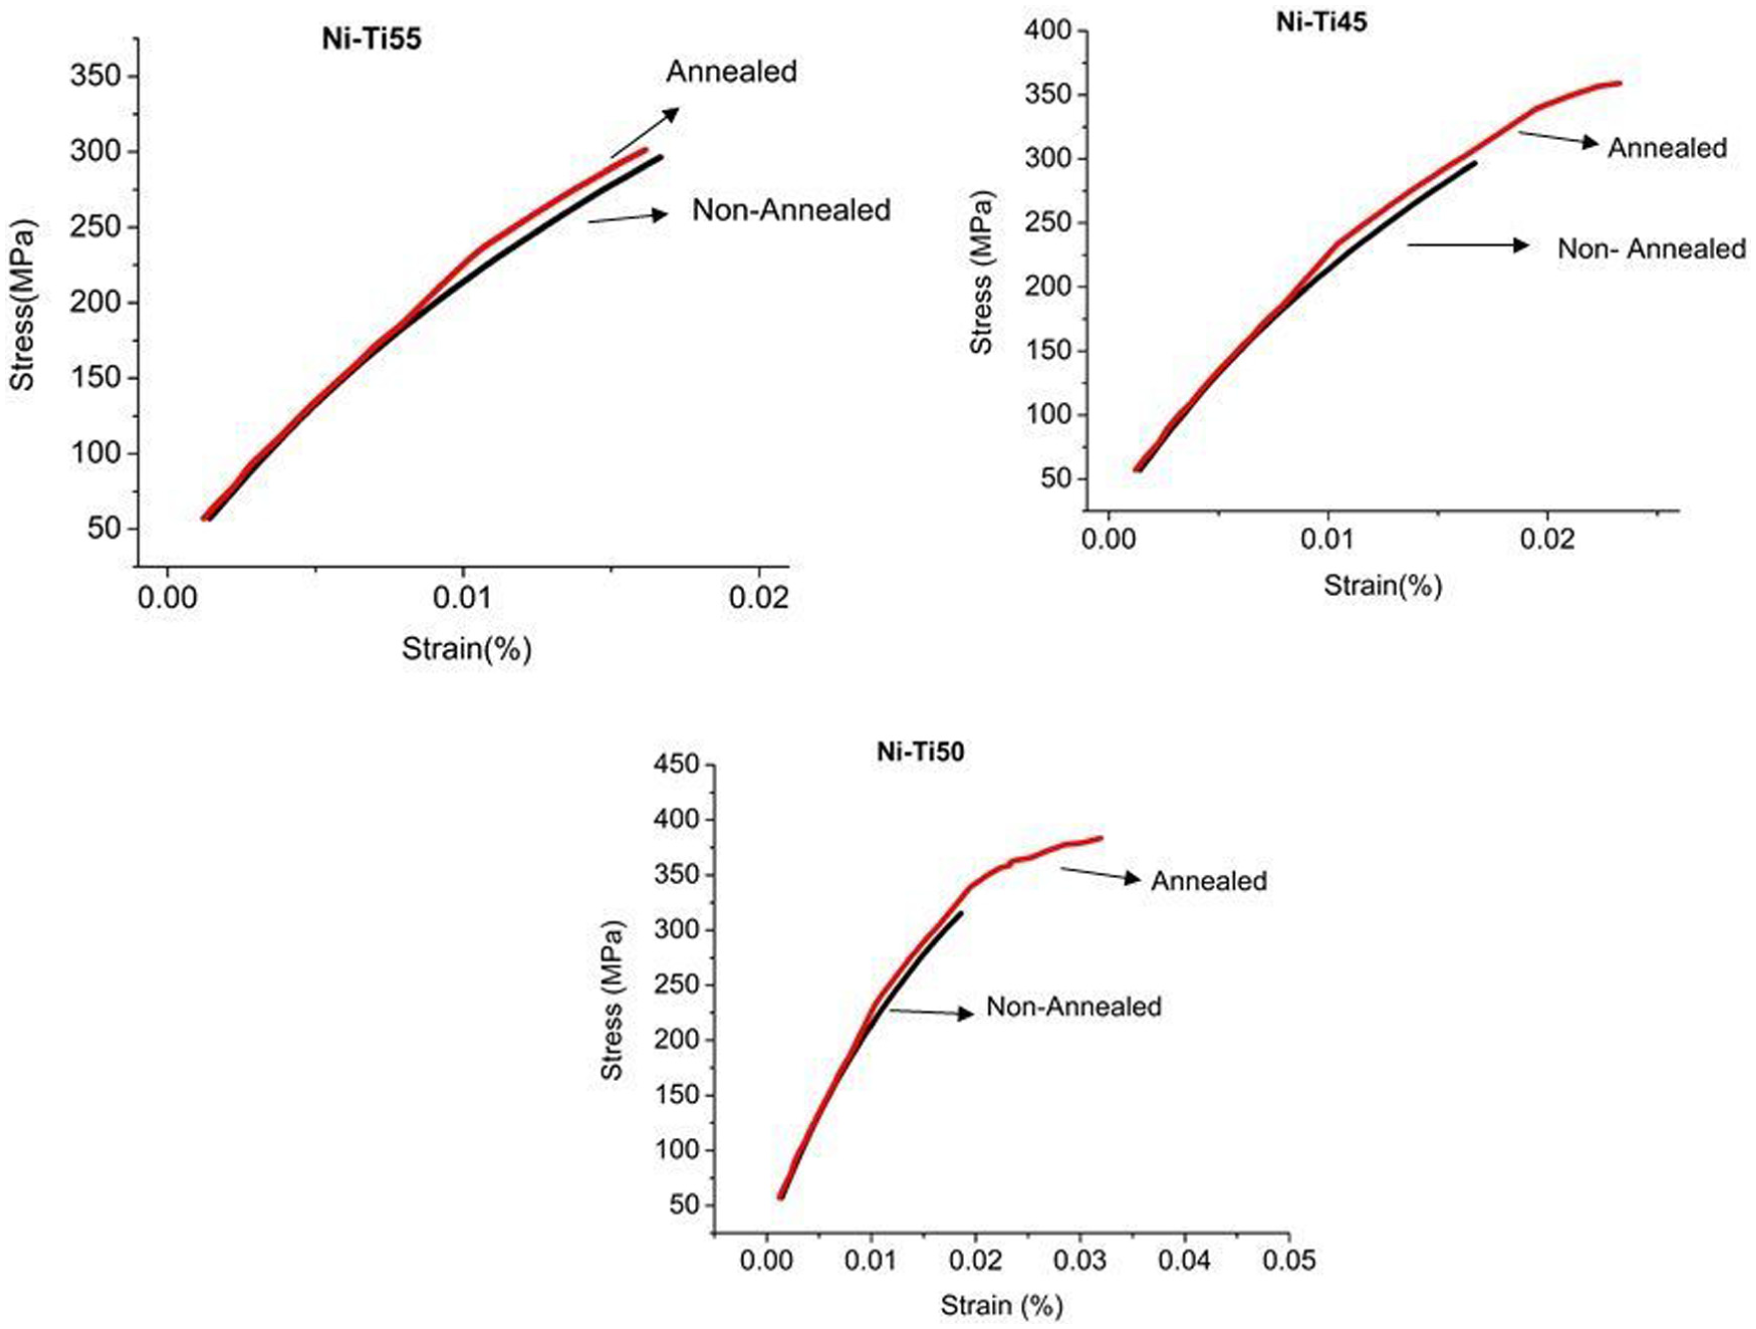
Engineering stress–strain graph of the annealed and non-annealed samples.
X-ray diffraction
Figure 15 shows the X-ray diffraction (XRD) spectrum of the formed samples. The presence of two phases, that is, austenite and martensite, was observed. All the patterns of the samples had narrow peaks which clearly intimate the presence of well-crystallized grains in fine sizes. There are lots of incomplete martensite peaks formed, and also, all these peaks are split. Lots of spectrums had emerged after laser annealing, clearly indicating the impact of efficient laser annealing. The untransformed martensite peaks formed on the annealed samples were because of the Ni-rich layer which gets developed right under the oxide layer as an effect of laser annealing 11 which is absent in non-annealed samples as shown in Figure 15. The absence of precipitates in the annealed sample is due to the less time of contact between the laser and the surface of the specimen, whereas in conventional annealing enough time is available for the Ni-Ti alloy to react with heat to form precipitates. From the XRD graphs, we can conclude that the samples of Ni-Ti have been finely processed by the laser annealing which had converted its crystalline nature. Laser annealing through the opted laser energy density level has also brought no harm to the nature of the material physically and chemically.
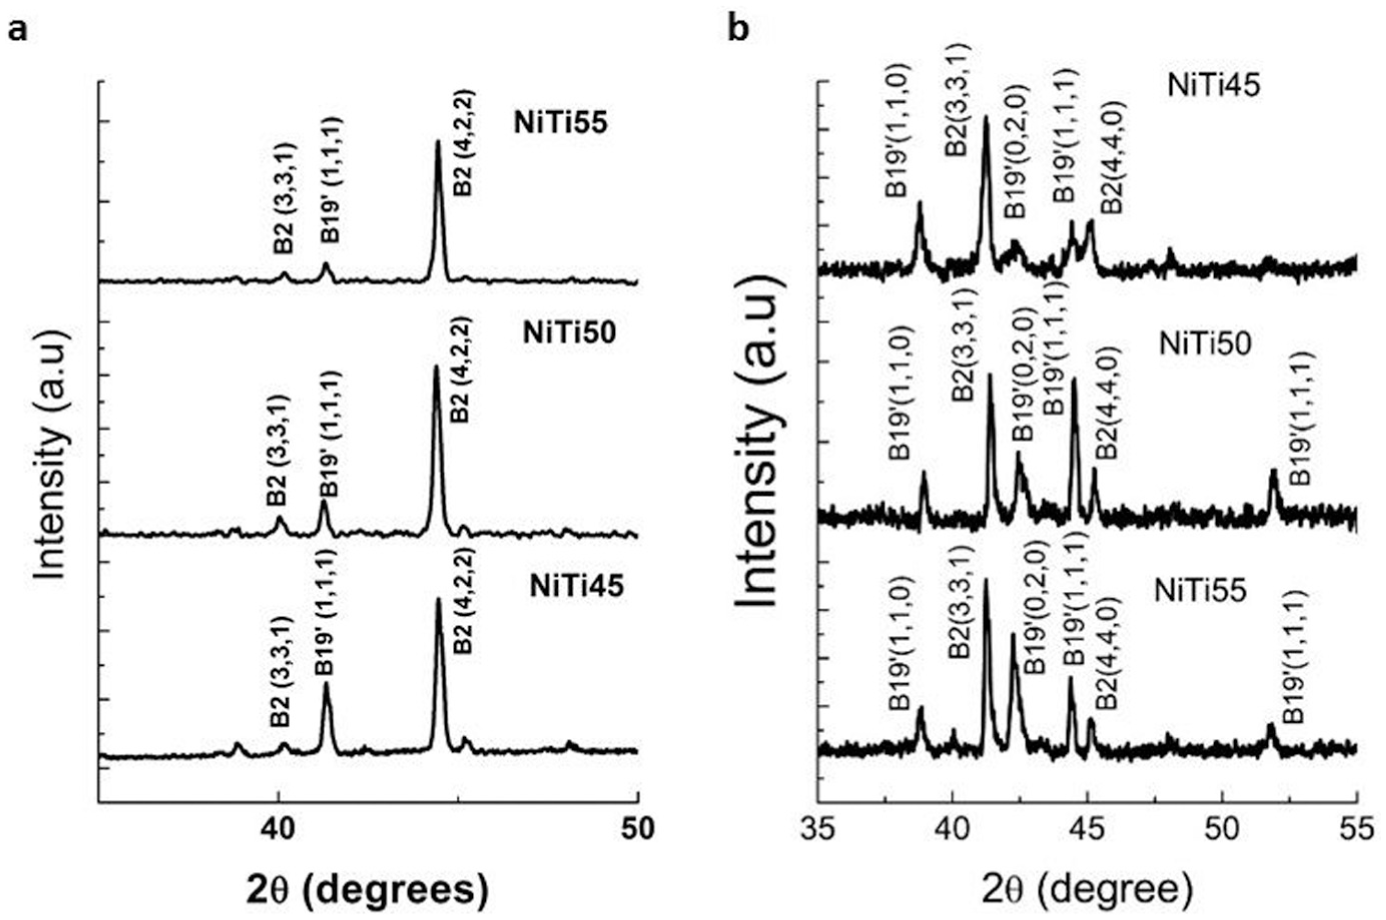
XRD graph of (a) non-annealed 21 and (b) annealed samples.
From Figure 15, it is known that Ni-Ti55 has its austenite peak with cubic structure at 2θ = 41°24′, and it is parallely accompanied by martensite peaks with monoclinic structure at 2θ = 38°78′ and 2θ = 42°25′ on either sides. Ni-Ti50 has its cubic-structured austenite peak at 2θ = 41°38′ and its monoclinic-structured martensite peaks at 2θ = 38°94′ and 2θ = 42°44′ on either sides parallely. The Ni-Ti45 sample has its austenite peak at 2θ = 41°26′ and martensite peaks at 2θ = 38°78′ and 2
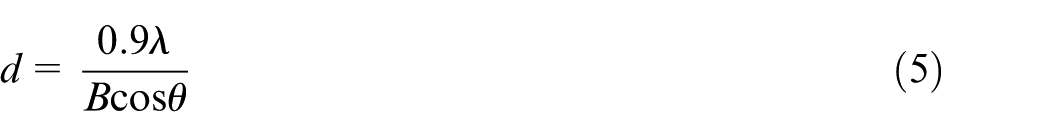
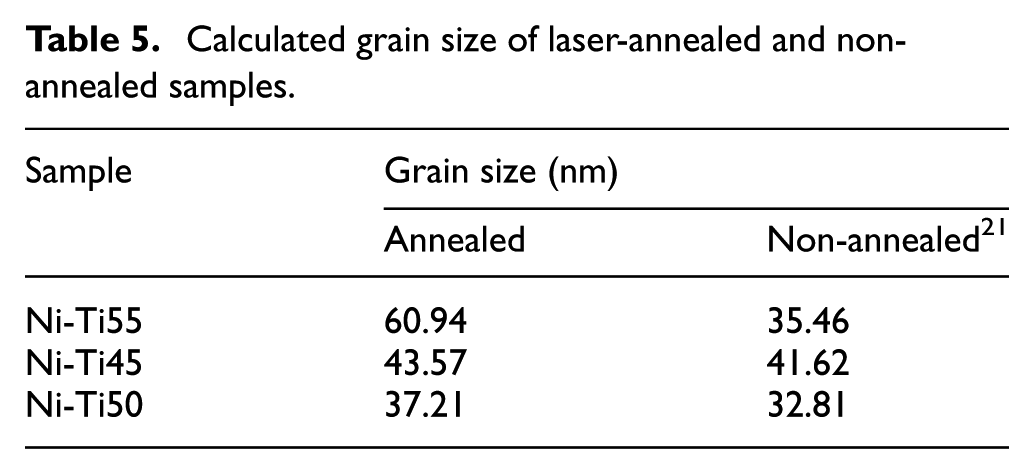
where d represents crystallite size, λ represents wavelength of the X-radiation used, B represents the peak width at half the intensity and θ is the Bragg angle. 31 The calculated grain size values of Ni-Ti55, Ni-Ti50 and Ni-Ti45 are 60.94, 37.21 and 43.57 nm, respectively. The values obtained were quite close to the values of AFM experiments and also supported by the microstructure image results in section ‘Surface morphology’. Table 5 shows the variations in the calculated grain size of the samples before and after annealing. From the results, the increase in grain size due to the effect of laser annealing is vividly seen.
Calculated grain size of laser-annealed and non-annealed samples.
DSC
The presence of two phases has been confirmed in the laser-annealed products, through XRD graphs. To confirm things more clearly and precisely, DSC had been carried for the samples. From Figure 16, it can be observed that Ni-Ti55 sample does not show any visible curves in heating, and in cooling, they show their martensite start (Ms) temperature at 25 °C and martensite finish (Mf) temperature at 16 °C. Before annealing, both in heating and cooling, no visible results were obtained. Visible curves were obtained after annealing the samples of Ni-Ti45 and Ni-Ti50. Also, they have good steep transition curve in both heating and cooling processes. The Ms and Mf of Ni-Ti45 are −35 °C and −50 °C, respectively, whereas its Austenite start temperature (As) = −38 °C and Austenite finish temperature (Af) = 20 °C. Ni-Ti50 sample has its Ms at −5 °C and Mf at −20 °C. The same sample has its As at −16 °C and Af at 10 °C. Researches in the past claim that the stress induced during annealing has a great impact on the increase in austenite temperatures. This indicates stabilized martensite phase due to laser annealing. Rapid cooling of the material after laser annealing is liable of generating locked-in internal stress, dislocation or vacancies. 32 These defects induce reverse martensitic transformation due to frictional stress generated on the parent phase (martensite). Therefore, also in the results presented here, we can find that the martensite start and finish temperatures of the laser-annealed sample have decreased compared to the as-made sample’s results. There is an increase in the austenite start and finish temperatures of the laser-annealed samples as they need additional energy to overcome the generated frictional stresses produced. The decrease in the Ms temperature can also happen due to the increase in Ni in the alloy as it was in the case of Ni-Ti45, which has already been confirmed by the EDS and XRD results shown earlier.
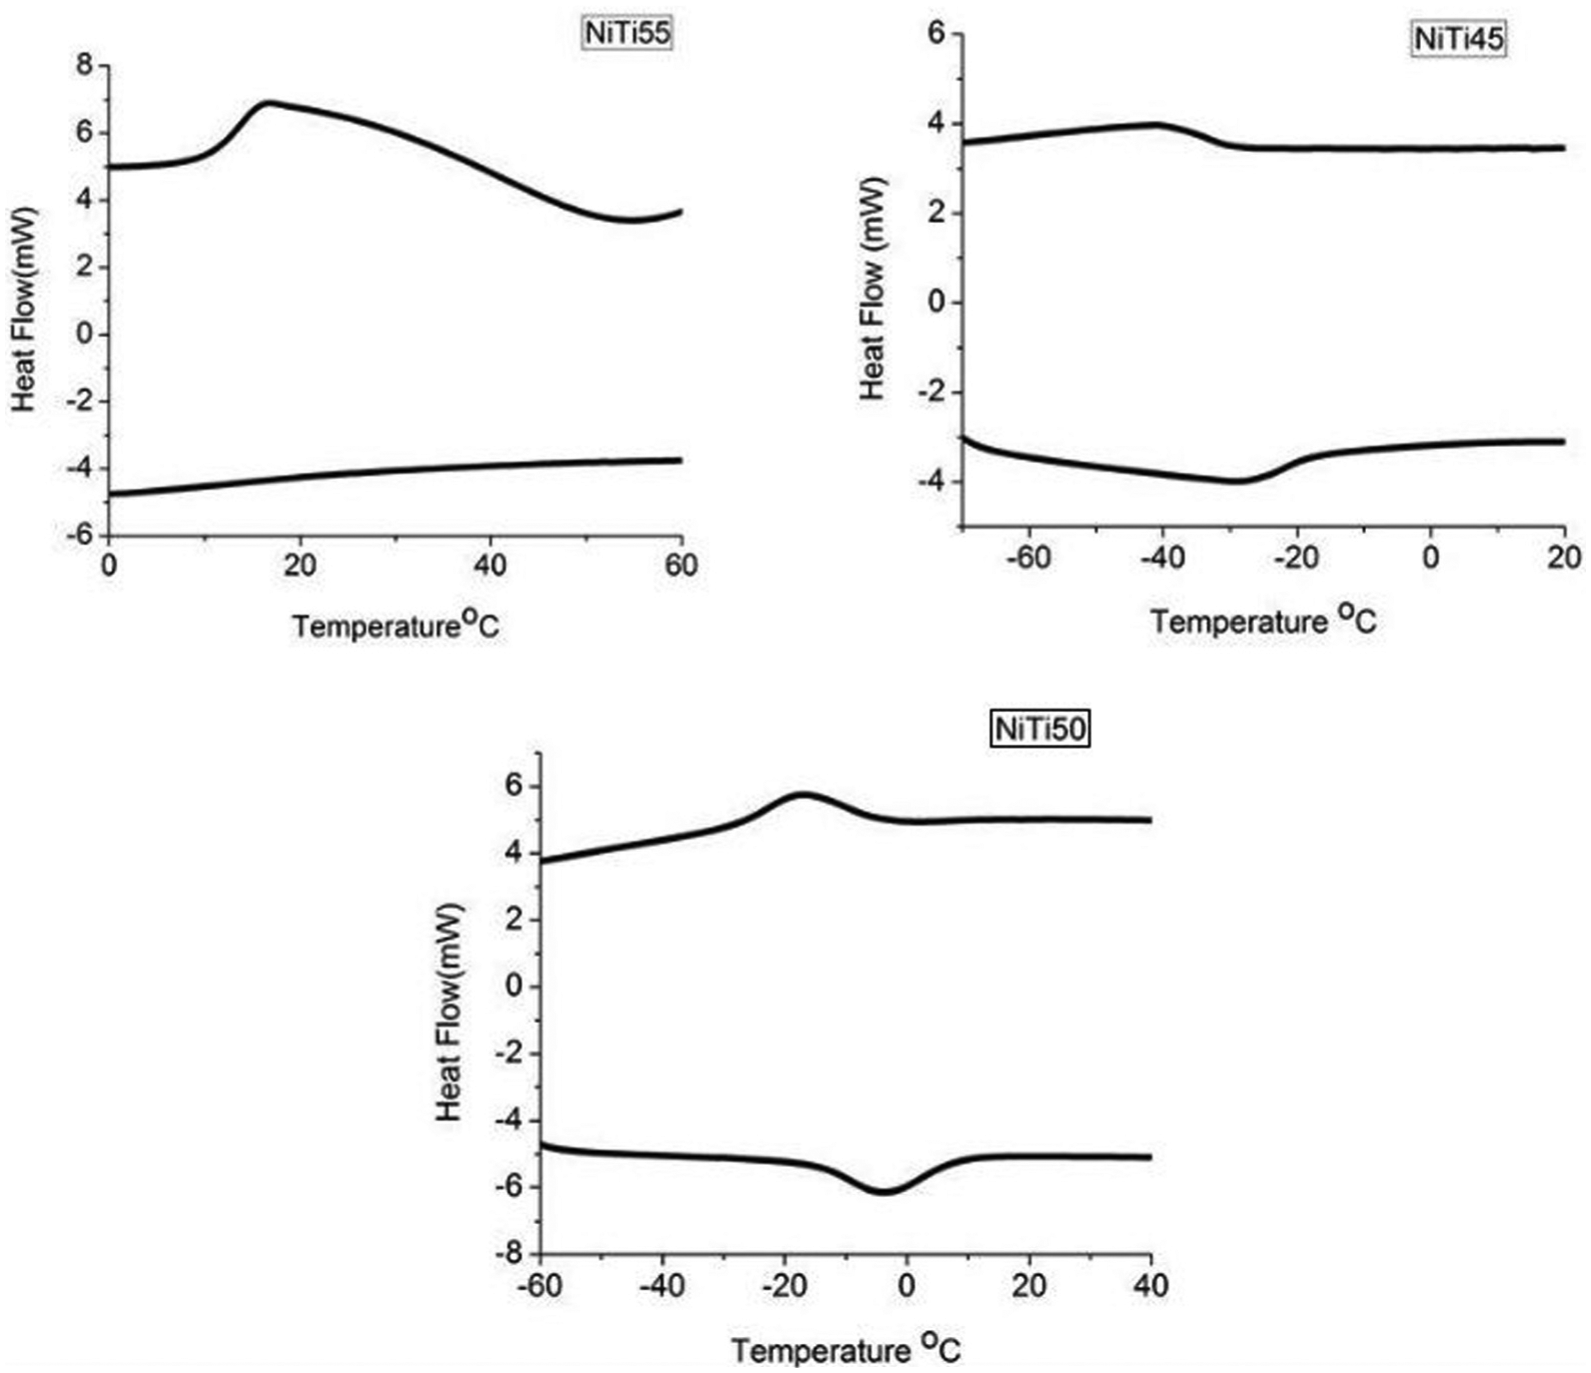
DSC graph of annealed samples.
Influence of laser annealing
The main reason behind deploying laser annealing for the samples is too much of heating can spoil Ni-Ti’s SMA characteristics. Due to heating Ni-Ti at 630 °C or more and due to eutectic decomposition, lots of Ni3Ti precipitates will form. 30 Moreover, in conventional furnace annealing, heat is completely distributed right from the bottom to the top of the thick film with no control on selectiveness of the surface. Hence, higher loss of heat energy becomes inevitable. In order to prevent all these types of loss, laser annealing was chosen, and it has given some exceptionally good results. Nd:YAG laser annealing at 532 nm wavelength has revealed some unique advantages over the remaining laser annealing as well. AFM results show a smoother surface morphology than the results of samples annealed with CO2 laser as reported in earlier works.9,10 Results of scanning laser 11 show the presence of cracks on the surface of the samples which is not the case in this work. With increase in grain size, the general effect of annealing is clearly visible in Nd:YAG laser annealing than the diode laser annealing. 12 Risk of ablation is high while using infrared laser for annealing,13,14 whereas in Nd:YAG laser annealing the risk of ablation is under control. The same Nd:YAG laser is not able to produce smoother surface morphology revealed by SEM when annealing was done at the wavelength of 1064 nm. 15 Just like the results of as-manufactured samples, 20 the Ni-Ti50 combination continues to dominate the other two samples. SEM results flaunt the Ni-Ti50 structure’s improvement to good shape after annealing. The micro-hardness values also show some slight variation towards increment. That has led to its decrease in ultimate strength and elastic modulus. XRD shows good peaks in martensite phase as well as in austenite phase. Especially, in Ni-Ti50, XRD spectrum shows that the positions of its martensite peak and austenite peak have shifted towards higher angle. This actually indicates compression and reduction in space between the lattice planes. 33 So, this confirms the efficiency of the laser annealing done and also indicates good crystalline nature of the sample. DSC graphs also support this point as the phase transformation peaks have become steeper after annealing than the remaining two samples.
From the above consolidated results, it is very clear that Ni-Ti50 has improved itself in many co-relations in their characteristics like surface morphology, structure and shape memory effect than the remaining two samples. Most interesting thing was Ni-Ti45 has also gathered itself into better shape through laser annealing giving some improved results than it was in the as-made state.
Conclusion
In this work, laser annealing of Ni-Ti structures of three different compositions was carried out using Nd:YAG-pulsed laser. Processed samples were characterized after annealing and compared with the results of the samples in as-manufactured state. The changes in grain size, crystalline nature and so on before and after annealing the samples have been studied. The conclusions of this study are as follows:
The surface annealing of Ni-Ti samples was successfully performed at a laser energy density of 1100 mJ cm−2.
An increase in the grain size and surface roughness was obtained as a result of laser annealing.
Laser annealing increases the incomplete martensite phase due to the oxide layer formed on the surface as a by-product.
DSC results showed that the laser-annealed samples had visible phase transformation spectrums which were helpful to determine phase transformation temperatures easily.
Footnotes
Acknowledgements
The authors acknowledge the technical support of Mr S.K. Mishra, Mr C.H. Premsingh and Mr Upendra Kumar of RRCAT for preparation of LAM samples. Thanks are also due to Sophisticated Instrument Centre (SIC), Indian Institute of Technology, Indore, for providing us characterization facilities.
Declaration of conflicting interests
The author(s) declared no potential conflicts of interest with respect to the research, authorship and/or publication of this article.
Funding
The author(s) received no financial support for the research, authorship and/or publication of this article.