
Abstract
CuAlNi shape memory alloy (SMA) has wide scope in vibration damping applications for machine tools. A bespoke cold spray based additive manufacturing system was used to fabricate CuAlNi SMA precursor structures of two different compositions with optimized deposition parameters, which were subsequently alloyed via annealing. The two compositions of CuAlNi chosen for the study were Cu rich in wt% (Cu-82%, Al-14%, Ni-4%) and the Ni rich in wt% (Cu-12%, Al-2%, Ni-80%) shape memory alloy material. The various properties of developed samples were compared with commercially available CuAlNi structure. The properties compared include surface morphology, crystal structure, phase transformation temperature, and mechanical properties were studied with scanning electron microscopy (SEM), X-ray diffraction (XRD), differential scanning calorimetry (DSC) compression testing respectively. The shape memory characteristics were also analyzed using dynamic mechanical analyzer (DMA). Among the two samples, Cu rich sample exhibited better SMA qualities than Ni rich sample as reported in the literature. The micro-hardness of Cu rich sample was to be 356 ± 3 VHN comparatively lower than Ni rich sample. The DSC results revealed the phase transformation hysteresis for Cu rich sample to be very low at 5 ± 3°C. The Cu rich CuAlNi SMA showed very good shape memory characteristics in the DMA results in the range of 50°C to 100°C.
Keywords
Introduction
Among the various Shape Memory Alloys (SMA), the binary alloy of NiTi (Nickel Titanium) and its ternary form of TiNiCu alloy have shown promising results in the past.1,2 Similarly in ternary alloy SMA CuAlNi (Copper Aluminum and Nickel) is also deployed in wide range of applications, for the corrosion resistance and high damping efficiency.3,4 The special properties of the CuAlNi alloy is predominant by the presence of CuNi in the alloy, which also provides good electrical and thermal conductivity.2–4 The aluminum assists corrosion resistance as its presence leads to the formation of a protective Al2O3 oxide layer when exposed to saline environments. Past literature has shown, sintering, 5 sputtering, 6 plasma fusion, 5 isostatic pressing, 5 thermal evaporation, 7 induction, furnace melting, 5 melt spinning, 5 casting, 5 and rapid solidification 5 to be the successful methods of developing CuAlNi shape memory alloy structures. Other laser based additive manufacturing of CuAlNi bulk structures using layer by layer development technique like selective laser melting (SLM), 5 are reported to be successful but problems like high brittleness, secondary phase formation and diffusion of substrate materials into the samples are inevitable. Hence to counter the problem of brittleness and non-porous deposition in bulk CuAlNi fabrication need for an alternate method is of high priority. As a novel approach, in the current paper cold spray (CS) deposition is utilized to manufacture bulk CuAlNi SMA.
The CS technology facilitates layer by layer deposition of powder particles leading to the formation of bulk structures with close and tightly packed powder particles. The alloying of powders is carried out by a post deposition process of annealing the fabricated sample. From the literature to the best of our knowledge it is known that the deposition of bulk CuAlNi SMAs using CS is yet to be investigated. Hence the current study primarily focuses on analyzing the various properties of the CuAlNi bulk SMA samples of two different compositions deposited by CS. The surface morphology, microstructure, mechanical properties, crystalline properties, phase transformation properties, and shape memory properties of the developed samples are analyzed and compared with the properties of commercially available bulk CuAlNi sample.
Experimental procedure
Figure 1 shows the schematic diagram of the indigenously developed computer controlled cold spray set up being used for the deposition of the CuAlNi samples. Deposition process was initiated with manually pre mixed powders of desired compositions, fed inside the hopper placed on a load cell to calculate the deposition efficiency of the experiments. Powder particles used for deposition were mildly preheated to avoid any oxidation on the surface during their manufacture. Powder in the hopper was carried into the convergent section of the De Laval-type (convergent and divergent) nozzle by high pressure nitrogen gas. The De Laval-type nozzle delivers the output Mach number of 2.9, which accelerates the pre mixed powders to get deposited in supersonic speed. As shown in Figure 2. once the powder particles cross the throat of the nozzle as per the theory of gas dynamics with the assistance of pre heated nitrogen gas high speed is attained at the exit of the nozzle. 8 A drag force exerted by the pre heated nitrogen gas in supersonic stream, accelerate the powders with high speed that assists maximum deposition efficiency. An efficient deposition can be assured once the powders travel above a high threshold value after absorbing the enough drag force provided by the carrier gas (Nitrogen).
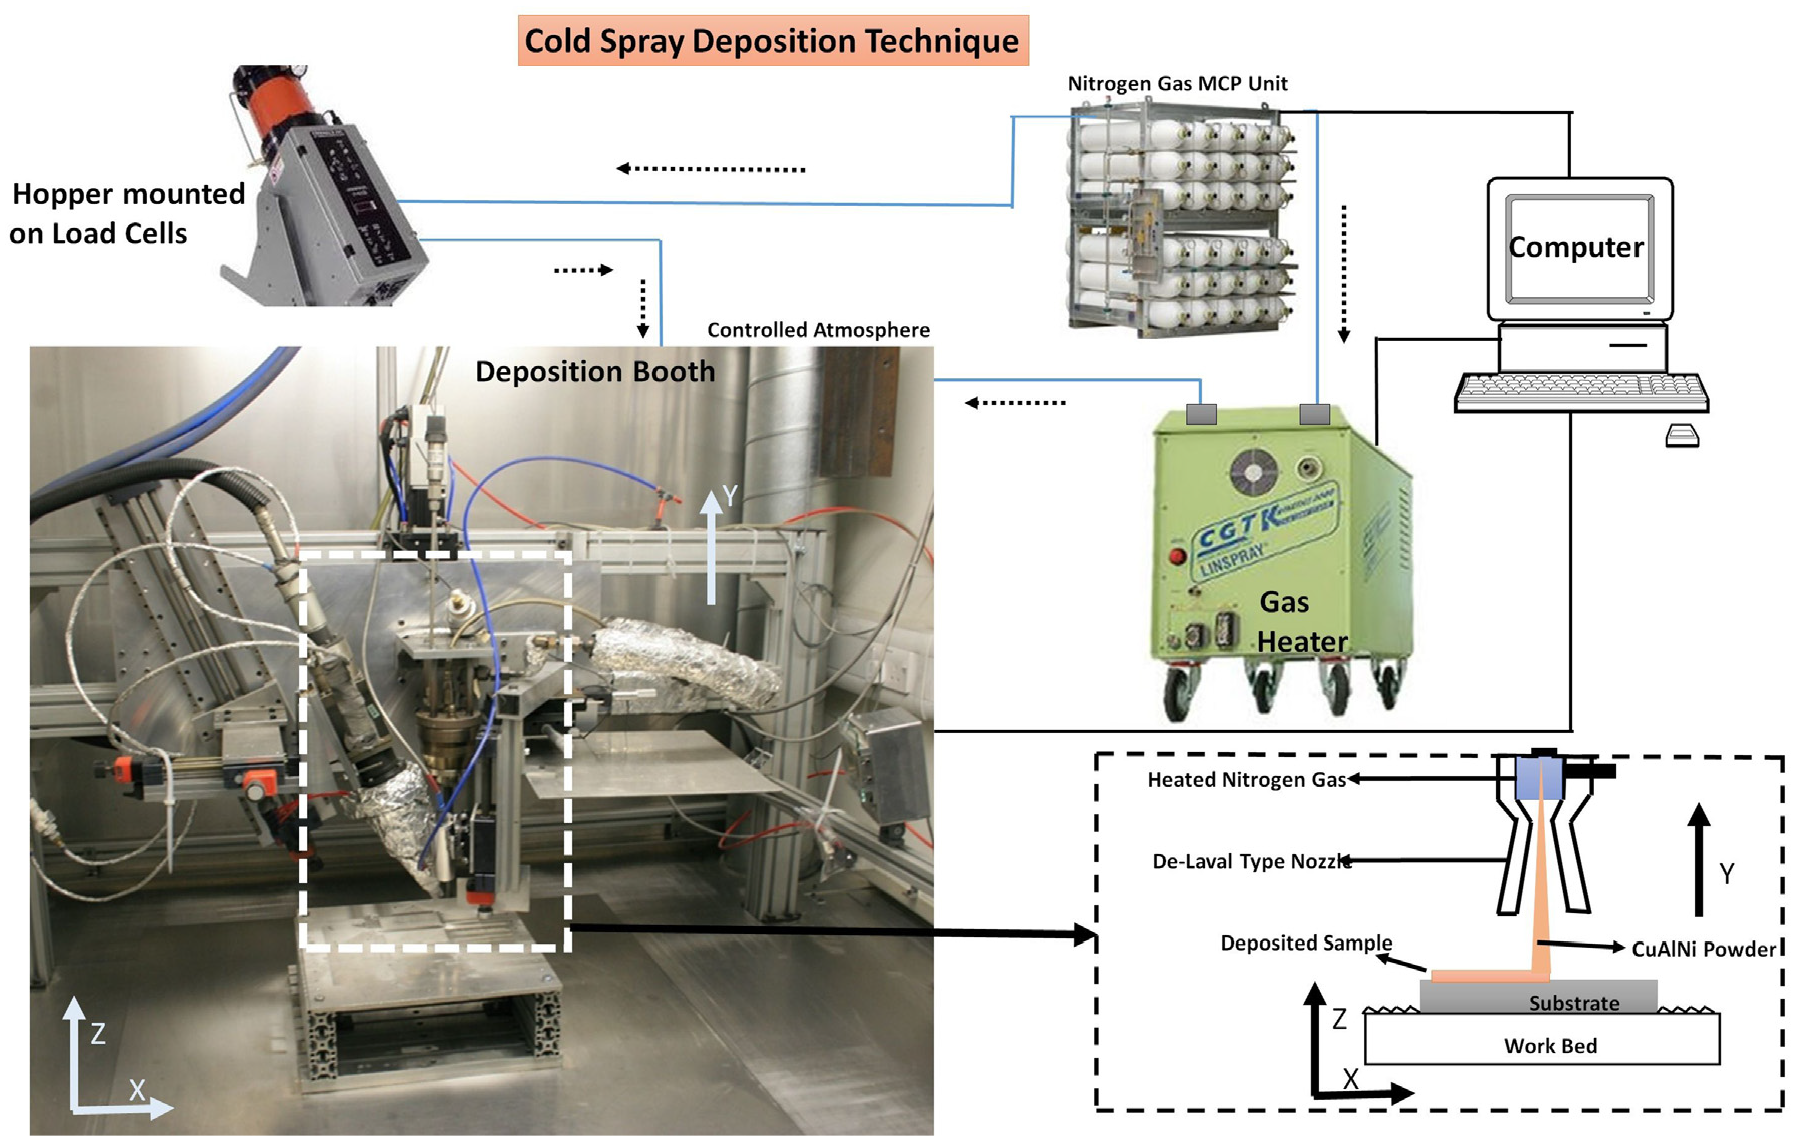
Schematic diagram of CS to fabricate CuAlNi samples.
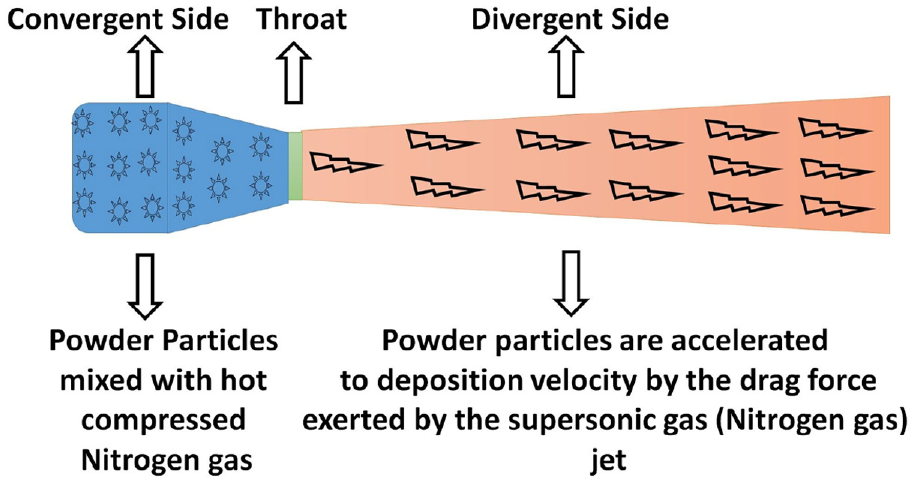
Schematic diagram of De Laval-type nozzle used for CS and its functioning.
The ability of the powder to completely absorb the drag force from the gas stream to get accelerated for deposition totally depends upon the powder properties like density, elasticity, plasticity, and viscosity. Though the gas stream can easily exceed the critical velocity required for deposition of Cu, Al, and Ni particles, it requires enough time to reach the critical value within the gas jet. In order to facilitate the required time, the length of the divergent section of the nozzle are extended, to provide the enough duration to the powder particles to attain the critical speed for deposition. 8
The carrier gas was chosen to be nitrogen, for its ability to provide the required particle velocity at lower cost compared to helium and other options of gases available. Processes of deposition was carried out on mild steel substrate of thickness 5 mm with surface roughness exceeding 20 µm, in order to ensure good adhesive bonding of powders as mentioned by the researchers in the past. 8 Optimized parameters used for the entire deposition process are as quoted in Table 1. As shown in Figure 3 two different compositions of CuAlNi, Cu rich in wt% [Cu-82%, Al-14%, Ni-4%] and Ni rich in wt% [Cu-12%, Al-2%, Ni-80%] were deposited in a thickness of 5 to 10 mm each. Reported results claim that Cu rich samples to be good in actuation and Ni rich samples to be weak in actuation. 9 Since fabrication of CuAlNi SMA using CS is a new approach, in order to have a detail understanding on the various properties, the above two mentioned compositions were chosen for study.
Parameters used for CS to develop CuAlNi SMA.
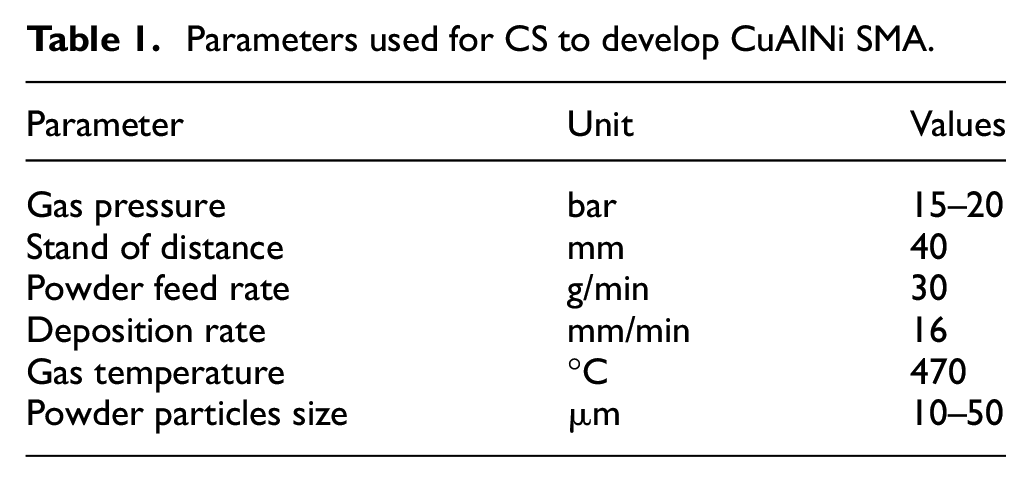
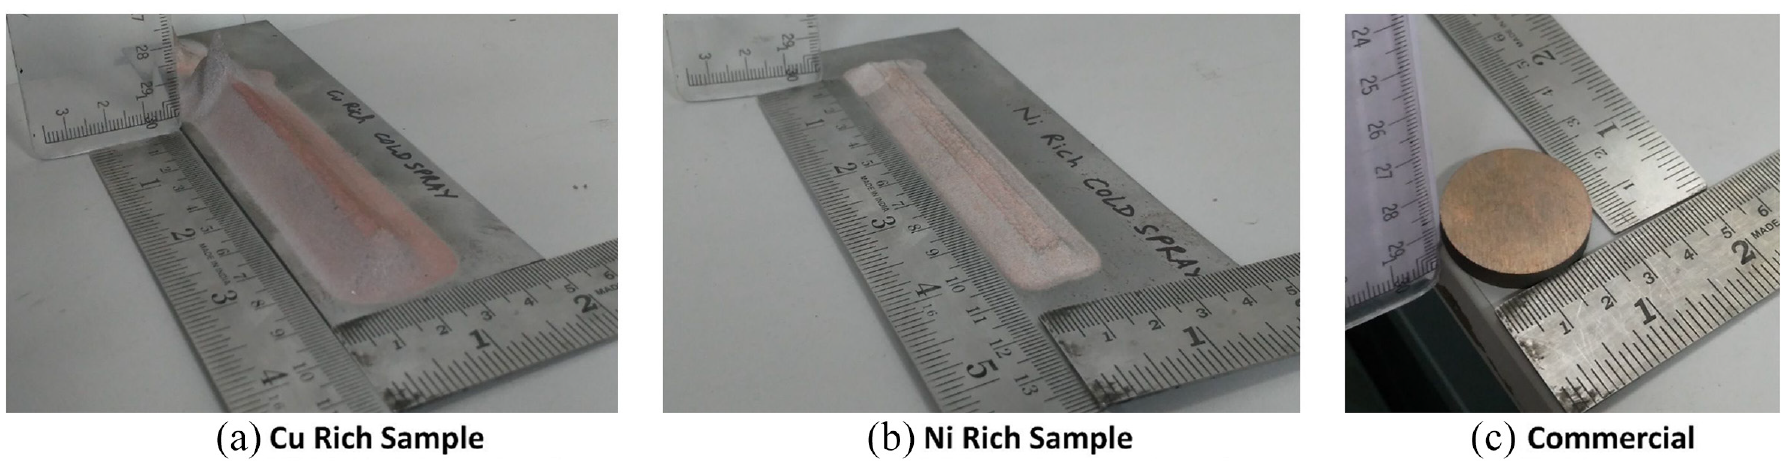
Diagram of (a) Cu rich CuAlNi (b) Ni rich CuAlNi samples developed by CS, and (c) commercially available CuAlNi bulk sample.
The properties of the CUAlNi SMA fabricated by CS was compared with the properties of commercially available CuAlNi SMA developed conventionally by Testbourne Ltd. UK (as shown in Figure 3).
The powder particles of Cu, and Ni were procured from Sandvik Osprey Ltd, UK, while the Al powder was supplied by Ronald Britton Ltd. and mixtures were created in the desired ratios. Spherical powders of 10 to 50 µm diameter were chosen over irregular and flake shaped powder particles to provide dense deposits and low porosity, with high deposition efficiency. 10 Also the powder particle size of all elements were maintained between 10 to 50 µm as the initial trial experimentations proved lesser or greater than the mentioned range of particle size had low efficiency in deposition. From the Figure 4 its vivid that Cu and Ni powder particles to be in spherical shape in spite of initial preheating whereas Al powders evolved to tubular shape by the effect of preheating. This may be attributed to the mild deformation on the surface of the powder particles gradually leading to necking. The pie chart in Figure 4 shows the maximum quantity of powders remain between 30 and 40 µm. Once the deposition is done using CS, the post annealing process was carried out in tube furnace under argon atmosphere for an hour at 1000°C. The cross section of samples before and after annealing are as shown in Figure 5.
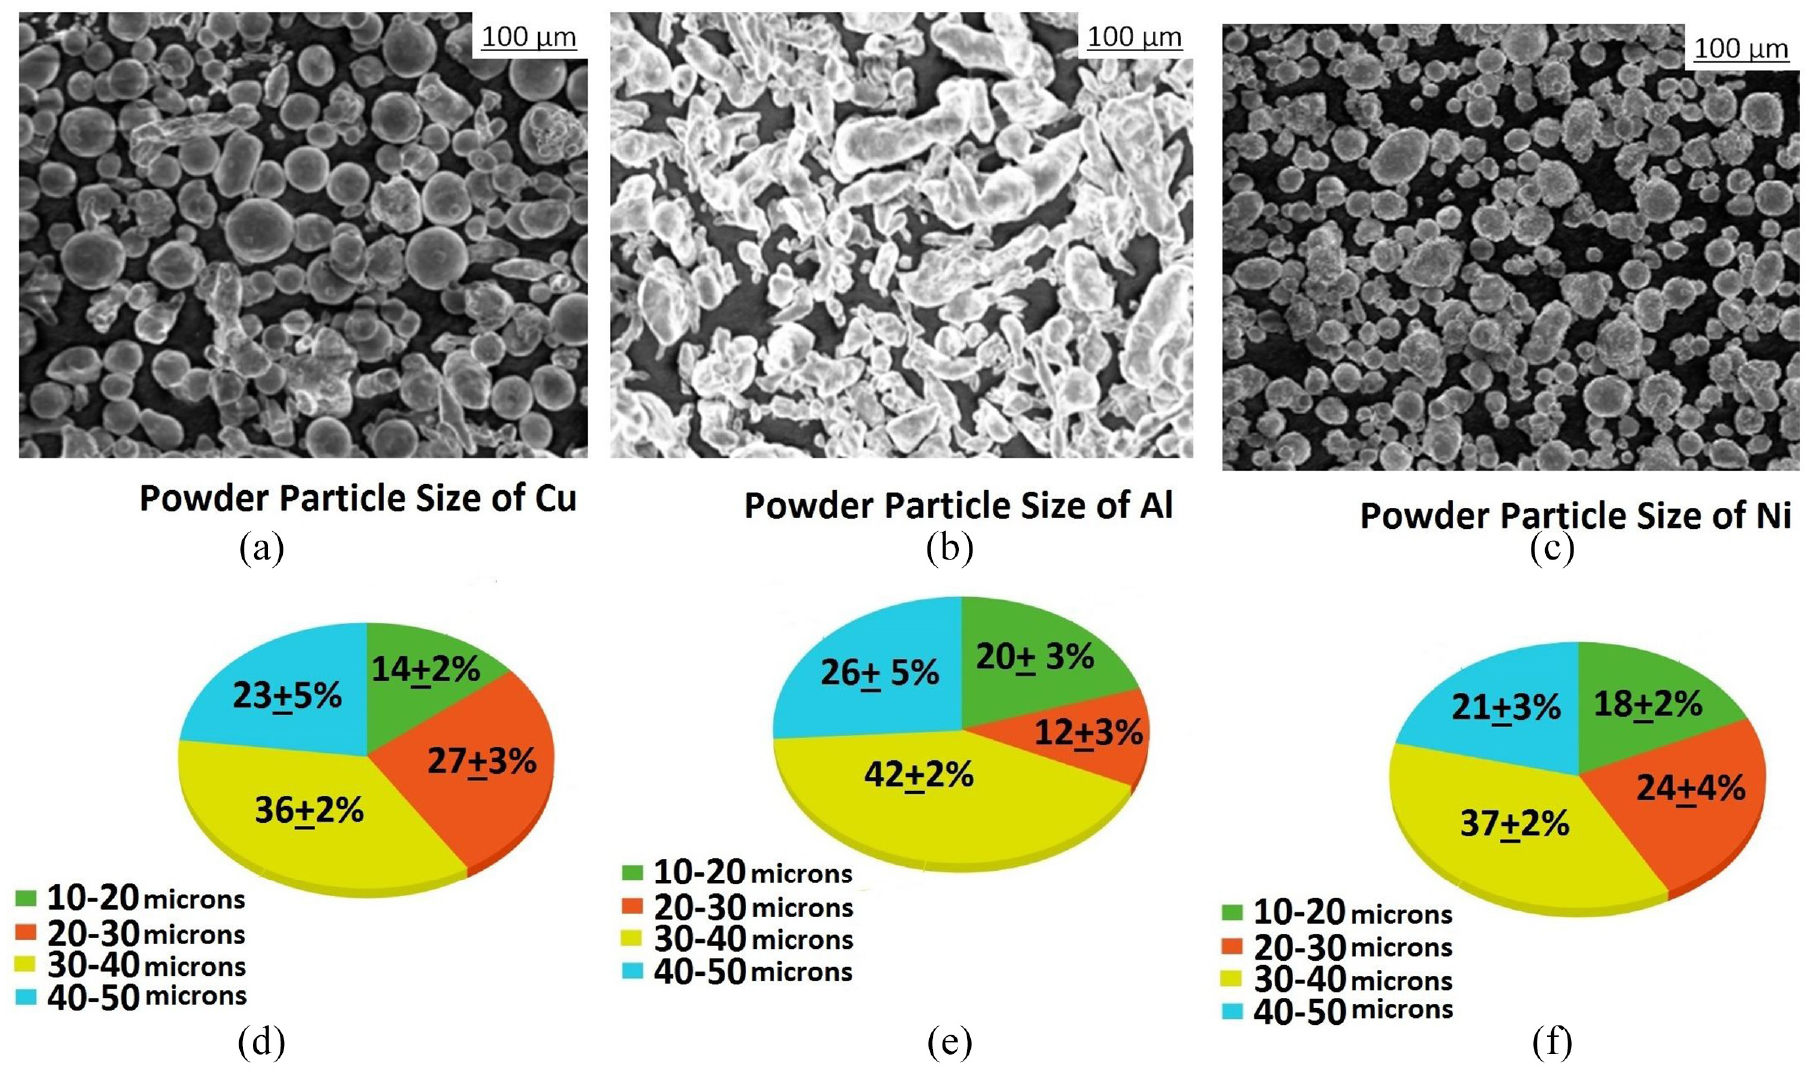
SEM images of (a) Cu, (b) Al, and (c) Ni and particle size % distribution of (d) Cu, (e) Al, and (f) Ni.
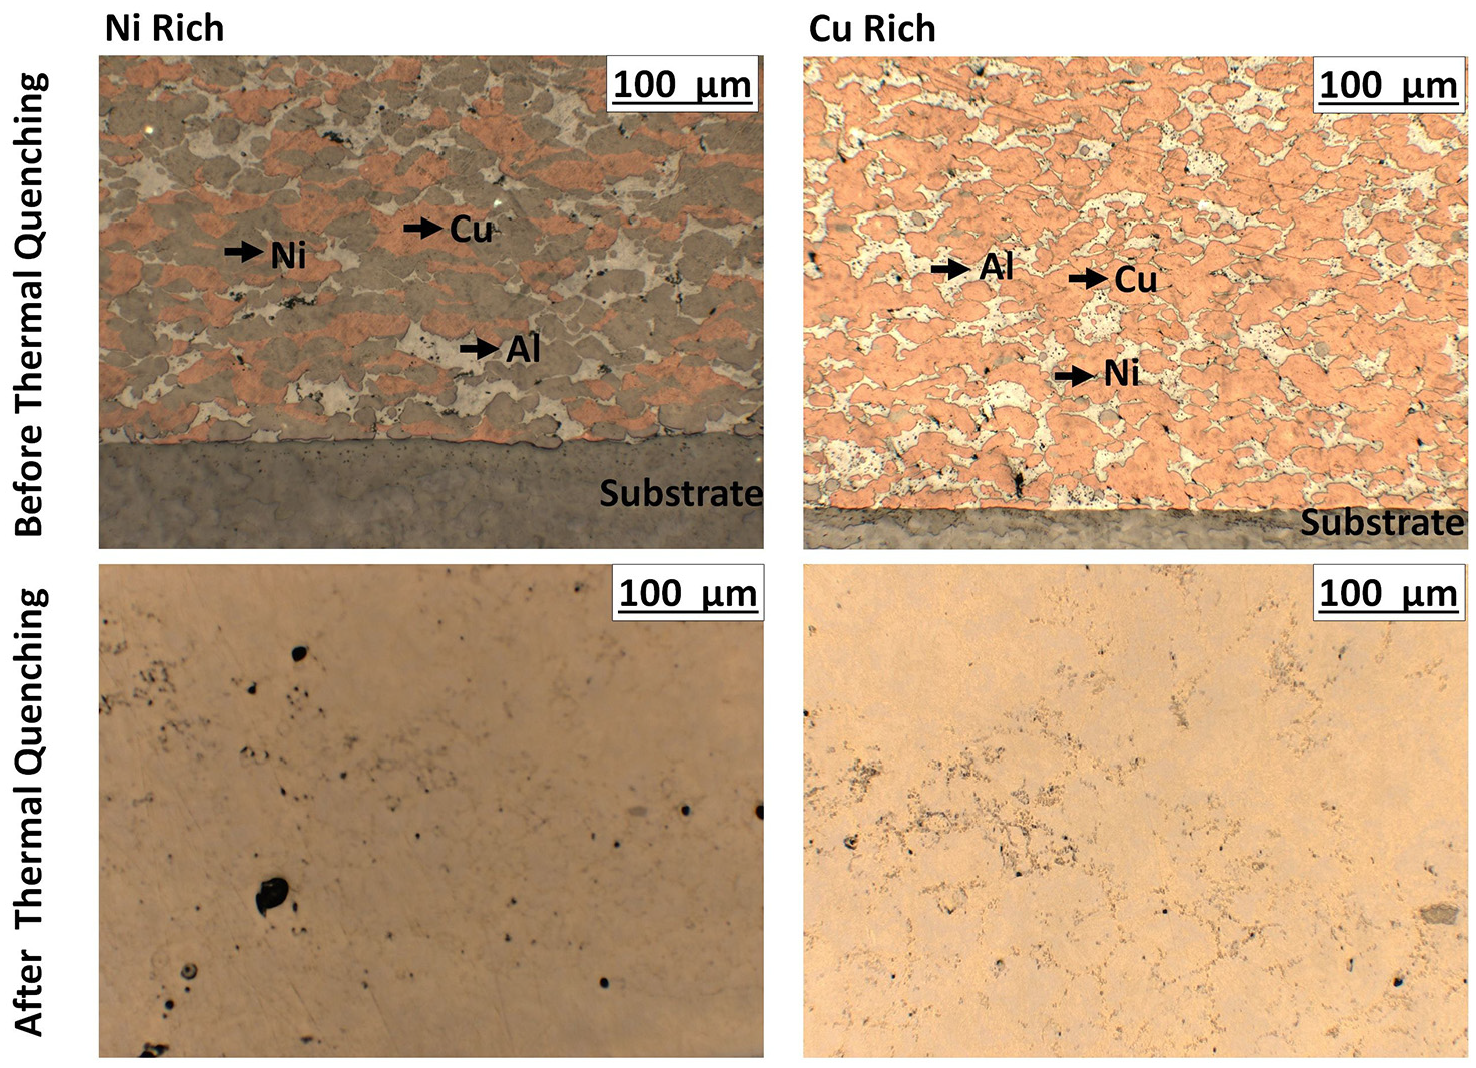
Cross sectional images of Ni rich and Cu rich samples before and after annealing.
The surface morphology of the samples were investigated using the scanning electron microscopy (Make: Zeiss, Model: Supra55) with attached energy dispersive spectrograph (Make: Oxford Instruments, Model: X-mas). The micro structure analyses by optical microscope (Make: Leica DFC295). An optical surface profilometer (Make: Veeco, Model: NT9080) was used to measure the surface roughness of the samples. The micro-hardness (Make: UHL, Model: VMH 002), compression test (Make: Biss, Model: Makron UTS-02-0010) were used to analyze the mechanical properties of the samples. The X-ray diffractor (Make: Rigaku Model: Smart lab Automated Multipurpose) were used for crystal structure studies. Differential scanning calorimetry (Make: Netzsch, Model: DSC 214) was used for studying the phase transformation properties and the shape memory properties of the samples were investigated using the dynamic mechanical analyzer (Make: Netzsch, Model: DMA 242E).
Results and discussion
Surface morphology
The deposition efficiency of the samples were almost same for both samples above 95%. The cross section of the samples before and after annealing are as shown in Figure 7. The as deposited Ni and Cu rich samples show the powders to be completely deformed in the course of CS. The kinetic energy attained by the powders as they flow through the spray nozzle, assists the deformation of the powders when they collide on each other with mild frictional effect leading to the bonding. 8 However, small pores were visible on both samples, though this may be due to the removal of small powder particles during mechanical polishing process. An adiabatic heating is induced by the plastic dissipation energy and frictional dissipation energy of the powder particles and substrate material. The stored elastic strain energy is recovered in the form of rebound energy that assists the bonding of the powder particles with the substrate. 8 The amount of rebound energy is totally dependent on the elastic modulus of the chosen powder particles and the substrate material. The interface between the powder and the substrate shows efficient bonding with no cracks or pores in the current work. In the case of Cu rich sample in the as deposited state the interface is almost straight indicating the soft nature of copper, whereas in Ni rich sample it is observed that the powders have impinged themselves on the surface of the substrate forming an irregular intermediate line. Ni is harder in nature than Cu, hence nickel has the ability to impinge on the surface of the substrate. After annealing, the presence of mild pores thought the sample is observed for both of the Ni and Cu rich samples, which are more prevalent in the Ni rich samples. The formed porosity may be attributed to the amount of gas entraped inside the powder during manufacturing.
The Figure 6 shows the SEM images of free surface of all three CuAlNi samples taken for study after thermal quenching, in order to get a clear idea about the surface nature of the fabricated samples with the commercially available CuAlNi. The surface roughness of the CS samples are expected to be low comparing the commercial sample from the physical observations. From Figure 6(a) and (c) for Ni rich and commercial samples aluminium precipitates were clearly visible on the surface. Al precipitates can be clearly identified by the glowing nature. In Figure 6(b) for Cu rich samples almost negligible amount of Al precipitates were present. Electron dispersive spectroscopy (EDS) was performed to investigate the percentage of elements in the alloy after development. Table 2 presents the EDS results obtained in parallel to the SEM analysis.
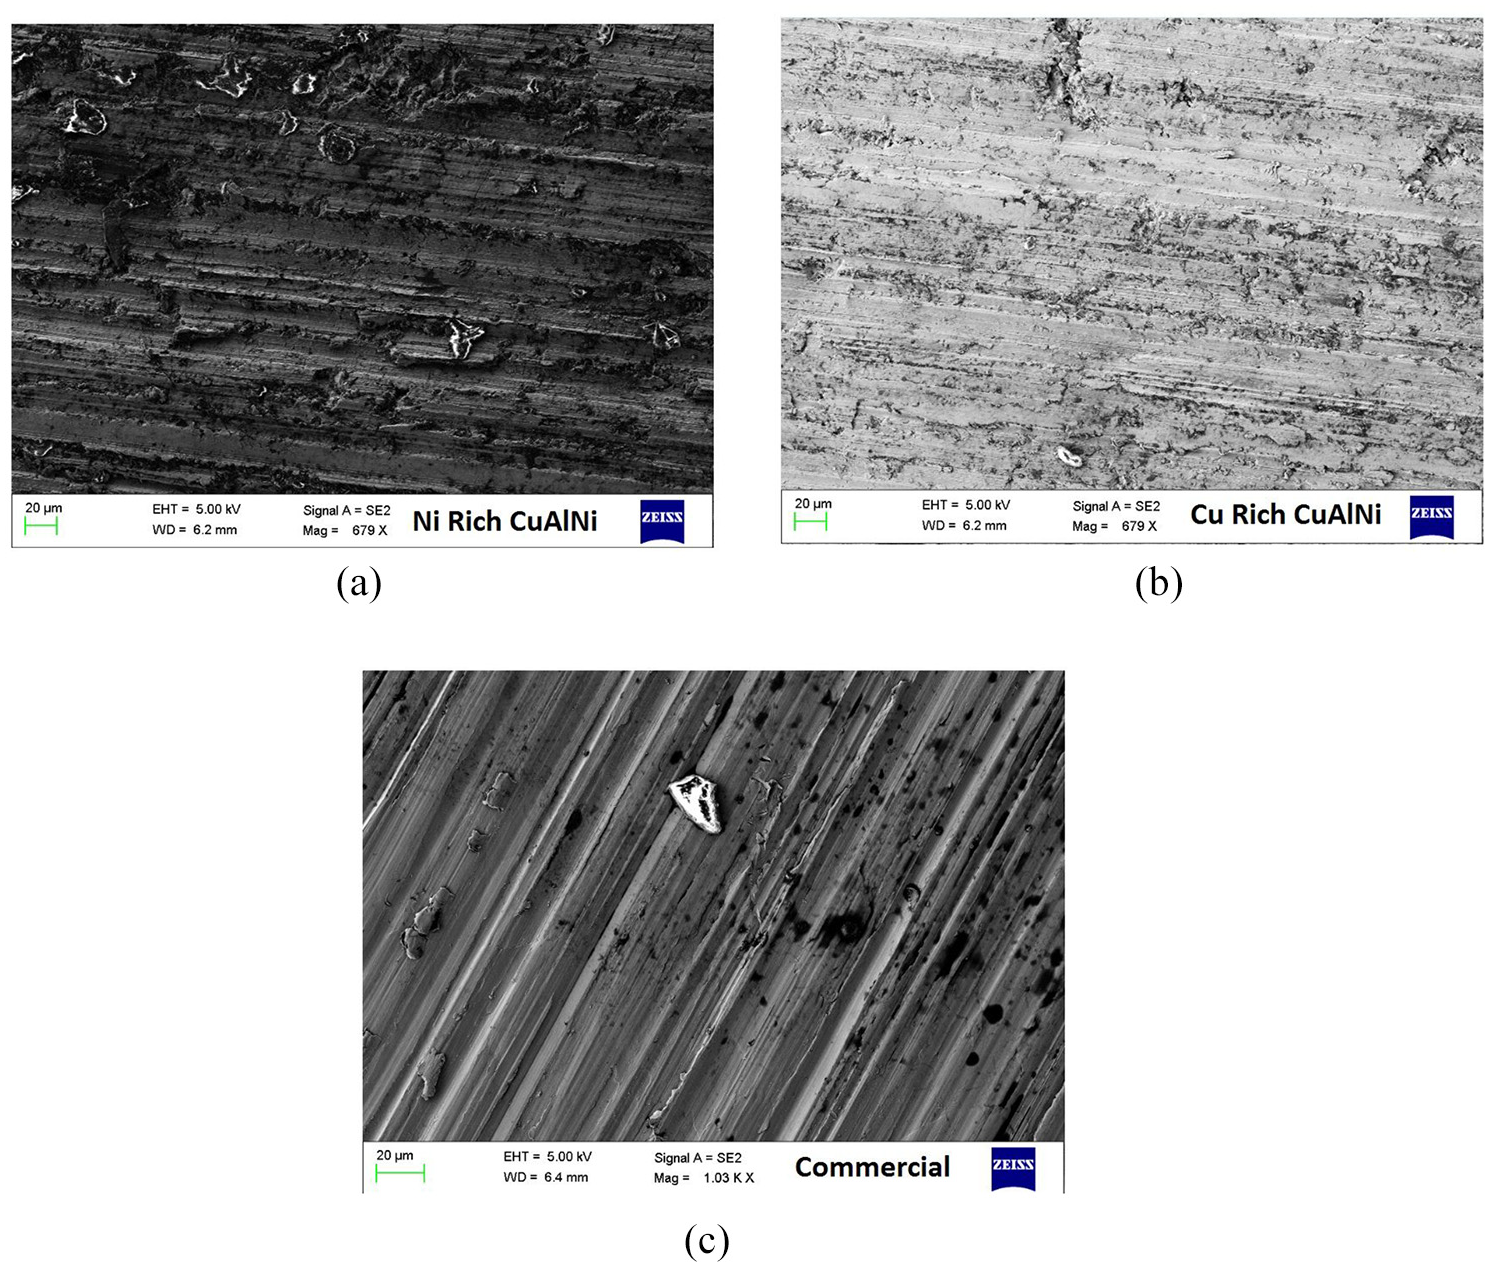
SEM images of (a) Ni rich, (b) Cu rich, and (c) Commercial CuAlNi samples.
EDS results of CuAlNi samples developed by CS and commercial samples.
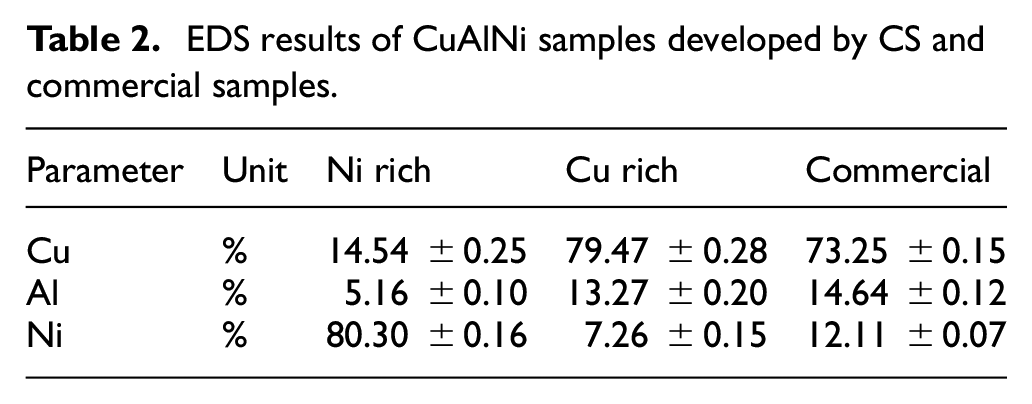
The EDS results reveal almost the same composition of the alloy before and after thermal quenching, along with the presence of negligible amounts of oxygen which may be attributed to the small amount of oxygen in the powder oxide layers. This presence of oxygen boosts the accumulation of Al in the grain boundary, of the alloy which sequentially leads to the formation of aluminum precipitates which were clearly visible in the SEM images of all three samples and this can be attributed to the nature of Al to have maximum affinity toward oxygen compared with remaining elements of Cu and Ni. 11 The surface roughness of the developed samples were measured using optical profilometer and the readings show Ni rich sample having a surface roughness of 6.57 ± .17 µm, Cu rich sample having 4.79 ± .33 µm and commercial CuAlNi having 5.42 ± .21 µm. The presence of Cu assists for the smoothest surface for Cu rich sample.
Figure 7 shows an equiaxed grain microstructure in both the Ni and Cu rich samples, confirming the occurrence of recrystallization by the effect of annealing. The grain size of the fabricated Cu rich and Ni rich samples appears to be much smaller than the commercial sample, potentially indicating the suppression of the grain growth during recrystallization. It is possible that the presence of Al precipitates in the alloy, visible in the SEM results, prevent the grain boundaries from extending further during annealing, inhibiting plastic deformation of recrystallized alloys, leading to a small grain sizes than the actual grain size of the powder particles being used. The presence of Al precipitates were visible in SEM results as well. In case of Ni rich sample the grain size has drastically reduced to fine dendtrical nature. The dendtrical grain structure is an indication of high brittleness in the samples. The enhancement of grain boundary strength and higher cooling rate of the samples after thermal quenching can be attributed to the formation of dendritic structures. The Cu rich sample has the maximum grain size and minimum grain boundary area. The stress concentration on the grain boundary also becomes very less completely reducing the pinning effect, due to small grain boundary area which assists the growth and recovery of martensite phase to provide super elasticity in the samples. The presence of Ni in CuAlNi suppresses the mixture of Cu and Al. As an effect of that the eutectoid precipitation and eutectoid transformation is not possible. 5 The Figure 7(a) and (b) show a clearly the presence of γ2 (Cu9Al4) precipitates which forms in sample during the evolution of γ1 martensite phase. Figure 7(c) shows bulk grain structure of commercial CuAlNi.

Microstructure of (a) Ni rich, (b) Cu rich, and (c) Commercial CuAlNi samples.
Mechanical properties
The micro-hardness measurements were carried out at an incremental distance of 25 mm at load of 500 g and are as shown in Figure 8. The Ni rich sample has the maximum value of 423 ± 7 VHN, the commercial sample has a hardness value of 388 ± 2 VHN, and the Cu rich sample has the lowest hardness value of 356 ± 3 VHN, due to the high proportion of ductile copper. Also the absence of phases like γ1 and γ2 (from the results of microstructure) can be attributed to the decrease of micro-hardness value. The Ni rich sample has the maximum hardness and hence the sample is expected to be brittle in nature. As seen earlier in microstructure of Ni rich showed the presence of γ2 phase, which in general increases the hardness in the sample. 9 Likewise the commercial sample also had the presence of γ1 phase that plays a key role in the increase of the micro-hardness values. The obtained micro-hardness results are in good alignment with the microstructure results discussed earlier. The small standard deviation marked as error bar on the graph also indicates the homogeneity in deposition of samples. In that accord the Cu rich sample is at par with the commercially available CuAlNi sample.
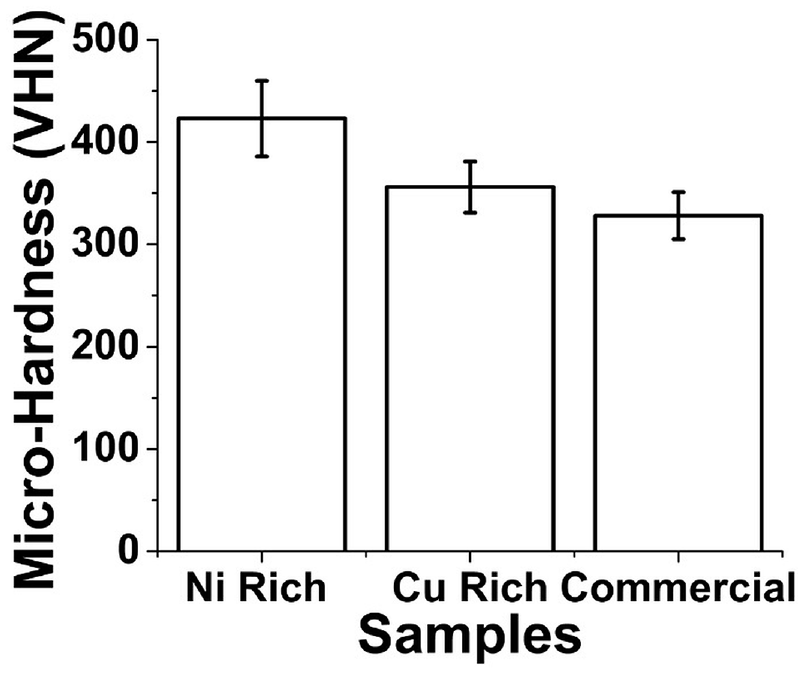
Micro-hardness results of Ni rich, Cu rich, and Commercial CuAlNi samples.
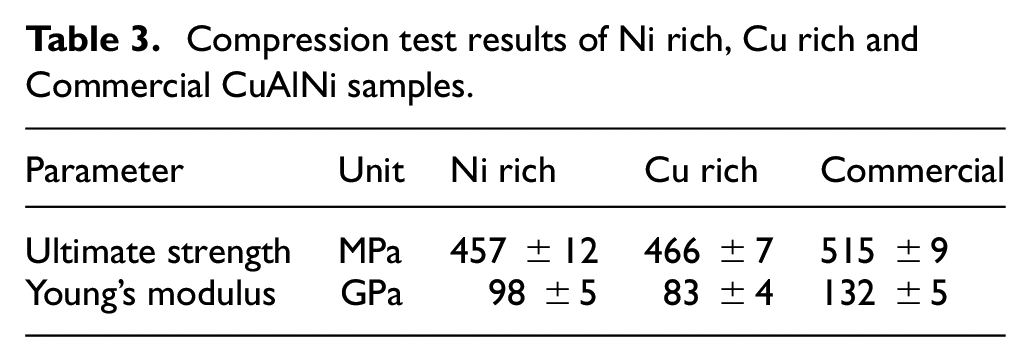
The Figure 9 shows the stress strain graph of the Ni rich, Cu rich CuAlNi samples developed by CS and commercially available CuAlNi samples generated from the compression test. In all the graphs the martensite orientation plateau (Mp) are clearly visible. Mp is formed by the effect of transition stress in the samples which acts as a driving force for the phase transformation. The gradual growth of martensite orientation in the graph by the effect of transition stress leads to the ultimate strength of the samples in the graph. From the slope before the Mp level can be used to calculate the young’s modulus of the samples which exhibits the ductility in the samples. The ultimate strength and young’s modulus of the samples are as quoted in Table 3. The Ni rich sample has the least amount of ultimate strength, which may be attributed to the presence of γ2 phases. γ2 phase makes the sample more brittle but increases the elastic modulus. The results align close to the reported results published previously as well. 9 Hence the elastic modulus of Cu rich sample has decreased by the absence of γ1 and γ2 phases and increased weight percentage of Cu in the sample, boosts the ultimate strength of the sample to the maximum level. The absence of γ1 and γ2 phases in the alloys give low micro-hardness and low elastic modulus values. In case of the commercially available CuAlNi alloy the presence of γ1 phase assisted in the higher young’s modulus value and the brittle nature of the γ1 phase, pulls down the ultimate strength of the sample by inducing brittleness.
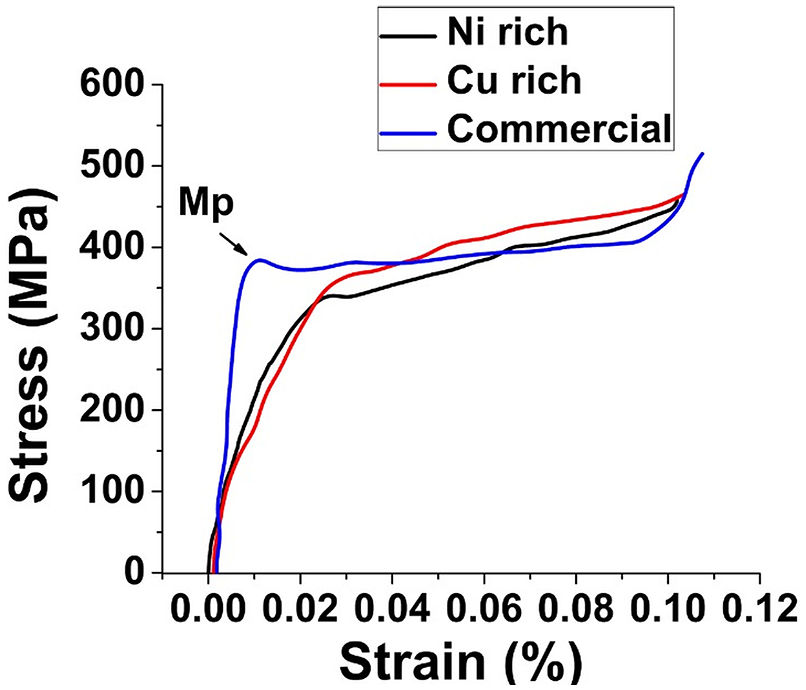
Stress strain graph of Ni rich, Cu rich and commercial CuAlNi samples.
Compression test results of Ni rich, Cu rich and Commercial CuAlNi samples.
Crystalline properties
The Figure 10 shows the XRD results of the samples. The crystal structure of CuAlNi SMA have β1, α, and γ2 phases. The Cu rich CuAlNi sample possess a martensite transformation of β1 (DO3) to γ′1(2H). This transformation is accompanied by lots of γ2 phase. But for Ni rich sample the higher cooling rates suppresses the formation of γ2 phase. The microstructure of Ni rich sample also shows the presence of very less amount of γ2 phase. The Ni rich sample did not have visible peaks of γ2 phase in the graph, whereas Cu rich had γ2 phase at 2θ = 25°86 ± 0.2′ and commercial samples had γ2 phase peaks at 2θ = 27°16 ± 0.1′, 66°27 ± 0.2′. As the temperature increases the evolution becomes β1 >> β′1 ± γ2 >> β′1. As the thermal quenching increases above 200°C, the evolution of martensite phase evolves to β′1 ± γ2 >> α. As a result both Cu rich and Ni rich samples had several α phase. The α phase peaks were clearly visible at 2θ = 43°27 ± 0.1′, 49°92 ± 0.4′, and 73°68 ± 0.1′ for Ni rich and commercial CulAlNi samples. The Cu rich CuAlNi sample had the same peaks with a mild peak shift toward higher 2θ degrees values at 2θ = 44°87 ± 0.2′, 51°38 ± 0.1′, and 73°68 ± 0.1′. The peak shift toward the higher 2θ values indicate the presence of strain (compressive nature) in the lattice structure by the effect of thermal quenching. 12 Ni rich and Commercial CuAlNi samples have secondary intermetallic phases of γ2 ± AlNi at 2θ = 43°33 ± 0.1′ and 43°41 ± 0.1′, respectively. The reason for the formation of intermetallic phases can be attributed to the in ability of Al to diffuse with Ni in the samples freely as reported by researchers in the past. 13 The β′1 phase was not visible for all three samples. Though β′1 phase formation requires lesser driving force for nucleation than γ2. 14
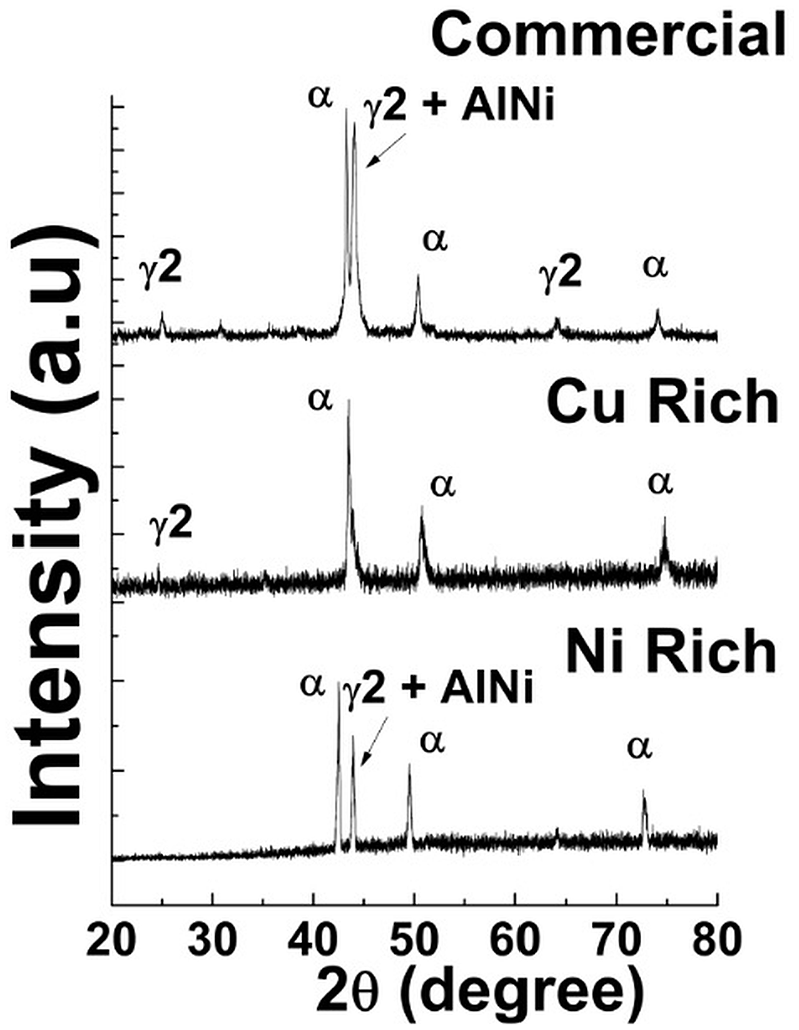
XRD graph of Cu rich, Ni rich, and commercially available CuAlNi samples.
Phase transformation Properties
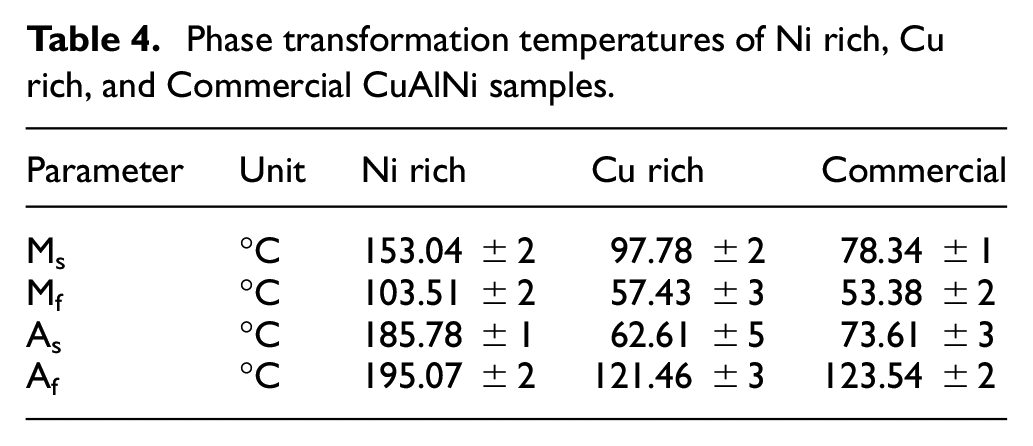
The Figure 11 shows the DSC graph of the CuAlNi SMA samples. All three samples had visible transformation peaks in both heating and cooling cycles. From the peaks the martensite start (Ms), martensite finish (Mf) temperatures and likewise austenite start (As) and austenite finish (Af) temperatures can be precisely determined. The determined results are as shown in Table 4. In Figure 11(a) Ni rich sample had Al percentage very low, that resulted in the raise of Ms temperature. 5 In Figure 11(b) and (c) the Cu rich sample and commercial sample had very less Ms temperatures comparing to the Ni rich sample. The obtained results co relate with the EDS results reported before. The EDS results show the presence of Al percentage in the sample to be around 13. When the percentage of Al in CuAlNi is around 13, the Ms temperature falls down as reported by the researchers in the past. 5 The earlier reports suggest very less possibilities of phase transformation ability in CuAlNi SMA having Ni more than 4 percentage in the total composition. 9 But the compositions are not the only parameter to determine the phase transformation ability of the sample, also the thermal treatment history of the samples are to be considered. Also the published reports have not explored bulk CuAlNi SMA samples. The commercial CuAlNi sample have pointed phase transformation peaks with less width, which clearly indicates the presence of very less residual stress in the samples. Also the peaks of both heating and cooling cycles appear very close to each other indicating very less amount of hysteresis generated during phase transformation peaks. The phase transformation ability in the samples confirm the presence of basic requirement for shape memory effect (SME). In order to investigate the shape memory effect in the samples dynamic mechanical analyzer (DMA) has been deployed and the results are discussed in detail ahead.
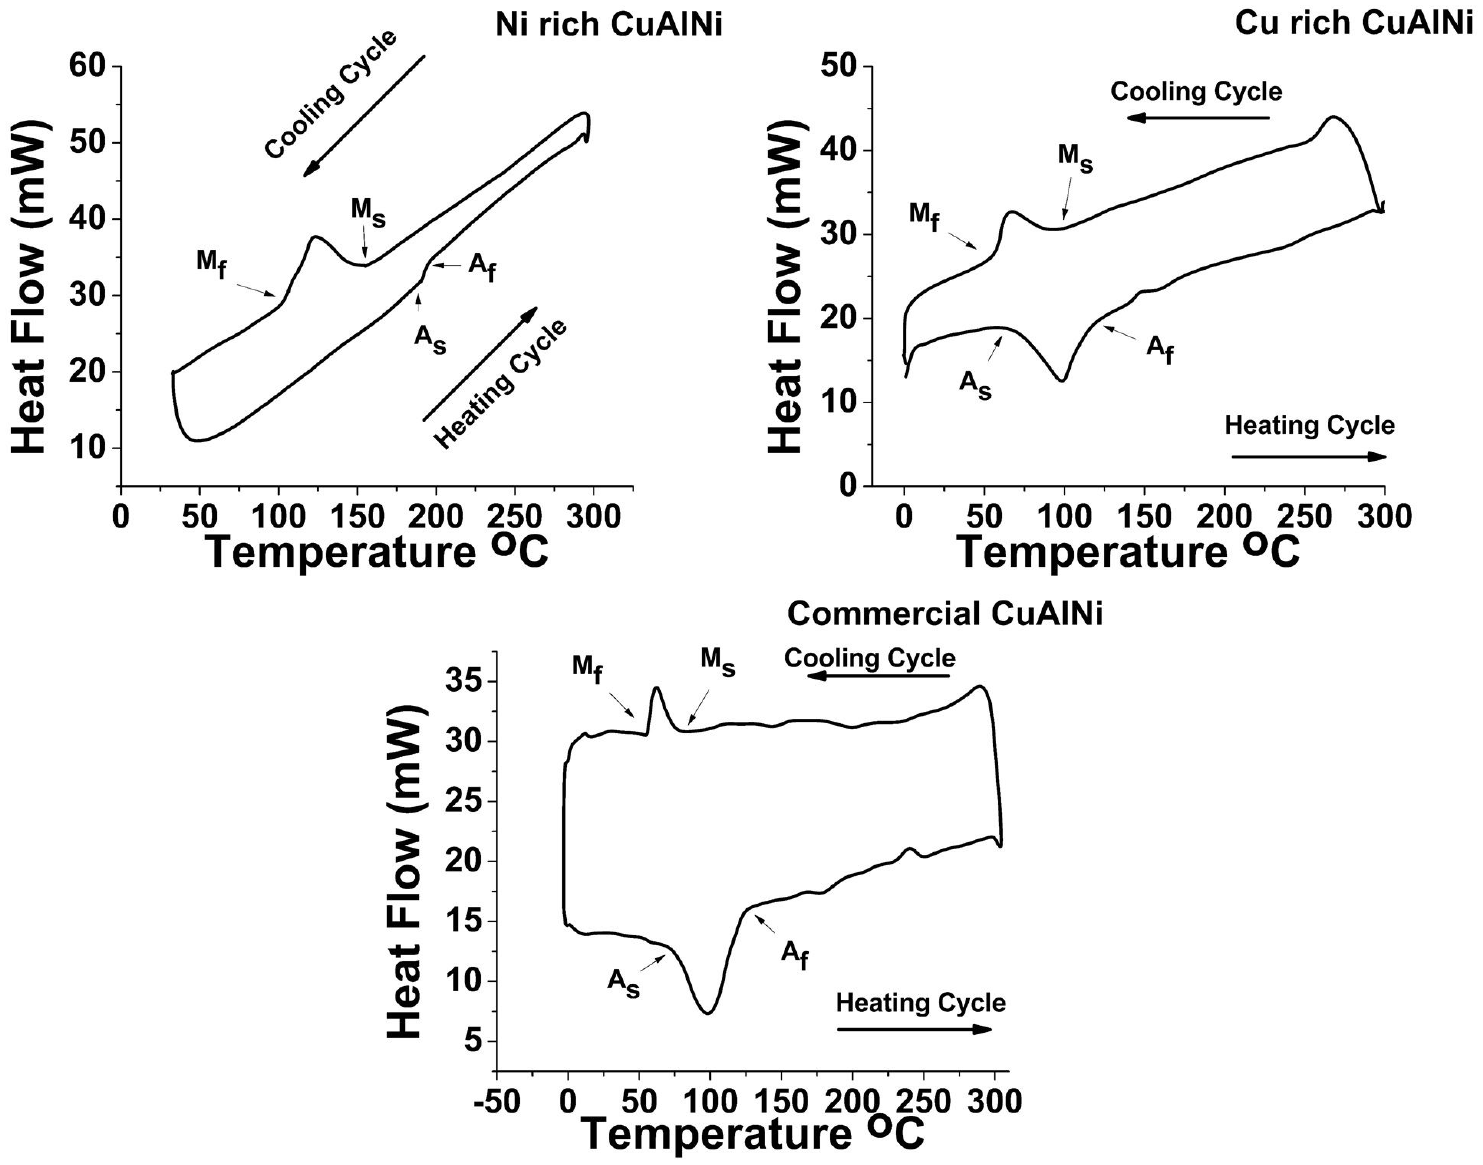
DSC graph of Cu rich, Ni rich, and commercially available CuAlNi samples.
Phase transformation temperatures of Ni rich, Cu rich, and Commercial CuAlNi samples.
Shape memory properties
Figure 12 shows the DMA results of Cu rich, Ni rich, and commercial CuAlNi SMA. The DMA can by described as applying an oscillating force and analyzing the material’s reaction. As the force is applied a heating and cooling cycle is performed and a graph is plotted between the storage modulus (GPa) and temperature (°C). The samples were chosen at a dimension of 40 × 10 × 3 mm and minimum force of 2 N was applied under the frequency of 1 Hz. The Figure 12(a) shows Ni rich CuAlNi sample showed presence of no SME. Neither heating nor the cooling curve was able to display the phase transformation peaks. Cu rich CuAlNi sample in Figure 12(b) shows good SME. In both heating and cooling curve the presence of Ms = 127 ± 7°C, Mf = 54°C ± 6, As = 43 ± 5°C and Af 122 ± 7°C were clearly visible. The results of Cu rich CuAlNi sample co relates with the DSC results in the previous section. The Figure 12(c) results show commercial sample to have the maximum shape memory effect with good ductility. The obtained Ms = 74 ± 5°C, Mf = 70 ± 5°C, As = 76 ± 8°C and Af 129 ± 7°C were observed.
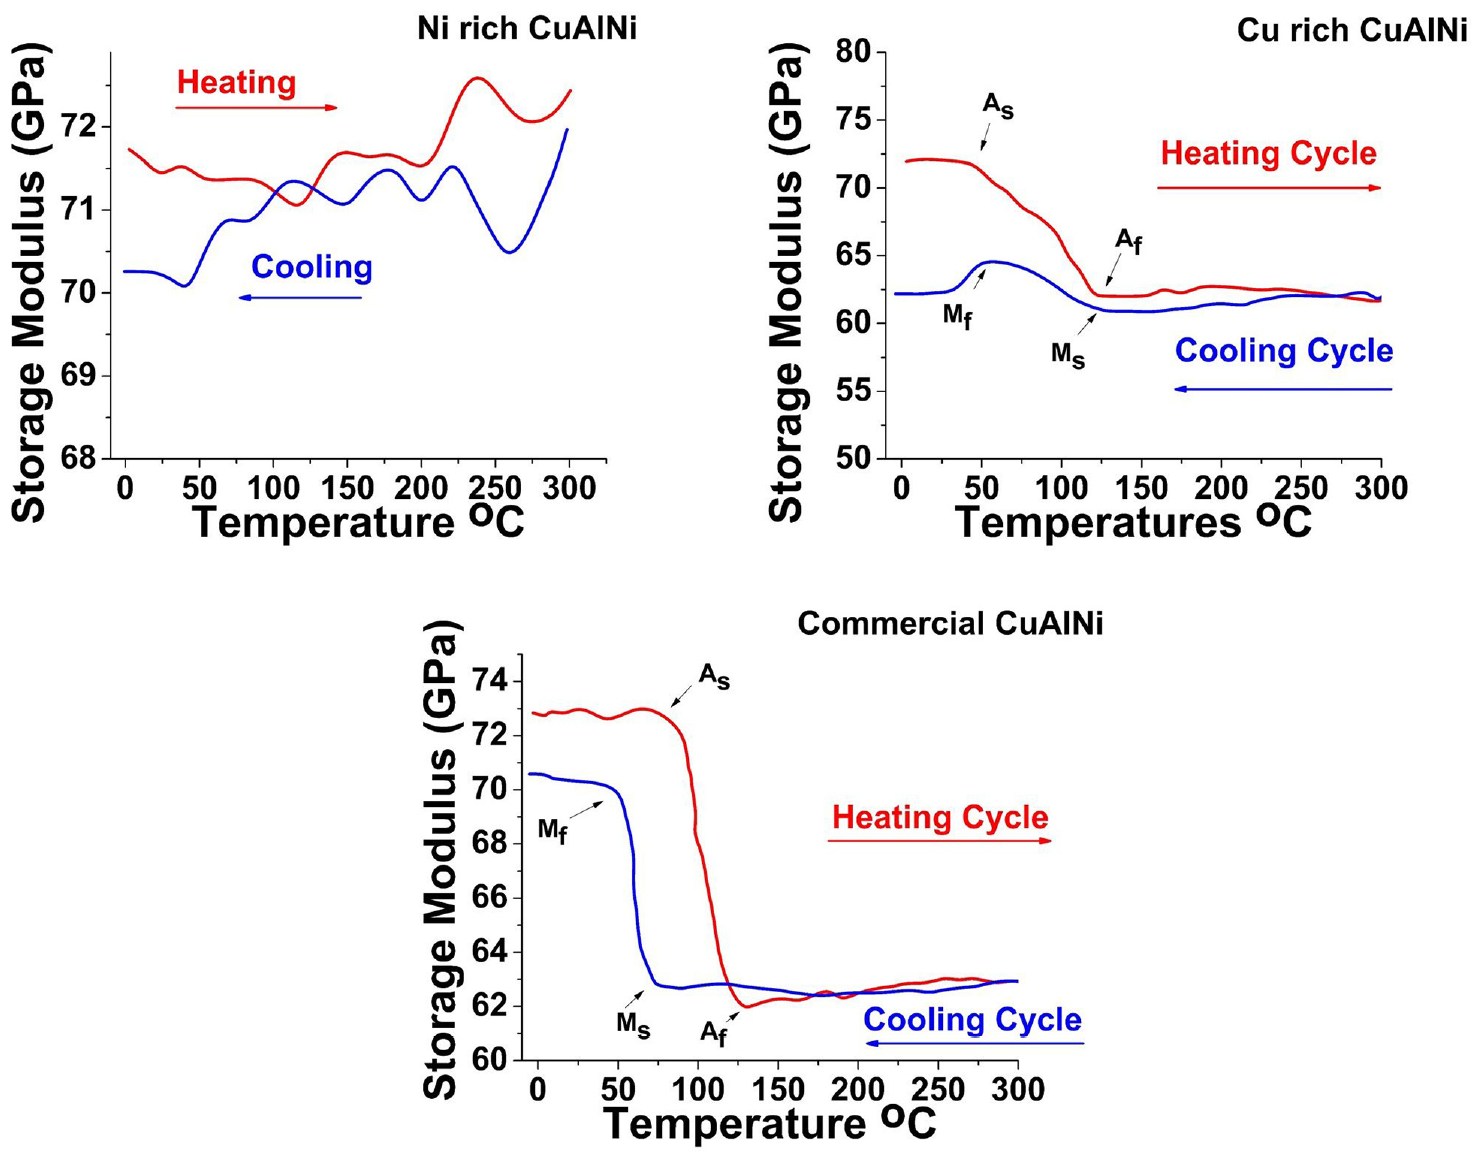
DMA graph of Cu rich, Ni rich, and commercially available CuAlNi samples.
Conclusion
In the current work, two different compositions of CuAlNi SMA structures were deposited by CS and alloyed by post annealing. The properties of the developed samples were compared with a commercial CuAlNi sample developed by conventional methods. The optimized values were implemented in the final deposition process out of which efficient deposition was achieved. The investigations revealed CS to be a novel methodology for developing bulk CuAlNi SMA. SEM revealed the presence of Al precipitates on the surface of all samples, which played a crucial role in the formation of fine microstructures with small grain size. The Ni rich sample had the maximum micro-hardness value where Cu rich sample showed the maximum young’s modulus value in the mechanical properties characterization. XRD results showed the presence of γ2 ± AlNi peaks in Ni rich and commercial samples. DSC graphs revealed the Ni and Cu rich samples have very good phase transformation characteristics as well. In the DMA test the Cu rich CuAlNi was able to exhibit good shape memory effects on the application of 2 N load under the frequency of 1Hz. The phase transformation results of Cu rich sample was at par with the commercially available bulk CuAlNi sample.
Footnotes
Acknowledgements
The authors would like to thank Royal Academy of Engineering (RAE), London for assisting the experimentations carried out at Institute For Manufacturing (IFM), University of Cambridge, UK, under the Newton Bhabha Project (Project No.: HEPI\1516\10). Thanks are also due to Sophisticated Instrument Centre (SIC) at Indian Institute of Technology Indore, India, for providing us the required characterization facility.
Declaration of conflicting interests
The author(s) declared no potential conflicts of interest with respect to the research, authorship, and/or publication of this article.
Funding
The author(s) disclosed receipt of the following financial support for the research, authorship, and/or publication of this article: The authors received financial support from Royal Academy of Engineering (RAE), London for conducting the experimentations at Institute For Manufacturing (IFM), University of Cambridge, UK, under the Newton Bhabha Project (Project No.: HEPI\1516\10).