
Abstract
The polyetheretherketone (PEEK) composites are high-performance materials. These composites have potential applications in various structural components. It is necessary to investigate the cutting parameters of PEEK composites. In this article, an attempt is made to investigate the effect of cutting parameters on the cutting force of carbon and glass fiber-doped PEEK and compare it with unreinforced PEEK when cutting with polycrystalline diamond (PCD) or cemented carbide (K15) tools. The results of statistical analyses highlight that each machining force (Fx , Fy , and Fz ) is influenced by the main factors (cutting tools (A), material type (B), feed rate (C), and cutting speed (D)) and some of the interactions (AB, AC, BC, BD, and CD). For the main factors, the material type has a higher effect on Fx and Fy , while Fz is influenced more by feed rate. Cutting tools have no significant effect on Fx and Fy . The regression models used fit 99.56, 92.75, and 90.65% of Fz , Fx , and Fy , respectively. Developed models show that the feed rate has a higher effect on machining force than the cutting speed. The model graphs illustrate that reinforced PEEK has a higher machining force compared with unreinforced PEEK when cutting with PCD or K15. Furthermore, machining with K15 tools increases the cutting force of PEEK-reinforced carbon, while it decreases that of PEEK-reinforced glass and unreinforced PEEK. The investigation of the interaction with the machining force shows that Fx is more influenced by AB, BC, and BD interactions. Fy shows similar results as Fx , but it is also influenced by AC interaction. However, Fz is influenced by all the interactions except BD.
Introduction
Polymeric composites reinforced by carbon fiber (CF) and glass fiber (GF) are widely used in different industrial applications, such as automobiles, aeronautics, biomechanics, robots, and machines. These composites have advantages compared with metals because of their high specific strength, high specific stiffness, lightweight quality, good corrosive resistance, and directional properties. 1–3 Polyetheretherketone (PEEK) is a recent high-performance thermoplastic polymer. This polymer is available in two basic grades: industrial and medical. Industrial grade PEEK has exceptional mechanical properties at elevated temperatures. 4 Low density, high strength and durability, good toughness, and chemical resistance at higher temperatures are some of the important properties of PEEK. 5 The addition of short CF or GF in PEEK greatly improves its mechanical properties. CFs are recognized for their inertness and for forming strong composites. 6 The rival GF owns two phases with quite different mechanical properties. They significantly reduce the expansion rate and increase the flexural modulus of PEEK. 7 This reinforcement CF/GF is excessively abrasive when machined. 2,3 As mentioned above, the machining of fiber-reinforced materials is challenging because of their heterogeneity, material discontinuity, and anisotropic nature. All these parameters affect the surface quality of the workpiece. The successful machining of PEEK composites is related with using appropriate tools and parameters. The following variables should be evaluated for machinability: cutting force, power, specific cutting pressure, tool life, tool wear, and surface roughness. Mata et al. 3 studied the cutting conditions of PEEK composites using polycrystalline diamond (PCD) tools. Their study showed that the machinability of PEEK CF30 and PEEK GF30 composites increase the cost and specific cutting pressure compared with PEEK natural. Silva et al. 2 investigated the machinability of polyamide reinforced with 30% GF with PCD, chemical vapor deposition (CVD) diamond-coated carbide, and plain cemented carbide tools (K15-KF and K15). The best results were obtained by the PCD tool, followed by the uncoated carbide inserts, and, finally, by the CVD diamond-coated carbide tool. Besides, PCD tools had the lowest turning forces compared with its rivals. Davim and Reis 7 carried out a study of machinability on PEEK GF30 composites using both PCD and K20 tools, and they concluded that the PCD tool in terms of surface quality performs better under the same cutting parameters than K20. Another work investigates the CVD diamond-coated carbide cutting tool in the machining of PEEK composites. 8 The tool is evaluated in terms of turning process (cutting forces, power, and specific cutting pressure) and surface roughness (R a) of the workpiece and is then compared with different cutting tools such as PCD and K10. They found that K10 shows higher values of cutting force. Conversely, the CVD diamond-coated carbide tool shows lower values of cutting force due to the effects of a chip breaker, tool geometry, and the microstructure of CVD coatings. Regarding surface roughness, the CVD diamond tool performed better in comparison with K10. Rahman et al. 9 investigated 450CA30 carbon/PEEK (carbon ratio of 30% by volume) machinability. They used uncoated cemented carbide tools for cutting the composite. They concluded that the cutting temperature at the critical cutting speed (70–75 m/min) is in the range of 150–175°C and above the glass transition temperature of PEEK. They realized that these temperatures corresponded with the rubbery/viscous regime. In addition, they specified that tool wear is attributed to the encounters of the tool both in phases of soft matrix and a harder fiber material (carbon), which can be very detrimental to tool life. Davim et al. 10 used the Taguchi method and analysis of variance (ANOVA) to analyze the machinability of unreinforced PEEK and reinforced PEEK (GF30). They found that the cutting velocity factor is significant on the cutting force obtained for both materials. They also observed the effect of feed rate and velocity on surface roughness (R a). Statistically, the effect of feed rate is equal to the surface roughness of both materials. Another study on surface roughness in the turning of PEEK composites shows that, statistically, feed rate has a strong influence on surface roughness, while cutting speed has a secondary effect. They also observed that the presence of GF increases roughness compared with CFs in PEEK. 11 The optimization of the surface roughness of propoxylated bisphenol-A fumarate polyester matrix reinforced with 65% of GF when cutting with diamond-cutting tools (DCMW 04-PCD) is studied. According to the results, the surface roughness (R a and R t/R max) increased with the feed rate and decreased with the cutting velocity. 12 Wang and Zhang 13 demonstrated that fiber orientation and rake angle affect surface roughness and cutting forces. They indicated that 90° is a critical angle. If the fibers are oriented to a smaller angle, surface roughness and subsurface damages are small. On the contrary (if the critical angle >90°), surface roughness increases sharply. Regarding the cutting forces, at a low-depth cut, a rake angle between 0 and 20° results in small cutting forces. At a higher depth cut of 50 and 100 µm, the horizontal force continuously increases until θ = 120°. Also, it was confirmed by the study of the cutting model of PEEK composites that CFs apply greater values of cutting force compared with unreinforced PEEK. 14 There are many works performed on PEEK and PEEK composites, especially in order to find the effect of cutting parameters on surface roughness and the orientation of fibers on machining force. However, it is obvious that there is no work showing which cutting parameters should be selected for machining PEEK and PEEK composites. In addition, especially for the industries involved in the manufacturing of composites, selecting better cutting parameters for machining PEEK and PEEK composites is necessary. This article serves to fill in the missing part. The objective of this work involves selecting better cutting parameters when machining PEEK and PEEK composites with tools like PCD and K15. For this purpose, the influence of the effects of tools and materials and the cutting speed and feed rate on machining force (F x, F y, and F z) during the machining of unreinforced and reinforced PEEK with CF and GF with PCD and K15 tools were analyzed statistically. Also, the main and interactive effects of cutting parameters were evaluated, and models were developed.
Materials and methods
Experimental design
The work material used for the machining tests, that is, unreinforced PEEK, reinforced PEEK with 30% of CFs and 30% of GFs are supplied by ERTA®(Spain). The experiments were carried out in extruded workpieces with a diameter of 50 mm and a length of 100 mm, using a PCD insert tool (DCMW 11T3 04FPDC10) and K15 tool (DCMW 11T304H13A). A tool holder of type SDJCL 2020 K11 was used. The tool geometry was as follows: rake angle 7°, clearance angle 0°, cutting edge angle 93°, and cutting edge inclination angle 0°. The mechanical and thermal properties of work materials are summarized by Mata et al. 3
A general full factorial design was carried out to study the following: the effects and the interactions of independent variables; cutting tools at two levels, material type at three levels, and main cutting conditions, such as cutting speed (V c; in millimeter per minute) and feed rate (f; in millimeter per revolutions), at three and four levels, respectively, of dependent variables; machining forces F x, F y, and F z during the turning process. F x, F y, and F z means, in order, feed force (Ff), radial force (Fr), and cutting force (Fc), respectively. For each factor, a letter was assigned to simplify understanding. A, B, C, and D were attributed to cutting tools, material type, feed rate, and cutting speed, respectively. Also, the interactions were presented as AB, BC, and CD. In addition, mathematical models relating to these variables were developed. A full factorial design is one of the often used types of experiments involving the study of the effects of two or more factors that each has a different number of levels. Also, Montgomery 15 specified that to construct an approximation model that can capture interactions between n design variables, a full factorial approach may be necessary to investigate all possible combinations. For these reasons, it was supposed that the methodology of full factorial design was suitable for us. Table 1 indicates the factors to be studied and the corresponding levels. The selection of machining conditions was made according to the recommendations of cutting tool manufacturer, literature reviews, and parameters used in industries such as construction, aerospace, and so on. A completely randomized design technique was used against lurking nuisance factors.
Factors and levels of factors.
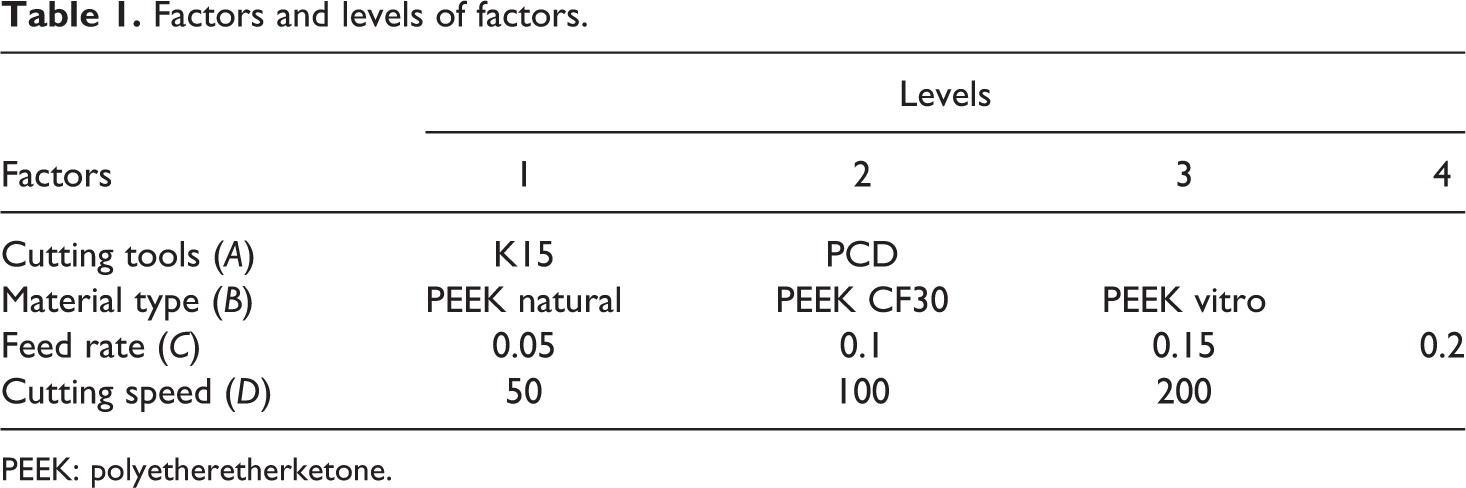
PEEK: polyetheretherketone.
The experimental setup is given by Mata et al. 3 The collected data were analyzed using ANOVA with a level of significance of 5% (i.e. for a level of confidence of 95%). Before concluding with the results from ANOVA, regression models were adopted and the adequacy of the underlying model was checked in order to verify the underlying assumptions of normality, homogeneity of variance, and independence. As a diagnostic tool, a residual (error) analysis was used, which computes the difference between the observed value (obtained from experiment) and the predicted or fitted value. Design-Expert 8.0 software (trial version; Stat-Ease, Inc., Minneapolis, Minnesota, USA) was used for all the statistical analyses and tests.
Results and discussion
Statistical analysis
Based on the regression coefficient (r 2 ), adjusted regression coefficient (adj. r 2 ), and predicted residual sum of square (PRESS), a two-factor interaction model (2FI) was chosen for F x and F y, and a quadratic model was chosen for F z responses that best fit data. Also, the 2FI and quadratic models were found to be significant at 5%, which indicates that terms in the models have significant effects on the responses. Hence, these two models were considered for further analyses.
In order to ensure a good model, a test for significance of the regression model and a test for significance on individual model coefficients must be performed. An ANOVA table is commonly used to summarize the test performed. 16 Table 2 shows ANOVA results for a response surface reduced 2FI model for machining force F x. In this model, the terms that were not significant were dropped from the equation, leaving only the significant terms. As shown, this reduced model contains only the main effects of cutting tools, material type, feed rate, cutting speed, and the interaction effects of cutting tools–material type (AB), material type–feed rate (BC), and material type–cutting speed (BD). These terms, except for the main effects of cutting tools, were to be statistically significant on machining force F x (p = 0.0001 < p = 0.05). Based on the results of Davim et al., 10 the cutting speed and feed rate were statistically significant on the cutting force. Although the main effects of cutting tools were not significant at about the 5% level because of the hierarchy principle, this term was not removed from the model. Material type had the strongest effect on the variation of F x forces, followed by feed rate ( f ). The model was found to be significant with an F value of 69.74 (p = 0.0001 < p = 0.05). There is only 0.01% chance that a “model F value” with large value could occur due to noise. Interactions of cutting tools–feed rate (AC), cutting tools–cutting speed (AD), and feed rate–cutting speed (CD) were found to be insignificant on F x.
ANOVA for response surface 2FI model for machining force F x.
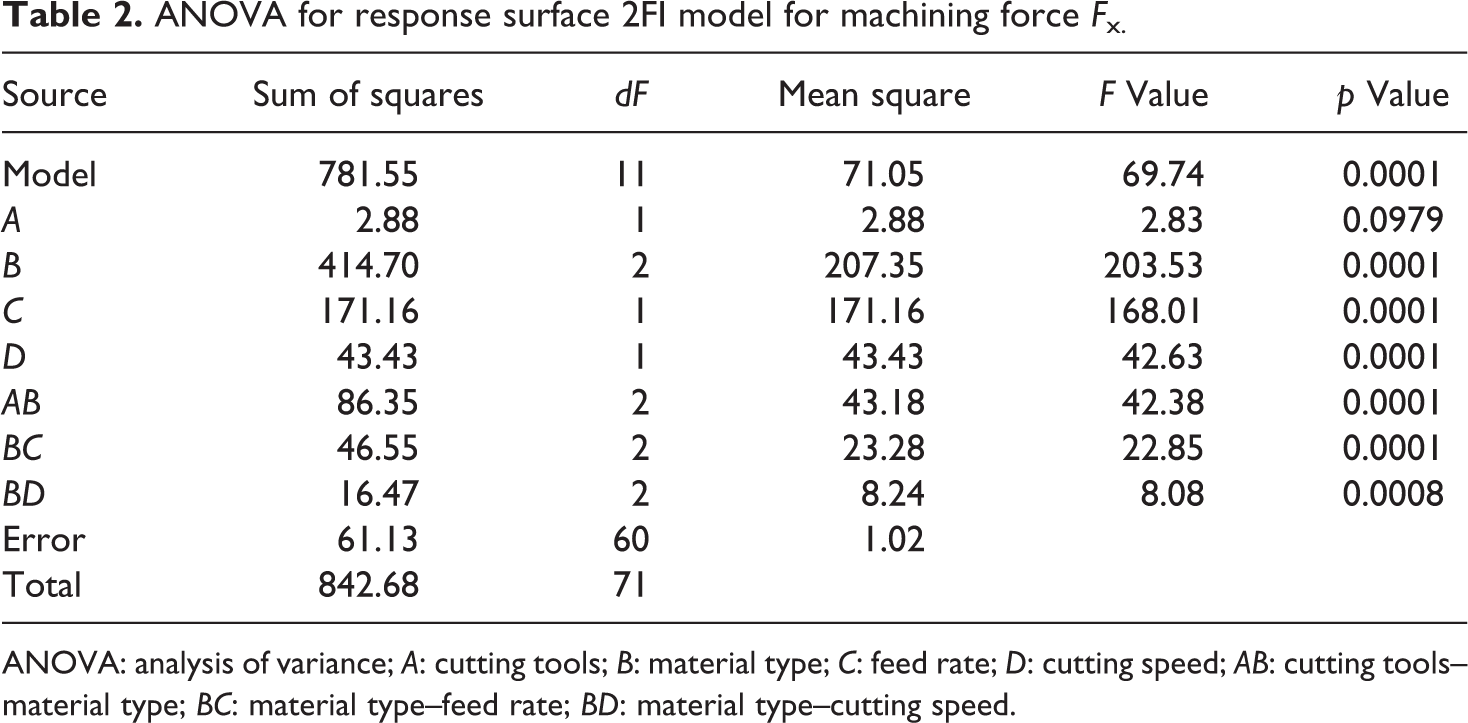
ANOVA: analysis of variance; A: cutting tools; B: material type; C: feed rate; D: cutting speed; AB: cutting tools–material type; BC: material type–feed rate; BD: material type–cutting speed.
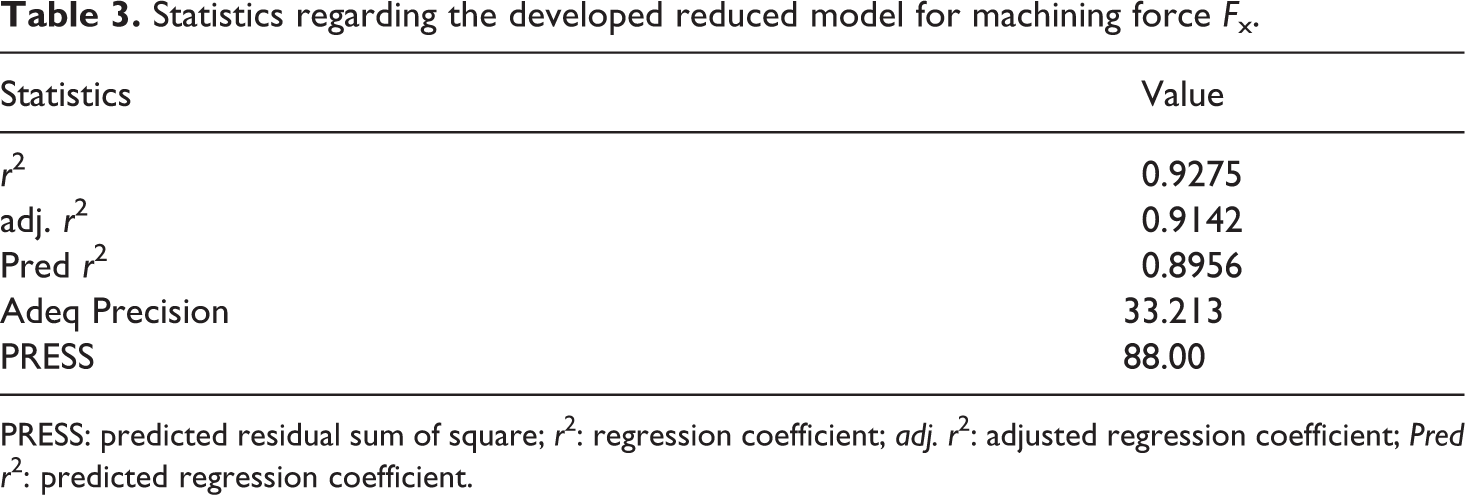
Some statistics regarding the developed reduced interaction model for F x are given in Table 3. The value of r 2 coefficient 0.9275 means 92.75% of the total variation in F x explained by this model include these terms. This value is reasonably high and close to 1, which indicates that adequate fitting of the two-factor interaction model. The “Pred r 2 ” of 0.8956 is in reasonable agreement with the “adj. r 2 ” of 0.9142. “Adeq Precision” measures the signal-to-noise ratio as 33.213 greater than 4, which indicates an adequate signal. This model can be used to navigate the design space.
Statistics regarding the developed reduced model for machining force F x.
Reduced regression models (equations) for F x in terms of actual factors are given in Table 4. Because cutting tools and material type are qualitative factors, there is an equation for predicted F x as the function of feed rate and cutting speed for each cutting tool and material type. Results of equations indicate that the effect of feed rate is more significant than that of cutting speed. Moreover, cutting speed had a negative effect on cutting force F x. Also, when feed rate is constant and cutting speed increases, cutting force F x decreases for each cutting tool and material type. The effects of feed rate and cutting speed on F x are equal on the same material type for PCD and K15 tools.
Final equation in terms of actual factors for F x.
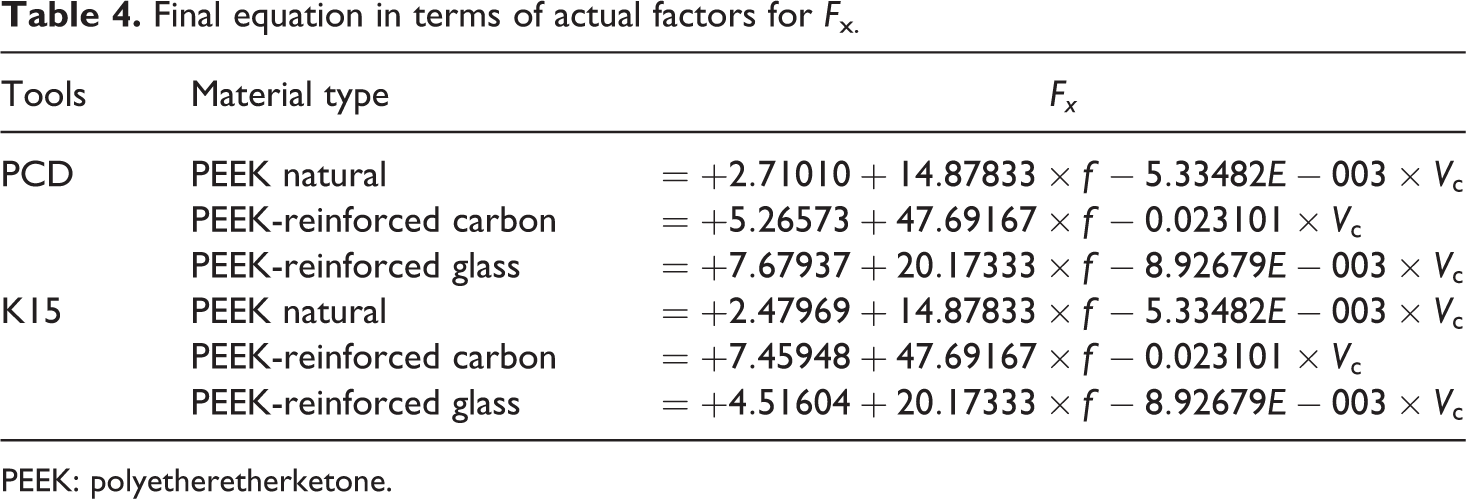
PEEK: polyetheretherketone.
Table 5 shows ANOVA results for response surface-reduced 2FI model for machining force F y. Like the ANOVA results of machining force F x, this reduced model contains the main effects of cutting tools, material type, feed rate, cutting speed, and the interaction effects of cutting tools–material type (AB), material type–feed rate (BC), and material type–cutting speed (BD). But compared with F x in this model, the cutting tools–feed rate (AC) interaction was also added to the model. These terms, except the main effects of cutting tools, were to be statistically significant in machining force F y (p = 0.0001 < p = 0.05). Based on the hierarchy principle, the cutting tools term was not removed from the model. Like F x, material type also had the strongest effect on changing F y forces, and the feed rate followed this. The model was found to be significant with an F value of 65.66 (p = 0.0001 < p = 0.05).
ANOVA results for response surface 2FI model for machining force F y.
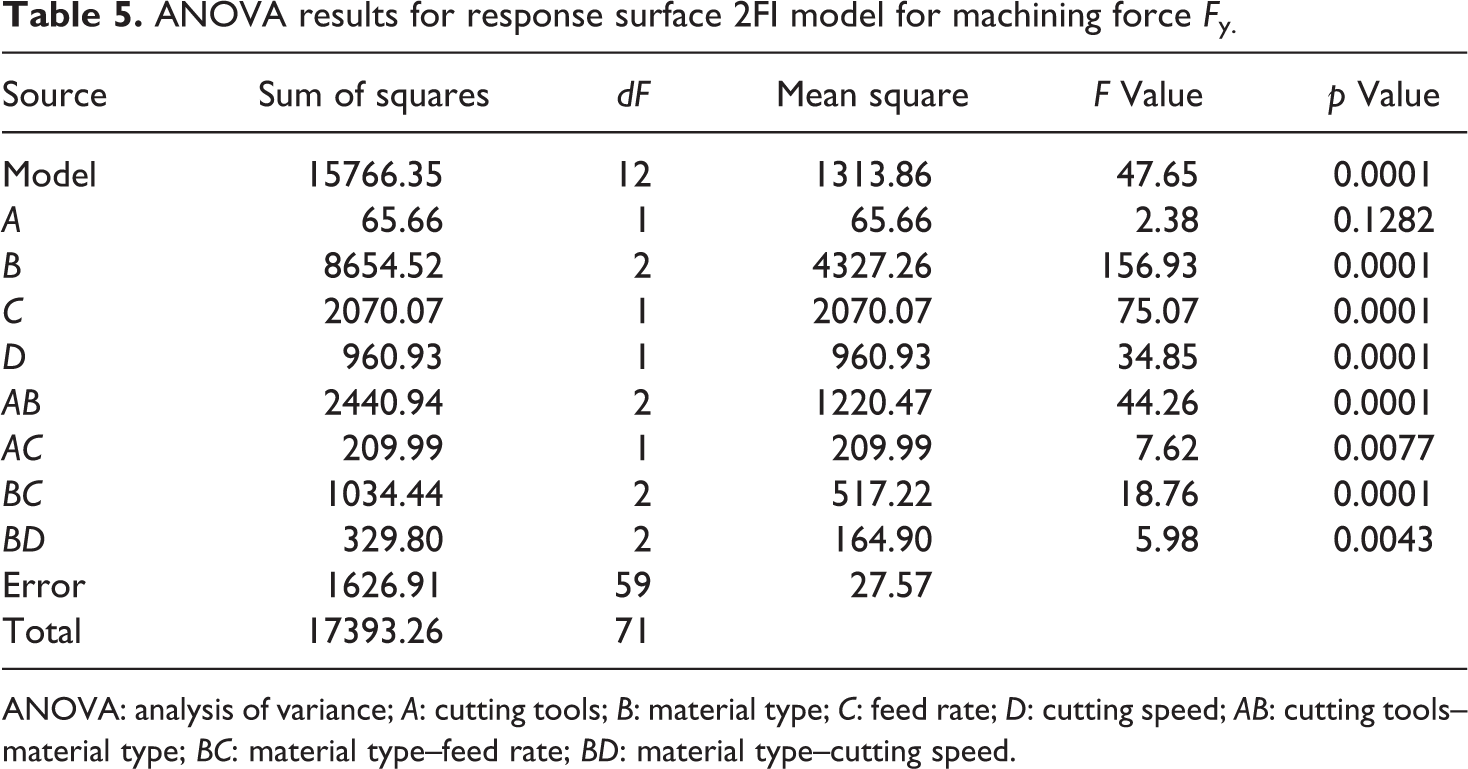
ANOVA: analysis of variance; A: cutting tools; B: material type; C: feed rate; D: cutting speed; AB: cutting tools–material type; BC: material type–feed rate; BD: material type–cutting speed.
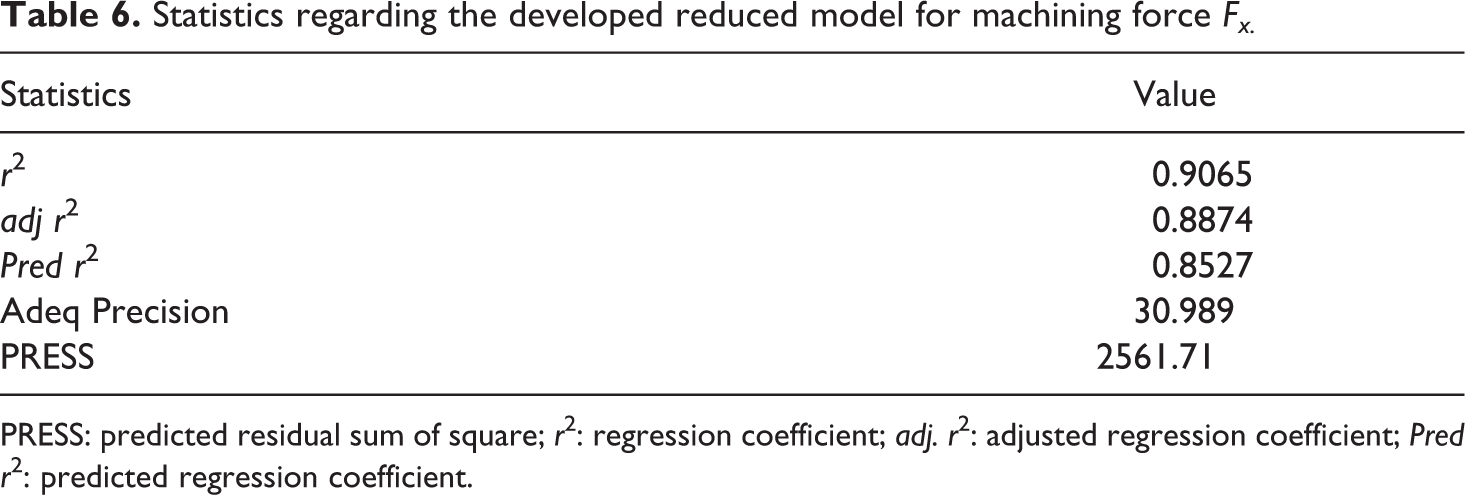
Some statistics regarding the developed reduced interaction model for F y are given in Table 6. Based on the r 2 coefficient, 90.65% of the total variation in F y explained by this model include these terms. This value is reasonably high, which indicates the adequate fitting of the two-factor interaction model. The “Pred r 2 ” of 0.8527 is in reasonable agreement with the “adj. r 2 ” of 0.8874. “Adeq Precision” measures the signal-to-noise ratio as 30.989 greater than 4, which indicates an adequate signal. This model can be used to navigate the design space. Despite these features, this model was not as good as the F x model described above. PRESS value was considerably bigger than the F x model’s value, which means that the F y model is a less effective predictor of new data.
Statistics regarding the developed reduced model for machining force Fx.
Reduced regression models (equations) for F y in terms of actual factors are given in Table 7. Results of equations indicate that, like F x equations, the effect of feed rate is more significant than that of cutting speed. The effect of feed rate on F y is the biggest when cutting PEEK-reinforced carbon with K15 and PCD tools, and PEEK-reinforced carbon material types followed this. Moreover, cutting speed has a negative effect on cutting force F y.
Final equation in terms of actual factors for F y.
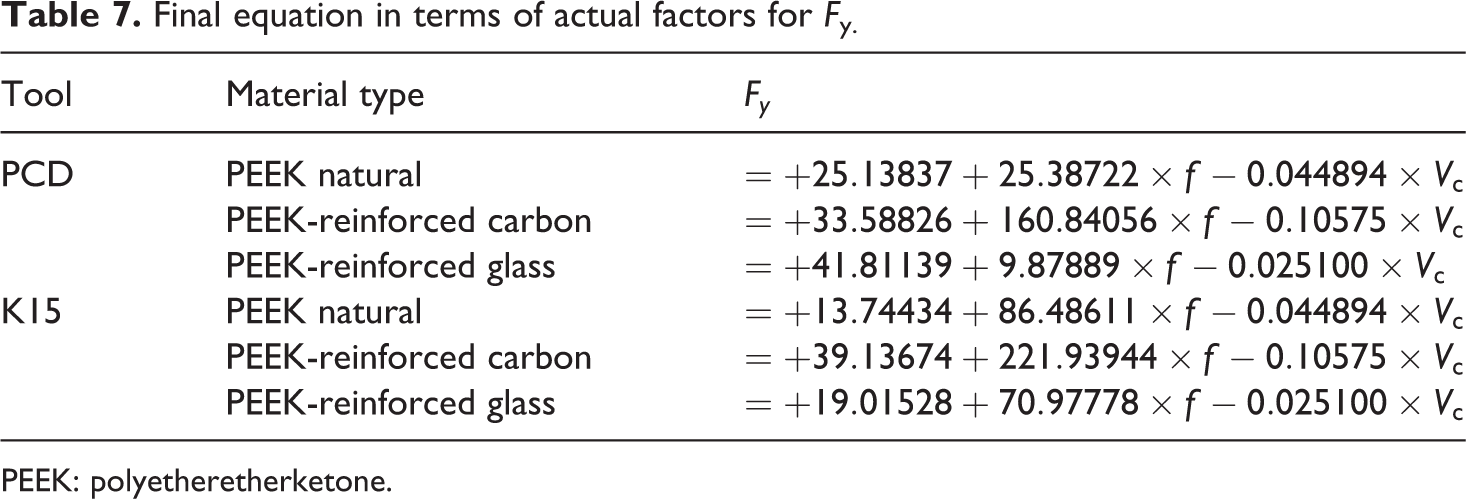
PEEK: polyetheretherketone.
ANOVA results of machining force F z were somewhat different from others. Table 8 shows ANOVA results for a response surface-reduced quadratic model for machining force F z. The main effects of cutting tools, material type, feed rate, cutting speed, and AB, AD, BC, and CD interactions were statistically significant in machining force F z. Also, the quadratic effects of feed rate (C 2 ) were significant. Feeding rate (C) had the strongest effect on F z forces changing, and material type followed this as well. The model was found to be significant, with an F value of 1111.48 (p = 0.0001 < p = 0.05). This high F value, in comparison with other models described above, indicates that this model is stronger than the other models.
ANOVA for response surface quadratic model for machining force F z.
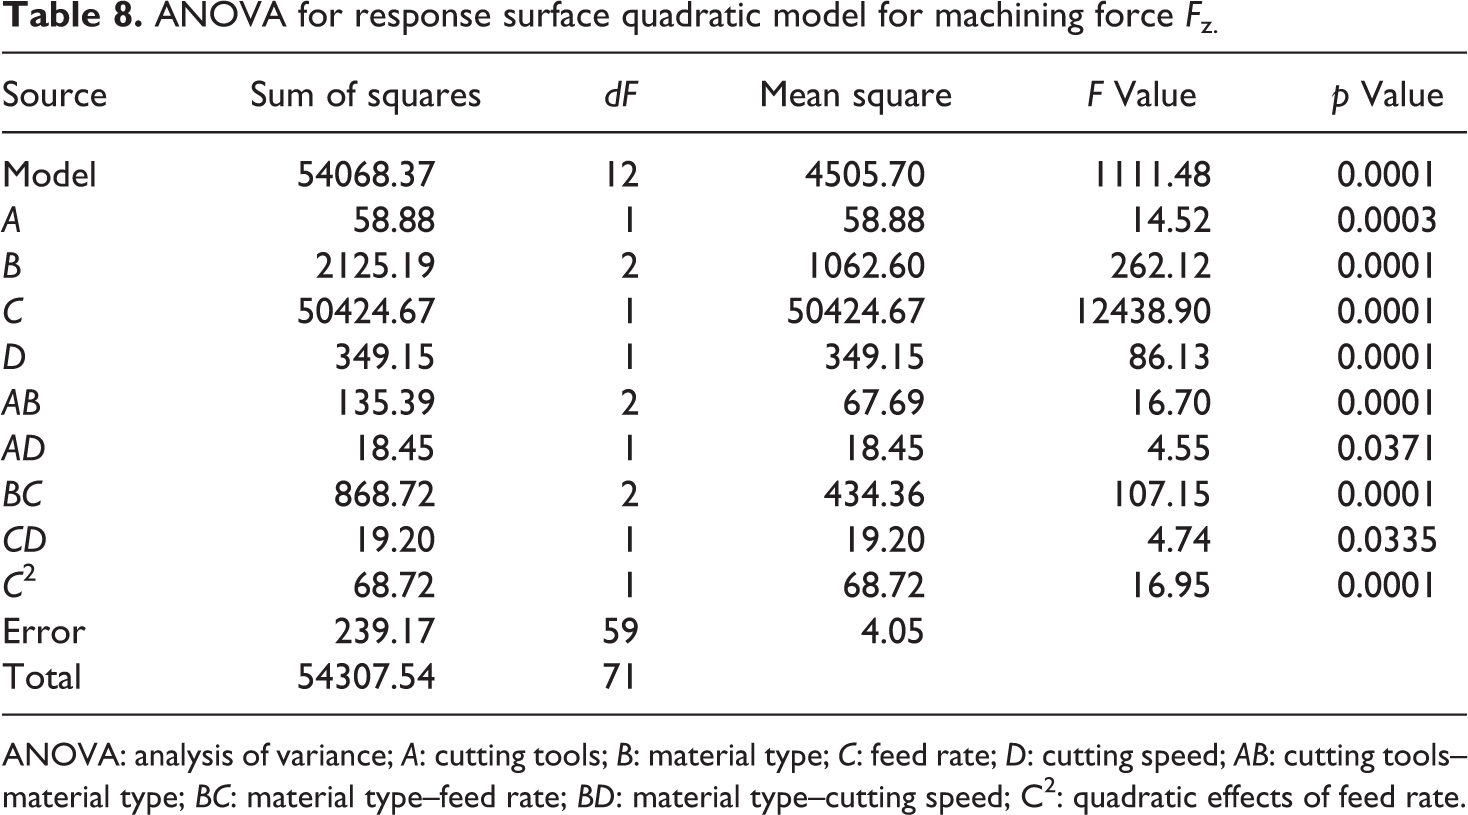
ANOVA: analysis of variance; A: cutting tools; B: material type; C: feed rate; D: cutting speed; AB: cutting tools–material type; BC: material type–feed rate; BD: material type–cutting speed; C 2 : quadratic effects of feed rate.
Statistics regarding the developed reduced quadratic model for F z are given in Table 9. Based on the r 2 coefficient, 99.56% of the total variation in F z explained by this model includes these terms. This value is considerably high and excellent, as 0.975 ≤ r 2 ≤ 0.999 indicates the adequate fitting of this model, and the proportion of the variability in the data is mostly explained by the model. The “Pred r 2 ” of 0.9934 is in reasonable agreement with the “adj. r 2 ” of 0.9947. “Adeq Precision” measures the signal-to-noise ratio as 106.681 greater than 4, which indicates an adequate signal. This model can be used to navigate the design space. Based on these values, it is logically true to say that this model is a good predictor of F z.
Statistics regarding the developed reduced model for machining force Fz.

Reduced regression models (equations) for F z in terms of actual factors are given in Table 10. Results of equations indicate that, like F x and F y equations, the effect of feed rate is more significant than that of cutting speed. The main effect of feed rate and the quadratic effect of feed rate in F z is equal to the same material type for PCD and K15 tools. Moreover, cutting speed, CD interaction, and the quadratic effect of feed rate have a negative effect on cutting force Fz .
Final equation in terms of actual factors for Fz.
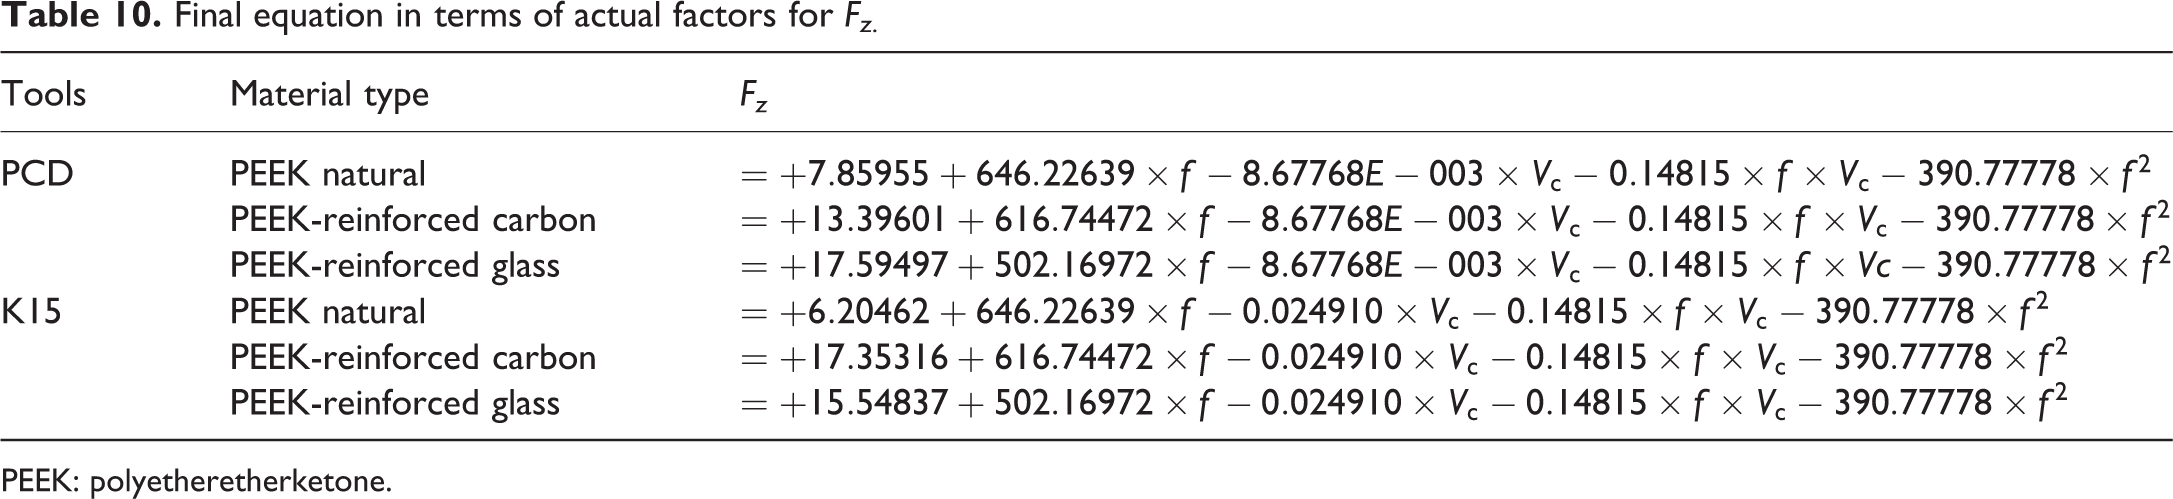
PEEK: polyetheretherketone.
Checking the adequacy of the mathematical models
The adequacy of models obtained for F x, F y, and F z is checked by residual analysis in order to verify that the underlying assumptions of regression analysis are not violated. The normal probability plots of machining forces F x, F y, and F z are depicted in Figure 1. The graphs indicate that there is no sign of violation of the assumption of normality since each point in the plots follows a straight line. This indicates that the experiments come from a normally distributed population. To check the constant error variance assumption, residuals are also plotted against the predicted values of forces.
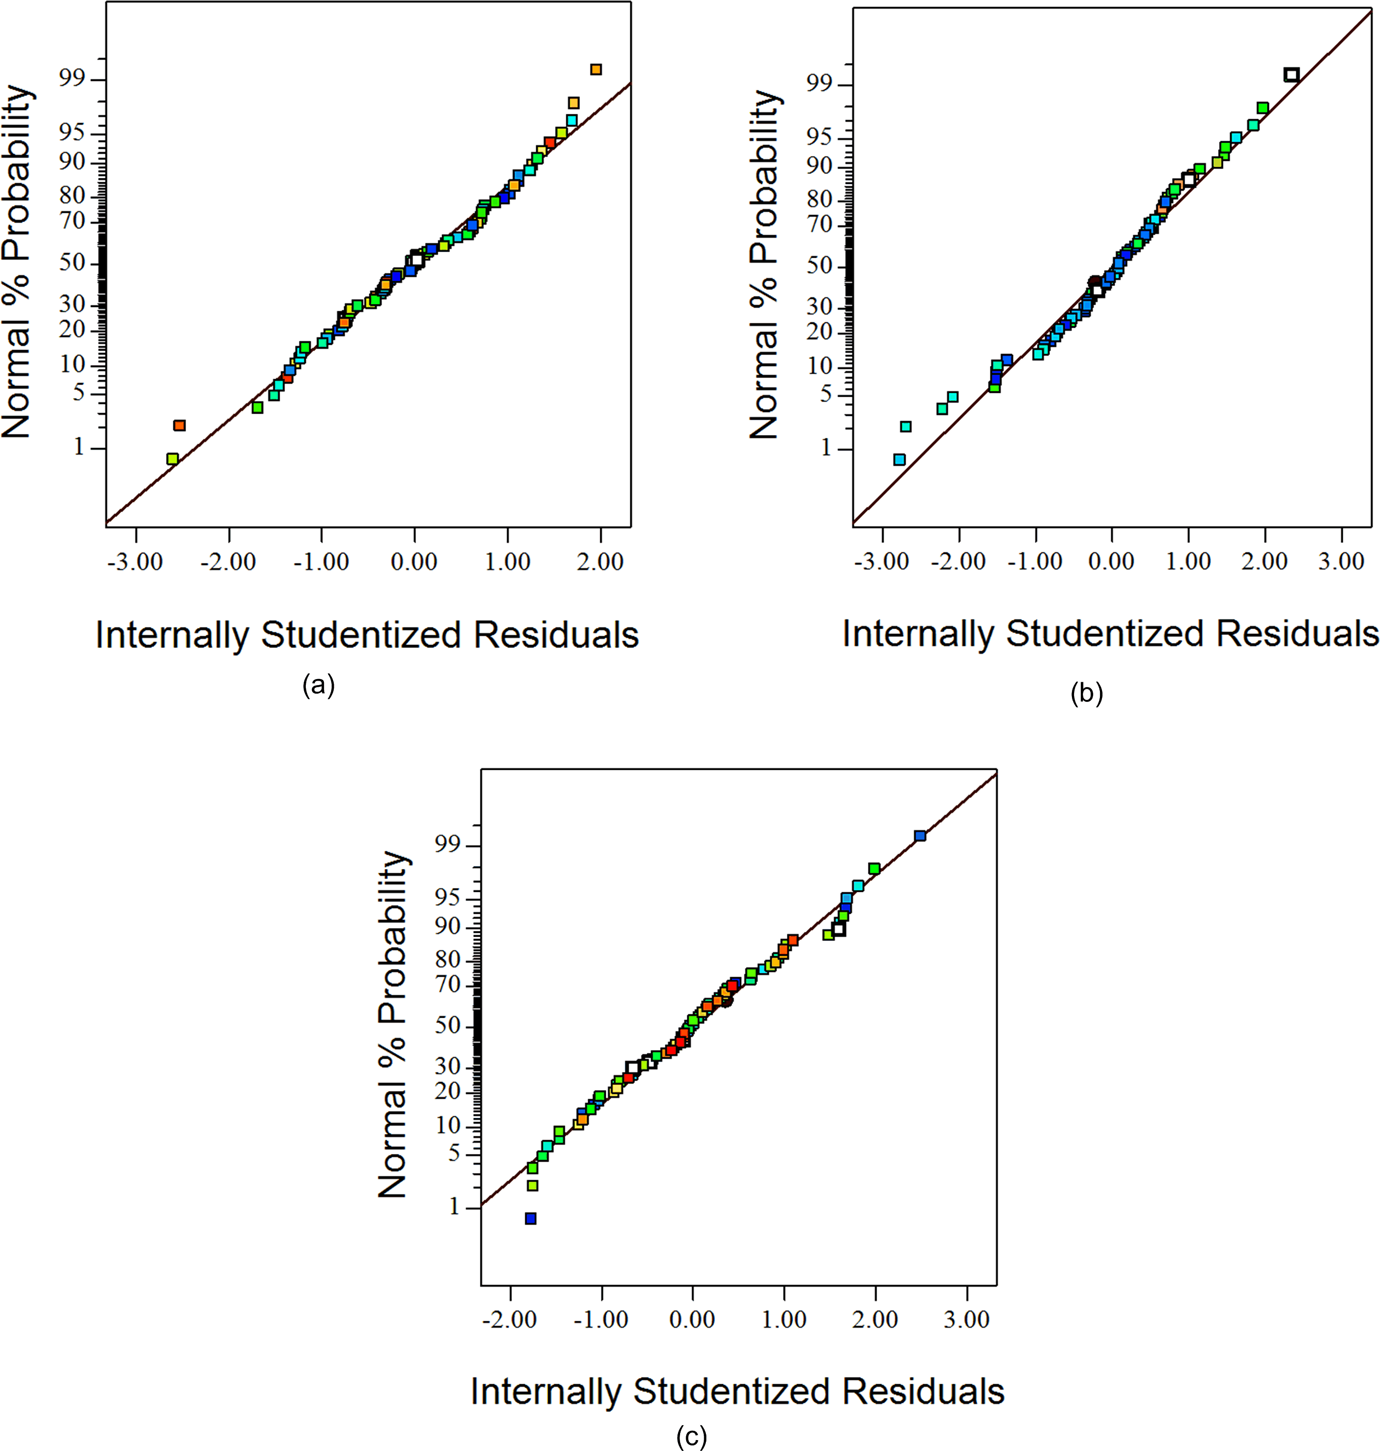
Normal probability plots of the residuals for machining forces: (a) F x, (b) F y, and (c) F z.
Based on residual versus predicted values plots, there is no reason to suspect any violation of the constant variance assumptions, because the configuration of the points is about as close to being ideal as realistically expected. Additionally, residual versus observation orders are investigated for three machining forces, and the results showed that there is no reason to suspect any violation of the independence assumption. For the sake of space, these plots are not presented. Based on all the tests, it can be said that the models obtained above can be used to predict the machining forces F x, F y, and F z within the limits of the factors studied.
Model graphs
Figure 2 presents the response surface plots of the functions of feed rate and cutting speed in F x when turning three materials with the two tools obtained from regression models. For F y and F z, similar results were obtained using response surface plots. For the sake of space, these plots are not presented. Because the models contain main effects, the response surface has a flat plane. Although CD interaction was not significant, these plots were used to obtain the minimum and maximum F x forces. In addition, the effects of cutting tools and material types were evaluated using these graphs. As seen in Figure 2, feed rate has a stronger effect than cutting speed on machining force. This result is not a surprise, as can be seen in the ANOVA results in the previous section (Table 2). It can be deduced from the graphs that cutting force is greater for PEEK composites than for PEEK natural. The two images (Figure 2(a) and (d)) compare machining force variability of cutting tools with constant materials (PEEK natural) and within specific intervals of feed rate and cutting speed. In general, a higher machining force was found in PCD tools when machining PEEK natural. Moreover, these plots indicate that F x will be minimized if the feed rate is set to a low level (f = 0.05), while the cutting speed is set to a high level (V c = 200) when using PCD or K15 tools and machining on the PEEK natural material (Figure 2(a) and (d)). On the contrary, F x will be maximized if the feed rate is set to a high level (f = 0.20), while the cutting speed is set to a low level (V c = 50) when using PCD or K15 tools and machining on the PEEK reinforced with carbon (Figure 2(a) and (d)).
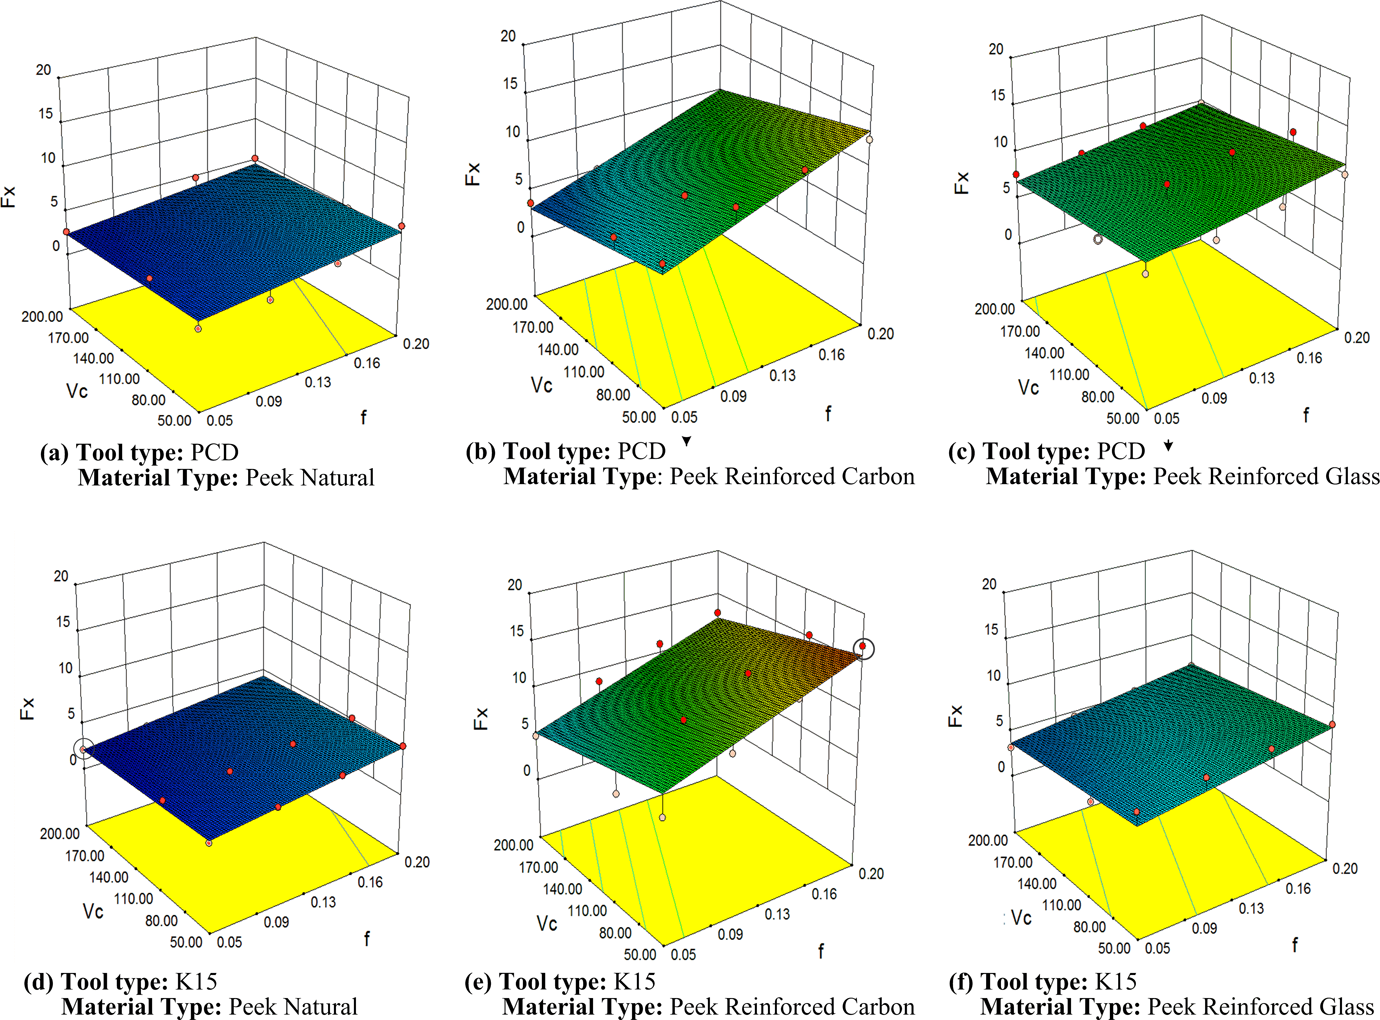
Response surface plots for F x.
At first glance, the effect of CFs on machining force is obvious (Figure 2). As Davim and Mata 14 found, PEEK CF had higher values of cutting force compared with polymer PEEK. For PEEK-reinforced carbon, a higher machining force was found with K15 tools (Figure 2(b) and (e)). F x will be minimized if the feed rate is set to a low level (f = 0.05), while the cutting speed is set to a high level (V c = 200) when using PCD or K15 tools and machining on the PEEK natural material (Figure 2(b) and (e)). On the contrary, F x will be maximized if the feed rate is set to a high level (f = 0.20), while the cutting speed is set to a low level (V c = 50) when using PCD or K15 tools and machining on the PEEK reinforced with carbon (Figure 2(b) and (e)).
For PEEK-reinforced glass, a higher machining force was found with PCD tools (Figure 2(c) and (f)). As mentioned by Rahman et al., 9 our results show lower machining force with the K15 tool when machining PEEK-reinforced glass. F x will be minimized if the feed rate is set to a low level (f = 0.05), while the cutting speed is set to a high level (V c = 200) when using PCD or K15 tools and machining on the PEEK natural material (Figure 2(c) and (f)). On the contrary, F x will be maximized if the feed rate is set to a high level (f = 0.20), while the cutting speed is set to a low level (V c = 50) when using PCD or K15 tools and machining on the PEEK-reinforced with carbon (Figure 2(c) and (f)). This result can give an indication about the final surface roughness of PEEK composites. Petropoulus et al. 11 and Davim and Mata 12 mentioned that increasing the feed rate can cause a significant increase in the surface roughness of all polymer composites. Also, they showed that slightly increasing the cutting speed is favorable for better surface roughness. In our case, if the feed rate is set to a high level (f = 0.20), while the cutting speed is set to a low level (V c = 50) when using PCD or K15 tools, better surface roughness for PEEK composites can be obtained.
It is obvious that there is a critical cutting speed in turning. Briefly, machining above the critical cutting speed is considered as cutting in a rubbery zone, and it results in a lower cutting force as shown in Figure 2. This probably explains the reason a higher cutting force is obtained when machining is carried out below the critical cutting speed (<150 m/min) as explained by Rahman et al. 9
Figure 3 presents the effects of both material types and cutting tools types (AB) as significant factors in F x. Figure 3(a) shows minimum response when the feed rate and cutting speed are 0.05 and 200, respectively. Figure 3(b) shows maximum response when the feed rate and cutting speed are 0.20 and 50, respectively. When both graphs were analyzed, they showed an evident adverse effect on feed rate and cutting speed: increasing the feed rate while decreasing the cutting speed increases F x values for all material types and cutting tool types. The remaining machining forces F y and F z also give similar results.
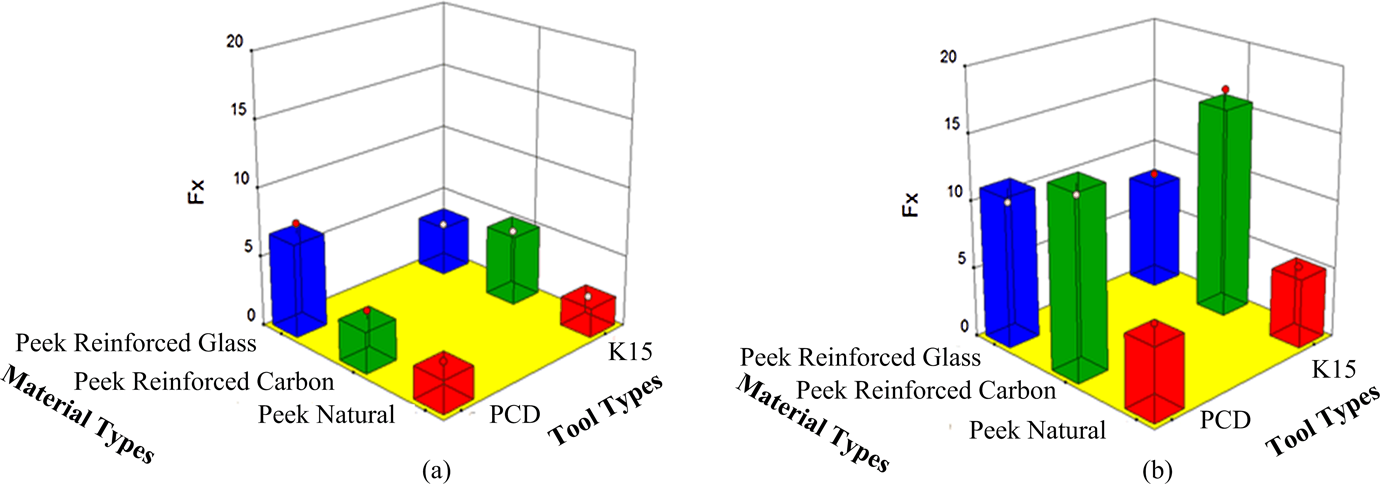
Response surface plots for F x: (a) a surface with minimum F x and (b) a surface with maximum F x.
To obtain minimum force for PEEK natural and PEEK-reinforced glass and PEEK-reinforced carbon, K15 tools and PCD tools, respectively, should be chosen. Conversely, to obtain a higher machining force for PEEK natural and PEEK-reinforced glass and for PEEK-reinforced carbon, PCD tools and K15 tools, respectively, should be chosen.
Finally, this method is very powerful in selecting the cutting parameters for unreinforced PEEK and PEEK composites. The results of this article can be used as reference in industry and can be helpful in terms of cost reduction.
Conclusions
The investigative study on the aspects of cutting forces during the cutting of unreinforced PEEK, PEEK-reinforced carbon, and PEEK-reinforced glass with PCD and K15 tools are presented in this article. The main factors such as material type, cutting tools, cutting speed, and feed rate and their interactions were evaluated statistically, and mathematic models and plotted model graphs were developed. The following conclusions can be drawn from the study:
The force F x is statistically affected mostly by material type, followed by feed rate and, finally, AB, BC, and BD interactions.
The effect of factors of force F y had a similar behavior as F x. However, our findings showed that the AC interaction also influenced F y compared with F x.
The force F z is quite different when matched with F x and F y. All main factors are affected significantly. Feed rate had the strongest influence, followed by cutting speed. Regarding interaction effects, the following interactions were found to be significant: AB, AD, BC, and CD. The only exception was the BD interaction.
In general, unreinforced PEEK had a lower cutting force compared with reinforced PEEK using PCD or K15 tools.
To obtain a lower machining force for PEEK natural and PEEK composites, the cutting speed should be higher than 150 mm/min and the feed rate should be lower than 0.09 mm/r. If the reverse (i.e. a higher machining force) is needed, the cutting speed should be lower than 150 mm/min and the feed rate should be higher than 0.09 mm/r.
In general, K15 cutting tools decrease the machining force of PEEK and PEEK-reinforced glass but increase that of PEEK-reinforced carbon. PCD cutting tools do the opposite of K15 tools.
Footnotes
Funding
This research received no specific grant from any funding agency in the public, commercial, or not-for-profit sectors.