
Abstract
The thermal degradation of short-time heated carbon fiber (CF)-reinforced polyetheretherketone (PEEK, CF/PEEK) and high-density polyethylene (HDPE), in the range of 10 ms up to 3 min, was investigated by various detection methods such as differential scanning calorimetry, gravimetric analysis, and Fourier transform infrared spectroscopy (FTIR). Therefore, the polymers were heated by extrinsic and intrinsic heating methods, including induction heating, infrared heating, and laser heating, which provides the highest heat flux. The short-time heated polymers revealed thermal degradation after several milliseconds of laser irradiation as well as after several seconds of induction heating. CF/PEEK exhibited a decrease in crystallinity and melting extrapolated onset temperature with an increase in irradiation time and power. The FTIR results indicated that random chain scissoring started at the phenyl ring bonding, the ether bonding, and the aromatic hydrogen bonding, whether some new nonaromatic hydrogen bonding occurred. HDPE showed a decrease in melting peak temperature and some changes in the methylene stretching bonding.
Keywords
Introduction
Recently, fast manufacturing technologies for fiber-reinforced thermoplastic composites have been developed, which aim at shorter cycle times. 1 –8 In comparison to standard methods, increased process temperatures are often used locally to accelerate the manufacturing process. Nevertheless, a local overheating, even for a short period of time, is assumed to cause significant polymer damage and consequently an integrity reduction.
Degradation mechanisms and analysis methods of long-time heated thermoplastics have been described extensively in recent articles. 9 –12 A molecular deterioration results from an overheating of the polymers. At elevated temperatures beyond the nominal melting temperature, components of the polymer chain backbone begin to separate (molecular scission) and form nuclei for reactions with other polymer chain elements. 9 These reactions effect changes at the molecular level, for example, a decreased molecular weight and an altered crystallinity in semicrystalline materials. Simultaneously, optical, thermal, and mechanical properties are influenced dramatically. The phenomena accompanying the degradation effects at the molecular level are often a limitation of the service temperature, mechanical property loss, reduction of mechanical failure temperature, viscosity changes, and visible property changes like color shifts or chalking. 13 –16
Usually, the thermal degradation is drastically accelerated by a higher temperature. In contrast, longer exposition times at lower temperatures do not necessarily promote increased polymer degradation. In this context, Holmström and Sörvik even reported a molecular chain enlargement for polyethylene at temperatures below the melting point. 17,18
By the incorporation of particles, the oxidation processes during degradation and thermal decomposition can be influenced. Inorganic fillers, like wollastonite and diatomite, were reported to serve as antioxidants. Others, like mica, may promote oxidation effects. 10 In this context, a stabilizing effect of ferromagnetic particles on the thermal stability of polyethylenes was observed. 19,20 While microsized hematite (ferric oxide) did not decrease the degradation temperature, competing zirconium- and calcium-based additives led to a decrease in the decomposition temperature of high-density polyethylene (HDPE). 19 Copper was reported to increase the crystallinity of low-density polyethylene resulting in an increased thermal stability. 20 Goiti et al. investigated the positive effect of magnetite on thermal degradation stability: the activation energy of degradation reactions within hydrogels was increased by an increase in the magnetic particles. 21
For short-time heated material, rarely any degradation detection methods have been described. With the emergence of innovative manufacturing technologies, including induction welding and laser-based thermoplastic tape placement processes, the characterization of the degradation caused by these methods is of high interest. Furthermore, only little is known about the degradation analysis of intrinsic heating methods, like heating via particulate heat sources. Therefore, the scope of the presented work lies in the evaluation of the degradation state of short-time heated polymers for intrinsic and extrinsic heating by means of conventional analysis methods.
Materials and methods
Materials
Two materials were investigated, which represent two different polymer families (Table 1). A high-temperature resistant carbon fiber (CF)-reinforced polyetheretherketone (PEEK, CF/PEEK) tape material with a reinforcement of AS4 CFs and a fiber volume fraction of approximately 60% was supplied by Suprem, Yverdon-les-Bains, Switzerland. The tapes had a width of 12 mm and a thickness of 140 µm. All the CF/PEEK specimens were cut from the same supplied batch. The thermal history of the specimens was unknown, but nevertheless the material inspection of the as supplied batch showed a consistent crystallinity of ∼31% for CF/PEEK
Materials applied in this study.
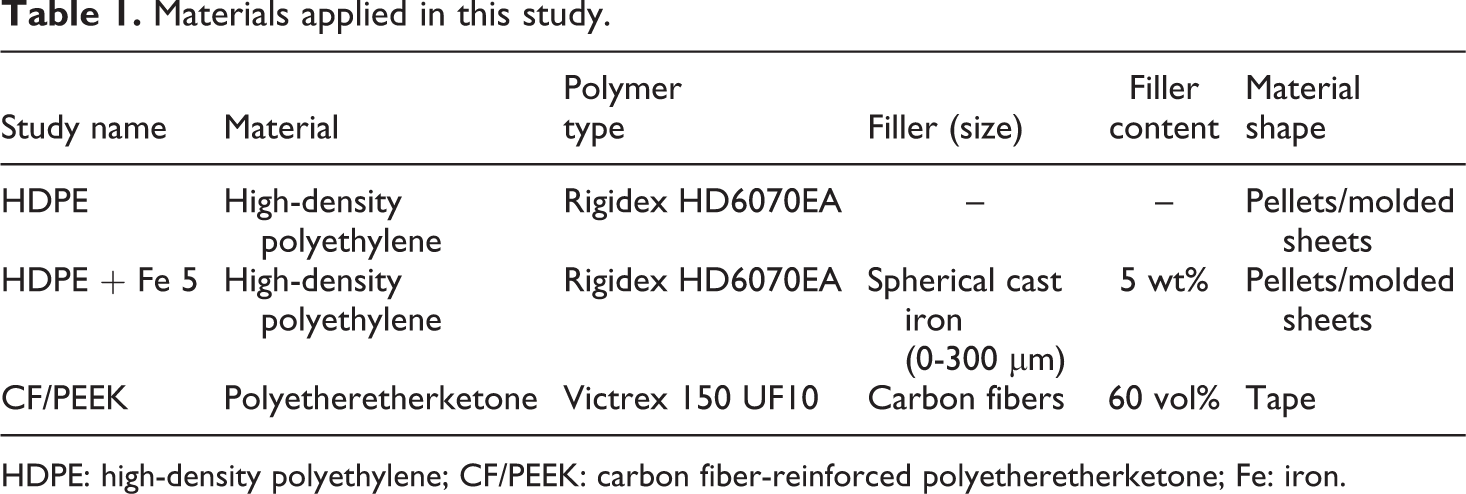
HDPE: high-density polyethylene; CF/PEEK: carbon fiber-reinforced polyetheretherketone; Fe: iron.
Contrarily, a standard polyolefin, namely, Rigidex 6070EA HDPE from Ineos, Grangemouth, UK was used. Additional 5 wt% cast iron particles (HDPE + 5 wt% Fe) were incorporated into the HDPE to provide the ability for intrinsic induction heating and to be closer to production processes and products. 3 For both HDPE compounds, the melting temperature at the initial state was found to be close to 134°C, whereas the crystallinity was found to be consistent at ∼75% (HDPE) and ∼79% (HDPE + 5 wt% Fe). For the trials, the provided pellets were manufactured into sheets with the dimensions of 60 × 60 × 2 mm3 by compression molding.
Investigated heating methods
The used heating methods were classified into intrinsic, meaning volume heating, and extrinsic methods, which corresponds to a surface heating with only little penetration. In this context, the electromagnetic induction field activates the ferromagnetic promoter material, in this case cast iron particles, whereas the surrounding matrix is transparent. The promoters distribute the transferred energy to the matrix by conduction. This type of heating can be characterized as intrinsic heating, since the particles are regarded as unique heat sources, which are distributed within the polymer. Contrarily, laser and infrared (IR) heating apply the energy to the surface or surface near area up to several micrometers penetration depth, which is considered to be of extrinsic nature. The energy has to penetrate into the material, which is a relatively slow process and a temperature gradient from the surface to the center of the specimen is usually formed.
IR radiation
A model 4085 spotlight was obtained from Research Inc., which provided a spot with a diameter of 6.3 mm and 750 W (24 W/mm2). The HDPE samples were irradiated up to 120 s in steps of 20 s. For PEEK, the radiation time increases from nondegraded to 250 s in steps of 50s. Each experiment was repeated three times.
Laser radiation
For short-time radiation in the millisecond range, a diode laser type LDL40-500 from Laserline GmbH, Mülheim-Kärlich, Germany was applied. The laser system provided a wavelength of 980 nm at a maximum power of 600 W (12.5 W/mm2). The laser reaches its maximum power within 2 ms and is used in the continuous radiation mode. The applied optic created a rectangular spot with a size of 12 × 4 mm2. The CF/PEEK specimens with a dimension of 30 × 12 × 0.12 mm3 were irradiated under an angle of 90° to minimize reflection. HDPE samples were irradiated under the same angle and had the size of 20 × 10 × 2 mm3.
The experimental design for CF/PEEK is shown in Table 2 and for HDPE in Table 3.
Test matrix for laser radiation of PEEK material.
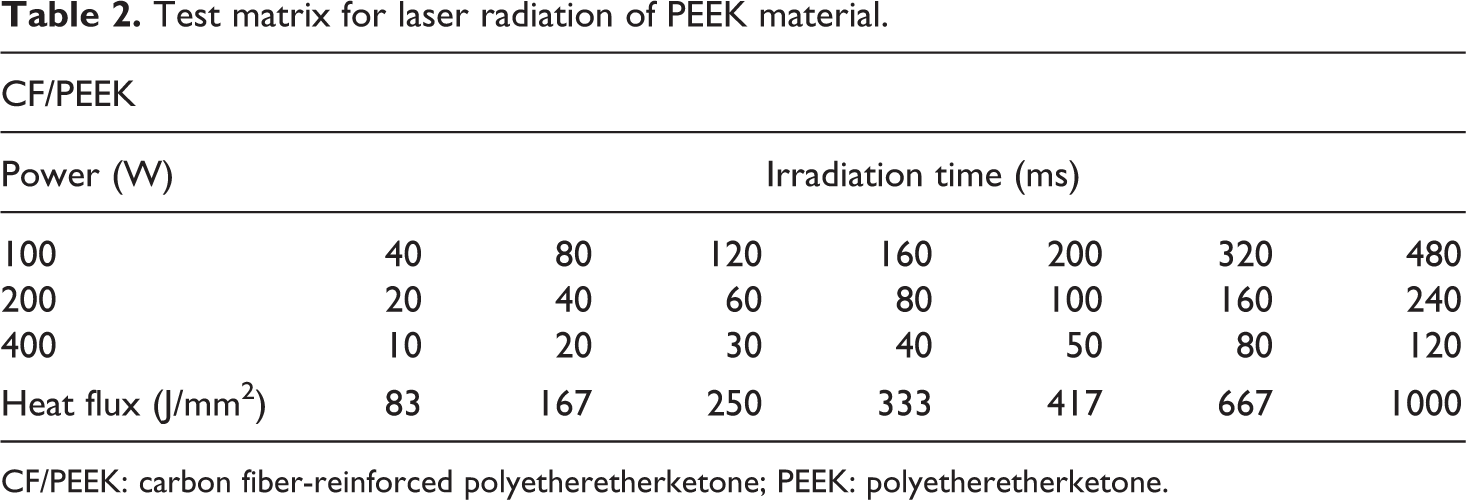
CF/PEEK: carbon fiber-reinforced polyetheretherketone; PEEK: polyetheretherketone.
Test matrix for laser radiation of HDPE material.
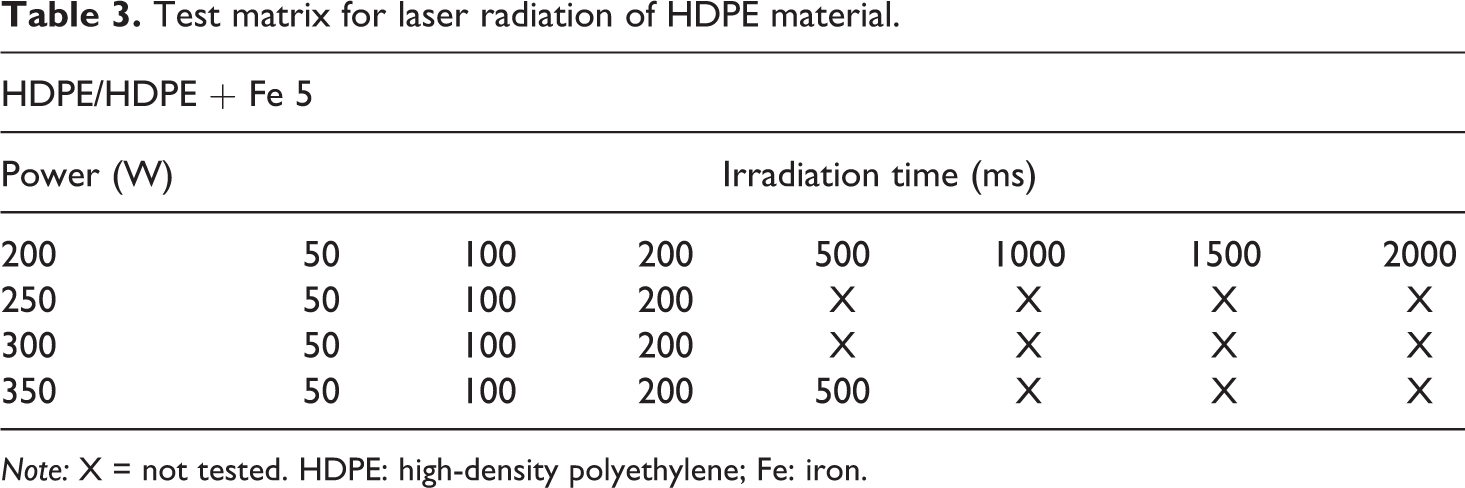
Note: X = not tested. HDPE: high-density polyethylene; Fe: iron.
Induction heating
Induction heating is based on the formation of eddy currents and magnetic hysteresis losses in electrical conductive and magnetic materials. Since polymers do not offer the possibility to be heated on their own, an approach for polymer–polymer composites pursued the incorporation of ferromagnetic particles into the matrix. 3,22
For the induction heating tests, an iron-doped HDPE sheet material (60 × 60 × 2 mm3) was placed on a pancake coil. The coil’s electromagnetic field was driven by a Trumpf Hüttinger TruHeat 5010 MF generator with a nominal power of 10 kW and a working frequency of 450 kHz. The experimental set-up has been described in detail before. 3 The samples for degradation analysis were prepared from the center of the sheets, which was affected by the highest magnetic field density.
Degradation detection methods
A major aim of this investigation was to show that the degradation state of short-time heated polymers can be observed with standard analysis methods without extra efforts. Possible analysis systems were theoretically examined and ranked according to their particular operation difficulty, their repeatability of results, and their ability to reveal the targeted degradation states. Three different methods have been finally chosen to qualify degradation. They include differential scanning calorimetry (DSC), Fourier transform infrared spectroscopy (FTIR), and an optical analysis by scanning electron microscopy (SEM).
Differential scanning calorimetry
The DSC measurements were carried out by the use of a Mettler Toledo DSC 821 (Mettler Toledo, Gießen, Germany). The samples had a weight of approximately 10–12 mg. All DSC experiments were conducted under a nitrogen atmosphere to prevent material oxidation. The programs for HDPE and CF/PEEK are displayed in Figure 1. Only the second heating cycle of each program was analyzed, since the first heating cycle served to minimize effects due to the thermal history of the specimen, especially due to different cooling rates after sample irradiation. The relevant heating and cooling rates were set to 10 K/min.
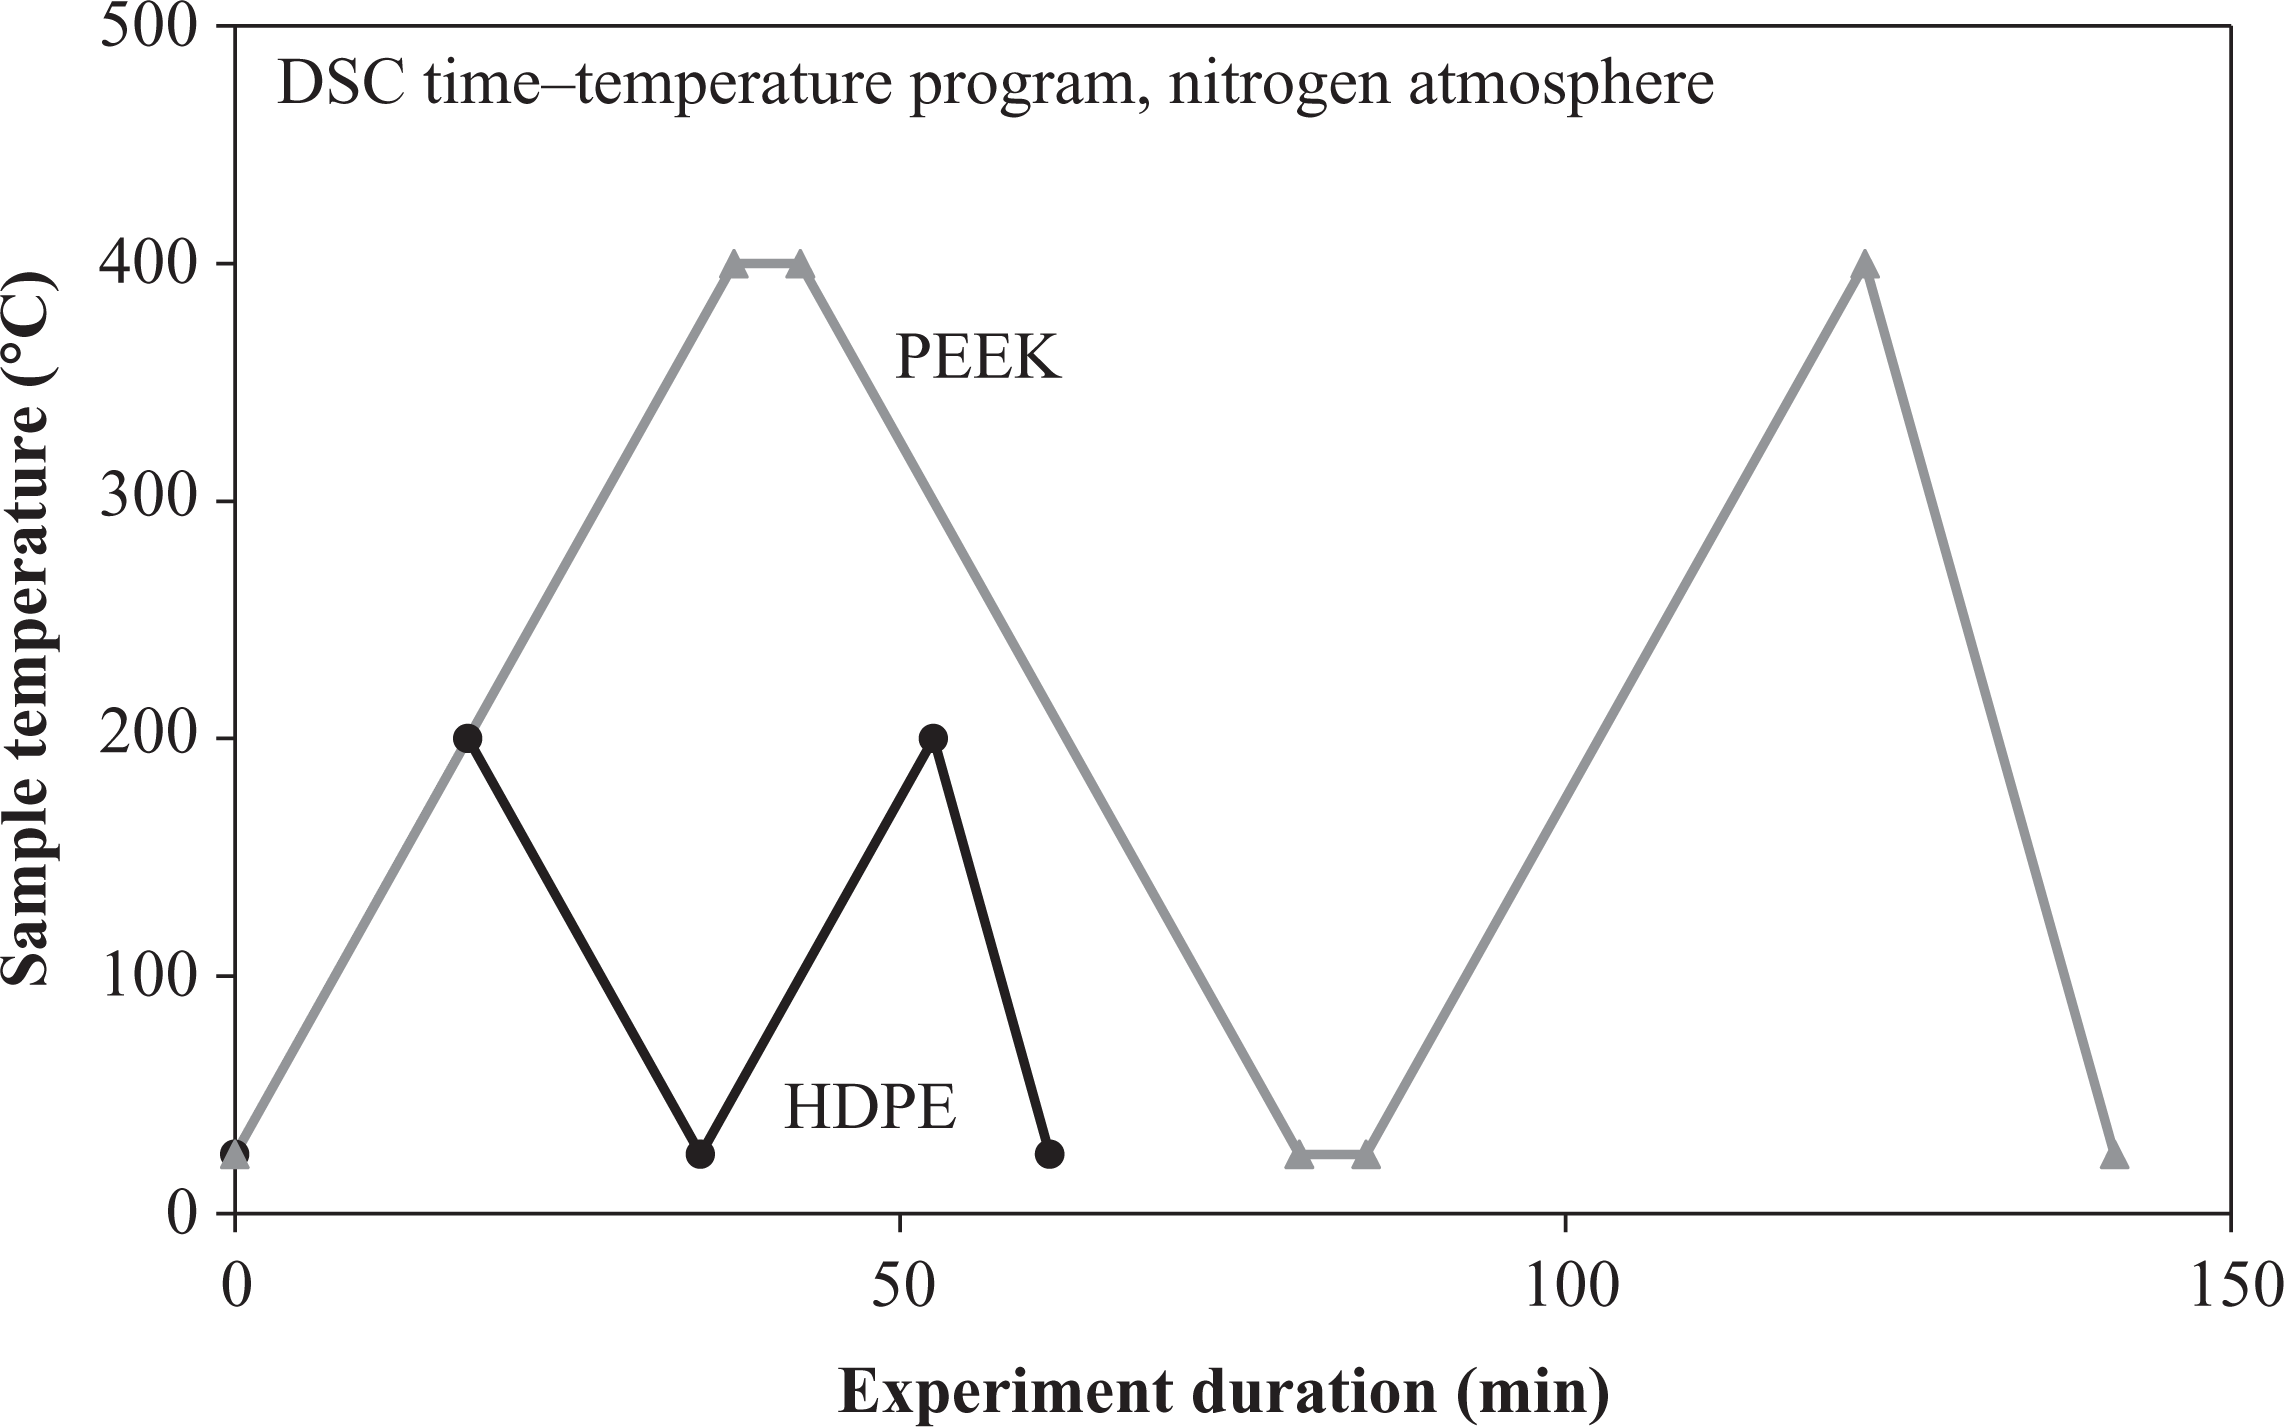
Differential scanning calorimetry time–temperature cycles.
For the detection of the degradation state of short-time heated samples by DSC, different properties were analyzed, including, for example, the crystallization and melting peak temperature and the degree of crystallinity (Figure 2). Nevertheless, the (extrapolated) onset and end temperatures and the degree of crystallinity are dependent on the operator’s care. In contrast, the peak melting temperature and peak crystallization temperature are obtained from a computer analysis of the energy record. 23
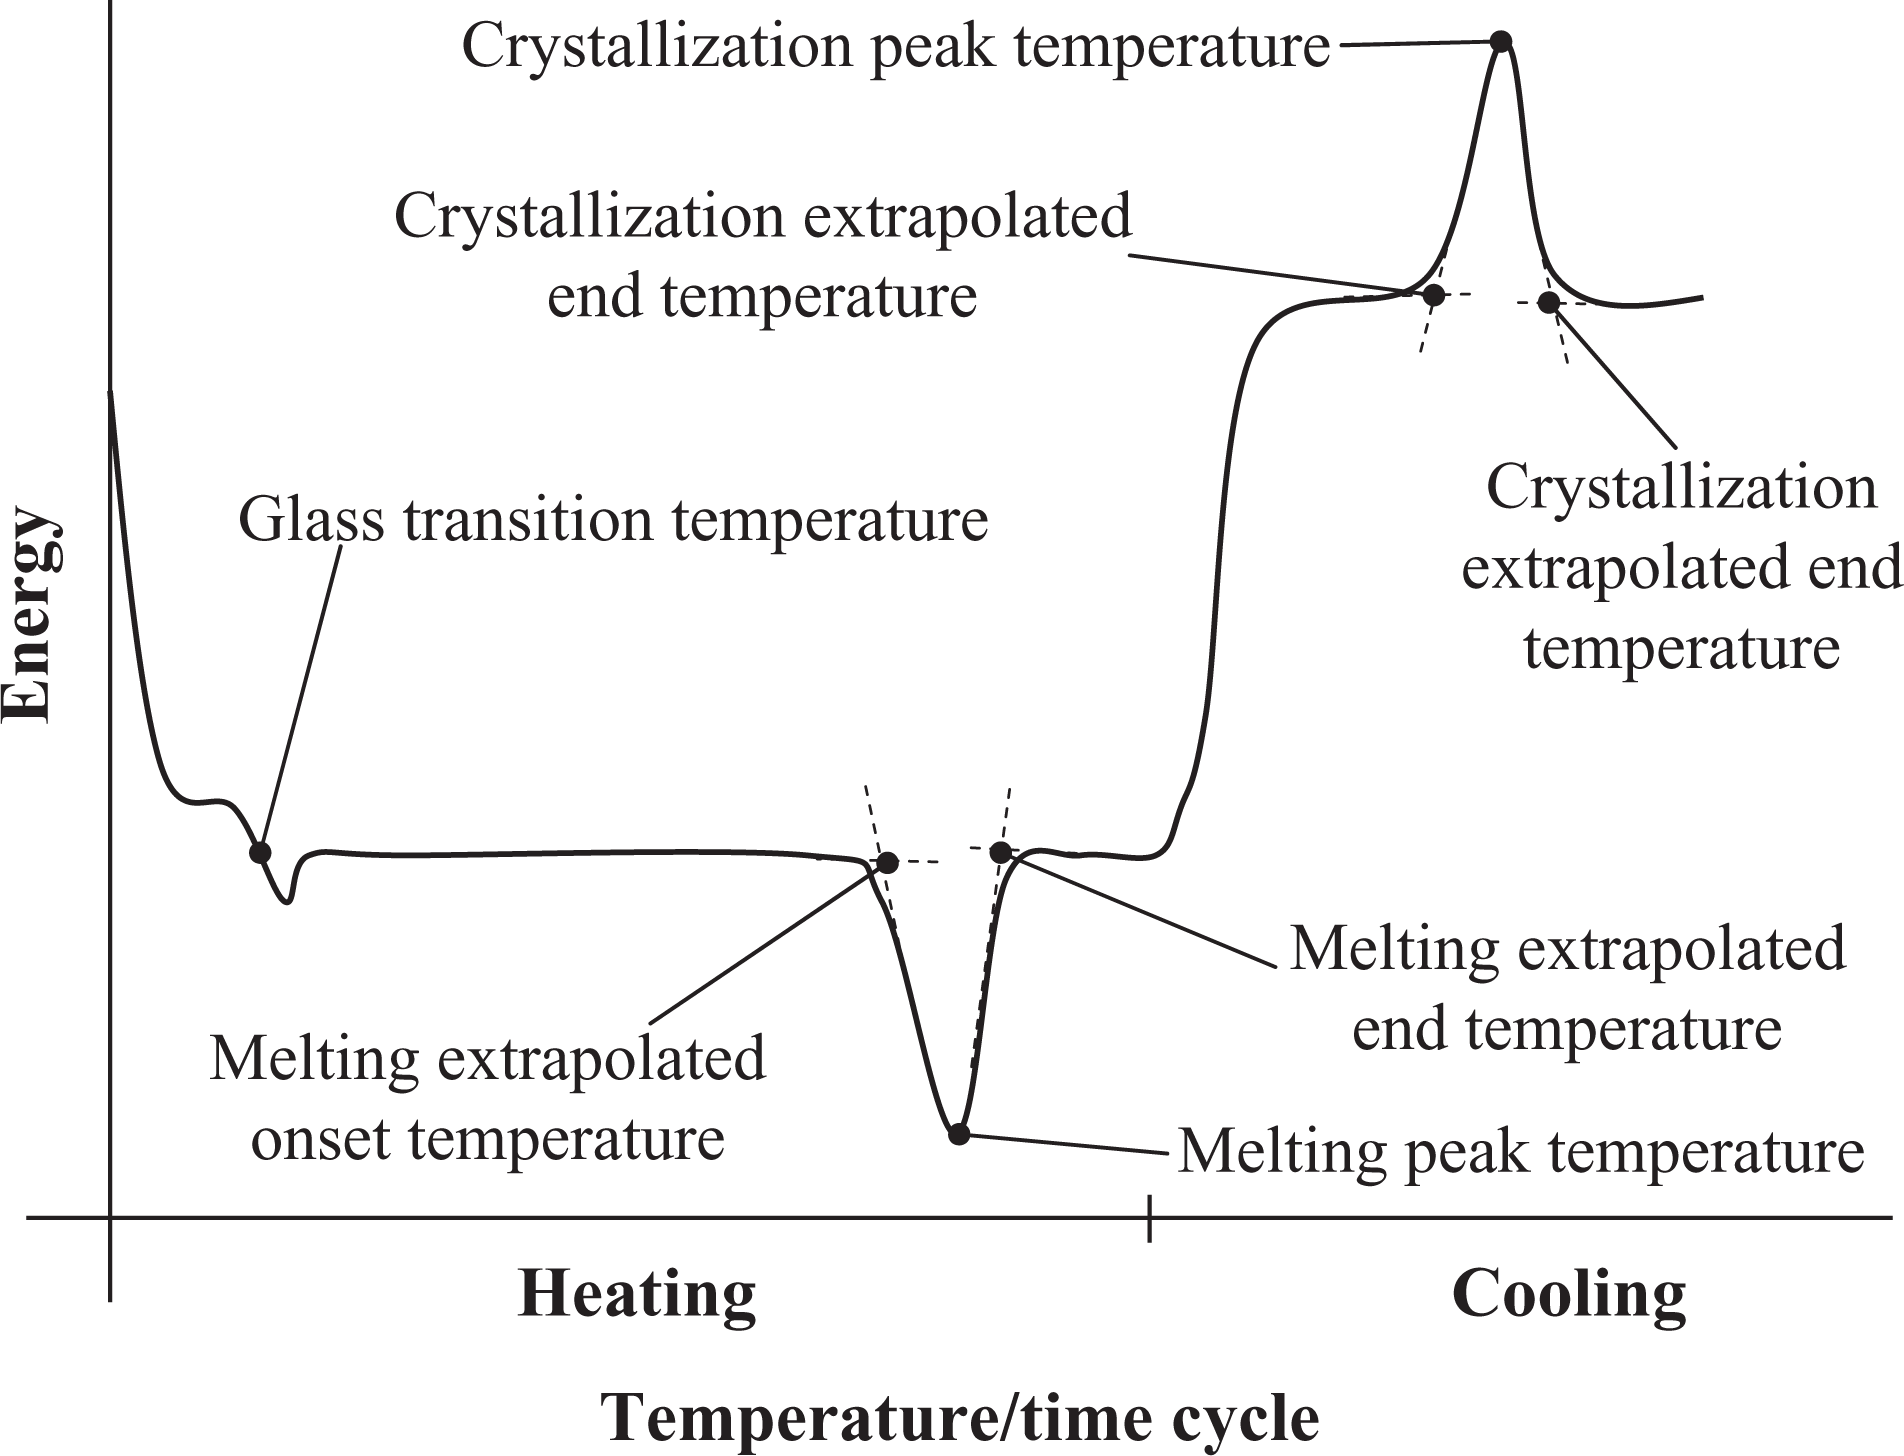
Significant temperatures obtained from the energy evolution of an exemplary DSC record.
FTIR spectroscopy
FTIR spectroscopy was used to investigate the changes in the molecular structure caused by thermal degradation. This technique has the advantage of providing information about changes in the chemical bonds on the polymer surface. Each polymer material has a significant finger print according to its respective polymer structure.
A Nicolet 510 (Thermo Electron Corporation, Madison, WI, USA) equipped with a deuterated triglycine sulfate detector and a potassium bromide beam splitter was applied. The spectra were obtained by attenuated total reflection with a zinc selenide crystal from Spectra Tech Foundation Series supplied by Thermo Electron Corporation (Madison, WI, USA).
The CF/PEEK specimens were placed on the prism in such a way that the fibers were perpendicular to the beam direction and clamped with a force of 12 N. 128 single scans were recorded at a speed of 1.5825 cm/s and a resolution of 4 cm−1. Each configuration was repeated three times with different specimens.
Gravimetric investigation
For the detection of weight loss, the specimen’s weights were measured by a Mettler Toledo XP 205 DeltaRange (Gießen, Germany) prior to and immediately after heating. The balance provided a resolution of 0.01 mg. The weight losses are expressed in percentage values.
Optical characterization
Morphological changes after a thermal treatment were observed by a Zeiss Supra (Carl Zeiss AG, Oberkochen, Germany) 40 scanning electron microscope, crystallite sizes and different crystal growths were analyzed with a magnification of up to 200,000×.
The samples were investigated directly on the heated surface or on a cryo-fractured surface. The latter was preferably used for induction-heated material. In either way, the surfaces were sputtered previously with a platinum–gold layer.
Results and discussion
CF/PEEK tapes
The temperature evolution during laser radiation of CF/PEEK was measured by a quotient pyrometer and exceeded the maximum measurement range of 1043°C in each case, also in the case of the shortest heating time of 10 ms. Consequently, the nominal thermal degradation temperature of approximately 450°C was exceeded in all the experiments. It was assumed that the amount of degraded material increased with radiation time.
With increasing power and laser radiation time, the specimens showed an intense formation of smoke, especially at 417 J/mm2, 667 J/mm2, and 1000 J/mm2. After cleaning, the fiber structure at the radiated area of severe smoking specimens appeared to have changed its color to light grey, which could be observed with the naked eye.
Nearly all specimens possessed marks in the zone of the irradiation treatment. The marks were more significantly visible with increasing laser intensity and radiation time. The area around the marks was investigated by means of SEM. An exemplary image is given in Figure 3 for a specimen radiated with 200 W for 40 ms. In comparison to a nondegraded sample (Figure 4), the polymer surface on some fibers became rough and perforated resulting in bare-lying fibers. With increasing radiation time, the polymer matrix, especially around fibers, was severely damaged (Figure 5) leading to an irregular, spongy structure, which is typically for laser radiation. 24,25 This result indicates that the polymer is partially transparent for the laser beam. The polymer is about 60–100% transparent for Nd:YAG laser with a wavelength of 1064 nm or 355 nm and a film thickness of 50.9 µm. 26,27 The transparency can change with the morphology and crystallinity of the polymer. In contrast to the PEEK, the CF absorbs the laser radiation nearly completely. In this context, the cross section of the polymer was analyzed to determine the distance between surface and CFs. The average distance of the fibers to the surface was 5 µm, which limits the penetration depth of the laser. The laser passed through the polymer to the fibers, which resisted the heat treatment much better. Nevertheless, the fibers were also intensively affected, since they heated up very fast and transported the incoming energy by conduction to the surrounding matrix. The matrix was hereby heavily damaged resulting in matrix ablation within the composite.
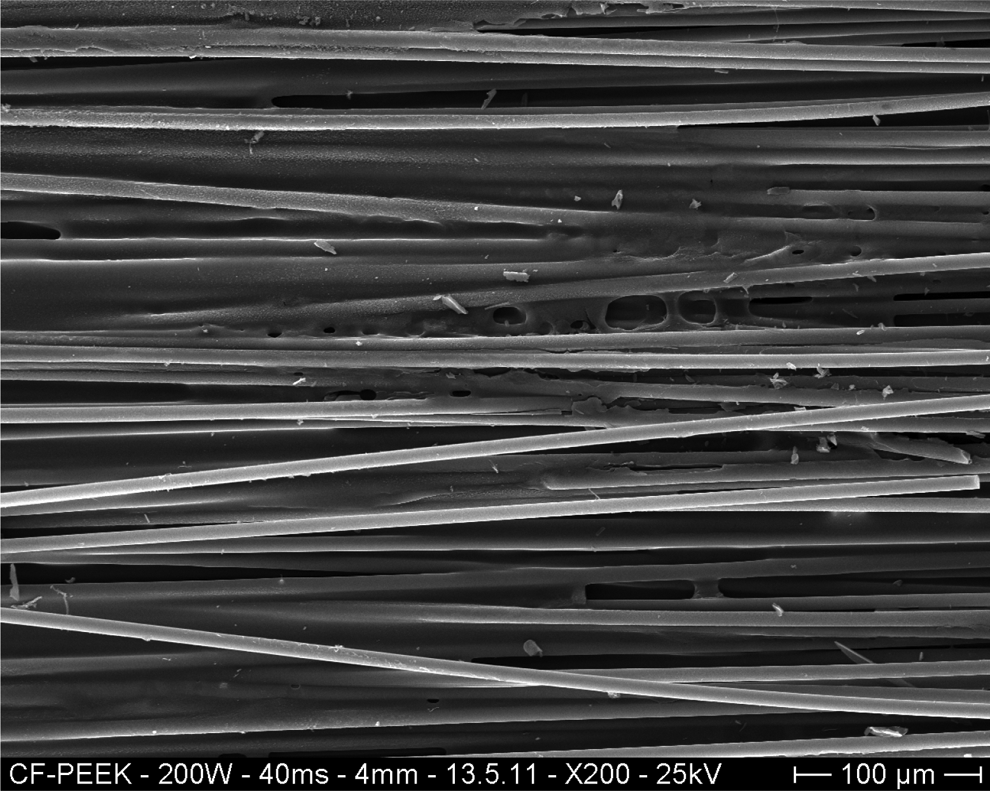
Scanning electron micrograph image of a laser radiated CF/PEEK tape (200 W, 40 ms). CF/PEEK: carbon fiber-reinforced polyetheretherketone.
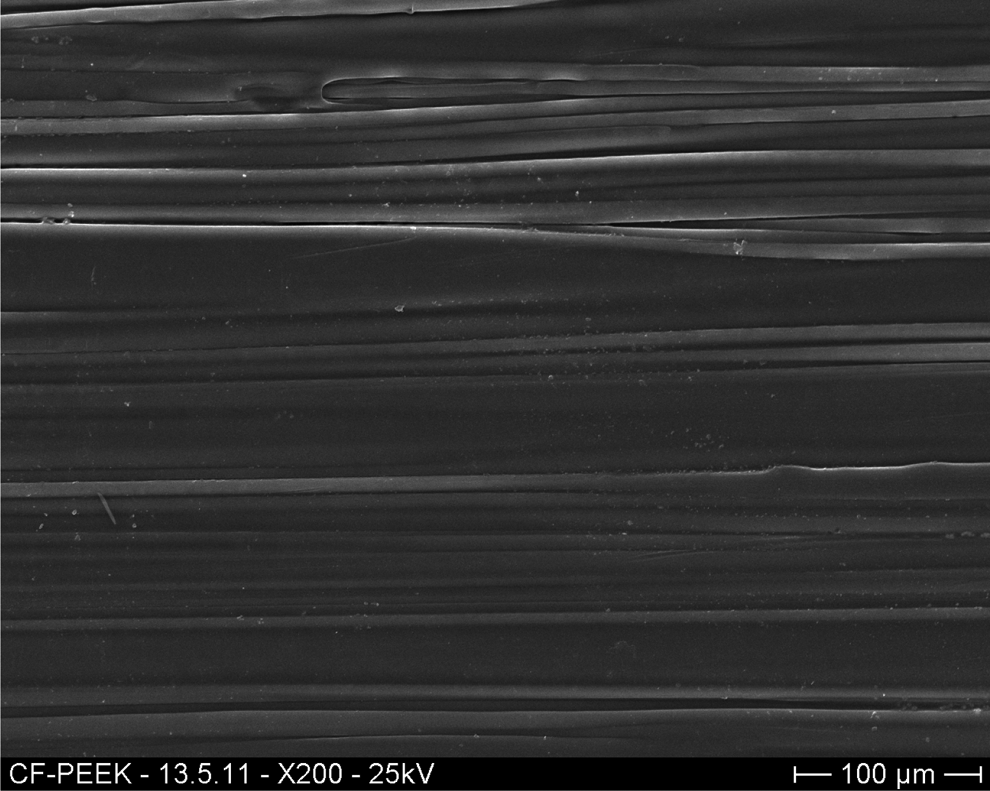
Scanning electron micrograph image of a nonradiated CF/PEEK tape.
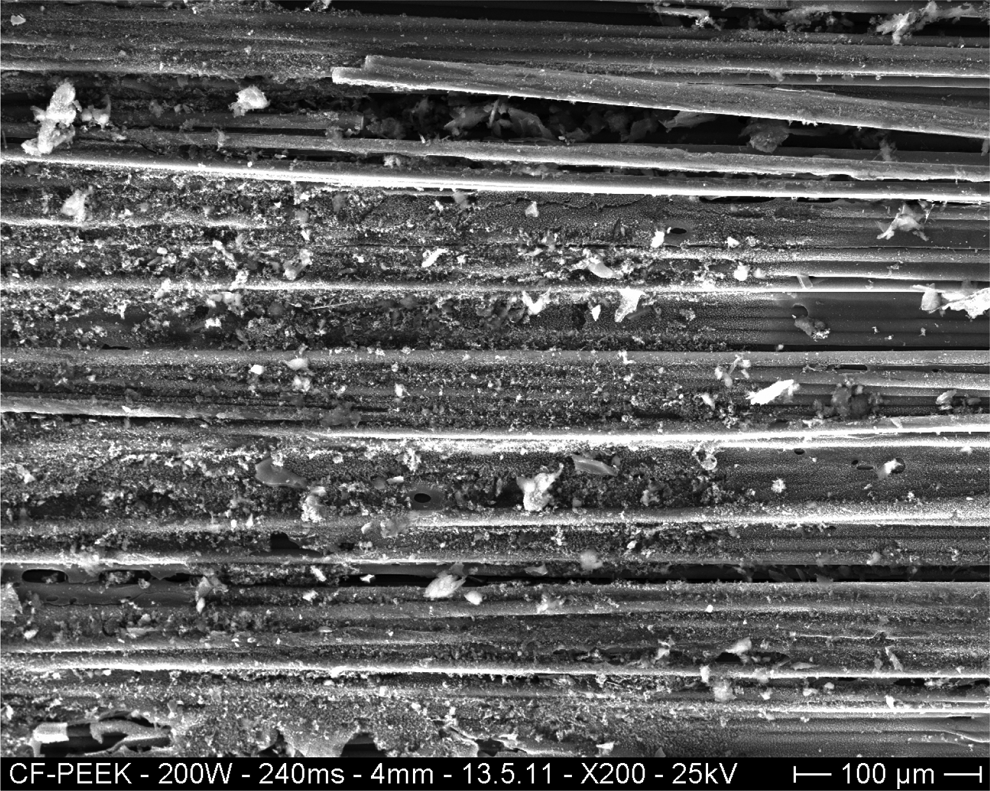
Scanning electron micrograph image of severely damaged laser irradiated CF/PEEK sample (200 W, 240 ms).
For a deeper investigation of polymeric changes, the specimen’s weights were measured before and after irradiation by analytical balances. In this way, the weight loss caused by the irradiation was determined. The curves in Figure 6 demonstrate a quadratic increase in weight loss and are more pronounced for higher radiation times. This indicates a significant loss of material at higher temperatures within short time due to polymer ablation and chemical changes in the polymers structure, which has already been reported previously. 28,29 Even for moderate radiation conditions around 250 J/mm2 heat flux, a weight loss of approximately 1% was recorded. The increase in heat flux from 250 J/mm2 to 417 J/mm2 resulted in an increase in weight loss up to 7%. This heat flux increase corresponds to an increase in radiation time of only 50 ms in the case of 400 W radiation power. Due to the higher temperature resistance of CFs, the measured weight loss was mainly attributed to polymer degradation, its vaporization, and ablation. If only the polymer mass was taken into consideration for weight loss, the mass reduction increases from 7% with CFs to 19% for the single polymer. This is an indication that significant degradation within the polymeric material occurred.
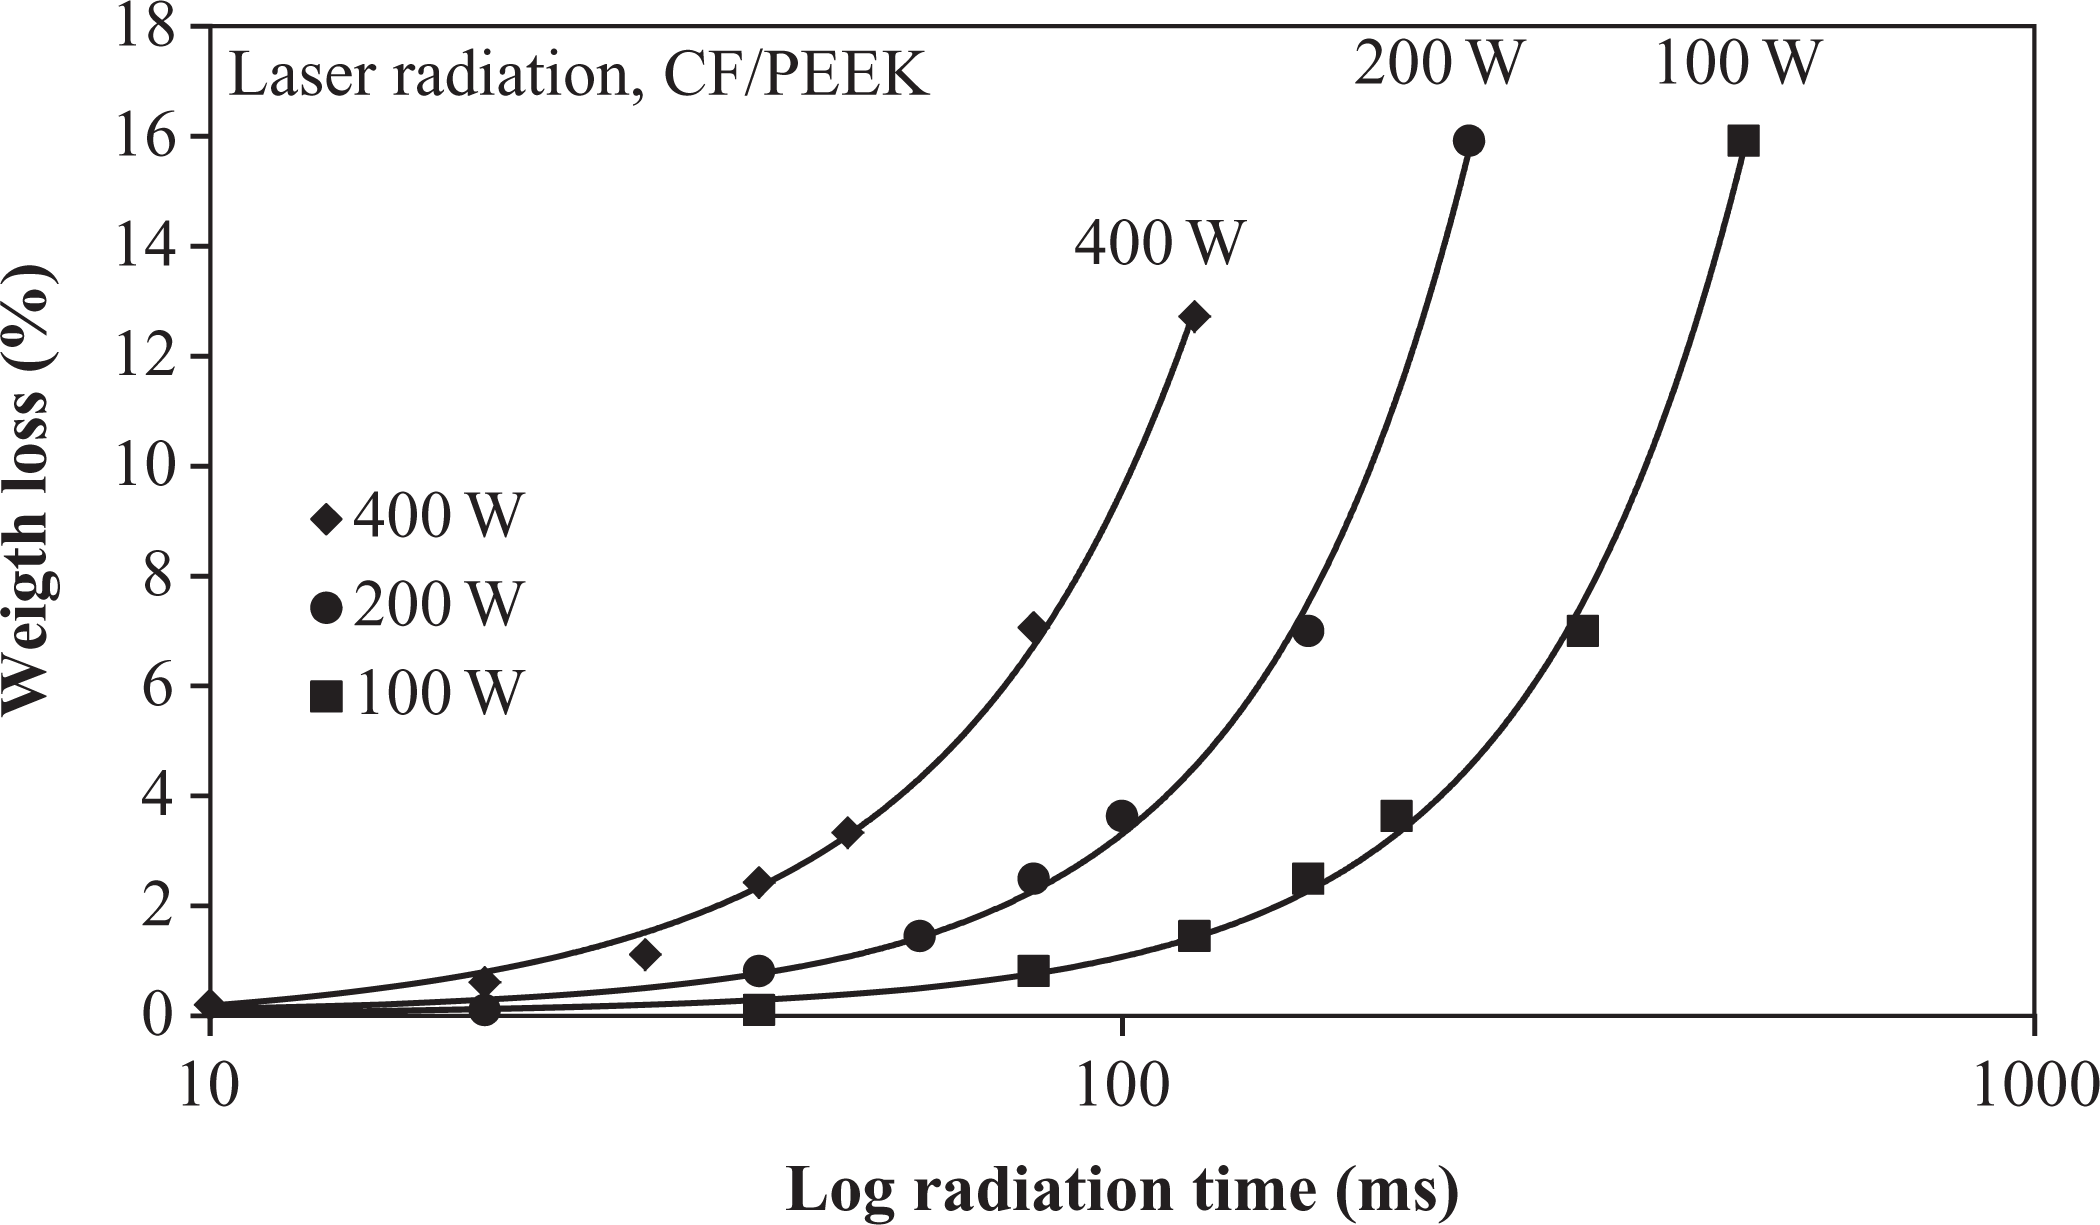
Weight loss of CF/PEEK specimens caused by irradiation.
Figure 7 shows the crystallinity changes of the laser-radiated specimens. With increasing radiation time and higher power, the degree of crystallinity decreases significantly from 31%, which had been measured at the supplied material. In order to investigate the maximum crystallinity of the CF/PEEK tapes, specimens were tempered at 280°C for 10 min and cooled at a rate of 1 K/min to ambient temperature. These specimens showed a slightly higher crystallinity of ∼34%. Up to 100 ms radiation time, only marginal changes were found for sparsely radiated specimens (100 W and 200 W). The corresponding gravimetric measurements indicated a higher sensitivity in these heat flux regions (compare Figures 6 and 7). The crystallinity decrease follows a quadratic function, while the specimens at low radiation times deviate from this function and show a moderate crystallinity increase up to the values of the aged specimens. This increase shifts to lower radiation times with an increase in power. With increasing radiation time, the crystallinity approaches the 0% mark for all power modes. The reason for the crystallinity reduction was assumed to depend on either the weight loss or the bonding changes. Therefore, the DSC results were correlated with the gravimetric analysis, which revealed a quadratic increase in weight loss with time, whereas the DSC demonstrated a quadratic increase in crystallinity with time. The weight decrease was revealed to correspond to the crystallinity decrease. Consequently, since the weight loss was attributed to the polymer mass reduction only, the reduced polymer mass was thus taken into account for calculating a corrected fiber volume fraction and a corrected crystallinity of each radiated specimen. The corrected crystallinity is illustrated with an asterisk in Figure 8. Upon comparing the corrected crystallinity with the nominal one, the crystallinity reduction was more pronounced than the weight loss. Therefore, it was assumed that the crystallinity decrease is more attributed to structural changes within the polymer.
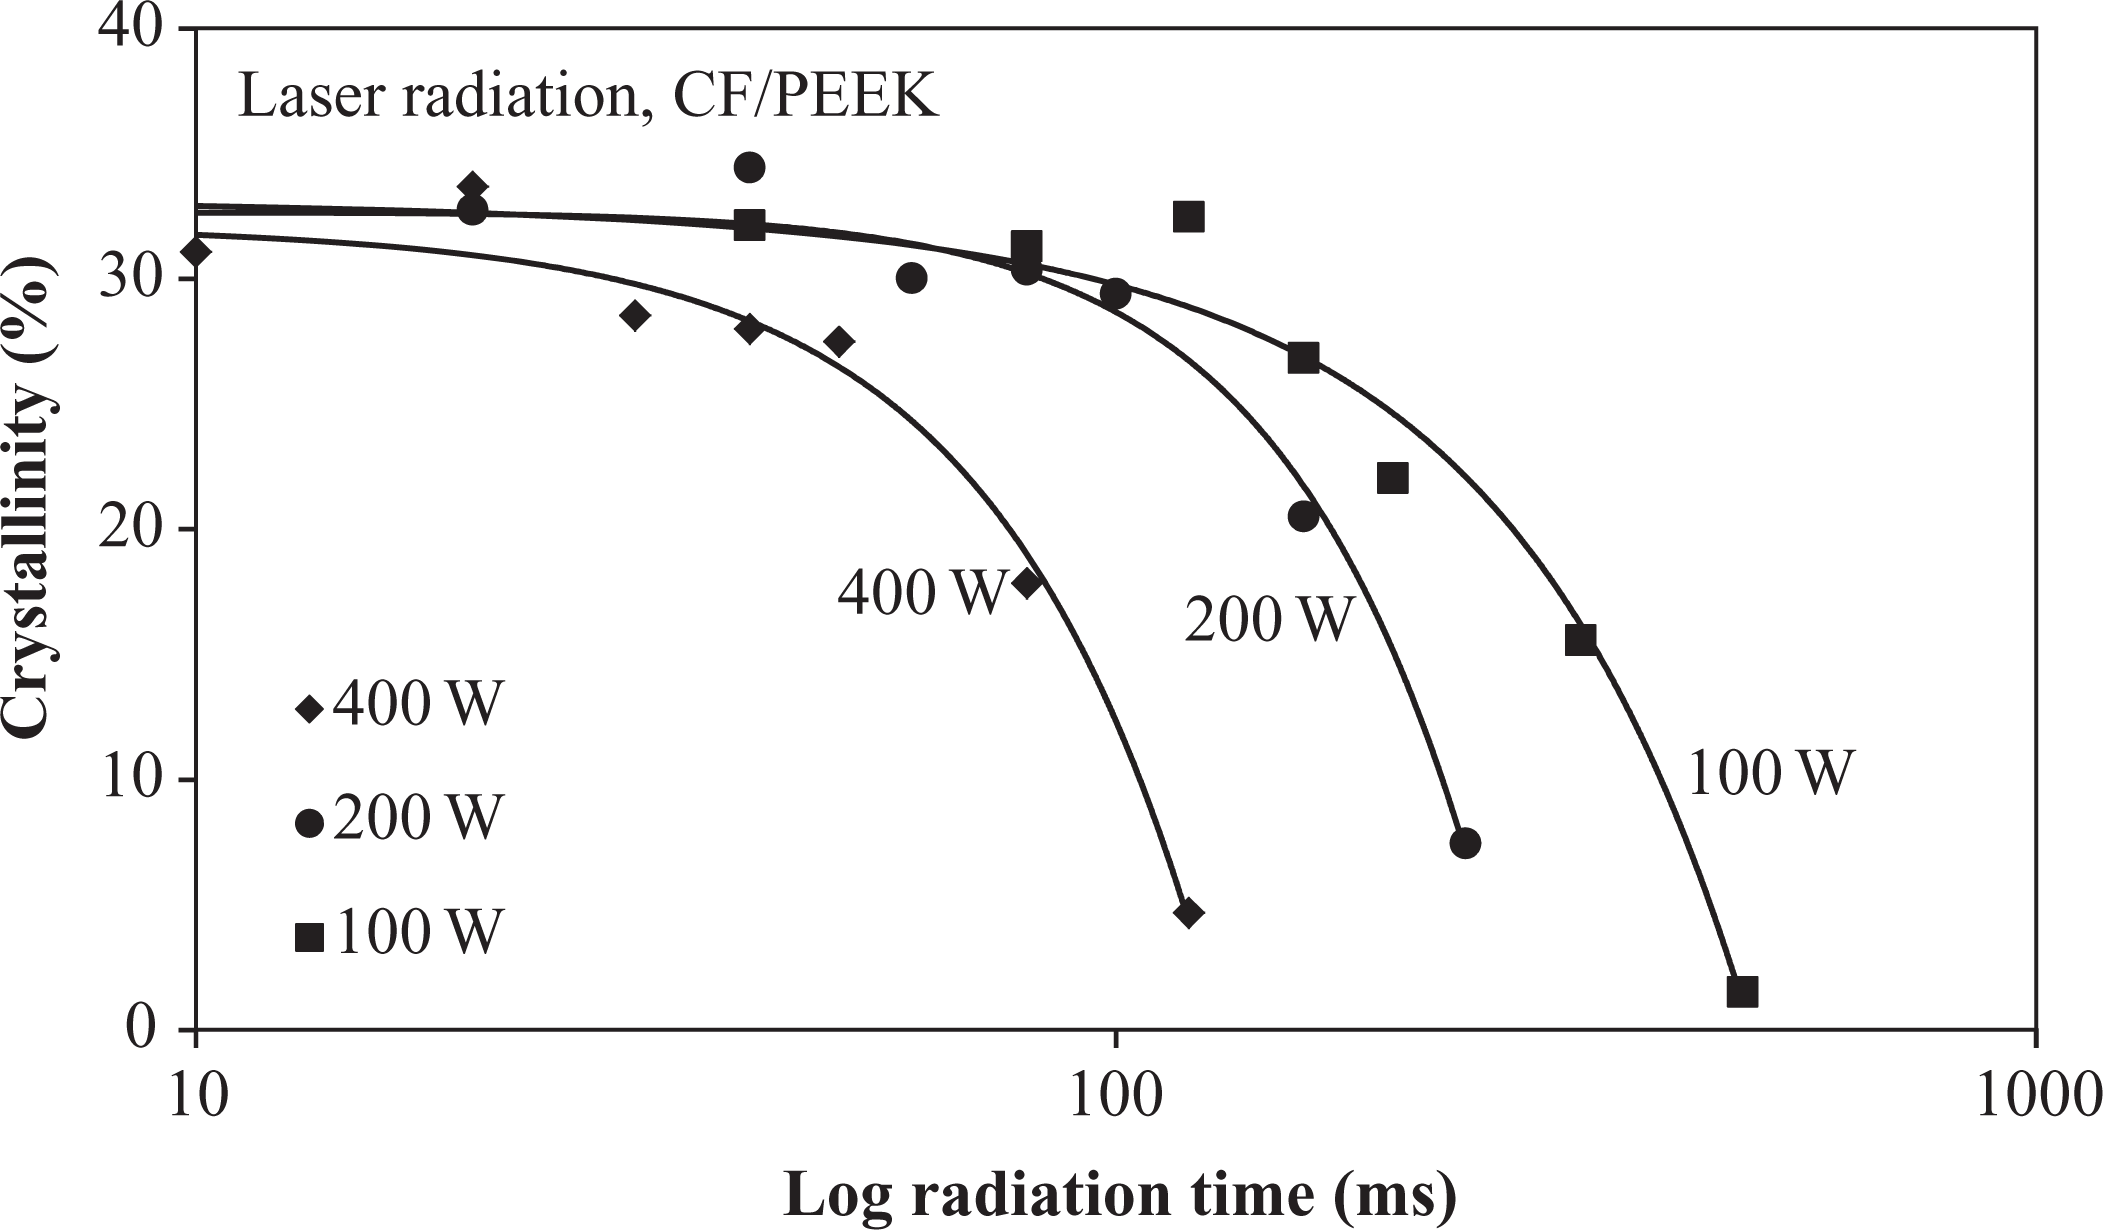
Crystallinity change of irradiated CF/PEEK specimens.
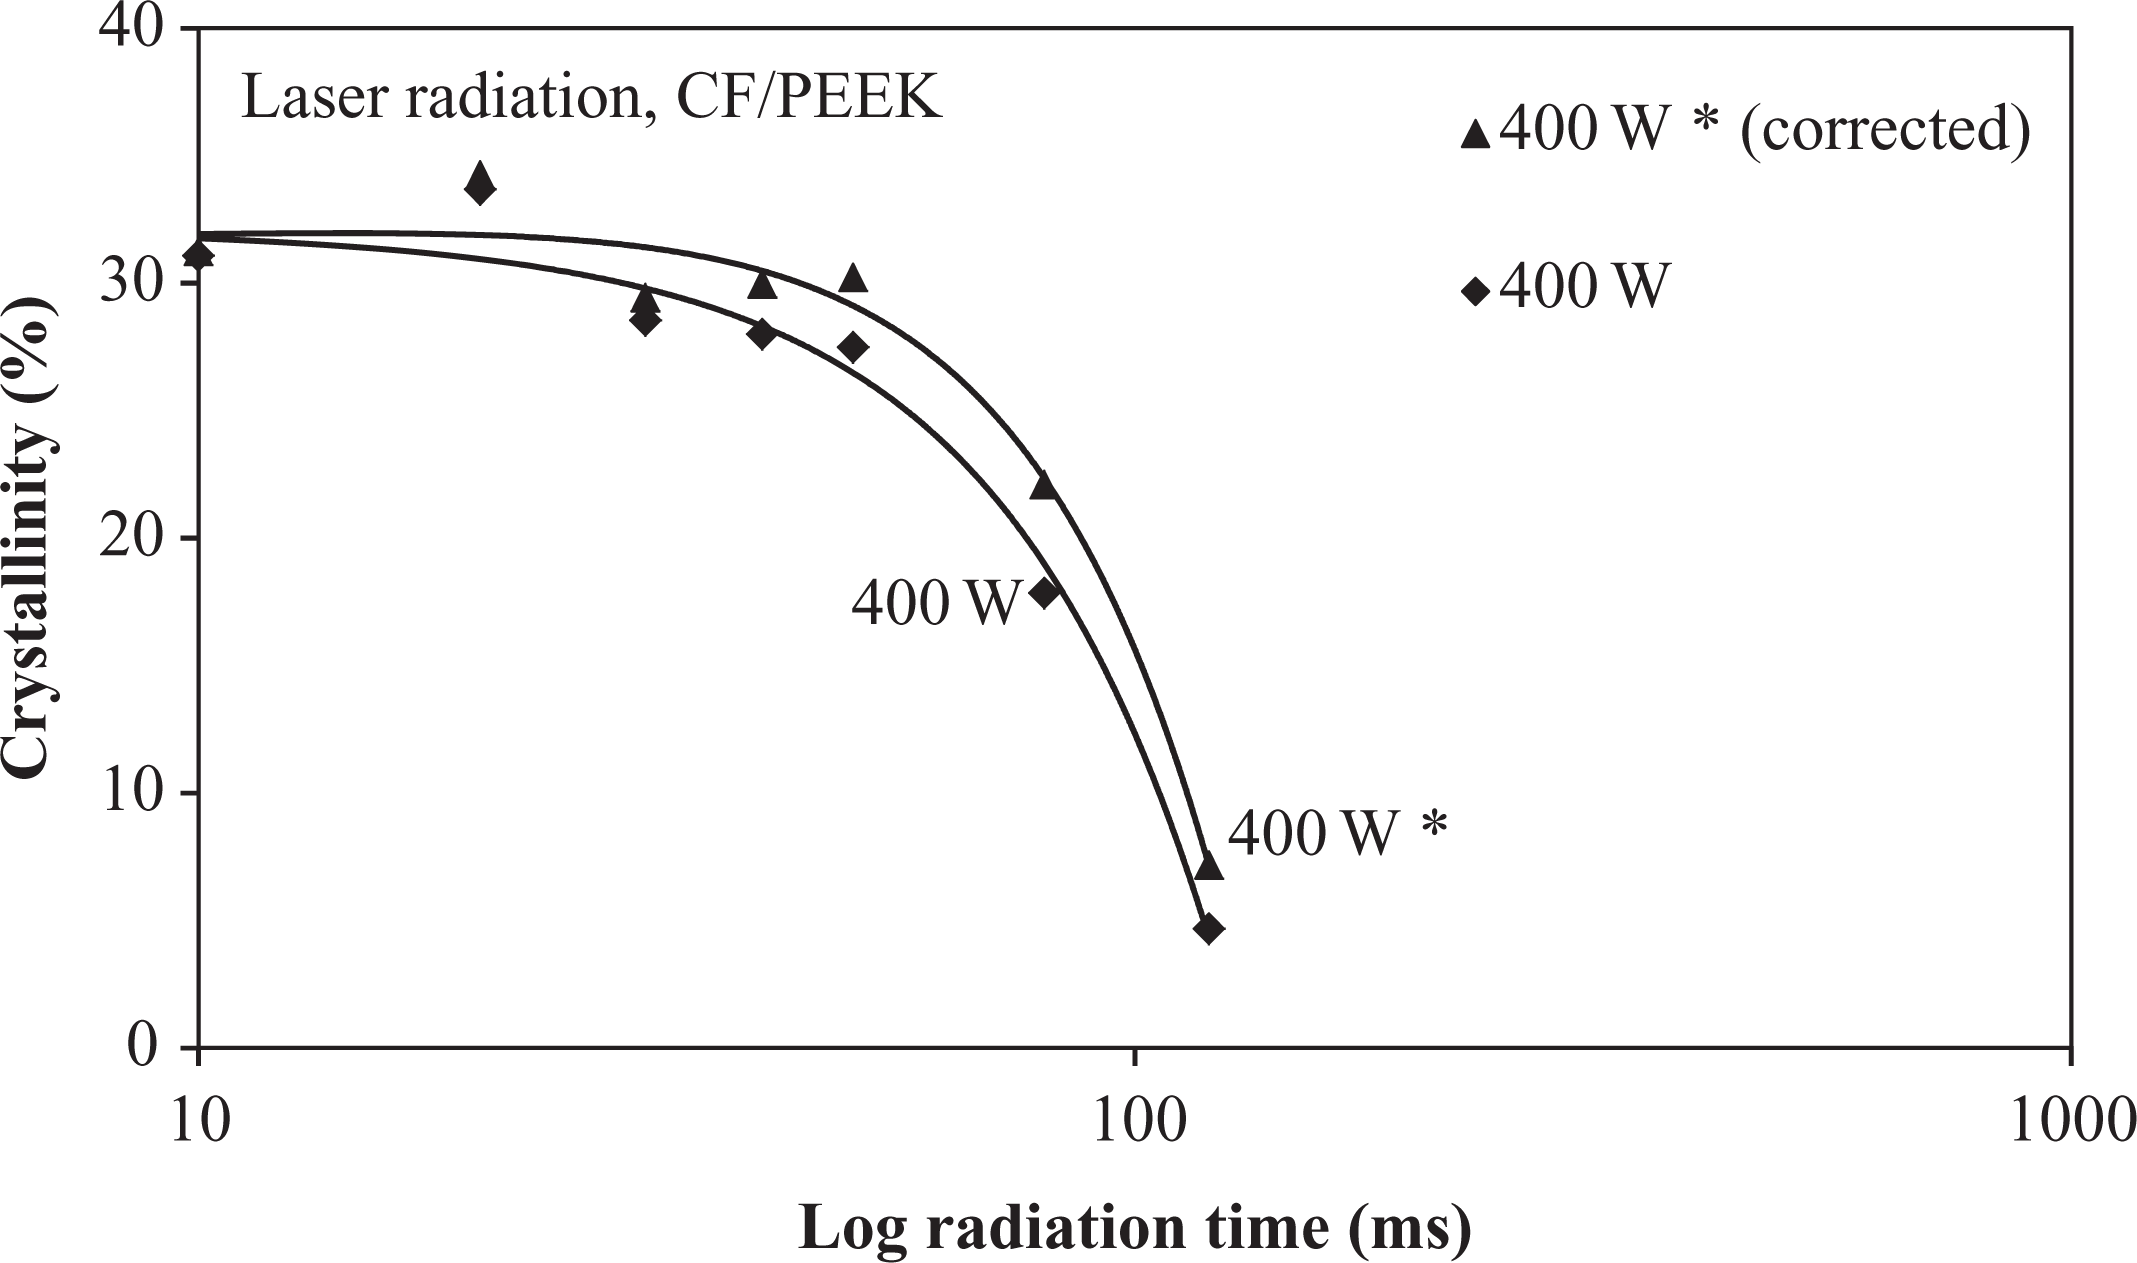
Corrected crystallinity (asterisk) of irradiated CF/PEEK specimens at 400 W laser power.
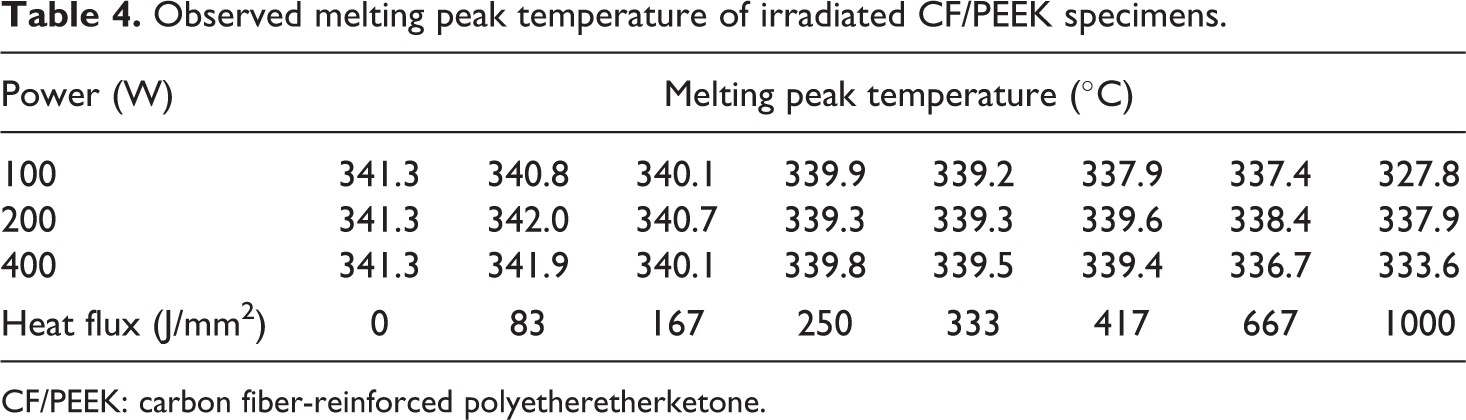
Besides the crystallinity, the melting peak temperature and the melting extrapolated onset temperature were found decreasing with increasing heat flux (Tables 4 and 5). The melting temperature almost remained identical up to a heat flux of 667 J/mm2 and only declined less than 5°C in total, respectively. A similar decrease in melting temperature has been observed by Ma et al. before, who have investigated the change in thermal properties of APC-2 prepreg (CF/PEEK) subjected to 380°C in air for 10 min. 30 In general, the reduction in melting temperature is assigned to chain scissoring effects and polymeric transformation. 31,32
Observed melting peak temperature of irradiated CF/PEEK specimens.
CF/PEEK: carbon fiber-reinforced polyetheretherketone.
Measured melting extrapolated onset temperature of irradiated CF/PEEK specimens.
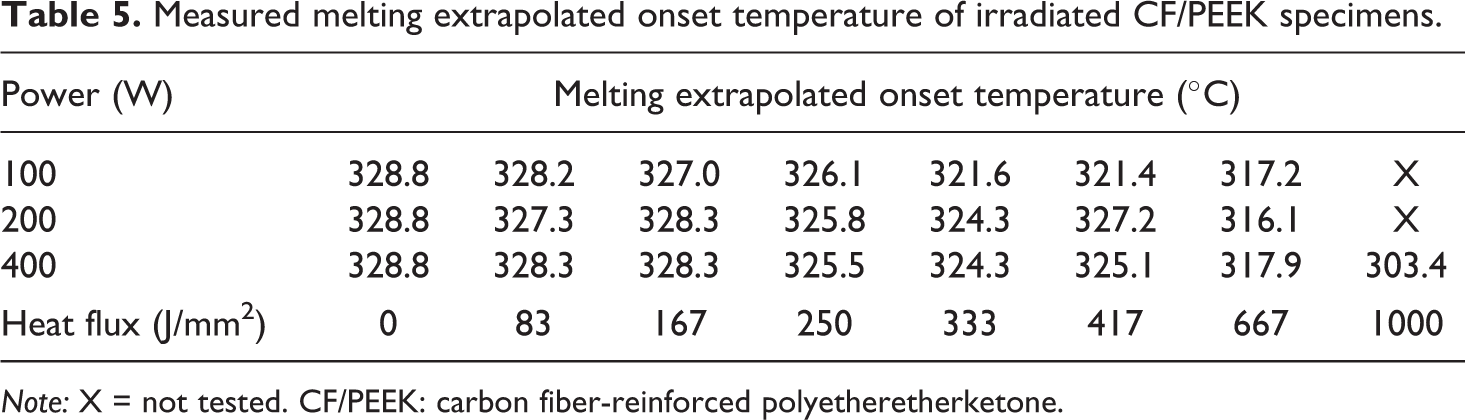
Note: X = not tested. CF/PEEK: carbon fiber-reinforced polyetheretherketone.
The melting extrapolated end temperature decreased 3°C in maximum even under severe radiation conditions. This temperature does not seem to be relevant for the quantification of degradation. In contrast, the melting extrapolated onset temperature decreased significantly. Nevertheless, significant changes began to occur at heat fluxes greater than 250 /mm2, at which already 4% of the polymer weight was lost. Consequently, the sensitivity of this value has to be carefully evaluated. In this context, the specimens with a heat flux of 417 J/mm2 do not follow the overall trend and revealed an increase in the melting extrapolated onset temperature compared to the configuration with 333 J/mm2. The decrease in the melting onset temperature indicates a chain length reduction, which is attributed to random chain scissoring as it has been reported by Jonas et al. for different melt holding temperatures and time. 33
The overall spectra intensity significantly changes from measurement to measurement because it is dependent on the contact area between specimen and prism. Since a correlation of the contact area and the overall spectra by white light profilometry was not successful due to the material compaction during clamping, all peaks were normalized on one distinct peak, which delivered reliable results without noise. In this regard, Cole and Casella identified the PEEK carbonyl peak at 1649 cm−1, phenyl ring stretching peaks at 1593 cm−1 and 1487 cm−1, and the carbon–hydrogen deformation at 1012 cm−1 as distinctive peaks. They normalized the peaks by the carbonyl peak at 1649 cm−1, which they identified to be the strongest one in their study. 34 In the presented study, the peak at 1649 cm−1 showed much noise in comparison to the phenyl ring stretching peaks. Therefore, the phenyl ring stretching at 1593 cm−1 was chosen as normalization reference. The obtained wavelength peak positions were similar to the results reported in the literature. 35,36 The spectra were related to a crystalline and an amorphous phase. In this study, the peaks for the amorphous phase were slightly shifted to lower wavelengths.
Moreover, the CFs significantly decreased the measured signal in comparison to neat PEEK. For the correction of the measured spectra, the fact that neat PEEK has nearly no influence on the intensity between the wavelengths of 1700 cm−1 and 4000 cm−1 was used. The decrease in intensity between these borders was thus taken to correct the phenyl stretching peak at 1593 cm−1. It could be proven that the decrease was dependent on the fiber volume fraction, the penetration depth, and the contact area. Deeper investigations of the fiber volume fraction indicated that the amount of fibers near the surface was nearly constant; only the amount of polymer was decreasing due to ablation and vaporization. In this context, it is annotated that carbon black, which might be a degradation product in the degradation process, was able to decrease the intensity in a similar way as observed with the CFs. Since a probably appearing carbon black effect could not be clearly distinguished from the CFs in the presented method, the carbon black influence was neglected and attributed to the fibers, respectively.
The changes in relative peak intensity normalized by the 1593 cm−1 peak occurred in the finger print region of PEEK and were mainly identified as the carbonyl stretching band, the in-plane phenyl ring vibration, the aromatic hydrogen deformation, and the ether group stretching. All investigated peaks are listed in Table 6.
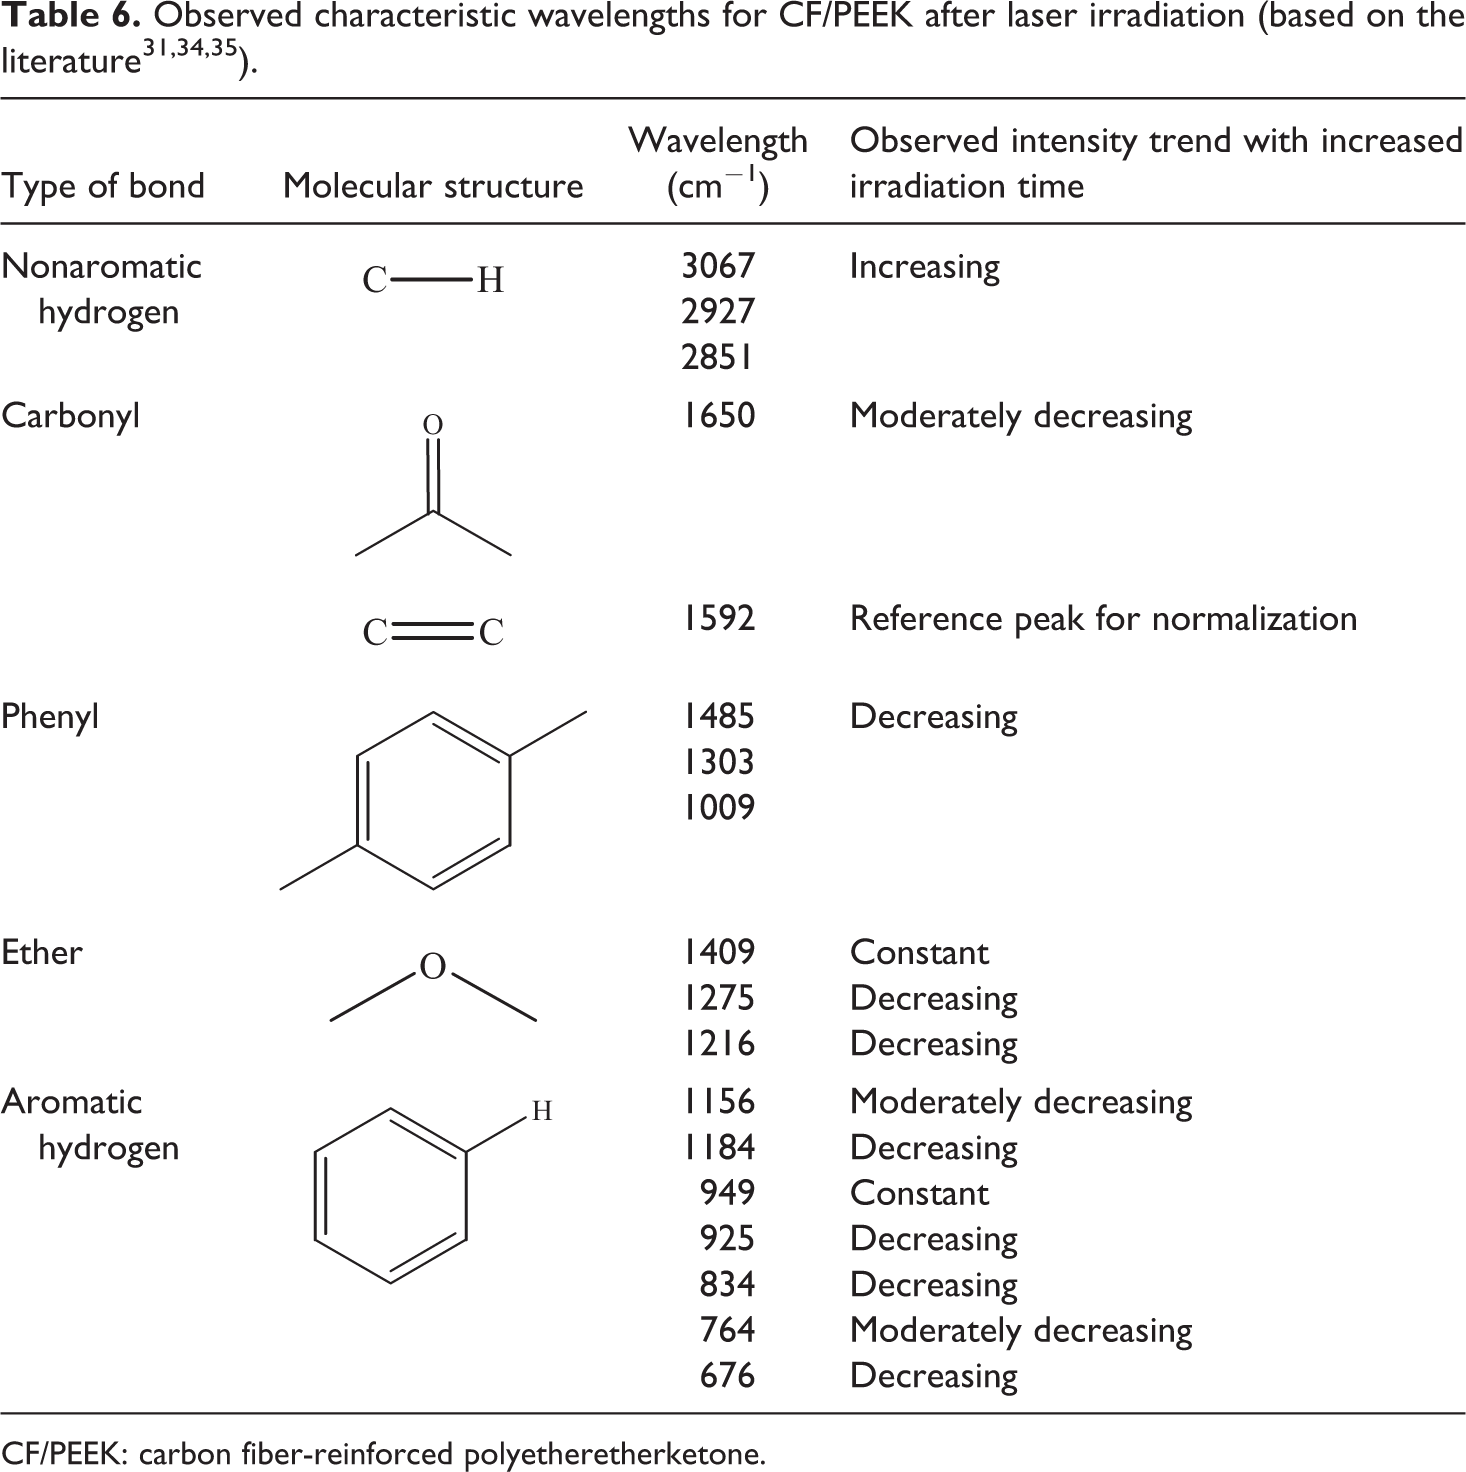
CF/PEEK: carbon fiber-reinforced polyetheretherketone.
Generally for CF/PEEK, a lot of random noise for radiation times exceeding 100 ms was found in the region of 1800 cm−1 to 1600 cm−1, which made an evaluation impossible. Unless reported by other researchers, the 1649 cm−1 peak did not shift to higher wave numbers up to 100 ms. 34,35 The relative intensities of the aromatic hydrogen bond decreased, which was associated with chain scission at the link to the phenyl ring. The degradation product of the cracked phenyl rings form new nonaromatic hydrogen carbons bonds at 2851 cm−1, 2927 cm−1, and 3067 cm−1. Since their respective peak heights were very small, a quantitative analysis was impossible. Giancaterina et al. had also observed these peaks during the irradiation of PEEK with polychromatic light in the presence of air. 37 They stated that these peaks were strongly time dependent and primarily occurred after 5 h of ultraviolet radiation under vacuum conditions. Also in other publications, the peaks were identified as degradation products. 38,39,40 The relative intensities at the wavelength of the phenyl ring decreased linearly with radiation time. The rings were assumed to break up and cross-link with the surrounding polymer or the atmosphere.
In comparison to long-time degradation studies, the ether stretching at 1217 cm−1 did not decline by showing a shoulder growth in this study. 34 Additional degradation products with long-time tests between 40 min and 330 min at 430°C to 485°C were observed by Cole and Casella at 1711 cm−1 and 1739 cm−1, but were not found in this study, either. 34
For an exemplary laser power of 200 W, the most interesting changing wavelength peaks at short-time heated materials exhibited a linear decrease up to 160 ms (Figure 9). At radiation times higher than 160 ms, the spectra were found to be similar to the ones of neat CFs due to extensive polymer ablation and vaporization. This shows that the FTIR method is especially sensitive in the ultra short-time range. By the observation of the presented wavelength peaks, it is possible to identify and even quantify different degradation states of CF/PEEK tapes.
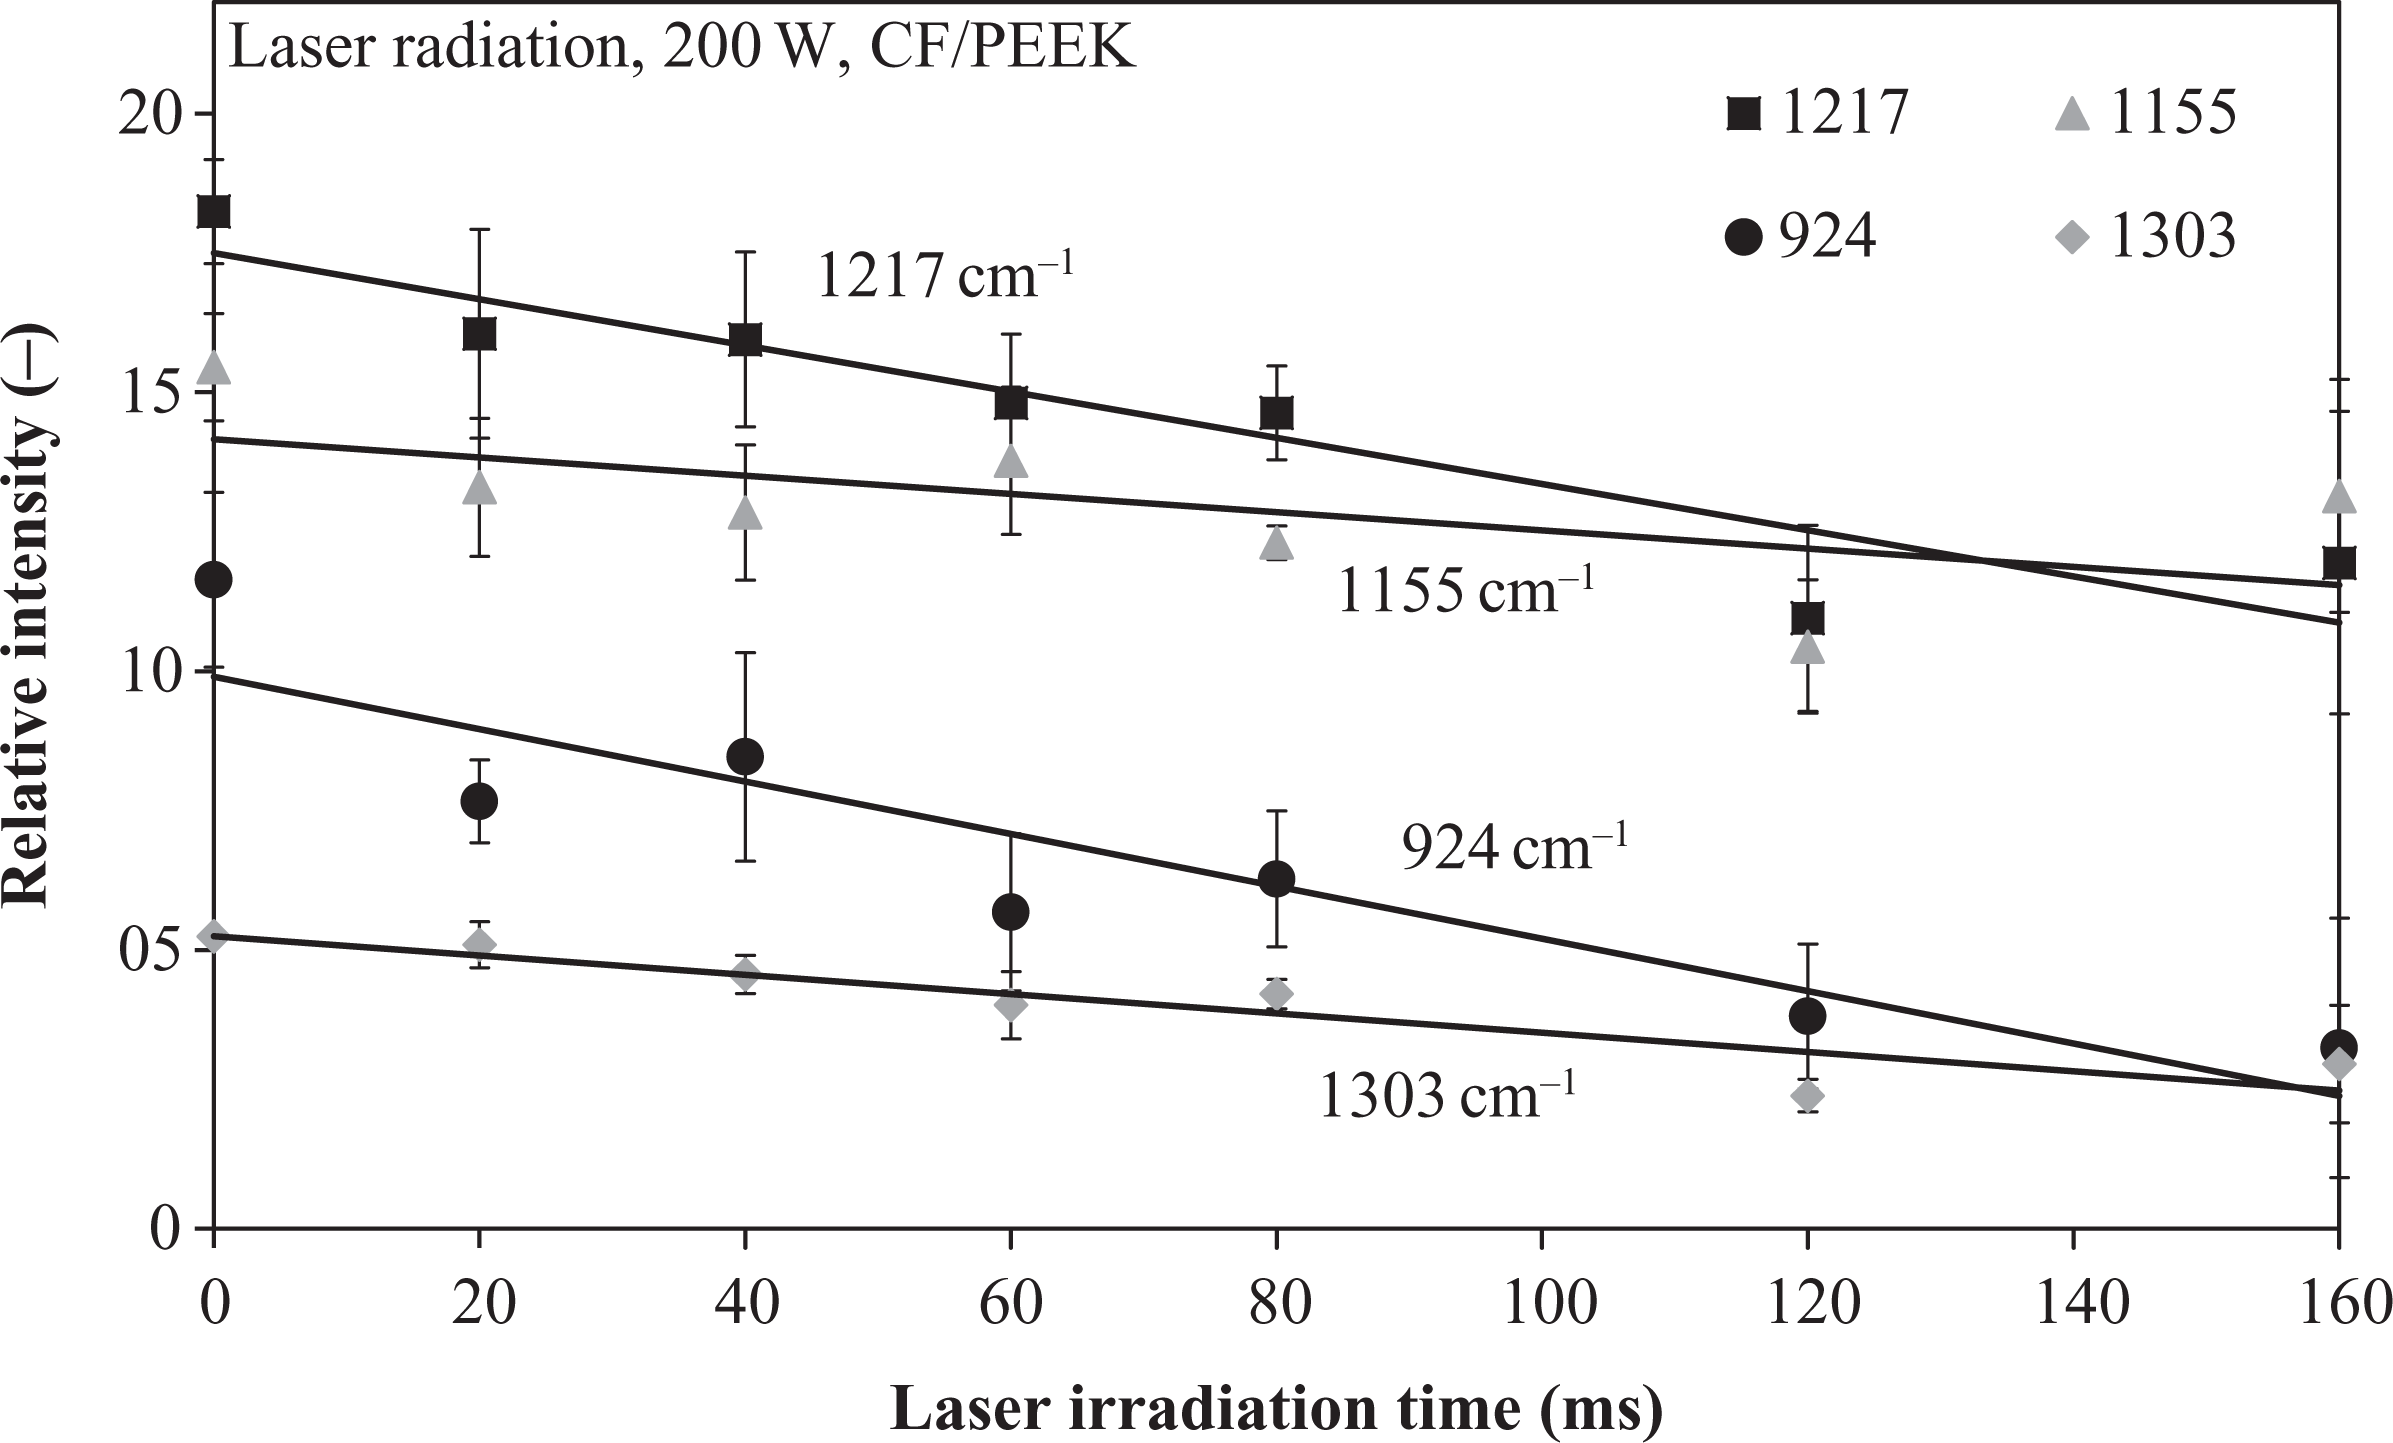
Fourier transform infrared spectroscopy analysis of irradiated CF/PEEK specimens with 200 W laser power.
Neat and iron doped HDPE
During the IR radiation experiments with HDPE, the energy input was sufficient to severely damage the samples after 30–40 s. Except for the very short-time heated samples up to 30 s, the heating was always accompanied by a formation of smoke. Neat material, which had a bright white color in nondegraded state, offered a good opportunity to observe the visible morphological changes during IR radiation. The material darkening started after approximately 30 s, but was hardly visible at the beginning. With increasing radiation time, the surface changed from bright white to a light-brown (Figure 10). The visual impression of degradation was validated by means of the DSC to obtain a series for the impact of degradation on the polymer’s melting peak temperature (Figure 11). For both HDPE compounds, neat and iron doped, IR radiation had a significant influence on the melting temperature. It decreased with increasing radiation time revealing the shape of a linear function in the investigated experimental boundaries. Both compounds showed nearly the same melting temperature decrease, so that an influence of the iron particles could be negated in this case. The behavior conformed to the experiments with long-cycle heated HDPE materials observed by Földes et al. 41 The effect was assigned to chain scissoring and polymeric transformation. Both degradation mechanisms were triggered by the IR radiation and finally led to a reduced melting temperature. 31,32 In contrast to the melting temperature, no significant relation was found between degree of crystallization, visible degradation, and radiation time, respectively. The degree of crystallization remained unaffected from the degradation state at 70–73%.
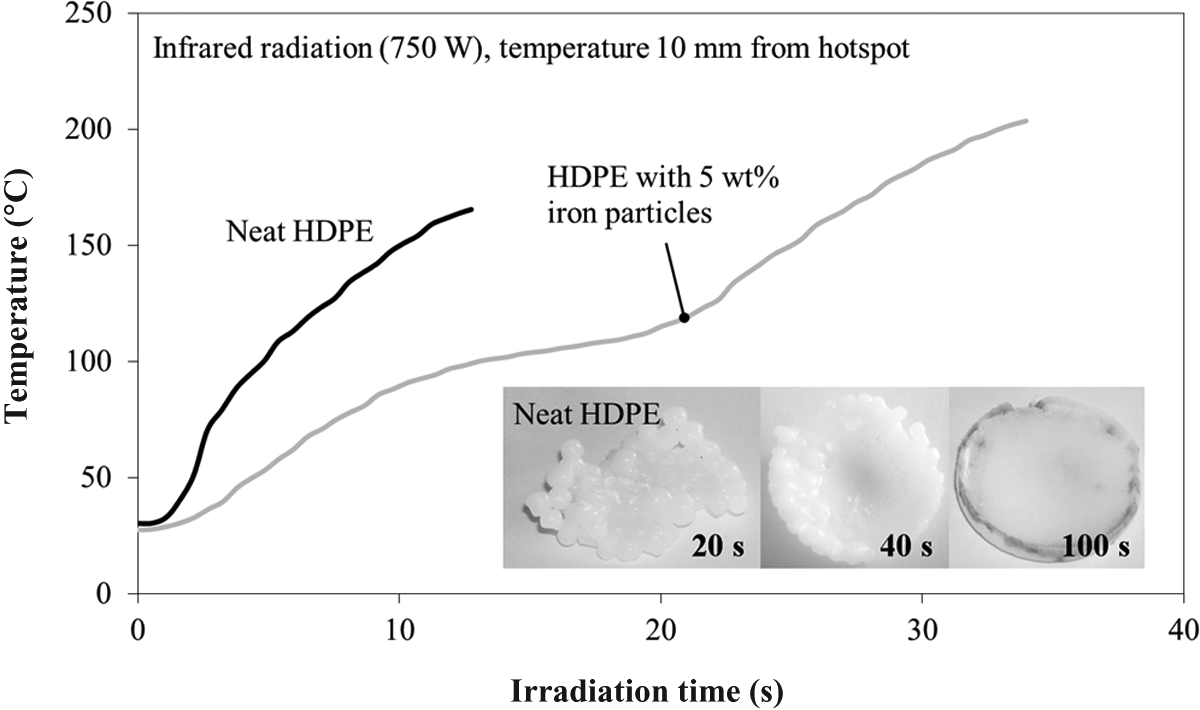
Temperature evolution and morphology of HDPE during infrared radiation with a 750 W spot.
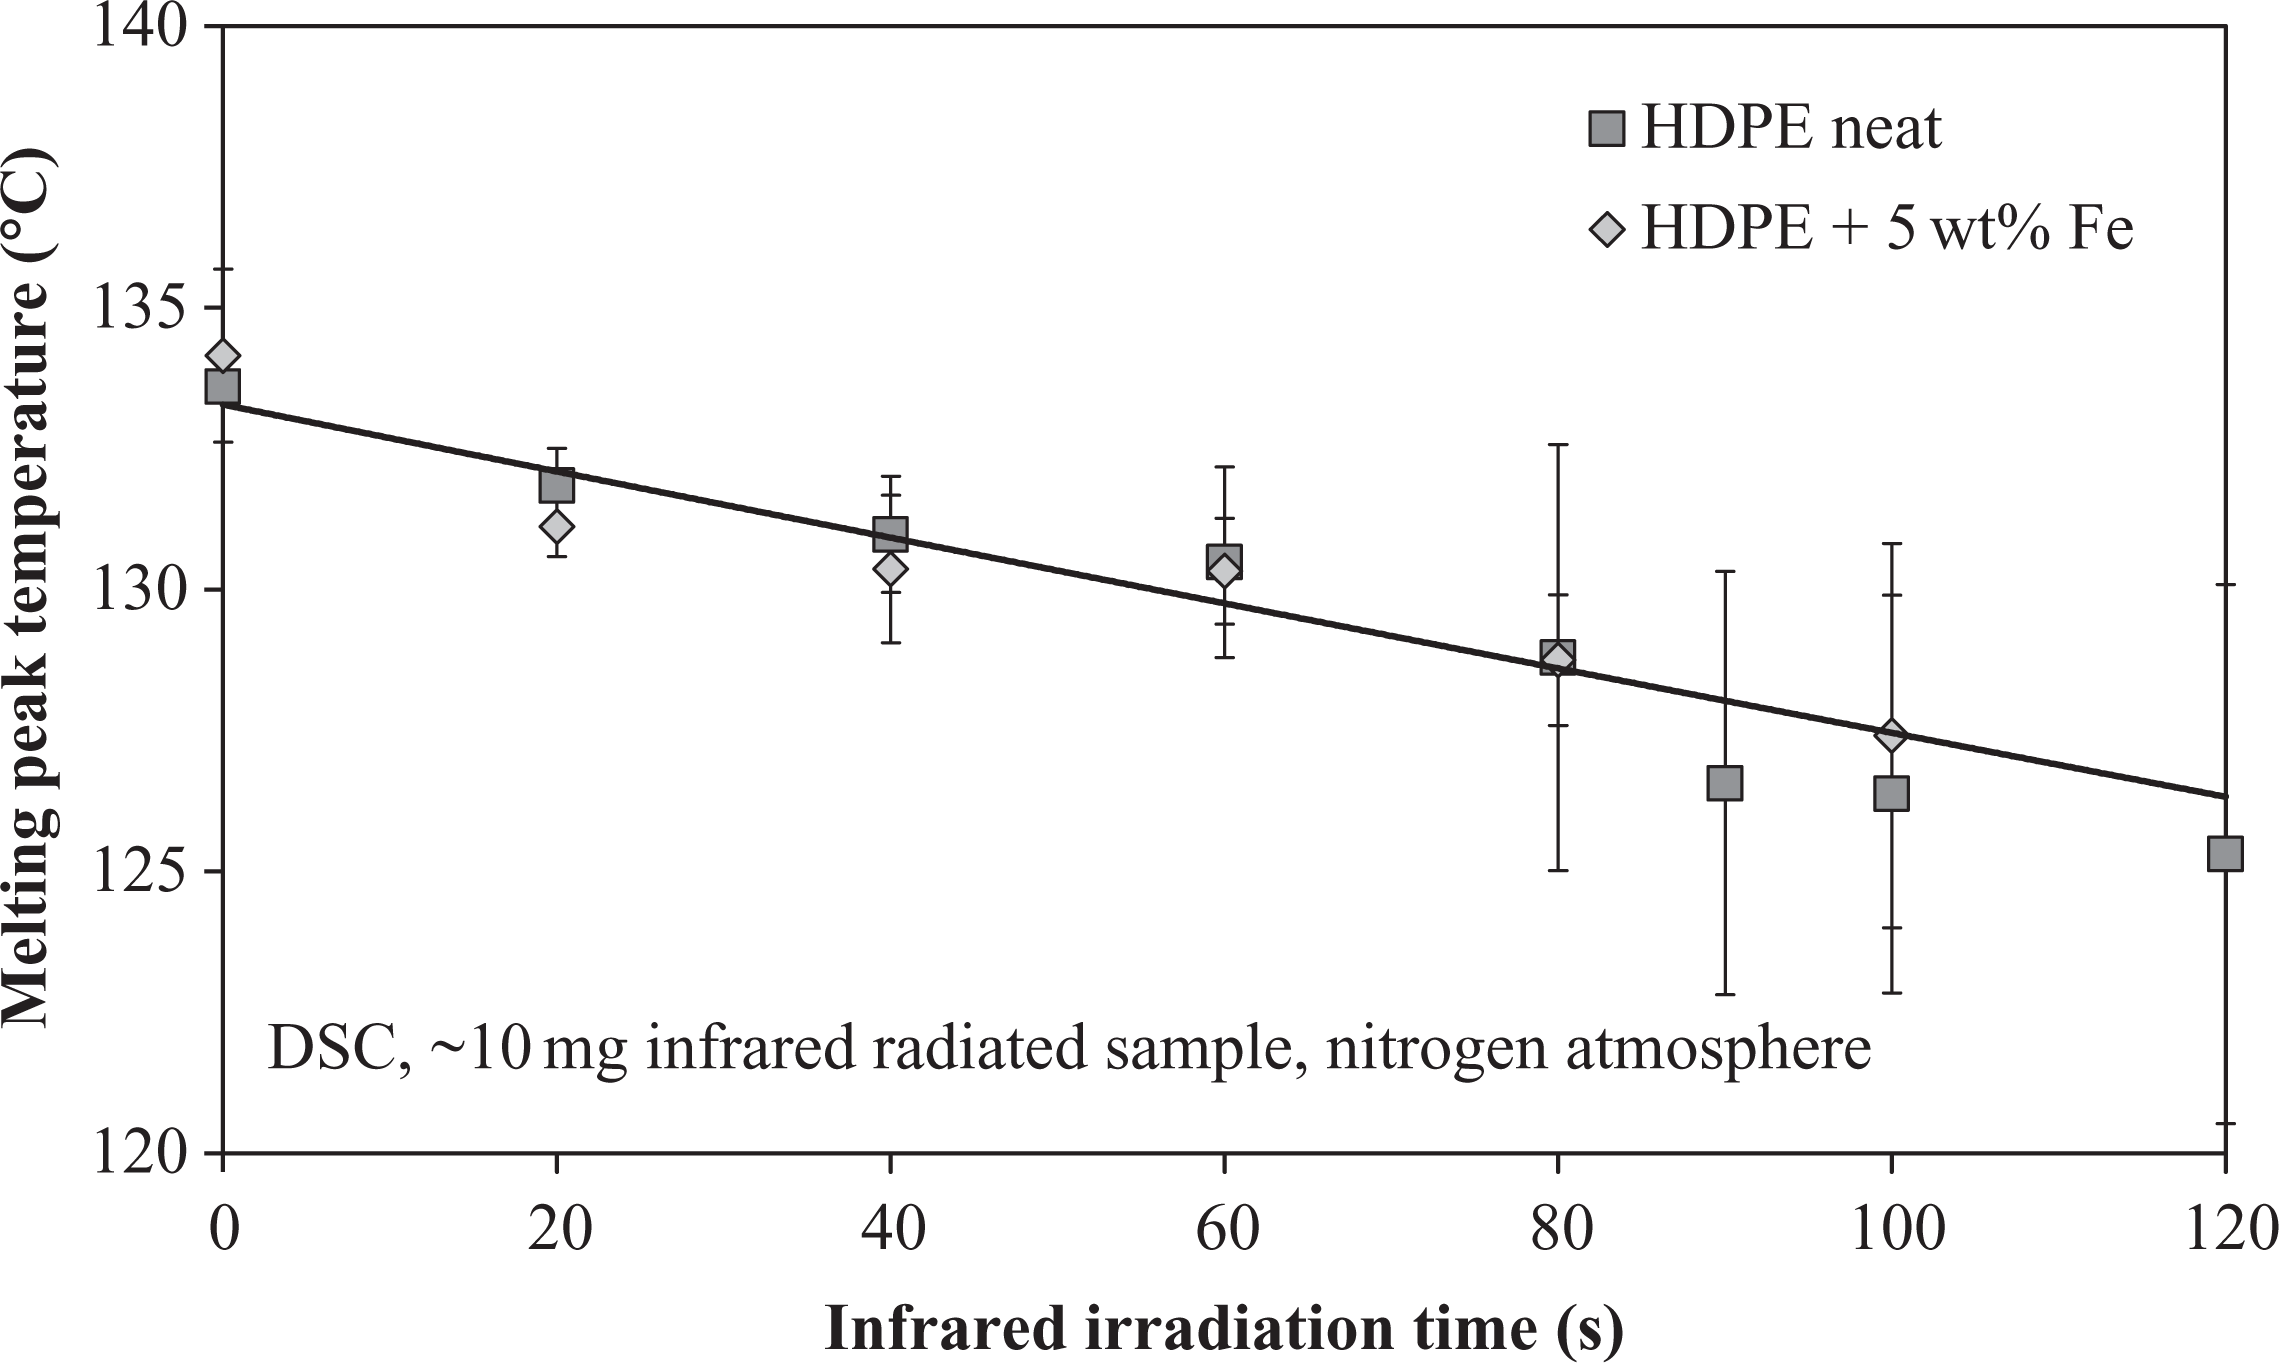
Melting peak temperature changes in HDPE after infrared radiation.
Nevertheless, a second melting peak appeared at IR radiation times longer than 80 s. The peak lay thermally before the primary melting peak (Figure 12). Since it was formed only at higher degradation states, it was attributed to a morphological polymeric change and marked a further possibility to qualify the degradation state of HDPE material. Similar observations have been described for PEEK and polypropylene before42,43 and were also observed with severely laser-degraded material in this study.
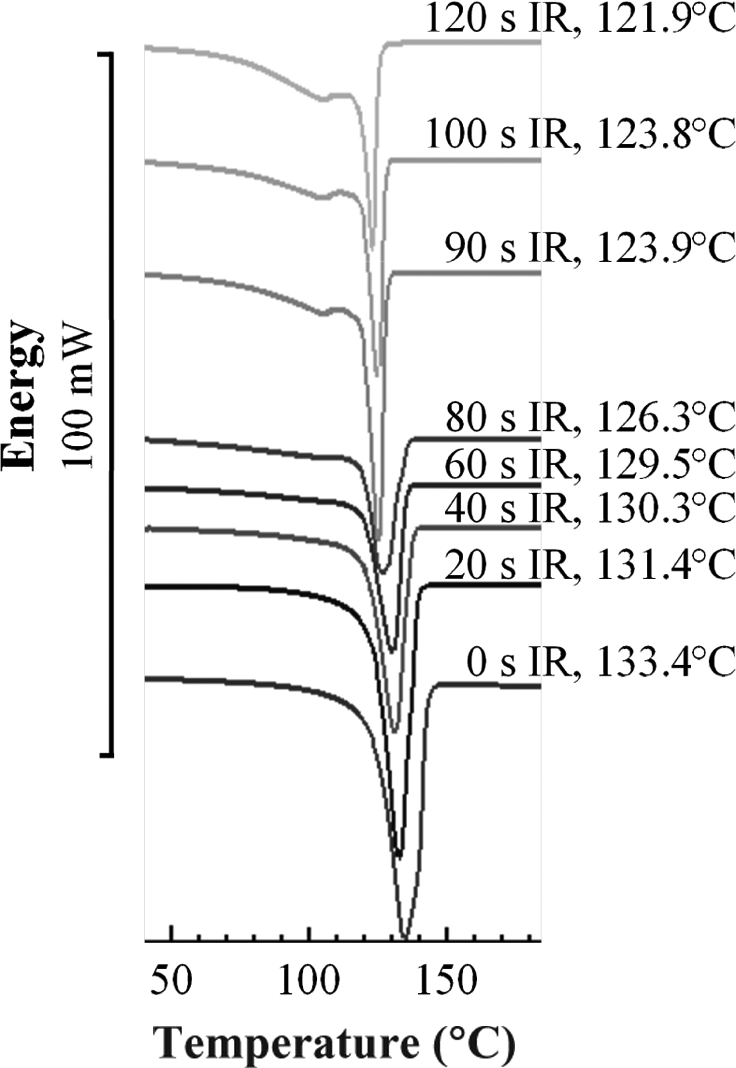
Occurrence of second melting peak with increasing infrared radiation time for HDPE. HDPE: high-density polyethylene.
The melting temperature evolution of laser radiated HDPE demonstrated a decreasing trend with increasing power and time (Figure 13). Nevertheless, at low power levels, up to 250 W, and very short heating time of 50 ms, the melting temperature nearly remained at the initial value.
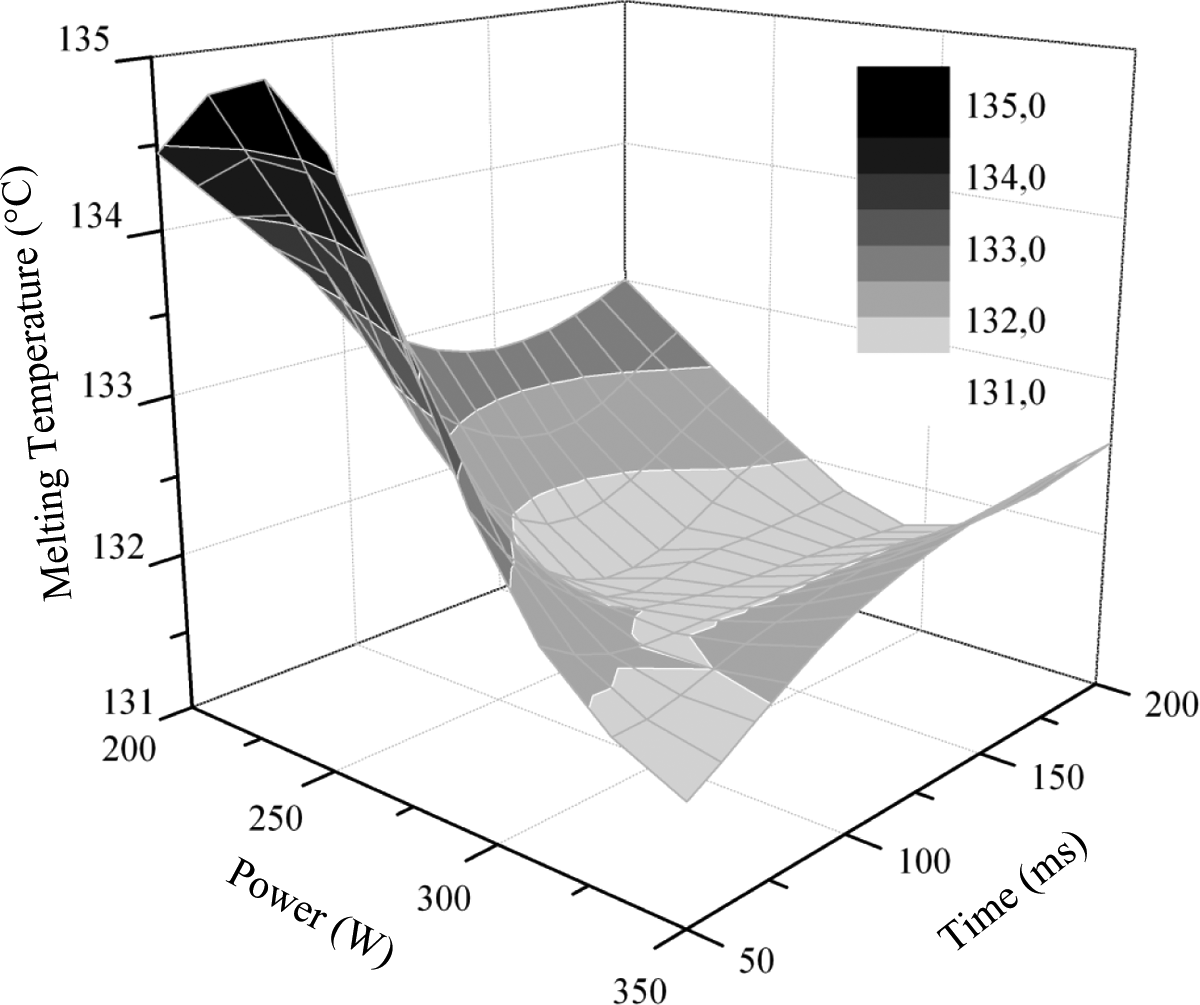
Melting temperature change of iron-doped HDPE caused by laser irradiation.
Upon comparing the melting temperature evolution of iron-doped HDPE for the different heating methods, the quickest temperature decrease was observed with laser heating (Figure 14). Although only 400 W laser power had been applied, the gradient was remarkably high and resulted in a decline of approximately 6°C after a radiation time of only 2s. This result implied that a high energy transfer rate had been provided by the laser, which made an accurate control inevitable in this case. The IR temperature drop began one chronological decade after the laser temperature decline, which can be attributed to the lower absorption at higher wavelength and the lower energy efficiency of the IR source. As described before, a significant decrease was also detected in this case. The melting temperature reduced to approximately 8°C after 100 s. In comparison to laser and IR radiation, the intrinsic particulate induction heating exhibited a different behavior. The melting temperature increased slightly up to 60 s radiation time. Afterward, the temperature declined again, but remained higher than its initial state until reaching 150 s radiation time. A reason for this behavior was found by an analysis of temperature evolution of a particulate heated sample (Figure 15). A complete melting of the sample was observed after 90 s of particulate induction heating. Consequently, the increase in melting temperature up to 60 s was attributed to the lower temperature of the (still nonmelted) sample during this period of time. Long-time heated polyethylene samples showed an increased molecular weight at temperatures below the melting temperature due to tempering effects. 14,15 It was assumed that this was also the triggering mechanism for the observed moderate melting temperature increase. In contrast, a longer radiation time led to higher temperature and reduced melting temperature.
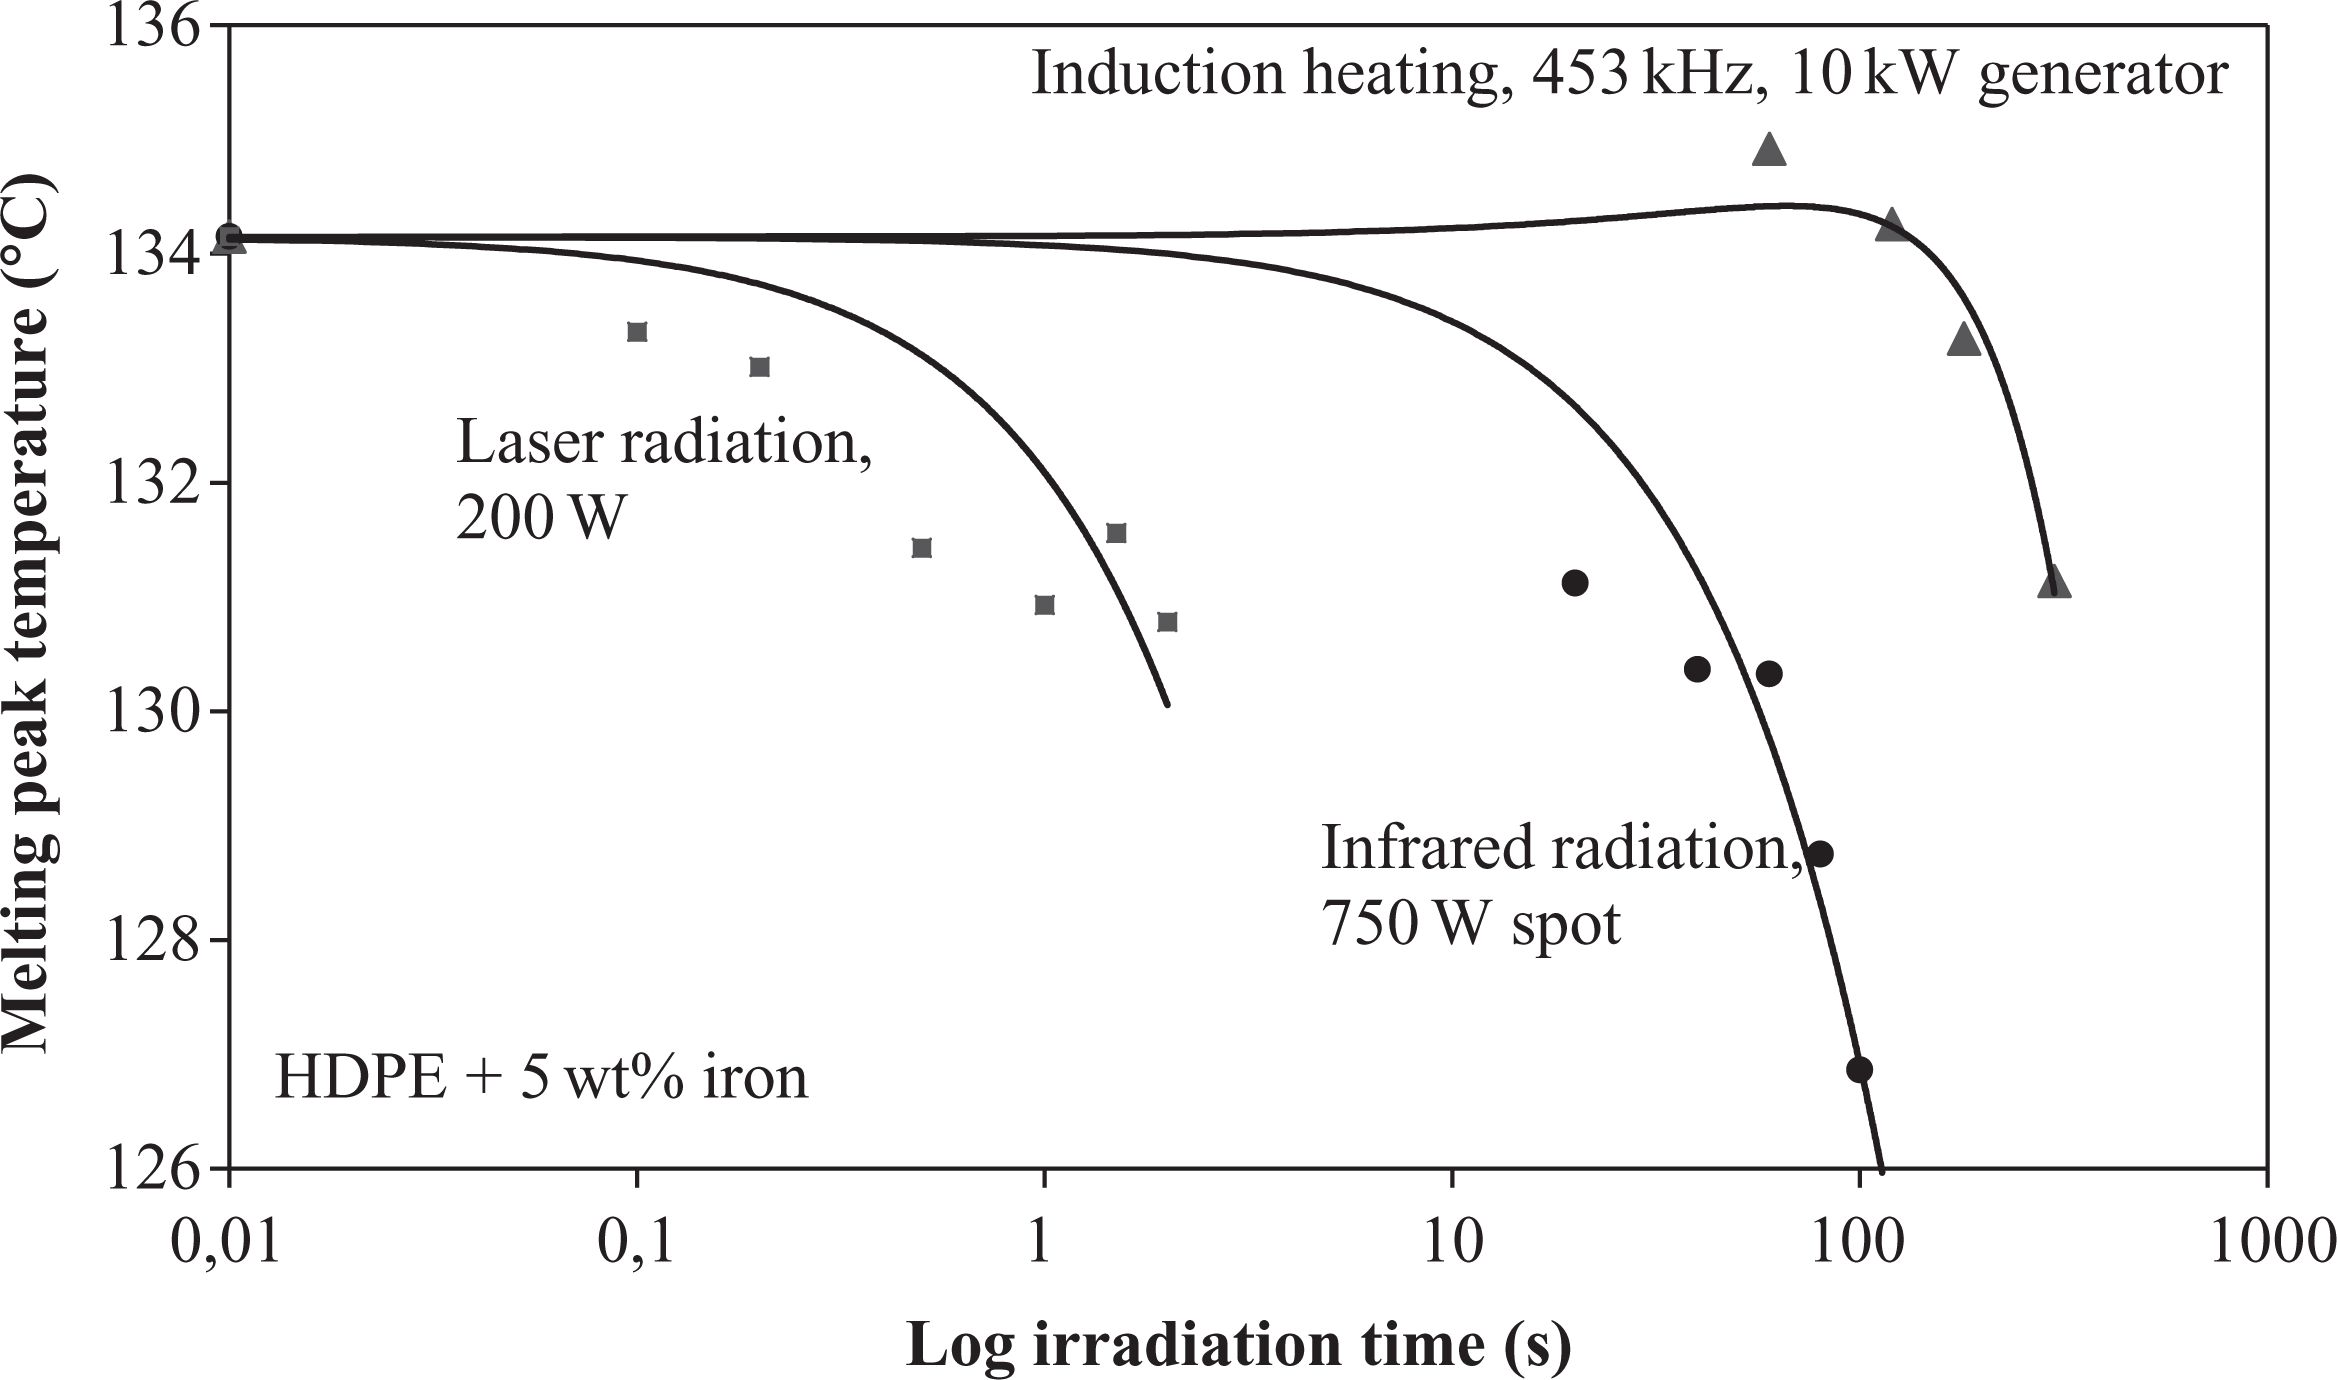
Comparison of melting temperature evolutions for different heating methods of HDPE.
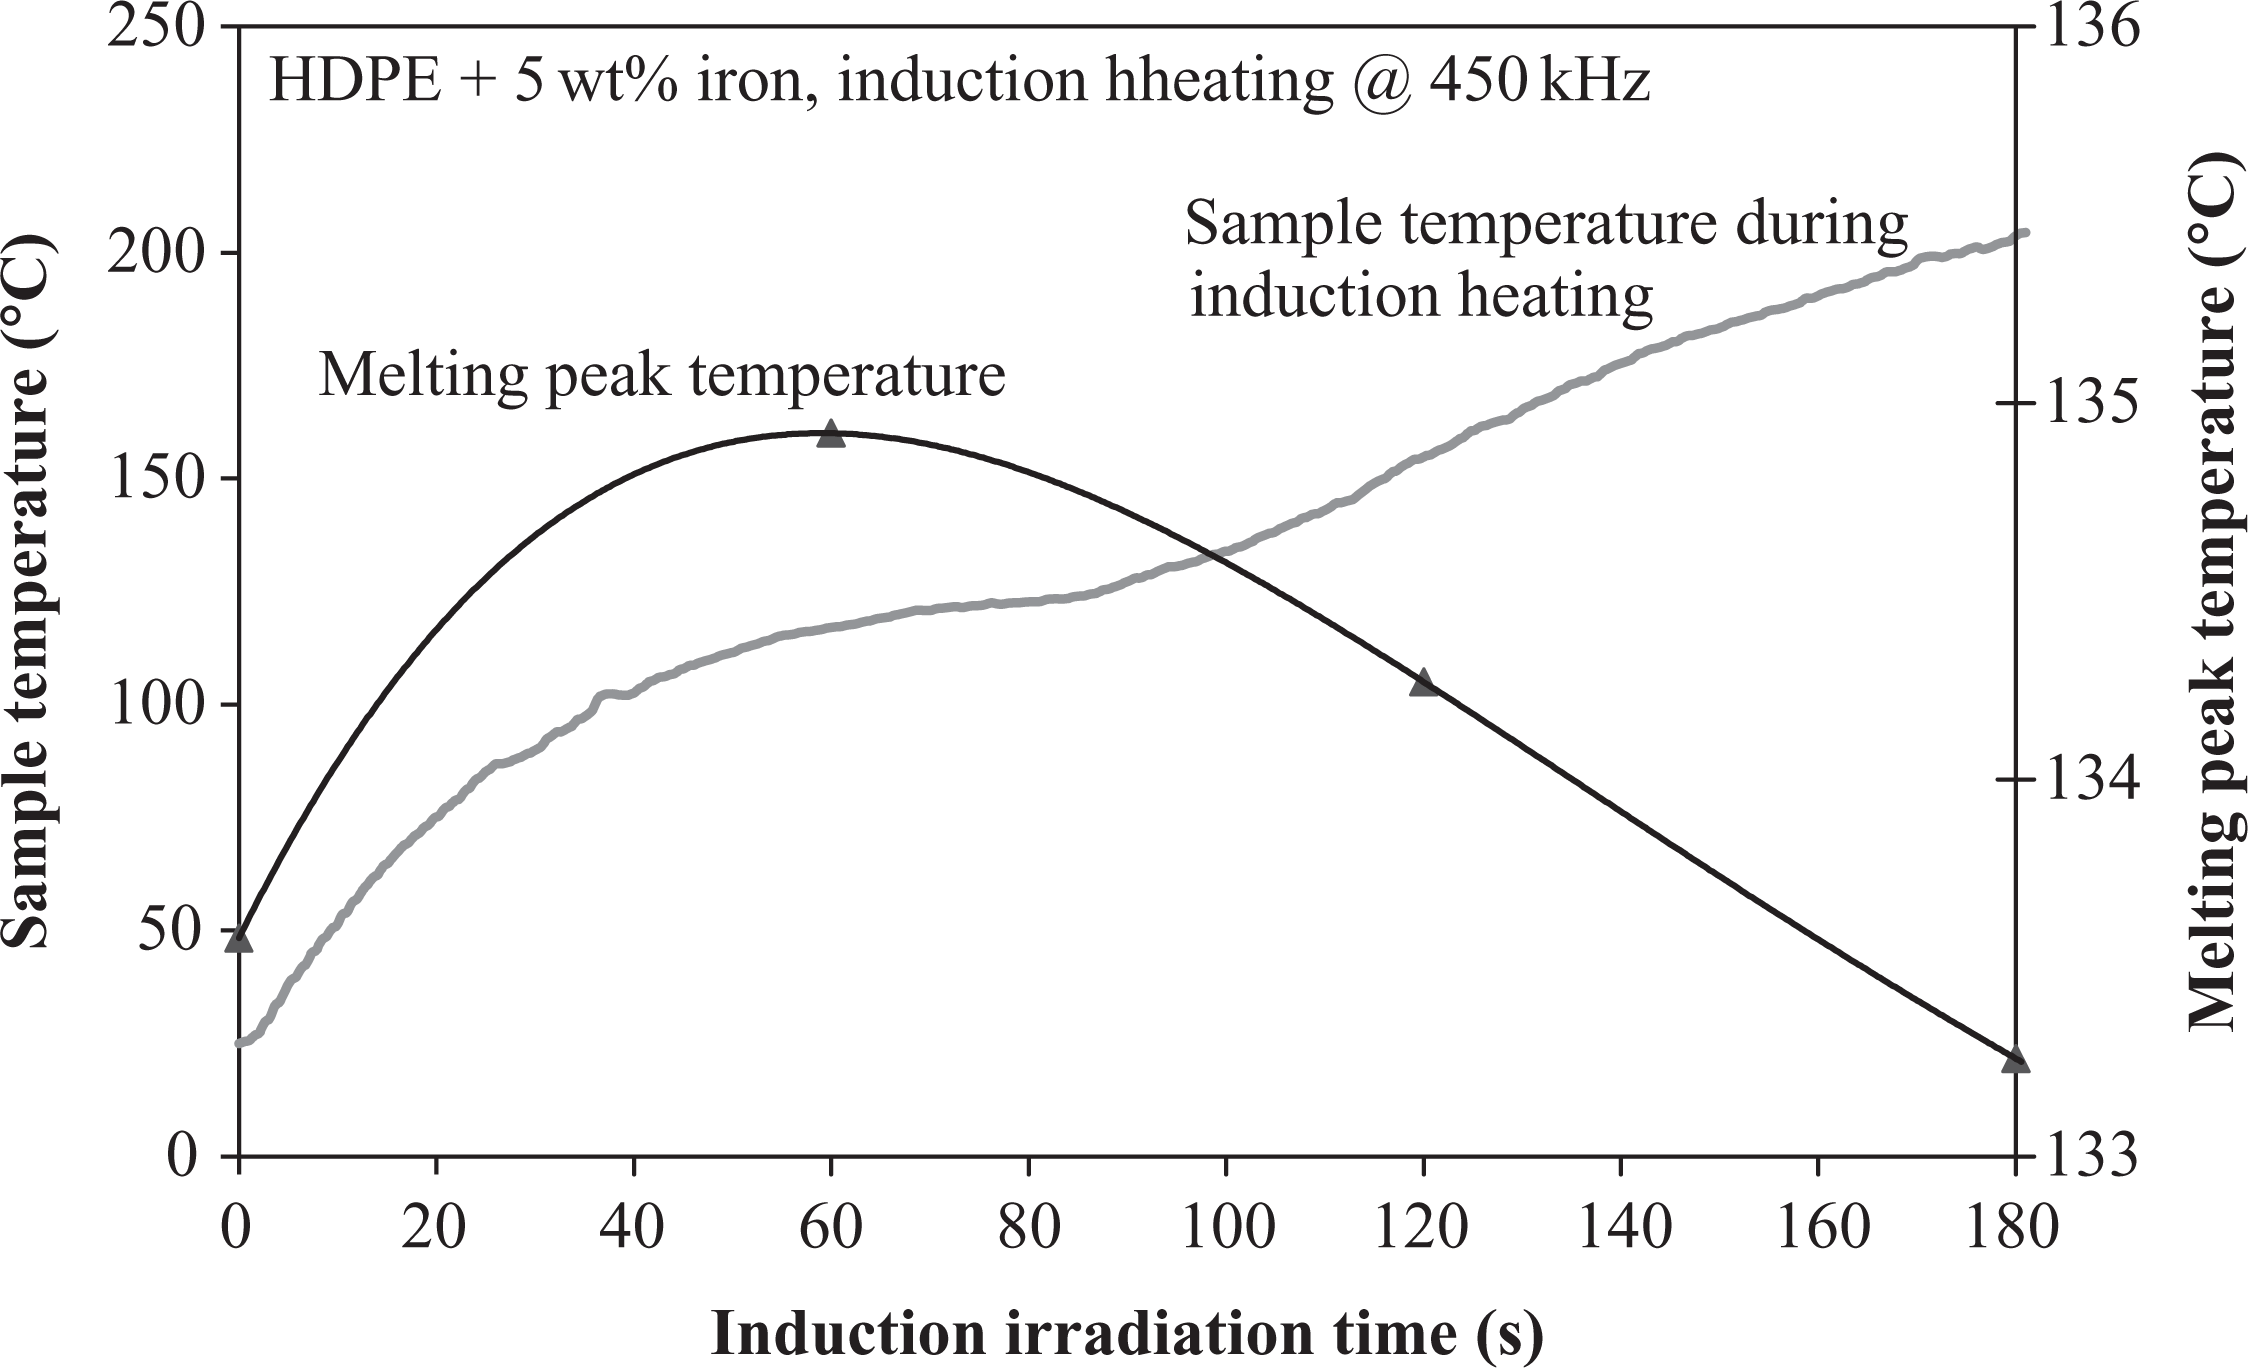
Temperature evolution of a particulate-heated sample in comparison to melting temperature decrease.
The SEM observations revealed an intense cracking of the HDPE surface after a 120 s exposition to IR radiation (Figure 16). The surface broke up in various areas and the cracks formed nuclei for the subsequent recrystallization process. Large uniform crystal structures were established around the cracks. The crystallites are only limited by each other. Within these structures, the crystallite growth was mainly oriented collinearly to the center point (Figure 17). By comparing the cryo-fractured surface of inductively heated iron-doped HDPE with a surface of a nonheated sample, no significant differences were assessed (Figures 18 and 19). Both the samples possessed the same morphology with parts of smooth plate-like structures and areas, which appeared more fractured. As described before in the experiments with iron oxide incorporated into polyphenylene oxide, no surface changes appeared. 44 The structure did not change in the vicinity of iron particles, either. In both the cases, heated and nonheated, the particles were well embedded in the matrix. Consequently, the SEM examination was not regarded as a suitable method for degradation analysis of intrinsically heated HDPE.
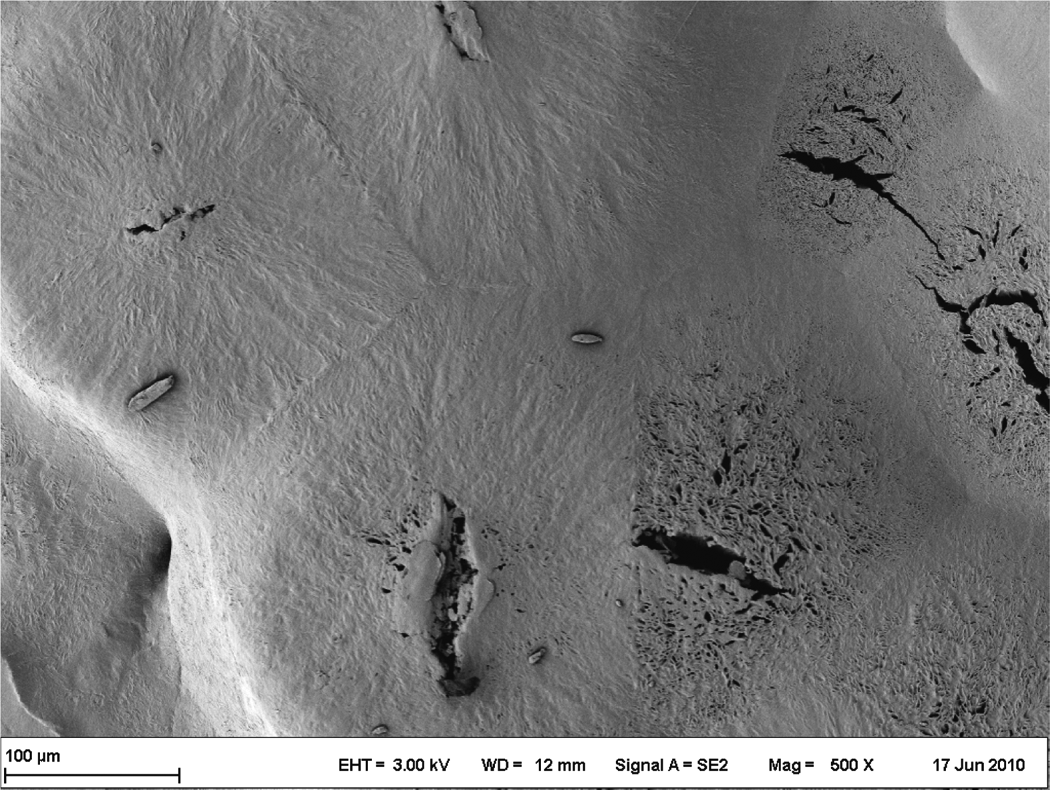
Scanning electron micrograph image of HDPE sample after 120 s infrared radiation. HDPE: high-density polyethylene.
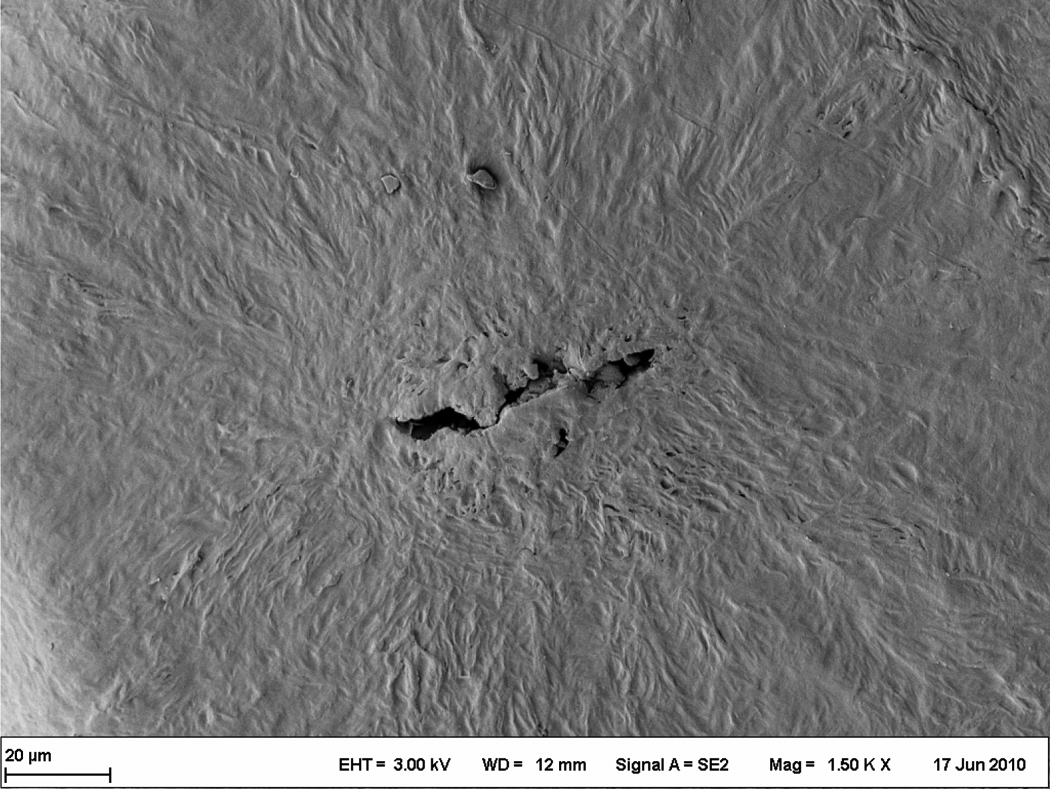
Scanning electron micrograph image of crack in the HDPE surface after 120 s infrared radiation (detail).
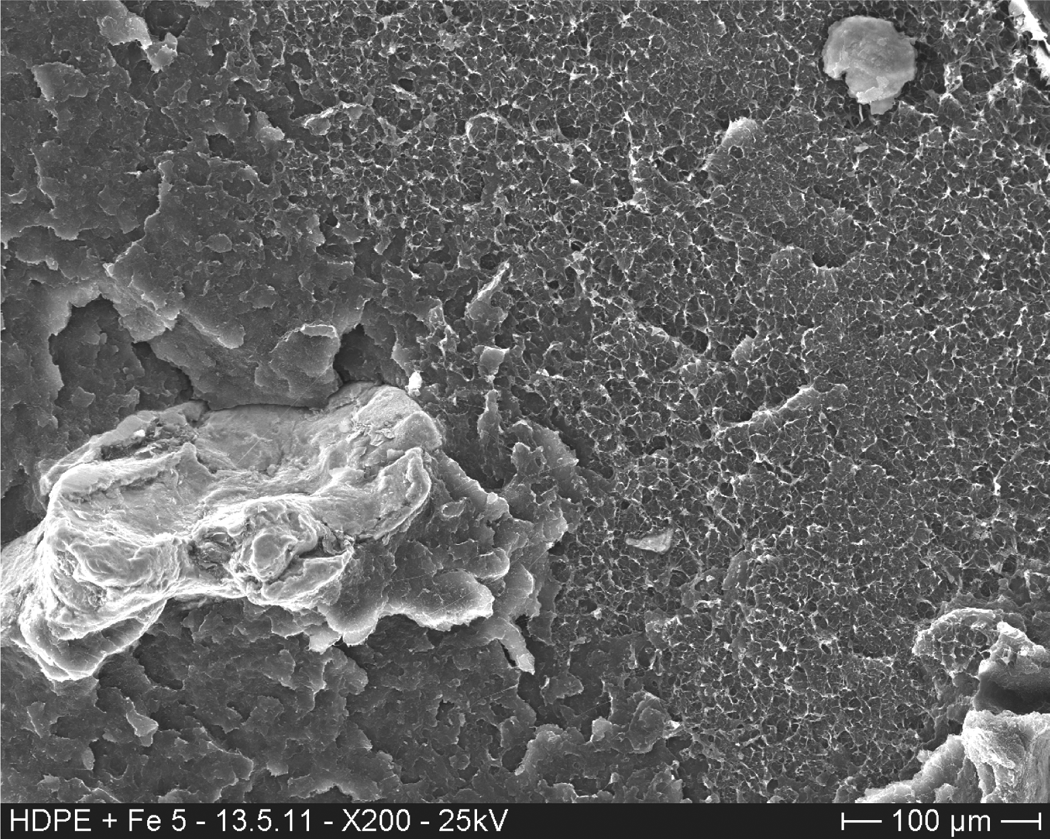
Cryo-fractured surface of a nonheated iron-doped HDPE sample.
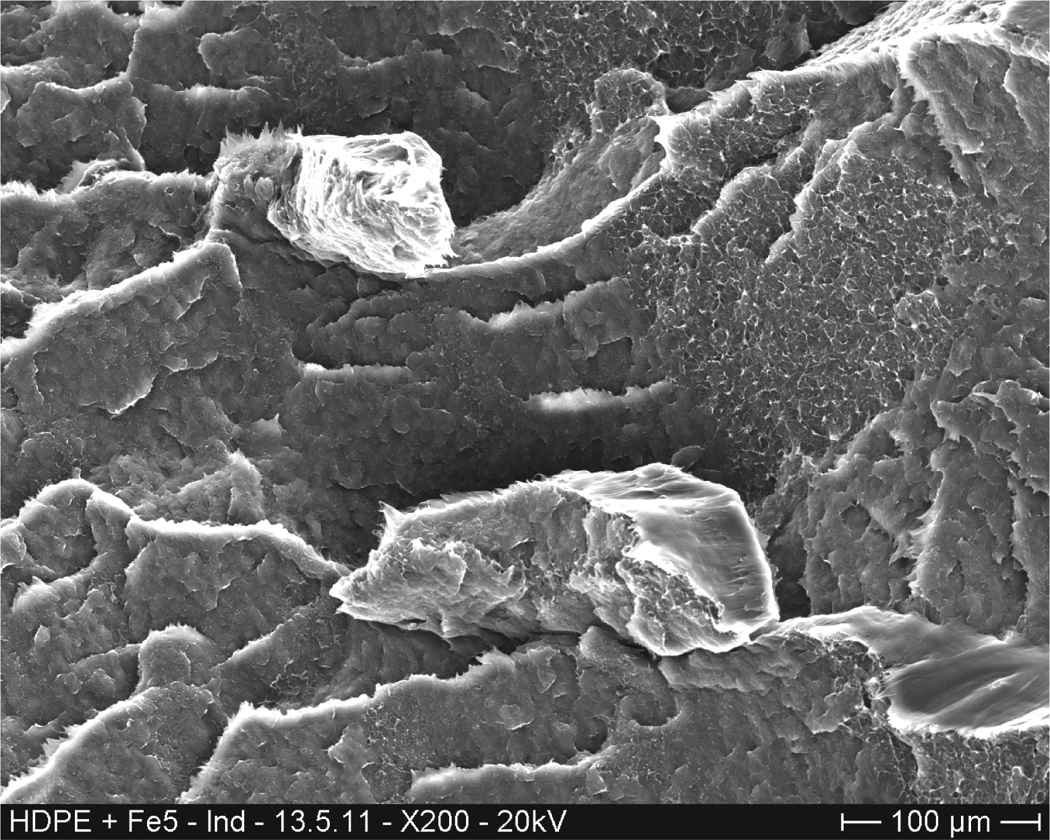
Cryo-fractured surface of an induction-heated, iron-doped HDPE sample.
By analyzing the FTIR measurements of radiated HDPE, four characteristic peaks were identified. According to O’Keefe, the methylene stretches at 2920 cm−1 and 2850 cm−1 and the methylene deformations at 1464 cm−1 and 719 cm−1 dominate the spectrum. 45 All peaks could be clearly observed in the range of the maximum resolution error. Further peaks at 1473 cm−1 and 731 cm−1 were attributed to the crystalline part of HDPE and corresponded to 1464 cm−1 and 719 cm−1, respectively, and could be found as well. Significant degradation peaks attributed to degradation products as reported by Yang et al. were not detected. 10 Similar to that observed previously for CF/PEEK, the total intensity varied also for the HDPE samples. This made the normalization on one peak inevitable. The clearest values were found at 719 cm−1 and thus 719 cm−1 served as the normalization peak.
The quotient of the intensity at 731 cm−1 and 719 cm−1 described the degree of crystallinity. 43 This value was found for all the investigated samples at 70% and herewith supports the results of the DSC analysis. Consequently, this peak was useless for a degradation qualification, as it did not change with increasing radiation time. The same behavior was found for the other methylene deformation at 1473 cm−1 and 1464 cm−1, respectively. The most significant changes were found at the normalized methylene stretches (Table 7). An exemplary analysis for laser-radiated HDPE at 200 W is illustrated in Figure 20. Both relevant wavelength intensities at 2914 cm−1 and 2846 cm−1 depicted an increase, whereas the more significant values were obtained from the iron-doped HDPE material. This was attributed to the reflection of the laser beam from the bright white neat HDPE. In comparison to the CF/PEEK material, this method delivered more significant values in the examined experimental duration with increasing radiation time. Nevertheless, longer laser-radiated samples, especially for iron-doped HDPE, revealed a very coarse surface, which increased the noise during the FTIR spectroscopy and finally made an analysis of severely damaged compounds impossible.
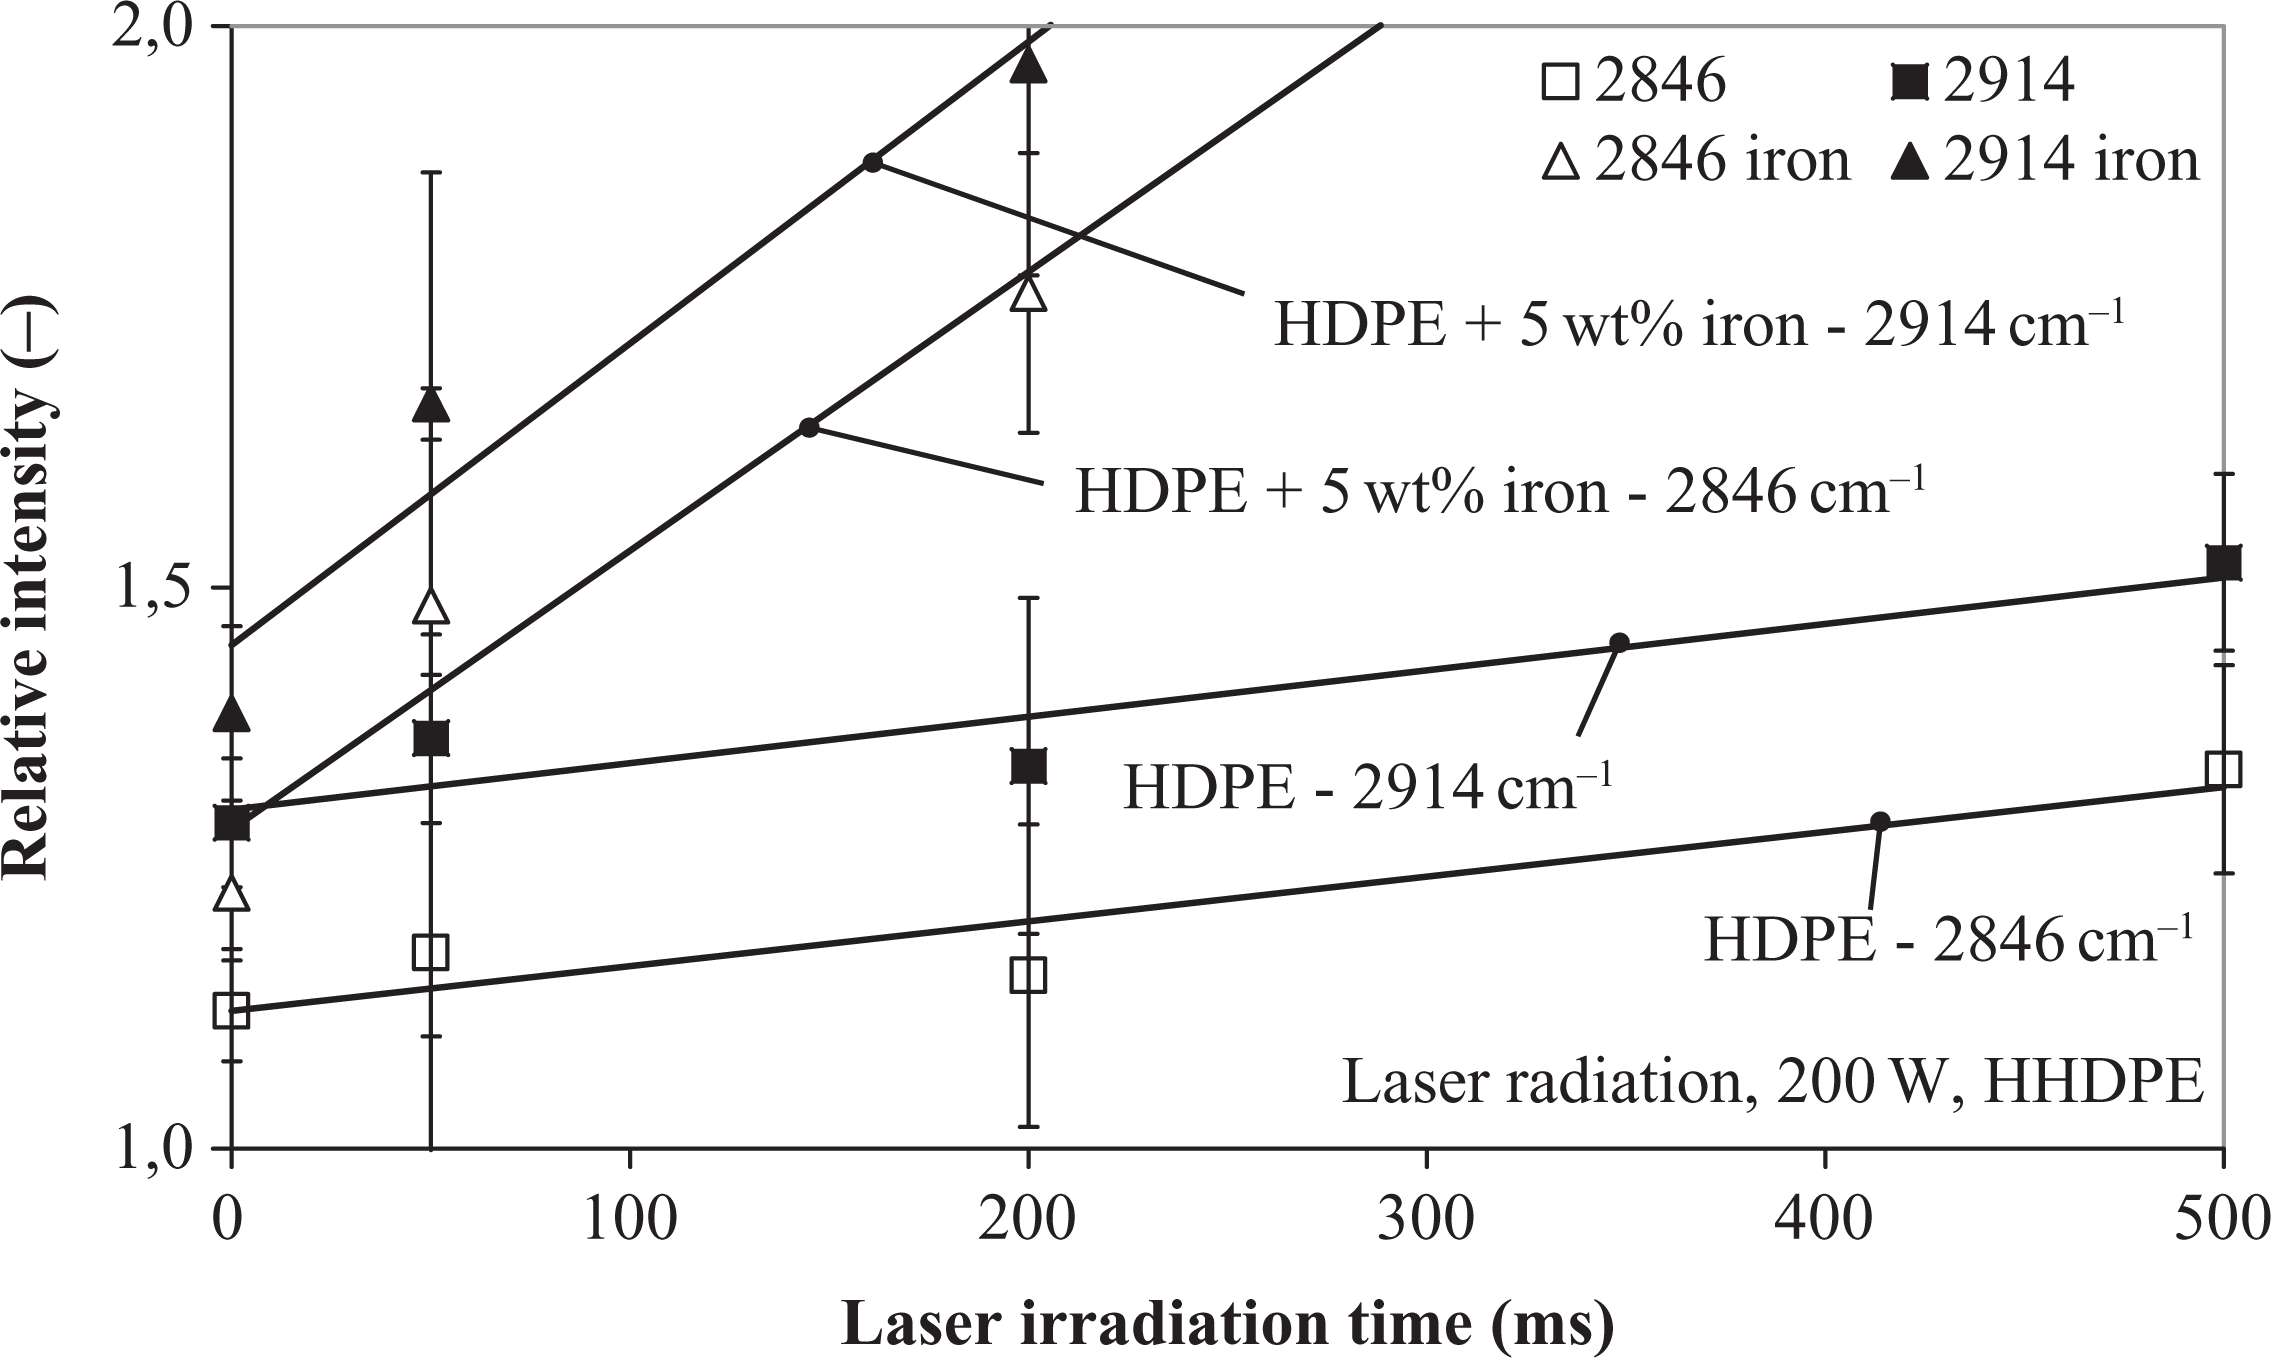
Fourier transform infrared spectroscopy analysis of laser-radiated HDPE specimens with 200 W laser power.
Observed characteristic wavelengths for HDPE after laser irradiation (based on the literature 42 ).
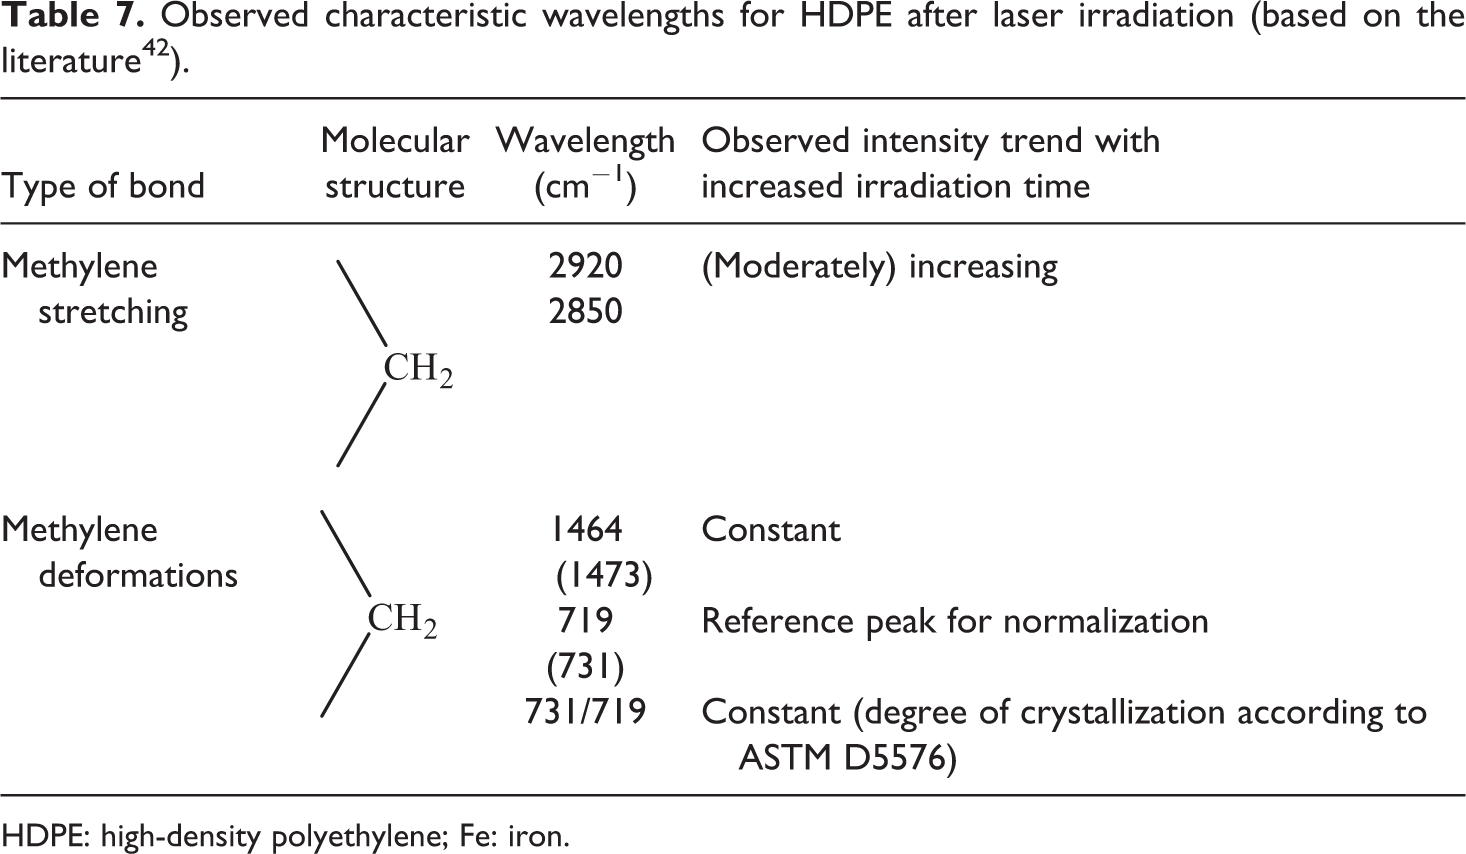
HDPE: high-density polyethylene; Fe: iron.
Conclusion
The aim of this study was to investigate the thermal degradation behavior of short-time heated CF/PEEK and HDPE in the range of 10 ms up to 3 min. Therefore, the polymers were heated by various methods including induction, IR, and laser heating. The treated polymers were investigated by DSC, gravimetric analysis, SEM, and FTIR spectroscopy, which showed significant changes for various configurations of power and time.
It was found that irradiation of CF/PEEK initially starts with a slight increase in crystallinity. By further irradiation, the crystallinity decreases to 0% and extrapolated onset temperature was reduced by 25 K, respectively. The SEM pictures indicated that the thermal degradation started at the fibers and proceeded to a destruction of the surface. Chemically, the degradation began with a decomposition of the phenyl ring bond, the ether bond, and the aromatic hydrogen bond. Nevertheless, some new peaks for bonds were observed by FTIR in the range of nonaromatic hydrogen, but remained very small.
For HDPE, only the melting peak temperature and the changes in bonds allowed a quantitative conclusion on the degradation state. The melting peak temperature decreased about 10 K depending on radiation time and applied heating method, whether the crystallinity nearly stayed at a constant level. Further investigation by means of FTIR revealed an increase in the methylene stretching bonding in comparison to the methylene deformation bonding. From the presented work, it is concluded that degradation appears and can be observed after several milliseconds up to several minutes and deviated to the degradation behavior of long-time studies in the range of hours.
Footnotes
Funding
This work was supported by the internship of Manuél Martínez-Tafalla at Institut für Verbundwerkstoffe GmbH in 2010 by Programa Clave (Fundación General Universidad de Salamanca).