
Abstract
Ultrasonic welding is a very fast joining technique well suited for thermoplastic composites, which does not require the use of foreign materials at the welding interface for either carbon or glass fibre-reinforced substrates. Despite very interesting investigations carried out by several researchers on different aspects of the process, ultrasonic welding of thermoplastic composite parts is not well understood yet. This article presents a deep experimental analysis of the transformations and heating mechanisms at the welding interface and their relationship with the dissipated power and the displacement of the sonotrode as provided by a microprocessor-controlled ultrasonic welder. The main aim of this research is to build up the knowledge to enable straightforward monitoring of the process and ultimately of the weld quality through the feedback provided by the ultrasonic welder.
Keywords
Introduction
Ultrasonic welding is a promising joining technique for thermoplastic composites based on low amplitude and high-frequency vibrations transversally applied to the surfaces to be welded. 1,2 Its main features are the high speed of the process (welding times ranging from a fraction of a second to a few seconds) and the fact that no foreign material is needed at the welding interface for either carbon or glass fibre-reinforced composites. Similarly, it is very well suited for spot welding and relatively easy to automate. Ultrasonic heating is driven by interfacial and intermolecular (viscoelastic) friction and, as opposed to other welding methods, it is highly coupled with the contact pressure between the parts to be ultrasonically welded. 3 Pressure and vibration are exerted simultaneously by a sonotrode, connected through a booster to a piezoelectric generator, which converts a high-frequency alternating current into high-frequency vibrations. Likewise, this ultrasonic stack (converter/booster/sonotrode) is connected to a pressure actuator. In order to concentrate the ultrasonic heat at the welding interface, triangular resin protrusions known as ‘energy directors’ are often utilised. The energy directors are shaped so that they undergo high oscillating strains and, as a result, they heat up preferentially. 3
The main phases in ultrasonic welding are vibration and solidification. In the first one, mechanical vibration is applied to the parts to be welded, which are already subjected to a certain (static) contact force. As a result, the energy director/directors will heat up, flow and wet the composite surfaces, enabling intermolecular diffusion. 4 In the solidification phase of the process, the weld is allowed to cool down under pressure. The primary processing parameters are the frequency of vibration (fixed for commercial ultrasonic welders, typically between 20 kHz and 50 kHz), amplitude, welding force, vibration time, solidification (hold) time and solidification force. Frequency, amplitude and welding force are responsible for heat generation at the interface during the vibration phase of the process. These, in combination with vibration time, solidification force and time are responsible for the quality of the weld.
Ultrasonic welding is one of the most popular methods for joining unreinforced thermoplastics within a wide range of industries including automotive, medical and electronics. 5 However, basic aspects, like the heating process, are still under investigation as proven by some recent publications. 6 Ultrasonic welding of thermoplastic composite parts has not been industrially applied yet in spite of some encouraging research results published in the last two decades. Benatar and Gutowski presented 4 a thorough theoretical and experimental analysis of ultrasonic welding of carbon fibre-reinforced polyetheretherketone (CF/PEEK) composites. Several authors 7 –9 investigated the effect of the welding pressure and welding time in the strength of ultrasonic welds concluding that there exists an optimum welding time for each pressure value and an optimum pressure for each welding time. Eveno and Gillespie 7 analysed the propagation of the melt front and its sensitiveness to thickness variations in the substrates. Harras et al. 8 concluded that the welding time is dependent on the geometry of the samples to be welded and therefore the welding energy should be used as a more consistent controlling parameter. Lu and Benatar 9 presented a sequential ultrasonic welding procedure to successfully weld large areas. Liu and Chang 10,11 studied experimentally the influence of six process parameters (welding time and pressure, holding time and pressure, amplitude and shape of the energy directors) on the strength of glass fibre-reinforced polypropylene and nylon composites.
Of special interest for the research work presented in this article are the findings of Benatar and Gutowski with regards to process monitoring. Benatar and Gutowski 4 showed that the impedance of the interface, and hence the dissipated power and the acceleration of the base/fixture undergo a sudden increase when all the melt fronts meet and the energy director starts to flow. Figure 1 shows an increase in the power and acceleration curves as provided by specific measuring devices attached to their experimental set-up. They also observed the existence of a final decline in the power curve that was attributed to the melting of the substrates after noticing sideways flow of polymer and fibres in the welded samples. Modern microprocessor-controlled ultrasonic welders supply feedback from the process, usually power, force and displacement data. 12 Figure 2 displays a typical power curve as consistently provided by the ultrasonic welder used in our research for advanced thermoplastic composites like carbon fibre-reinforced polyetherimide (CF/PEI), carbon fibre-reinforced Polyphenylene sulfide (CF/PPS) and CF/PEEK. When compared with the power curve in Figure 1, the one in Figure 2 shows a higher degree of detail that allows dividing the vibration phase of the welding process into five stages. The first one is characterised by an increment in the dissipated power until a maximum is reached. There follows a step-like decrease in the power (stage 2), after which it rises again (stage 3), levels off (stage 4) and finally drops (stage 5). As also plotted in Figure 2, the sonotrode undergoes a quick and steady displacement from stage 3 onwards, whereas very little displacement is observed in stages 1 and 2.
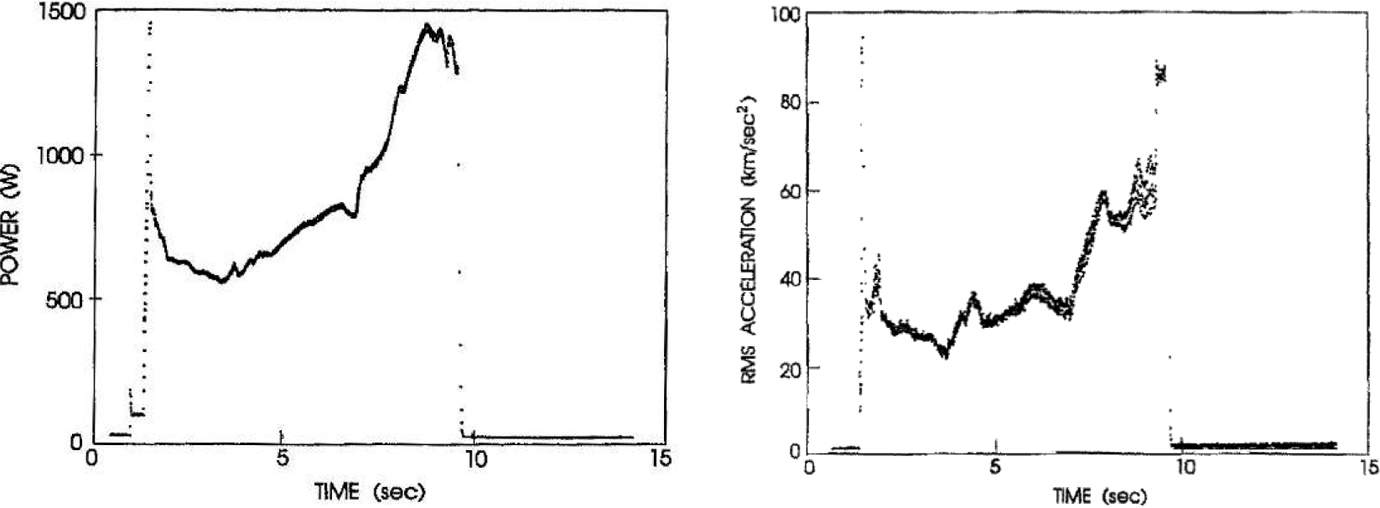
Evolution of the dissipated power (left) and of the acceleration of the base/fixture (right) for CF/PEEK composites (amplitude of vibration not specified, 3450 N welding force). 4 CF/PEEK: carbon fibre-reinforced polyetheretherketone.
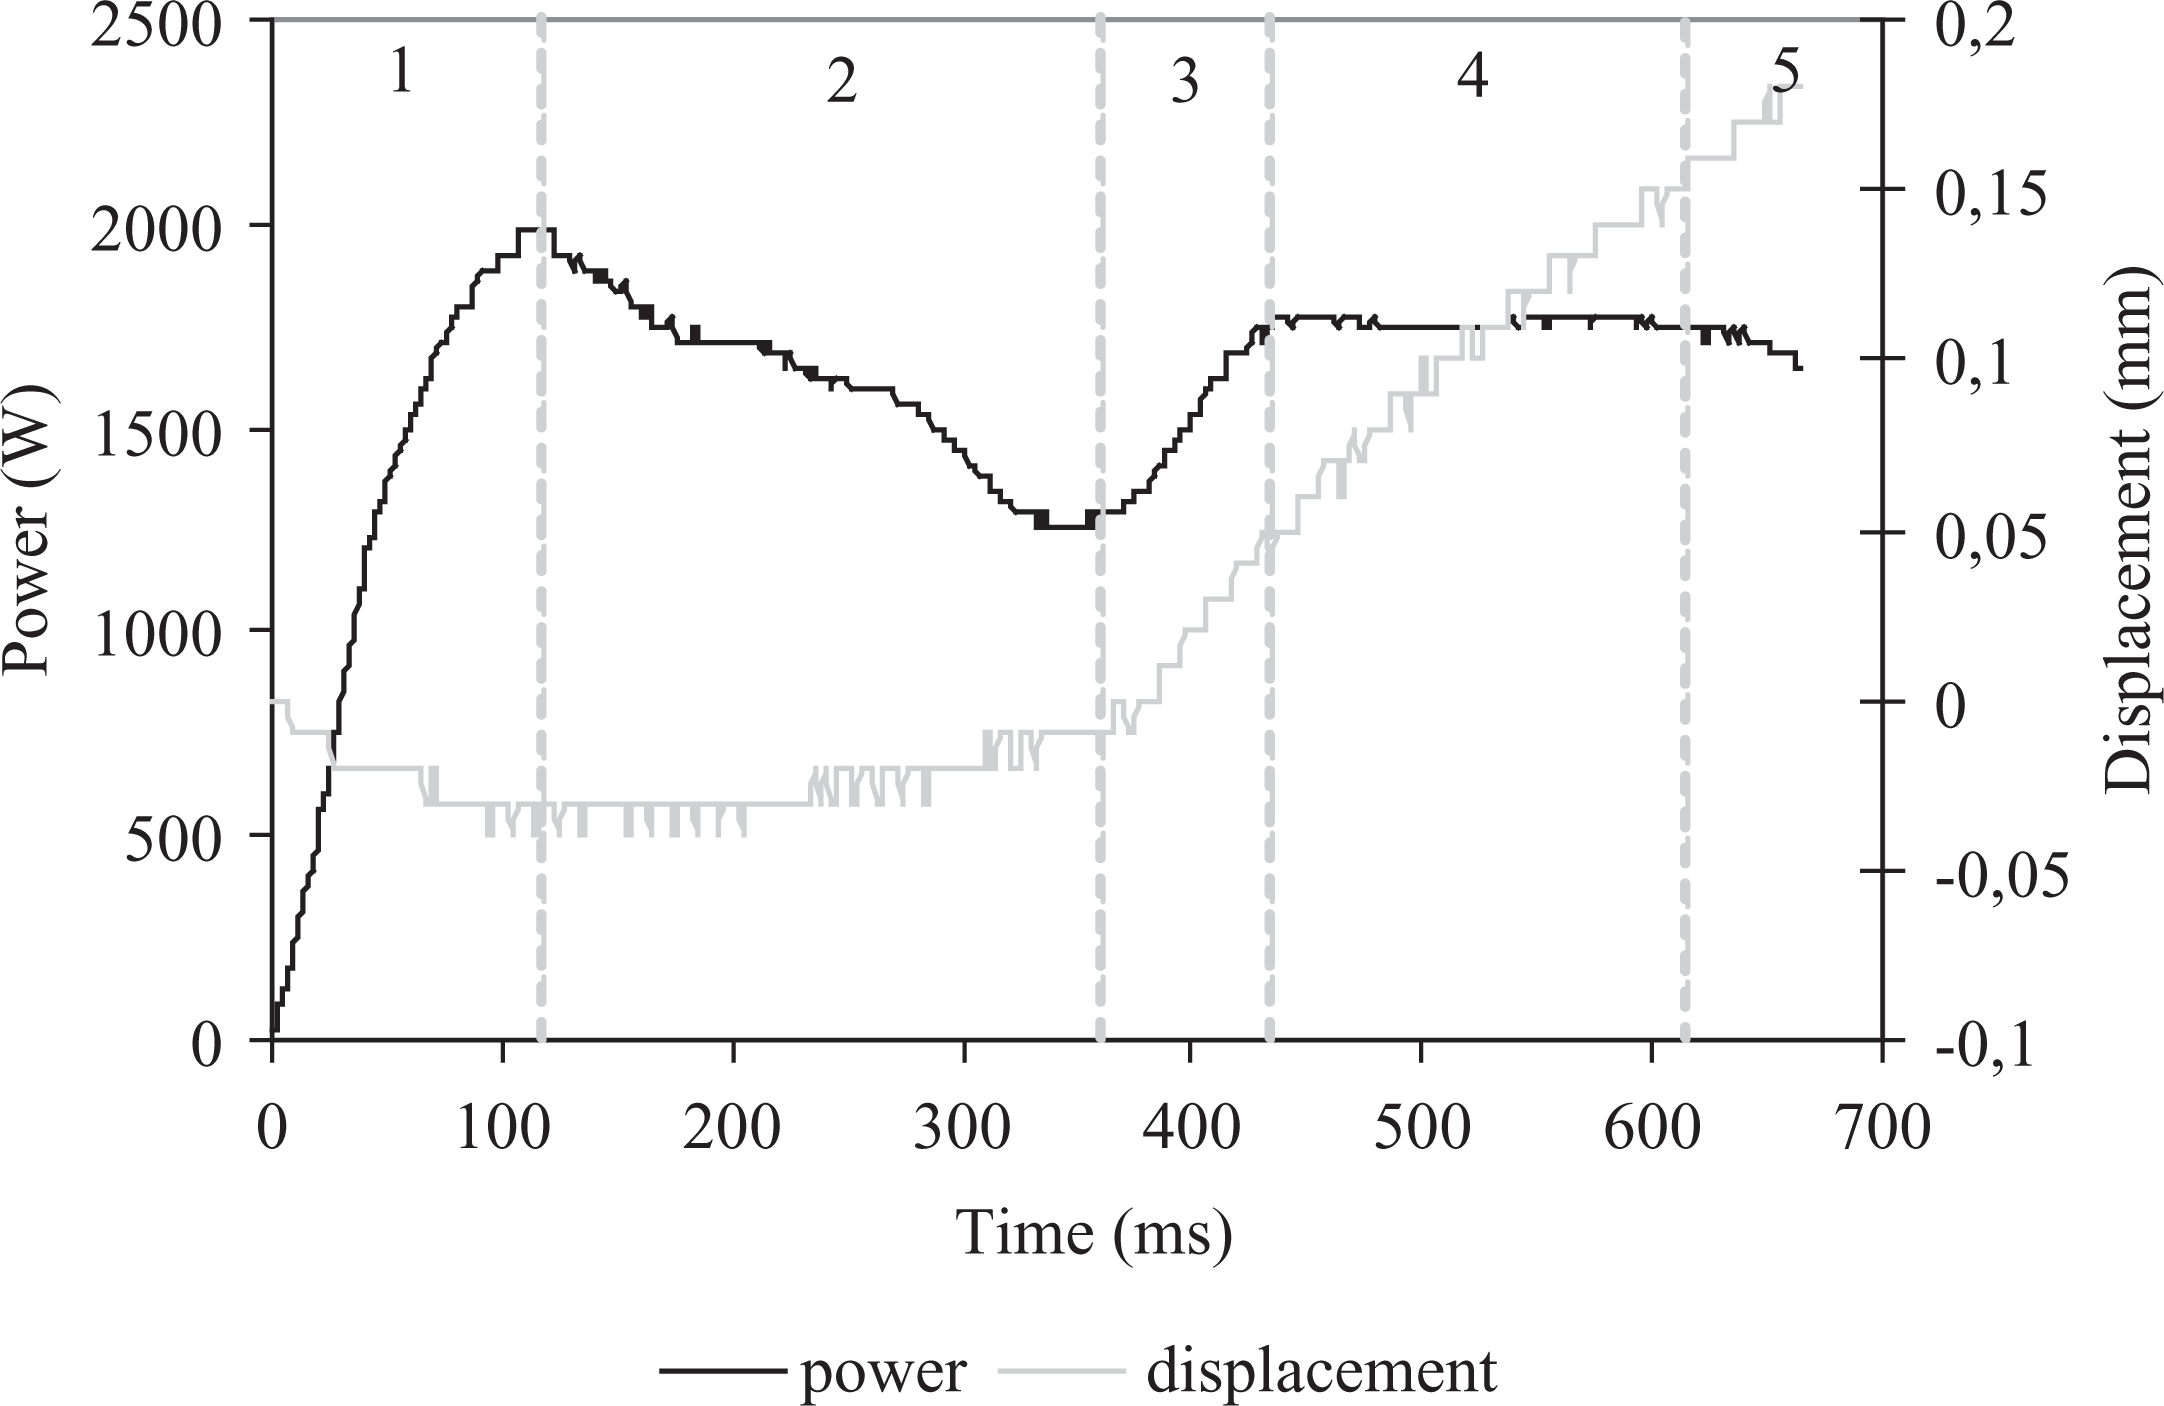
Typical evolution of the dissipated power and the displacement of the sonotrode for CF/PEI laminates during the vibration phase of the ultrasonic welding process (amplitude 86.2 µm and 500 N welding force). The displacement of the sonotrode is relative to its position at the beginning of the phase. Positive values indicate downward displacement. CF/PEI: carbon fibre-reinforced polyetherimide.
The research work in this article focuses on deepening our understanding of the relationships between the events in the power and displacement curves and the transformations at the welding interface as well as their connection with previous results in the literature. The final goal is assessing the suitability of the feedback provided by the ultrasonic welder as a tool to efficiently monitor the welding process. For this purpose, a fully experimental approach was followed comprising fractography and cross-sectional analysis of thermoplastic composite laminates welded with vibration times in different stages as shown in Figure 2. Similarly, a study on the effect of the amplitude of vibration and the welding force in the power curves was carried out in order to get good insight into heat generation in these stages.
Experimental
Materials
The material used for this research was CF/PEI provided by Ten Cate Advanced Composites (Nijverdal, The Netherlands). Despite the fact that PEI is an amorphous resin, ‘melting’ is used hereafter to indicate the moment when the resin reaches processing temperature and is able to flow. Six layers of five harness satin CF-reinforced prepreg were used to manufacture the base laminates in a hot platen press. The stacking sequence of the laminates was [0/90]3S and the manufacturing conditions were 20 min at 320°C and 20 bar. The nominal thickness of the consolidated laminates was 1.92 mm. Rectangular samples (101.6 mm × 25.4 mm) were cut out of the CF/PEI laminates with an abrasive saw so that the longer side of the samples coincided with the main apparent orientation of the fibres. 13 These samples were degreased and welded in near-field 3 into a single-lap configuration with an overlap area of 12.7 mm× 25.4 mm (according to ASTM D 1002).
Ultrasonic welding process and apparatus
A 20-kHz Rinco Dynamic 3000 ultrasonic welder with maximum power output of 3000 W (Rinco Ultrasonics, Romanshorn, Switzerland) was utilised. This microprocessor-controlled welding unit automatically adjusts the electrical power input in order to keep the amplitude of vibration constant. It also allows for a certain range of amplitude values for a fixed booster/sonotrode configuration. For the 1:1 booster and 1:2 sonotrode configuration used in this study, nine different peak-to-peak amplitude levels between 51.8 μm and 86.2 μm were available. The edge of the sonotrode in contact with the parts to be welded was cylindrical with a 0.40-mm diameter.
The welding experimental set-up is shown in Figure 3. The clamping tool, designed for single-lap joints, is essential to ensure that the samples do not shift as a result of the ultrasonic vibration. Among its main features, it allows for vertical movement of the upper substrate to minimise bending moments resulting from the gradual decrease in thickness of the energy director. Similarly, it improves the parallelism between the welding surfaces, which is important to promote uniform heat generation. 7
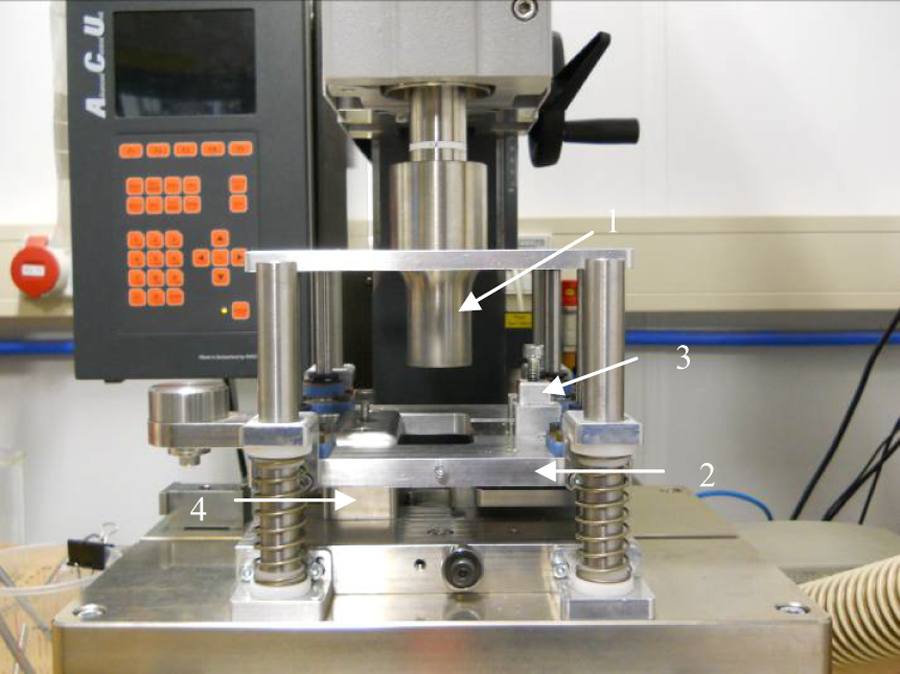
Ultrasonic welder and welding jig. 1: sontrode, 2: sliding platform, 3: clamp for upper sample and 4: clamp for lower sample.
The energy directors used in this study were flat neat-PEI films and constituted a step beyond the energy directing films with triangles moulded on one side, as utilised in the previous research. 7,14 . The flat energy directors were found to heat up preferentially due to its notably lower stiffness, and thus higher deformation under vibration, when compared with the composite substrates. They provided high quality and repeatable welds with 100% welded area as shown by Barroso et al. 15 and later in this article. Based on previous experience, the flat energy directors were manufactured out of five 50-μm individual PEI plies in a hot platen press at 260°C and had a final thickness of 0.25 mm. The individual energy directors were cut to size (slightly bigger than the overlap area) and were attached to the lower substrate with adhesive tape.
Procedure
As already mentioned in ‘Introduction’ section, samples welded with vibration times that fell in different stages as indicated in Figure 2 were used to study the relationships between material transformations at the interface and the events in the power and displacement curves. Figure 4 shows examples of power and displacement curves for such samples. The welding amplitude and welding force were 86.2 μm and 500 N (welding pressure 1.6 MPa), respectively. After the vibration, the joints were allowed to cool down and consolidate at 500 N as a general procedure. Occasionally, the pressure was removed right after the vibration phase to better investigate how the substrates were affected by the heat generated at the welding interface. In this type of sample, deconsolidation was expected in areas that reached temperatures above the glass transition temperature (T g) of the resin during vibration. Cross-sectional microscopy and analysis of the fracture surfaces generated after tensile testing of the welded samples were performed. No temperature measurements were carried out since thermocouples placed in the interface were found to concentrate the ultrasonic energy and therefore to provide misleading readings. The use of other temperature measurement devices such as an infrared camera was not applicable as a result of lack of accessibility (the welding stack is sandwiched between the sonotrode and the base of the welding jig throughout the welding process).
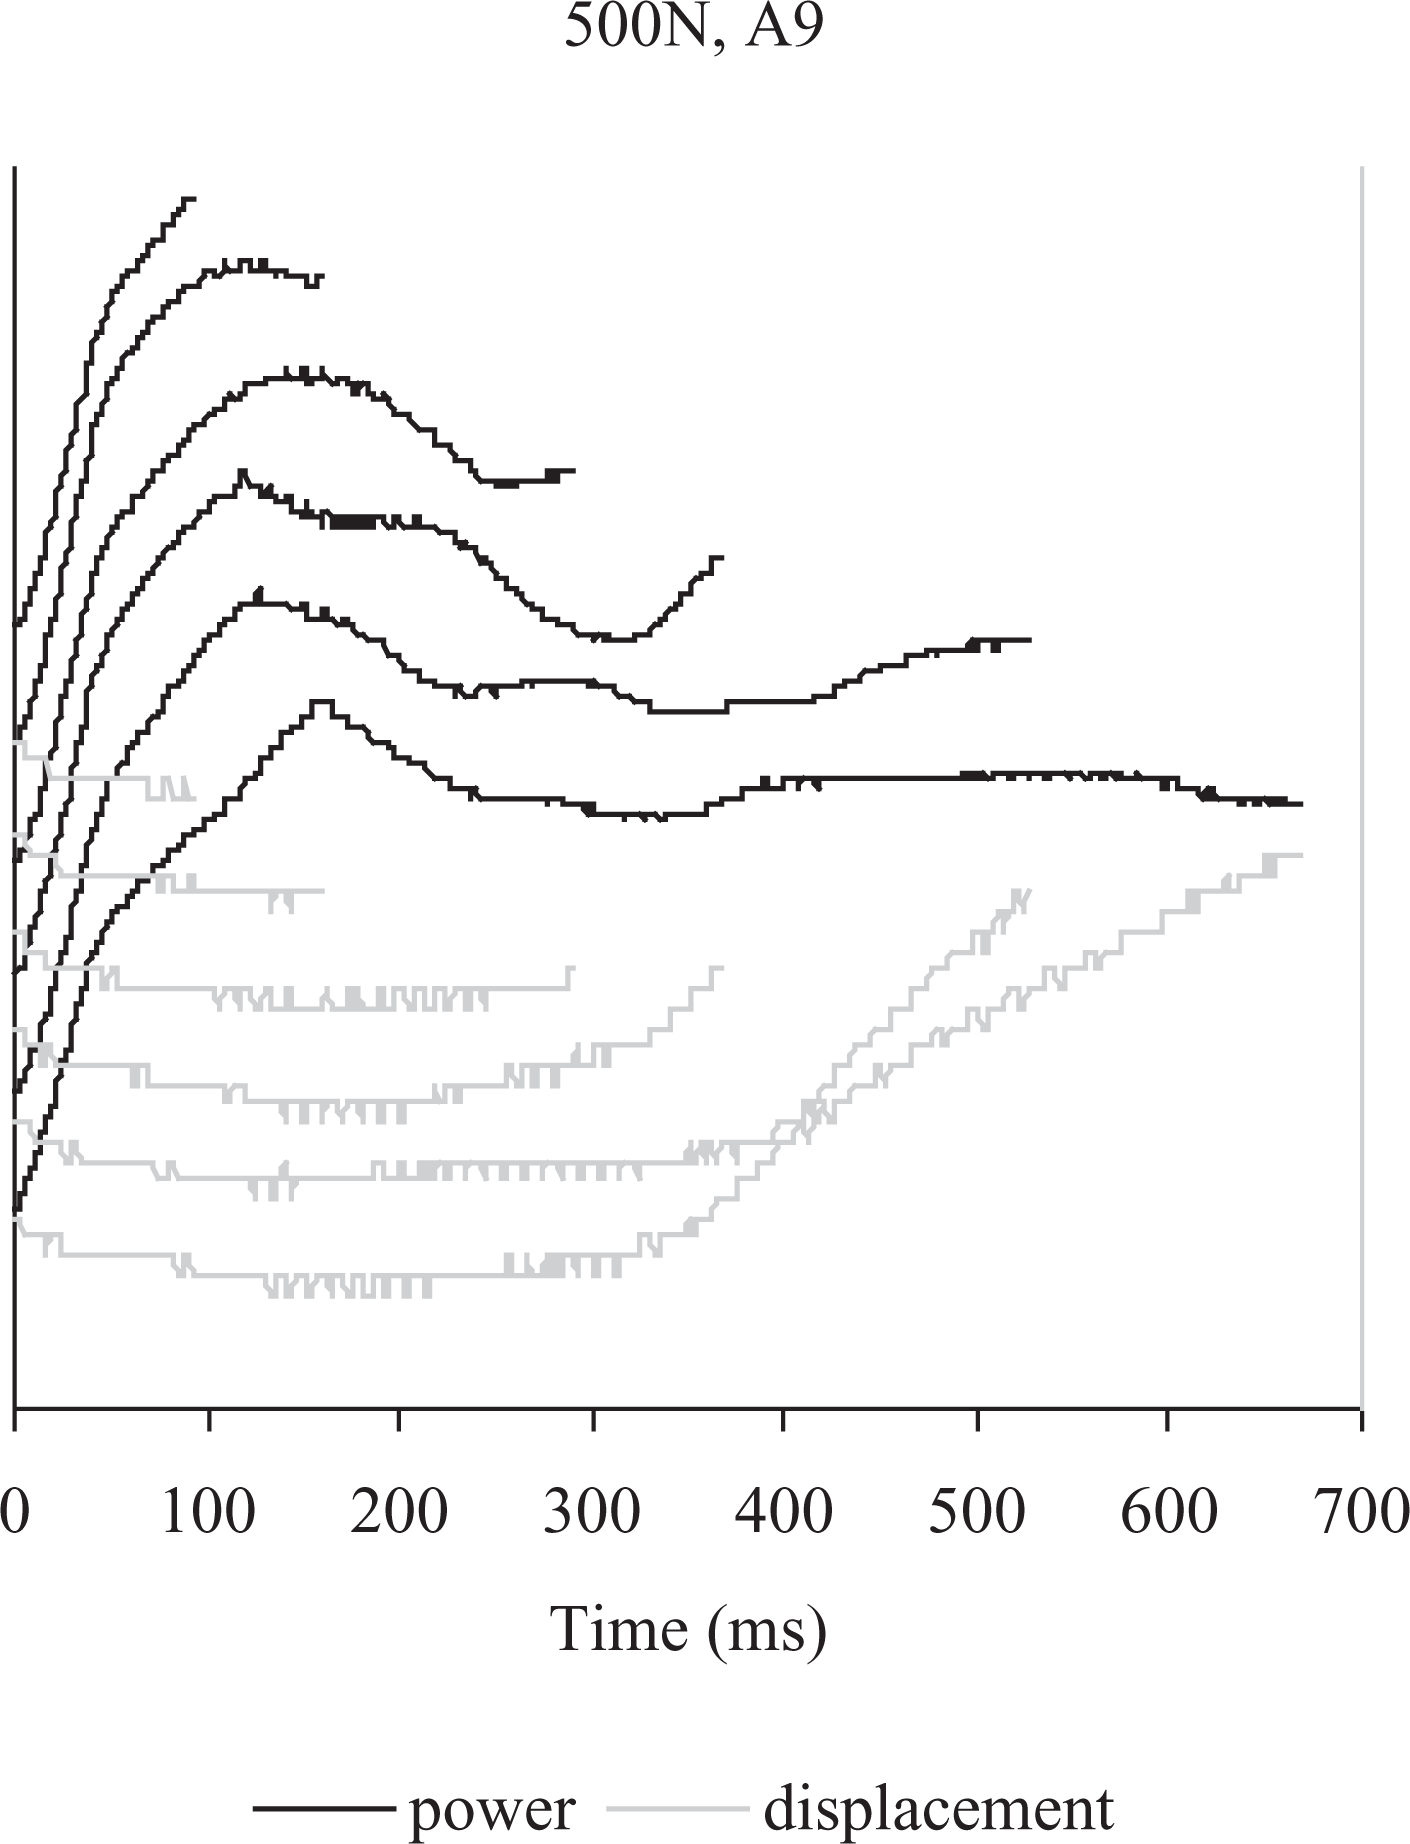
Power and displacement curves for samples welded within the different stages as identified in Figure 2. The curves are vertically shifted to improve clarity: from top to bottom, power and displacement for samples in stages 1–5 (500 N and A9 = 86.2 µm).
Valuable information on the role of interfacial and viscoelastic friction heating in the process was obtained from varying the welding force and the amplitude. Welding force values of 300 N (0.9 MPa) and 1500 N (4.7 MPa) and vibration amplitudes of 51.8 μm and 82.6 μm were used in this investigation. Power graphs were generated for the combinations of these values and compared among each other. For each case, the vibration time was long enough as to achieve a 0.02-mm total displacement of the sonotrode during the vibration phase. Five samples were welded per set of welding parameters to assess the statistical dispersion of the results.
Results and discussion
Stage 1
As seen in Figure 2, stage 1 is characterised by ramping power. There is a first linear increase in the power that corresponds to an amplitude transient and a retraction of the sonotrode to accommodate the vibration. After that the power increases and the rate decreases gradually until a peak is reached. Samples welded just before this power peak (Figure 5) already showed some changes in the energy director consisting of the formation of small bubbles most probably due to the boiling of some moisture remaining in the PEI resin. These changes, which did not significantly affect the composite substrates, occurred along the perimeter of the overlap as a result of restricted heat transfer to the surrounding air in that area. One of the edges of the overlap was observed to heat up preferentially owing to the design of the welding jig, which features a notably bigger air chamber next to that edge. Stage 1 ends when heating of the energy director progresses from the very edge into the overlap as observed in fracture surfaces of samples with vibration times right after the power peak like the ones shown in Figure 6. Despite the fact that Benatar and Gutowski used an entirely different energy directing solution (triangular energy directors moulded on one of the substrates), a stage 1 can as well be found on the very left side of Figure 1.This is characterised by a very sharp power rise, which is accentuated by the significantly longer duration of the rest of the vibration phase, also notably longer than in Figure 2.
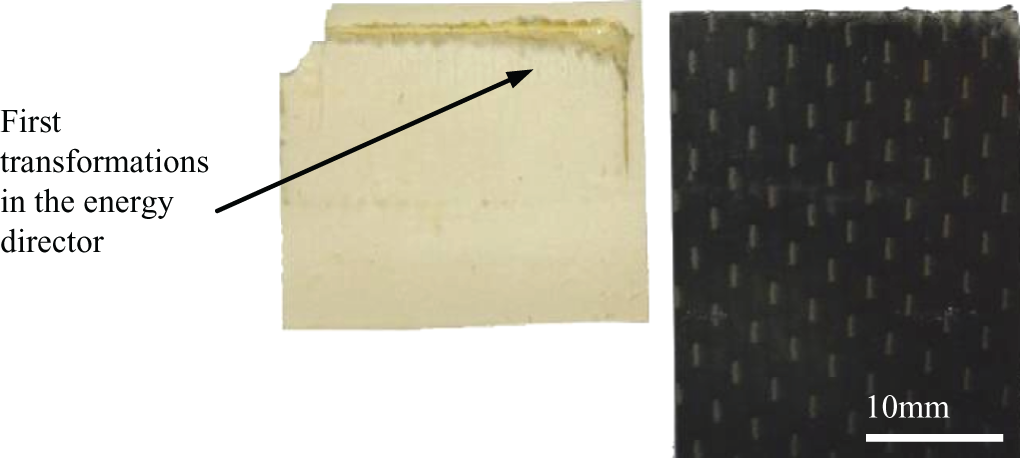
Energy director and bottom composite substrate for 100 ms vibration time at 500 N and 86.2 µm (stage 1 of the vibration phase).
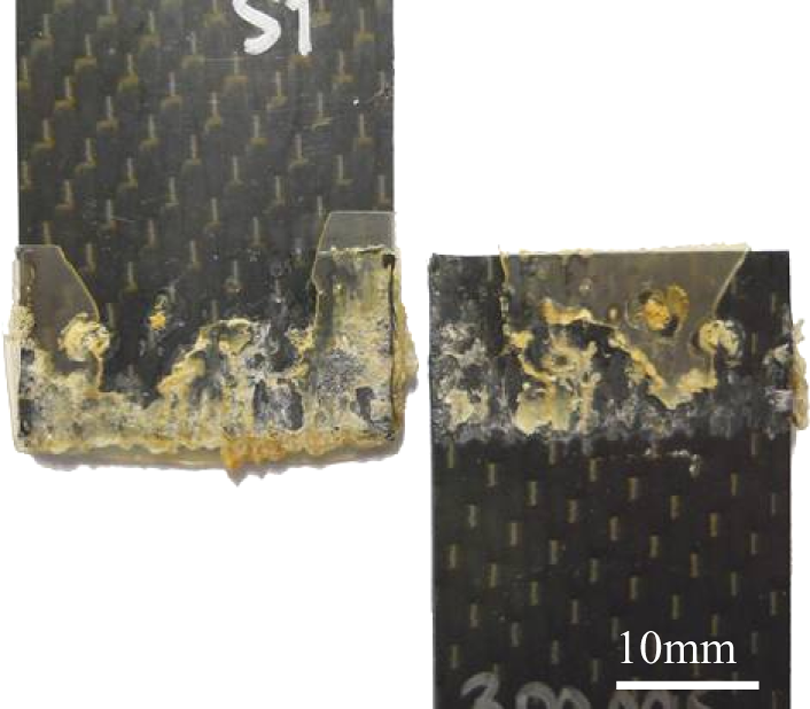
Local heating and melting of the energy director in the overlap right after the power peak (150 ms at 500 N and 86.2 µm, stage 2).
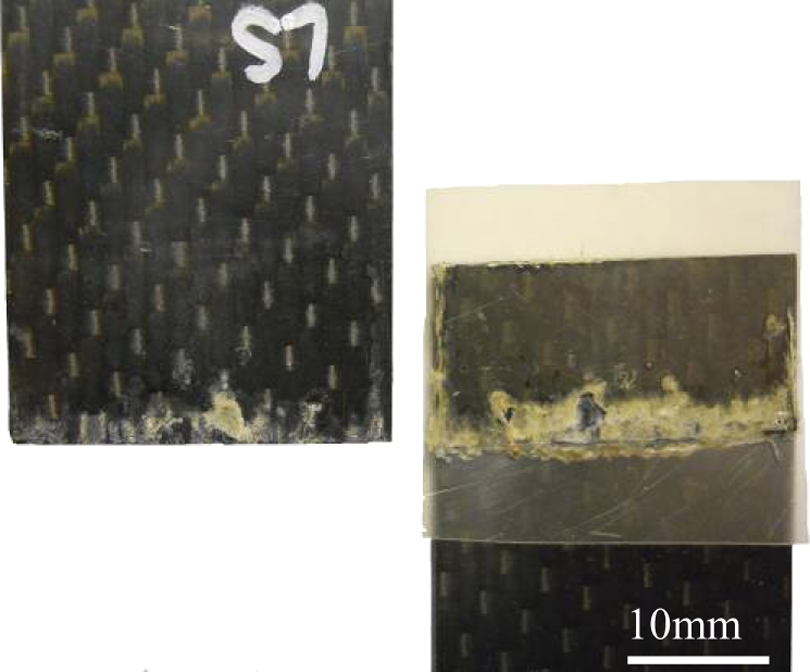
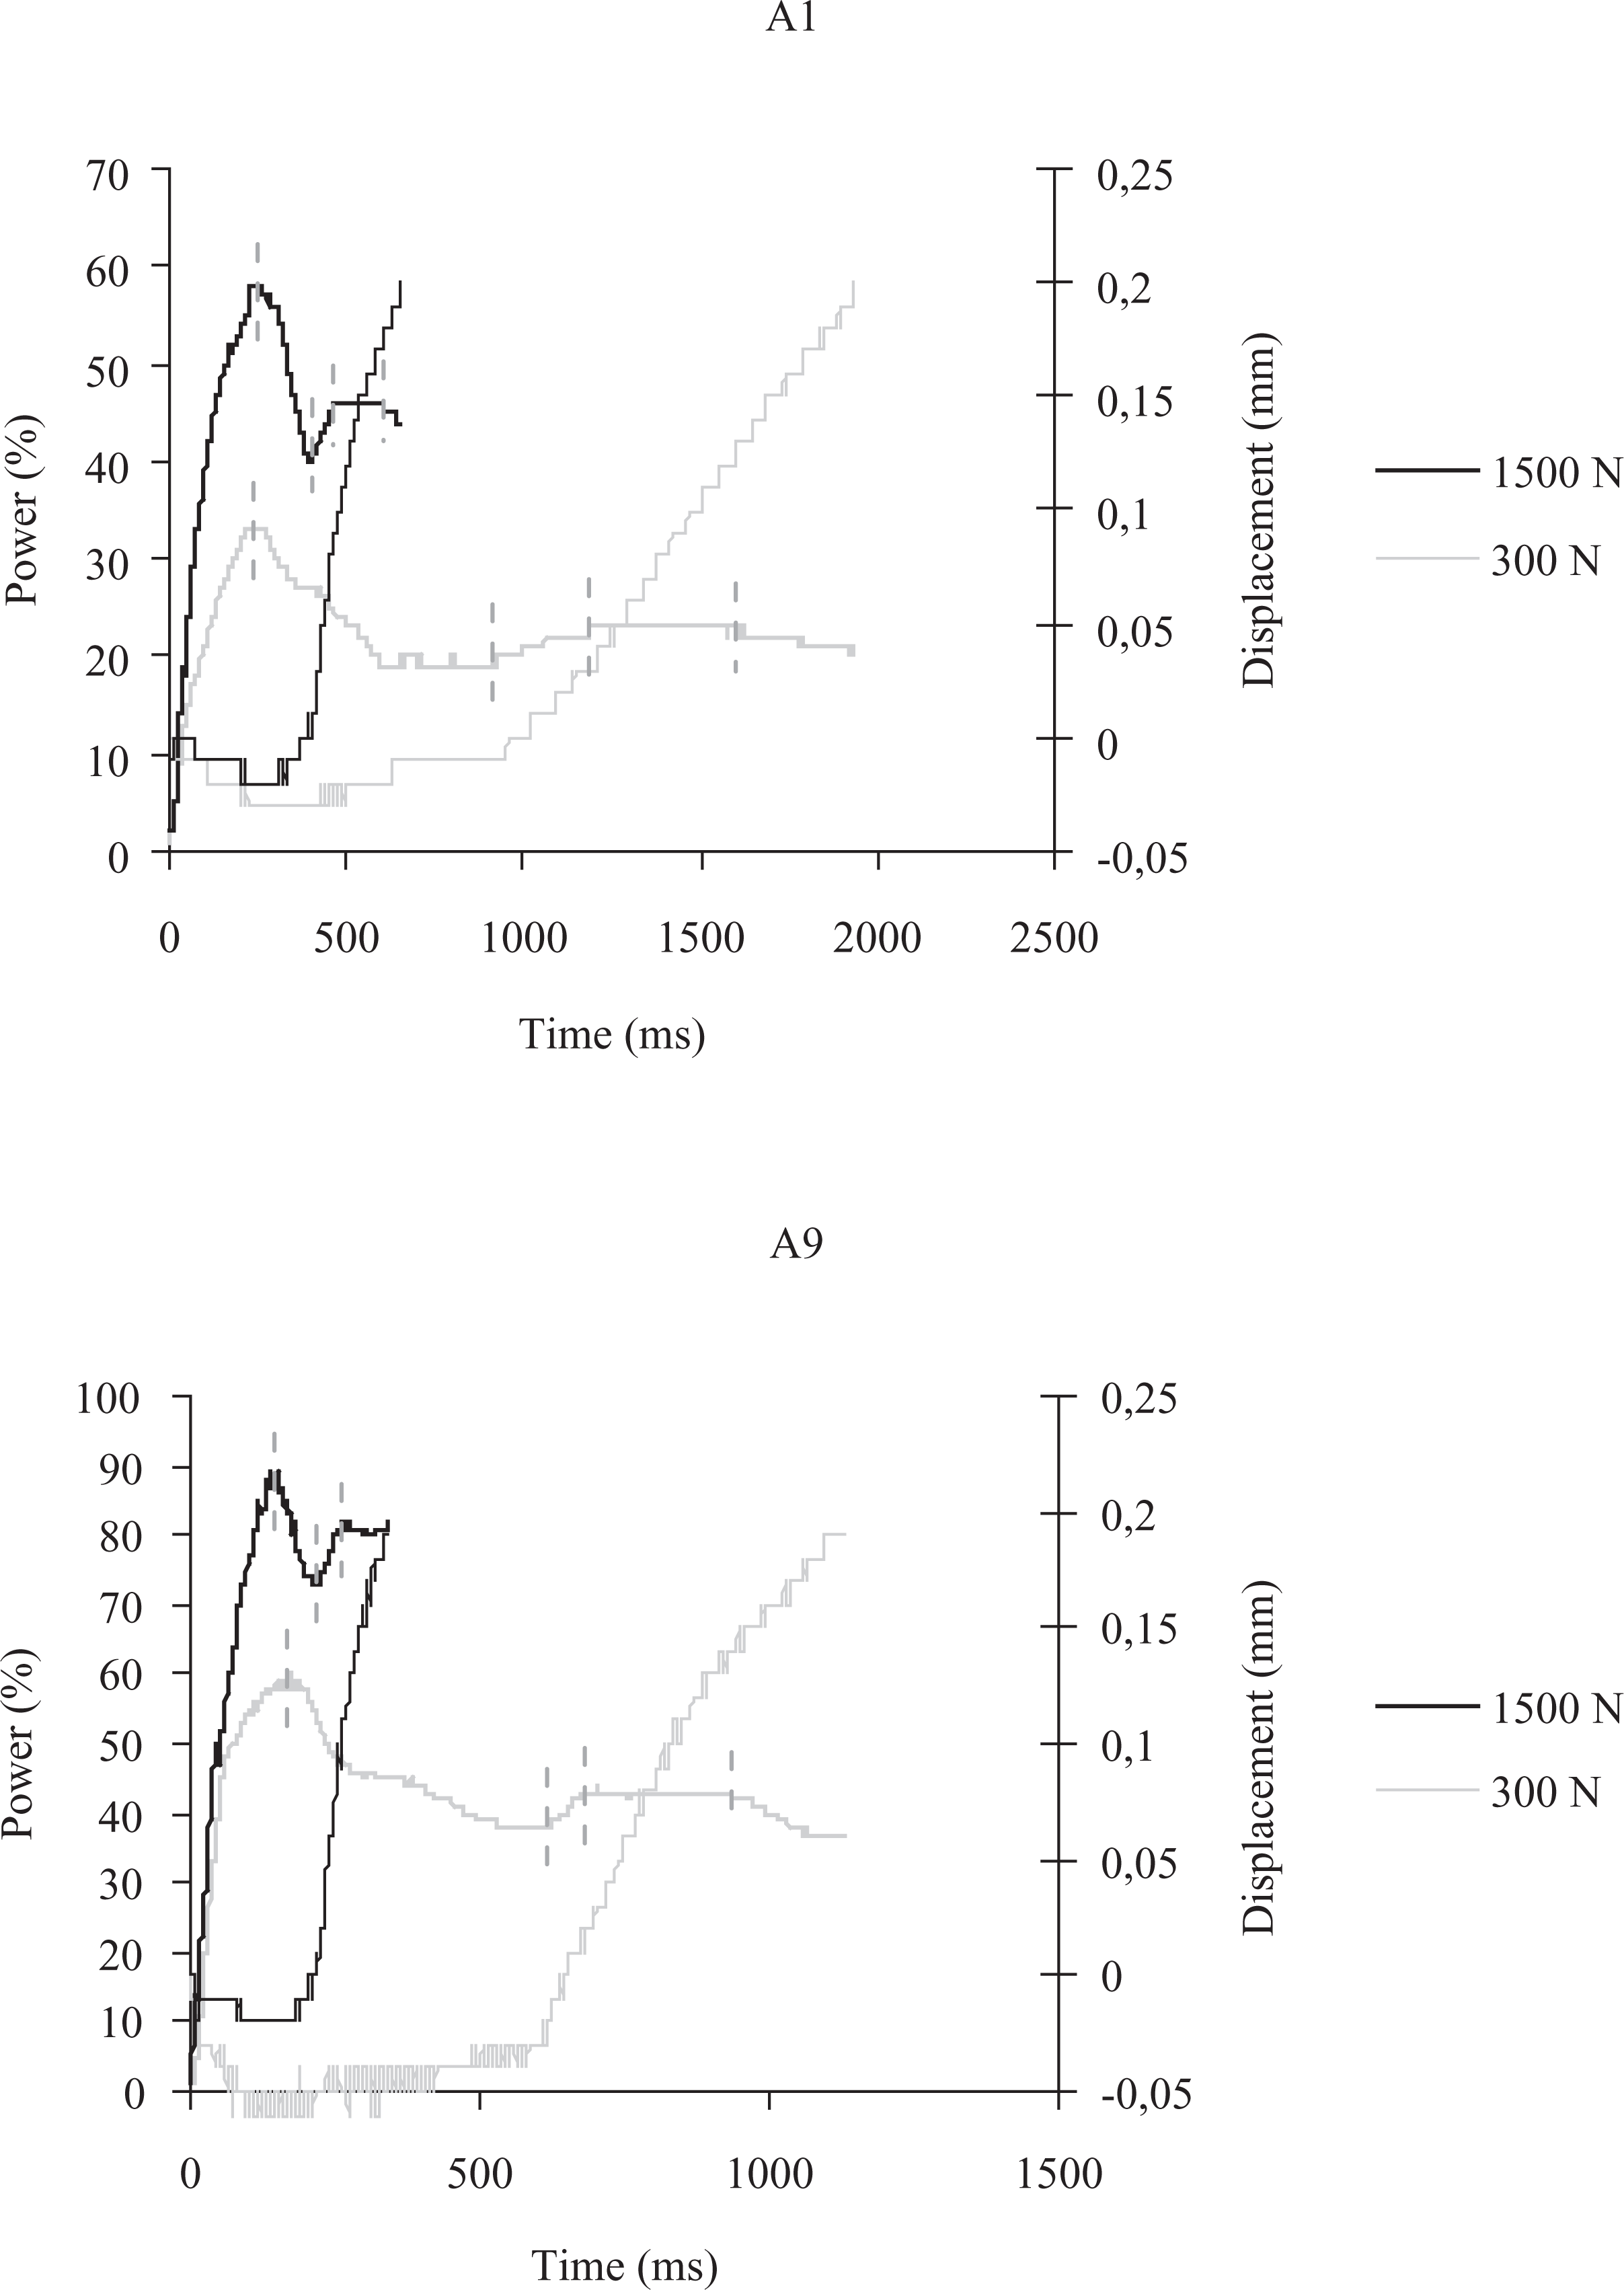
As shown in Figures 7 and 8, either increasing the amplitude of vibration or the welding force increased the magnitude of the power peak and of the overall dissipated power, as already indicated in the literature.
4,7
Apart from that effect, the power peak was found to happen earlier for higher amplitude values, whereas it remained rather insensitive to the welding force (also see Table 1). As explained in what follows, this can be related to the way in which heat is generated in this early stage of the process. As it is well known, ultrasonic heating consists of interfacial and viscoelastic friction heating. Interfacial friction is affected by the welding force and the relative displacement between the frictional elements. The welding force is responsible for an increase in the microscopic contact area between the energy director and the substrates. The relative displacement between the energy director and the substrates is related to the amplitude of vibration through the cyclic deformation of the energy director, which converts the transverse vibration into relative displacement parallel to the weld line. As a result, interfacial friction heating is affected by both the welding force and the amplitude of vibration. The viscoelastic heating rate Influence of the amplitude of vibration (A1 = 51.8 µm, A9 = 86.2 µm) on representative power and displacement curves for low welding force (top) and high welding force (bottom). The main stages that can be easily identified in the power graphs are indicated by dashed vertical lines. The power is depicted relative to the maximum power delivered by the welder (3000 W). The displacement of the sonotrode is relative to its position at the beginning of the vibration phase. Influence of the welding force on representative power and displacement curves for low amplitude (A1 = 51.8 µm; top) and high amplitude (A9 = 86.2 µm; bottom). The main stages that can be easily identified in the power graphs are indicated by dashed vertical lines. The power is depicted relative to the maximum power delivered by the welder (3000 W). The displacement of the sonotrode is relative to its position at the beginning of the vibration phase. Position of the power peak, onset of stage 3, duration of stage 2 and total vibration time as read from the individual power curves for the different combinations of amplitude and constant welding force. c.o.v.: coefficient of variation.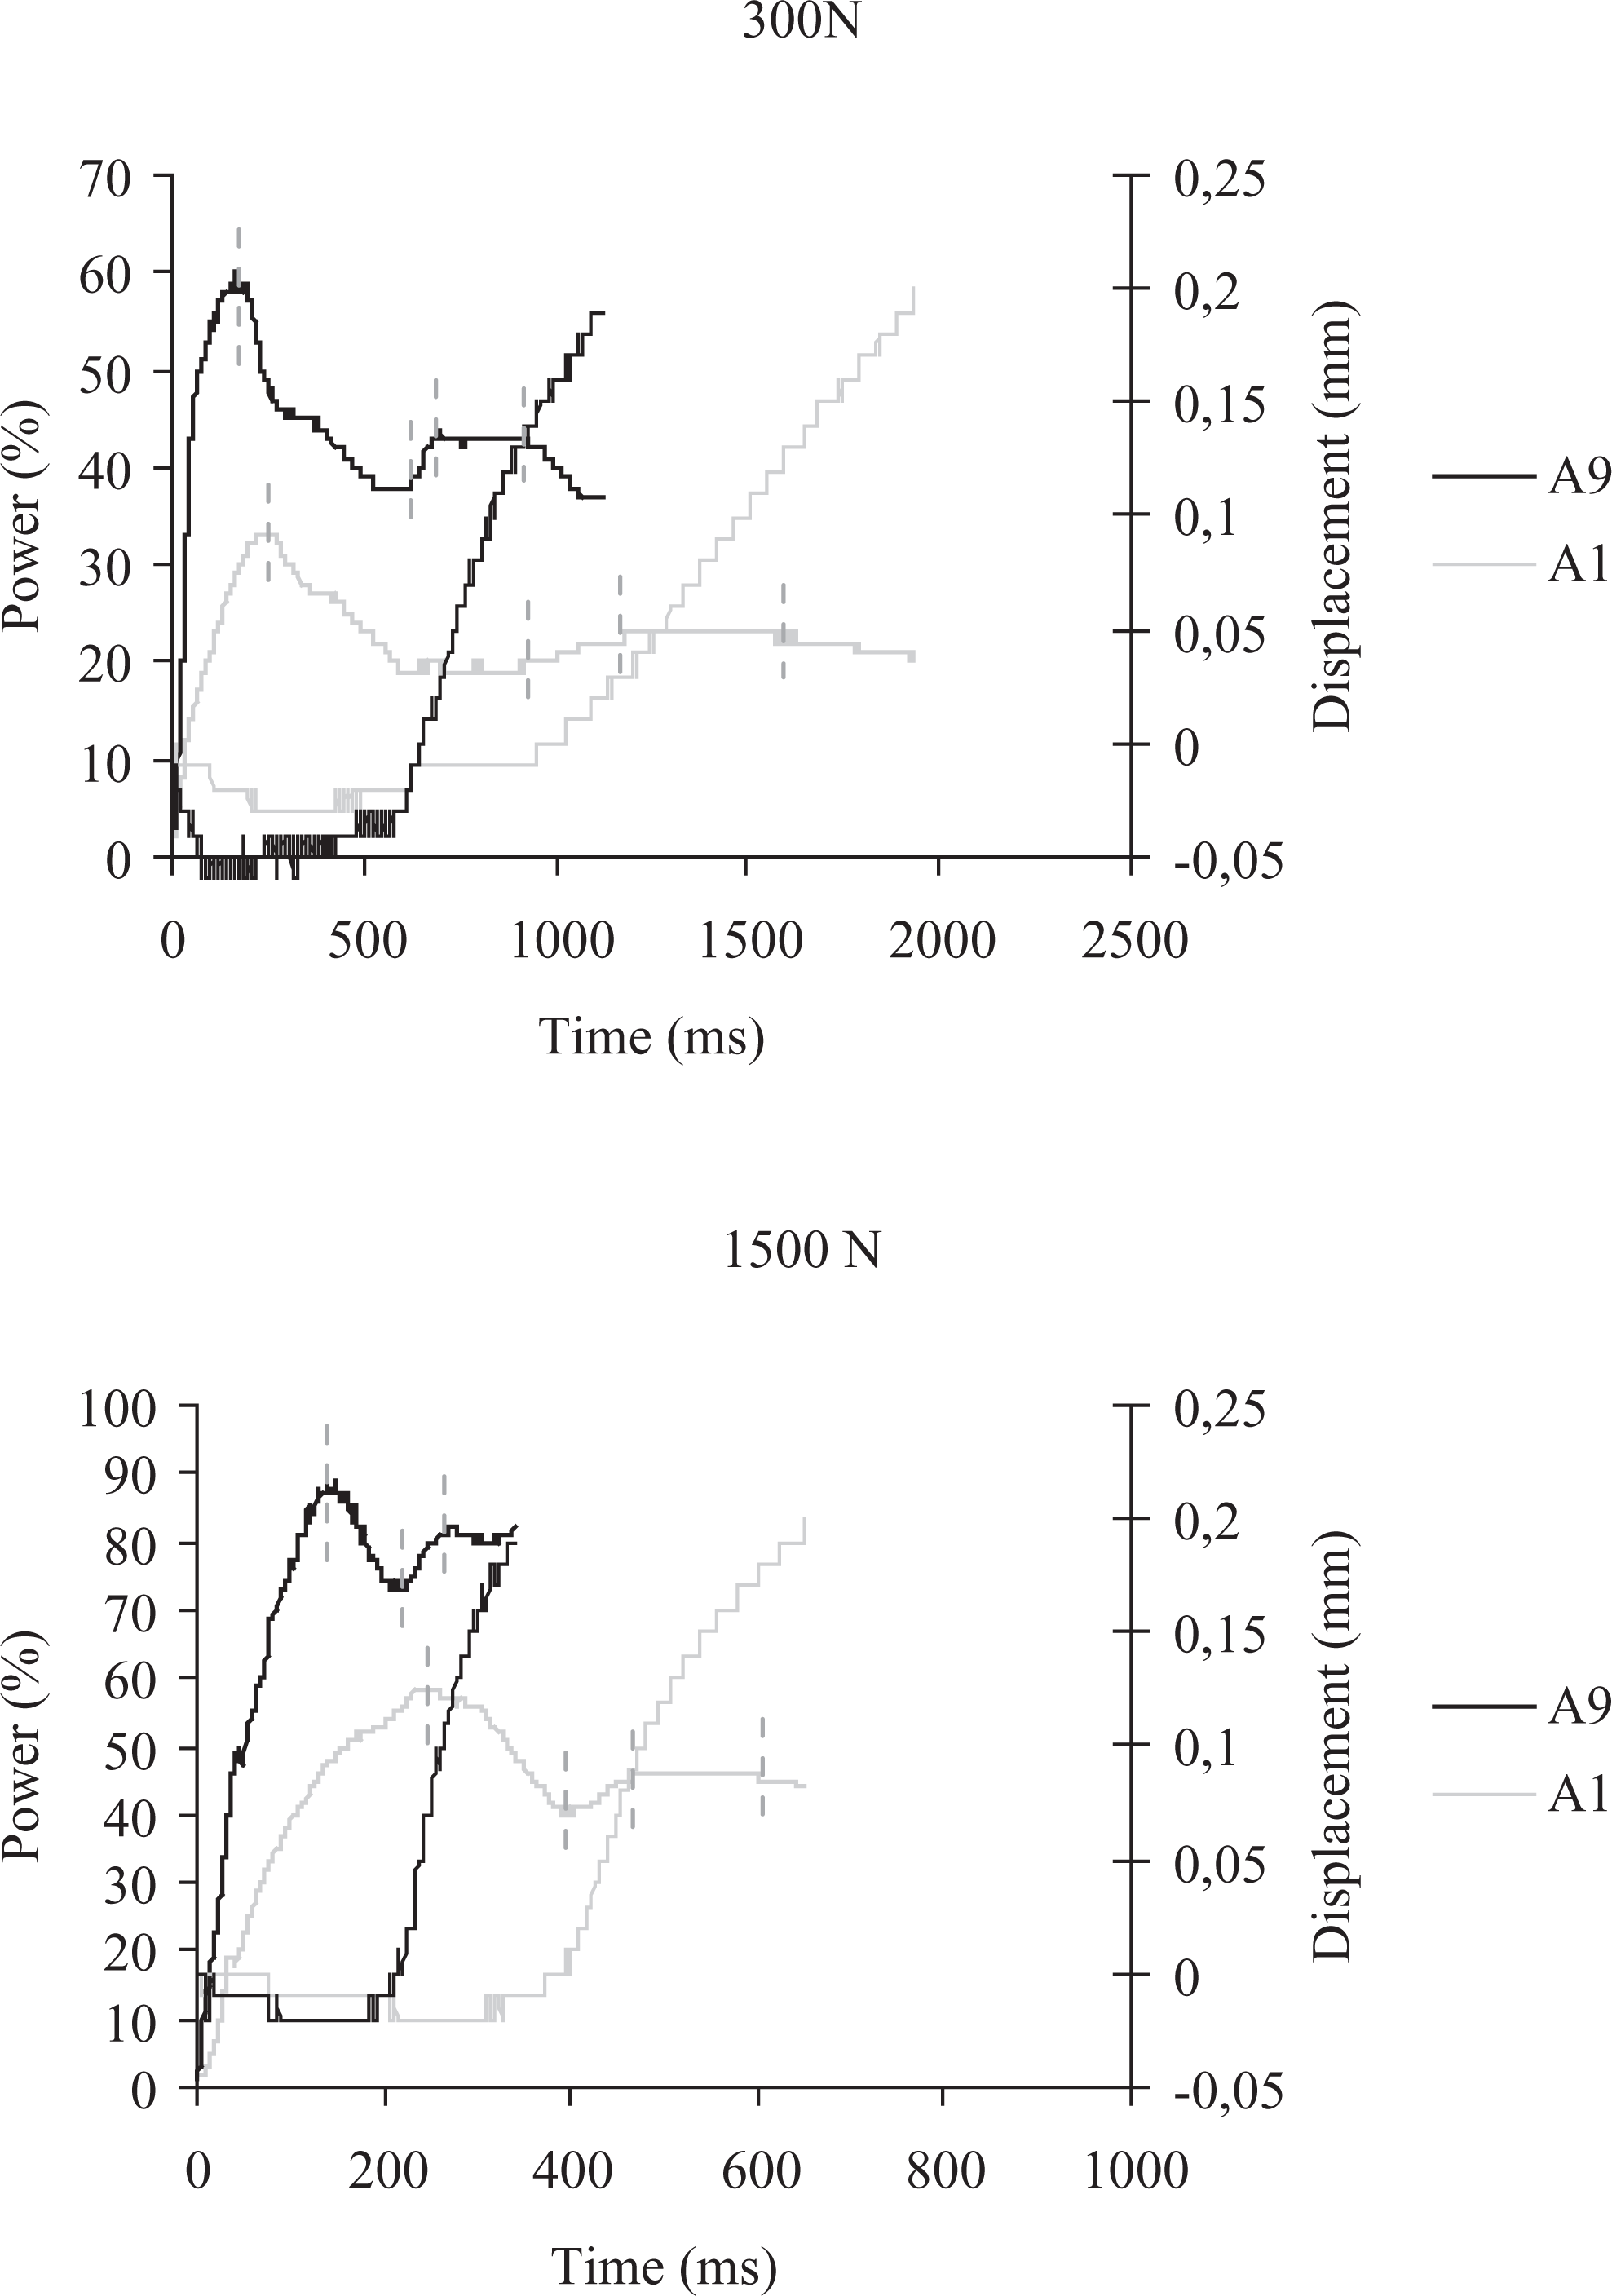
Owing to its dependence with E′′, viscoelastic heating is only significant around the T g of the resin. 4,6 Therefore, and as shown by Zhang et al., 6 interfacial friction has the main role in generating the initial heat for the welding process. Once the energy director reaches its T g, the majority of the heat needed to get the material to its processing temperature is obtained through viscoelastic heating at a considerably higher rate. Accordingly, both interfacial and viscoelastic frictions are involved in the occurrence of the power peak. Nonetheless, the independence of the time-wise position of the power peak to the welding force is believed to result from the assumption that only very localised melting is enough to get the power to drop, and it is hence not highly sensitive to the existence of a smaller or bigger intimate contact area within the whole overlap.
Stage 2
Stage 2 is characterised by an overall power decrease that often occurs in a step-like fashion, as shown in Figure 2. The fracture surfaces of samples welded within this stage show that after edge heating, the energy director continues to heat up and melt through the nucleation and growth of random hot spots as shown in Figure 9. Since throughout this stage there are still patches of non-molten resin in the weld line, no significant displacement of the sonotrode is observed. A very steep decrease in the power is in turn observed in Figure 1, which only slows down very soon before the power starts rising again.
Random hot spots in the energy director after the first edge heating in stage 2 (300 ms vibration time at 500 N and 86.2 µm).
In our experiments, power decrease is attributed to the progressive reduction in the solid area of the energy director. Experiments carried out with flat energy directors covering only a percentage of the overlap area showed a direct relation between the required power and the solid-to-solid contact area. The step-like shape of the power curve is ascribed to the occurrence of localised melting and re-solidification of the resin as heat is transferred to the surrounding colder areas. Gradual melting of the energy directors was also observed by Benatar and Gutowski. The triangular energy directors used in their study were found to progressively melt and re-solidify in narrow bands along their height, causing a step-like decrease in the gap between the substrates, as measured by a high-speed video camera, 4 but not noticeable in the power curve of Figure 1.
As seen in Figures 7 and 8 and in Table 1, the duration of stage 2 is significantly more sensitive to the welding force than to the amplitude of vibration. Figure 7 shows how stage 2 becomes notably shorter for a welding force of 1500 N. The reason for this behaviour can be found in the heating mechanisms at the welding interface. As explained in ‘Stage 1’ section, interfacial friction initiates the heating process and therefore it is the main driver for the nucleation of hot spots. Increasing the welding force improves the contact between substrates and energy director and thus it increases the amount of initiation sites. On the other hand, increasing the amplitude of vibration increases the rate at which heat is generated via both interfacial and viscoelastic friction and hence it plays a chief role in the growth process. Growth of hot spots is however constrained by heat transfer to the comparatively colder composite laminates and by the fact that viscoelastic heating experiences a peak around T g of the resin after which it diminishes notably. The significantly bigger effect of the welding force in the duration of stage 2 indicates that fast melting of the energy director is favoured by the nucleation of numerous hot spots, rather than by the growth of a limited number of them. Faster heat generation promoted by high welding forces also causes the power to drop continuously instead of in a step-like fashion, as also observed in Figure 8.
Stage 3
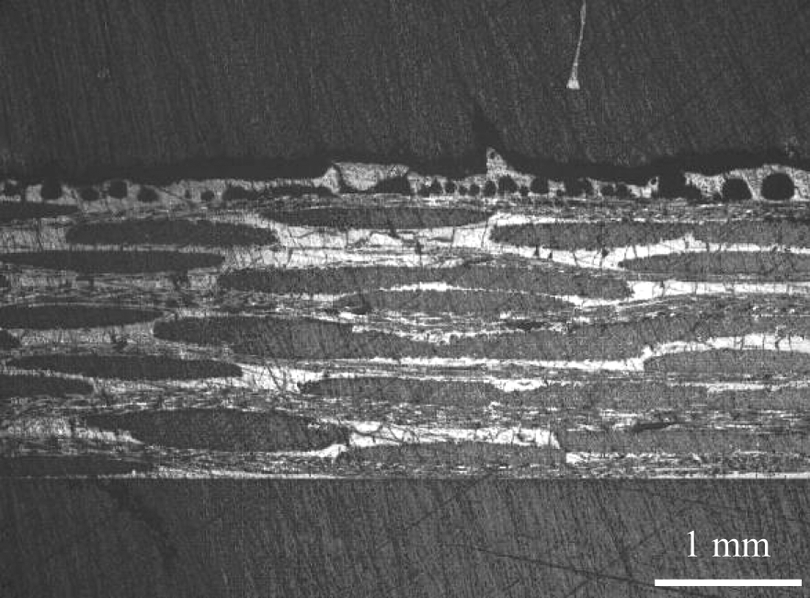
Squeeze flow of the energy director, indicated by a notable downward displacement of the sonotrode, begins in stage 3. Hence, the thickness of the weld line starts to decrease but it does not drop to zero within this stage. Figure 10 shows how a relatively thick resin layer can still be observed at the weld line in stage 3, which leads to resin-rich fractures as also seen in this figure. The cross-sectional micrograph in Figure 11 corresponding to a sample that did not undergo solidification after the vibration phase shows numerous deconsolidation voids at the weld line. No voids are nevertheless observed in the inner layers of the composite, indicating the absence of local melting within the substrates at this stage of the process. According to these results, squeeze flow of the energy director is the main phenomenon occurring during this stage. As clearly seen in Figure 2, flow of the energy director in stage 3 is accompanied by a sharp rise of the dissipated power, which as already stated by Benatar and Gutowski results from a sudden increase in the mechanical impedance of the interface when all the melt fronts meet. 4
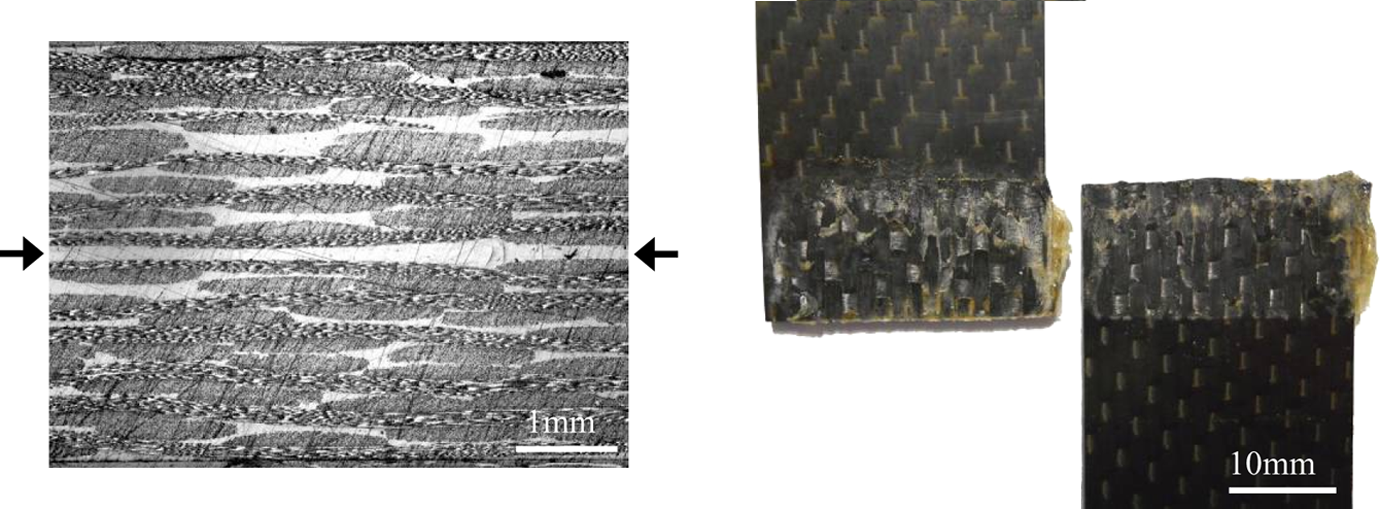
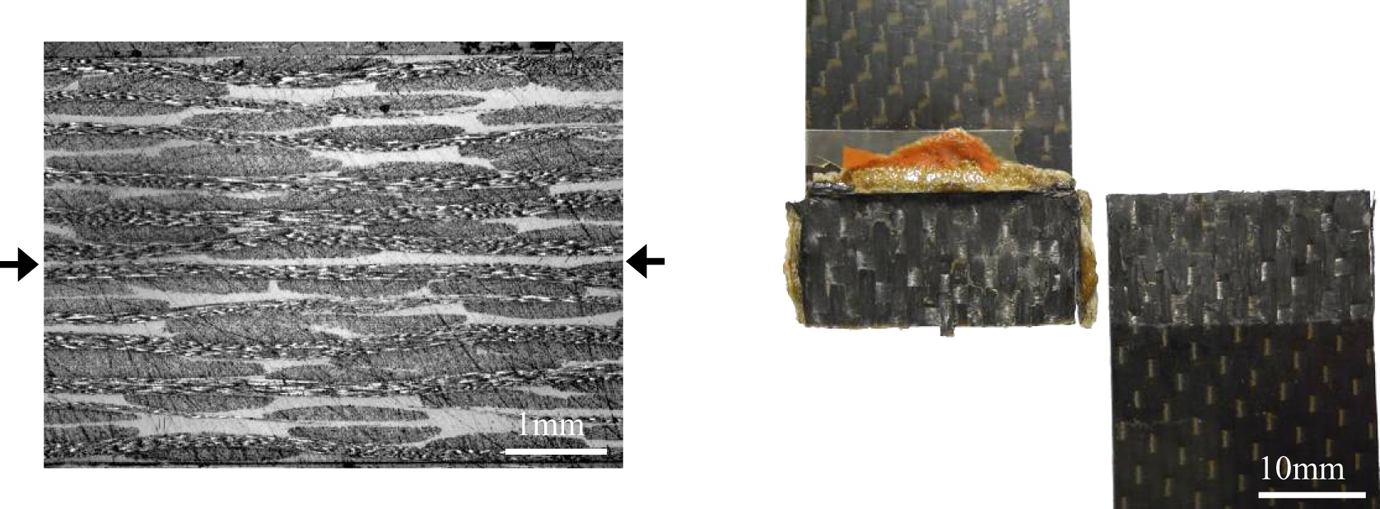
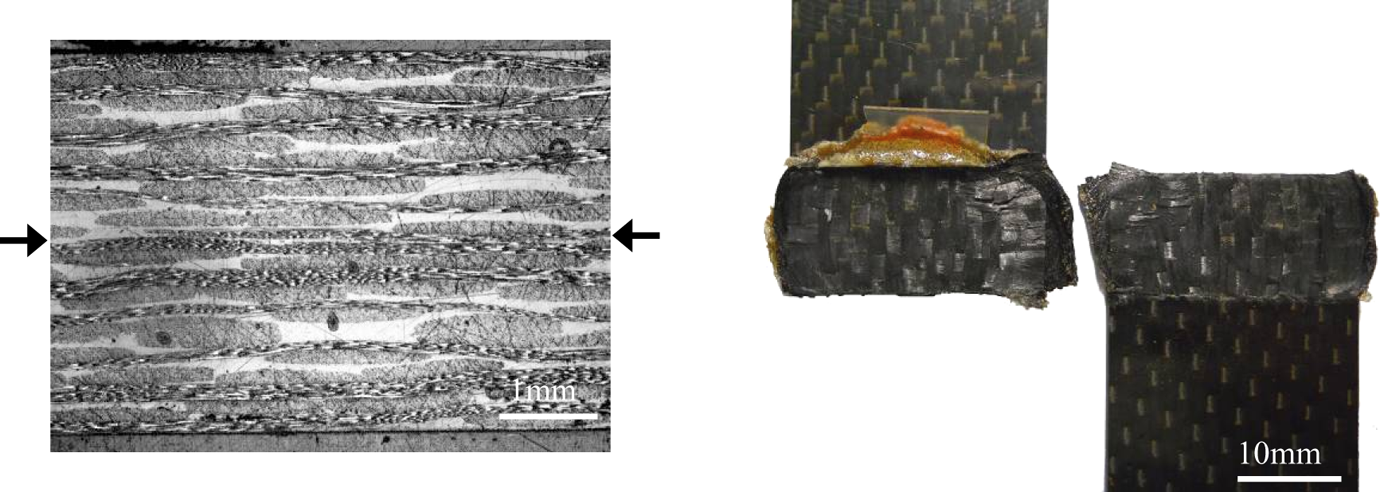
Cross-sectional micrograph (×2.5; left) and fracture surfaces for vibration time of 400 ms at 500 N and 86.2 µm (stage 3). The arrows indicate the position of the weld line.
Cross-sectional micrograph (×2.5) of a weld not consolidated after a vibration time of 400 ms at 500 N and 86.2 µm (stage 3). Only one substrate is shown since debonding occurred right after the pressure was released. Numerous deconsolidation voids can be observed in the resin-rich weld line.
Stage 4
In stage 4, squeeze flow of the energy director continues to occur until the weld line thickness is practically reduced to zero (as shown in ‘Stage 5’ section). The cross-sectional micrograph in Figure 12 displays a notably thinner weld line than the one in Figure 9 along with less resin-rich fracture surfaces. Nevertheless, resin flow is not the only phenomenon taking place in this stage. Local melting of the resin in the substrates as a result of the heat transferred from the interface starts to occur. To illustrate this, the cross-sectional micrograph in Figure 13 shows the presence of deconsolidation voids beneath the first layer of composite when no solidification occurs after the vibration. Likewise, the micrograph in Figure 14 corresponding to a well-consolidated sample shows kinking of the first composite layer at the hottest edge of the overlap. According to the experimental observations by Benatar and Gutowski, 4 melting of the substrates causes the power to decline. This is hence believed to counteract the power rise caused by the presence of molten energy director at the interface and to result in a power plateau. Figure 8 seems to indicate that increasing of the welding force significantly reduces the duration of stage 4, which can be attributed to a faster flow of the molten energy director out of the welding interface. This could also explain the fact that no distinct plateau was observed in Figure 1, since the welding pressure/force used in that research work was relatively high (6.5 MPa/3450 N).
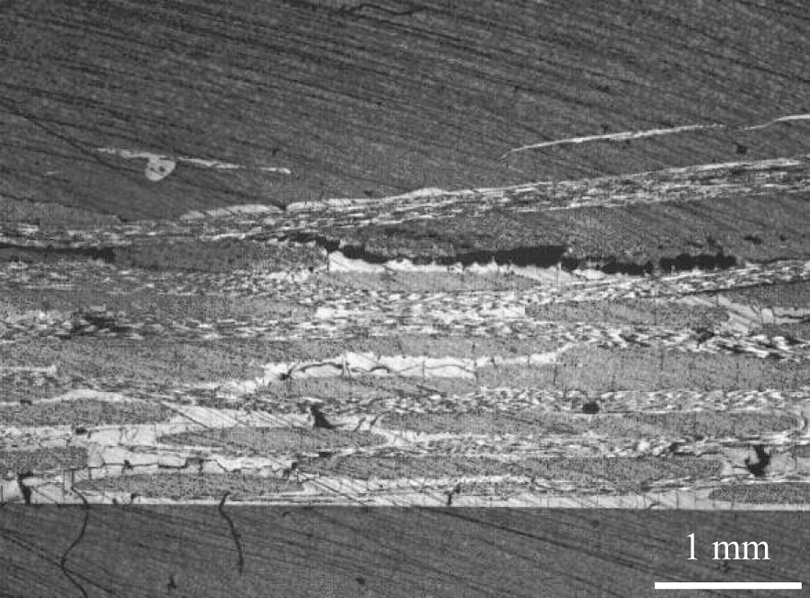
Cross-sectional micrograph (×2.5; left) and fracture surfaces (right) for vibration time of 550 ms at 500 N and 86.2 µm (stage 4). The arrows indicate the position of the weld line.
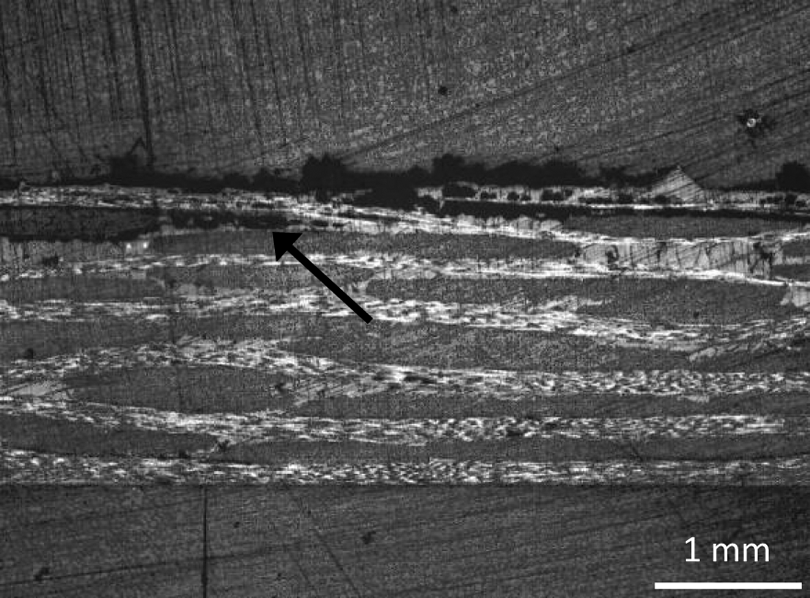
Cross-sectional micrograph (×2.5) of a weld not consolidated after a vibration time of 550 ms at 500 N and 86.2 µm (stage 4). Only one substrate is shown since debonding occurred right after the pressure was released. The arrow points at deconsolidation voids between the first and second layers of the substrate.
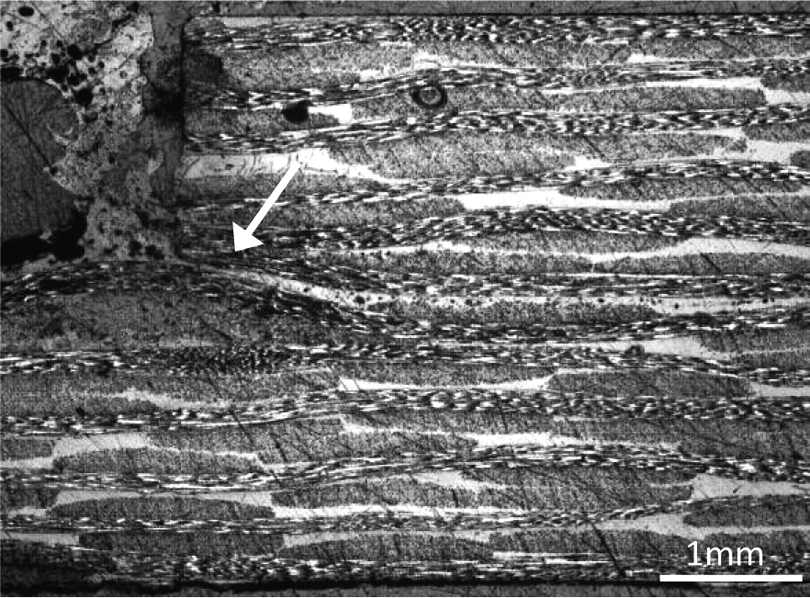
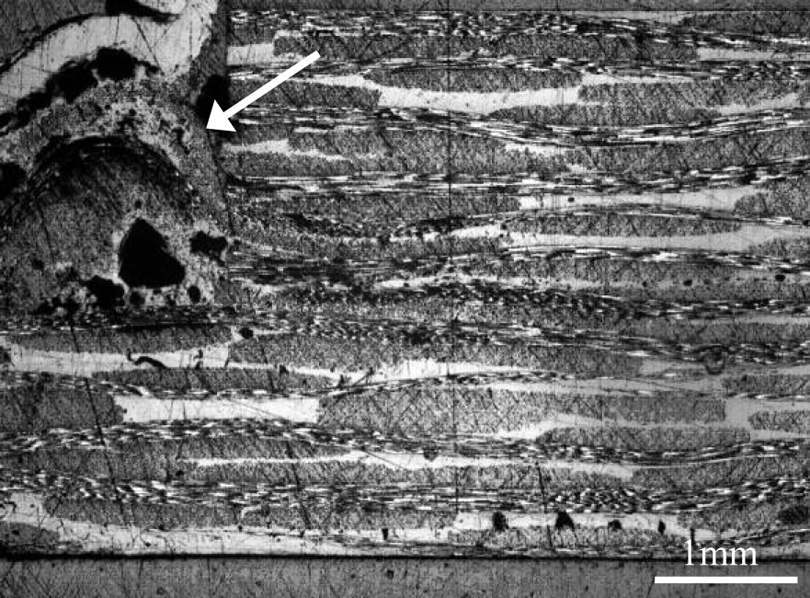
Cross-sectional micrograph (×2.5) of the hottest edge of the overlap for a vibration time of 550 ms at 500 N and 86.2 µm (stage 4). A kink of the first composite layer of one of the substrates (indicated with an arrow) occurs as a result of local resin flow.
Stage 5
Figure 15 shows the practical non-existence of resin at the weld line in stage 5. Significant deformation can as well be found in the fibre bundles of the composite substrates, especially noticeable on the fracture surfaces. High porosity and delamination beneath the first composite layer appeared in samples that were not consolidated after vibration (Figure 16) along with significant kinking at the hottest edge of the laminate (Figure 17). These observations together with the power decline in Figure 2 point towards melting of the composite substrates as the dominant factor in this stage. As seen in Figures 7 and 8, a low welding force results in a longer and better defined stage 5 for the same total displacement of the sonotrode during the vibration phase. When the welding force is low, heat generation and squeeze flow of the molten energy director occur at a lower pace. As a result, there is more time available for the heat to be transferred from the interface to the adherends and melting of the resin within the composite is hence more likely to happen. Differences in the heat-affected zone in the adherends are also believed to cause some slight variations in the shape of the displacement curves within stages 4 and 5, for the different parameter combinations analysed in this study (Figures 7 and 8).
Cross-sectional micrograph (×2.5; left) and fracture surfaces (right) for vibration time of 650 ms at 500 N and 86.2 µm (stage 6). The arrows indicate the position of the weld line.
Cross-sectional micrograph (×2.5) of a weld not consolidated after a vibration time of 650 ms at 500 N and 86.2 µm (stage 5). Only one substrate is shown since debonding that occurred right after the pressure was released. Notable porosity between the first and second composite layers and delamination can be seen in this micrograph.
Cross-sectional micrograph (×2.5) of the hottest edge of the overlap for a vibration time of 650 ms at 500 N and 86.2 µm (stage 5). The arrow indicates the position of the first layer of the bottom substrate, which evidences significant resin flow within the composite.
Applicability
The results presented in the previous sections show that the different events in the power and displacement curves can be translated into transformations at the welding interface and therefore can be ultimately related to the quality of the welds. Table 1 and Figure 18 show the existence of certain dispersion in the timewise position of the events that define each welding stage for the same set of welding conditions. The scatter is bigger for low force/low amplitude conditions and it mostly affects the duration of stage 2. This is attributed to the fact that low contact forces amplify the effect of the random nature of the nucleation of hot spots on the time needed for complete melting of the flat energy director. Likewise, low vibration amplitudes delay the growth of hot spots and hence stress the role of nucleation as the dominant factor in the duration of stage 2.
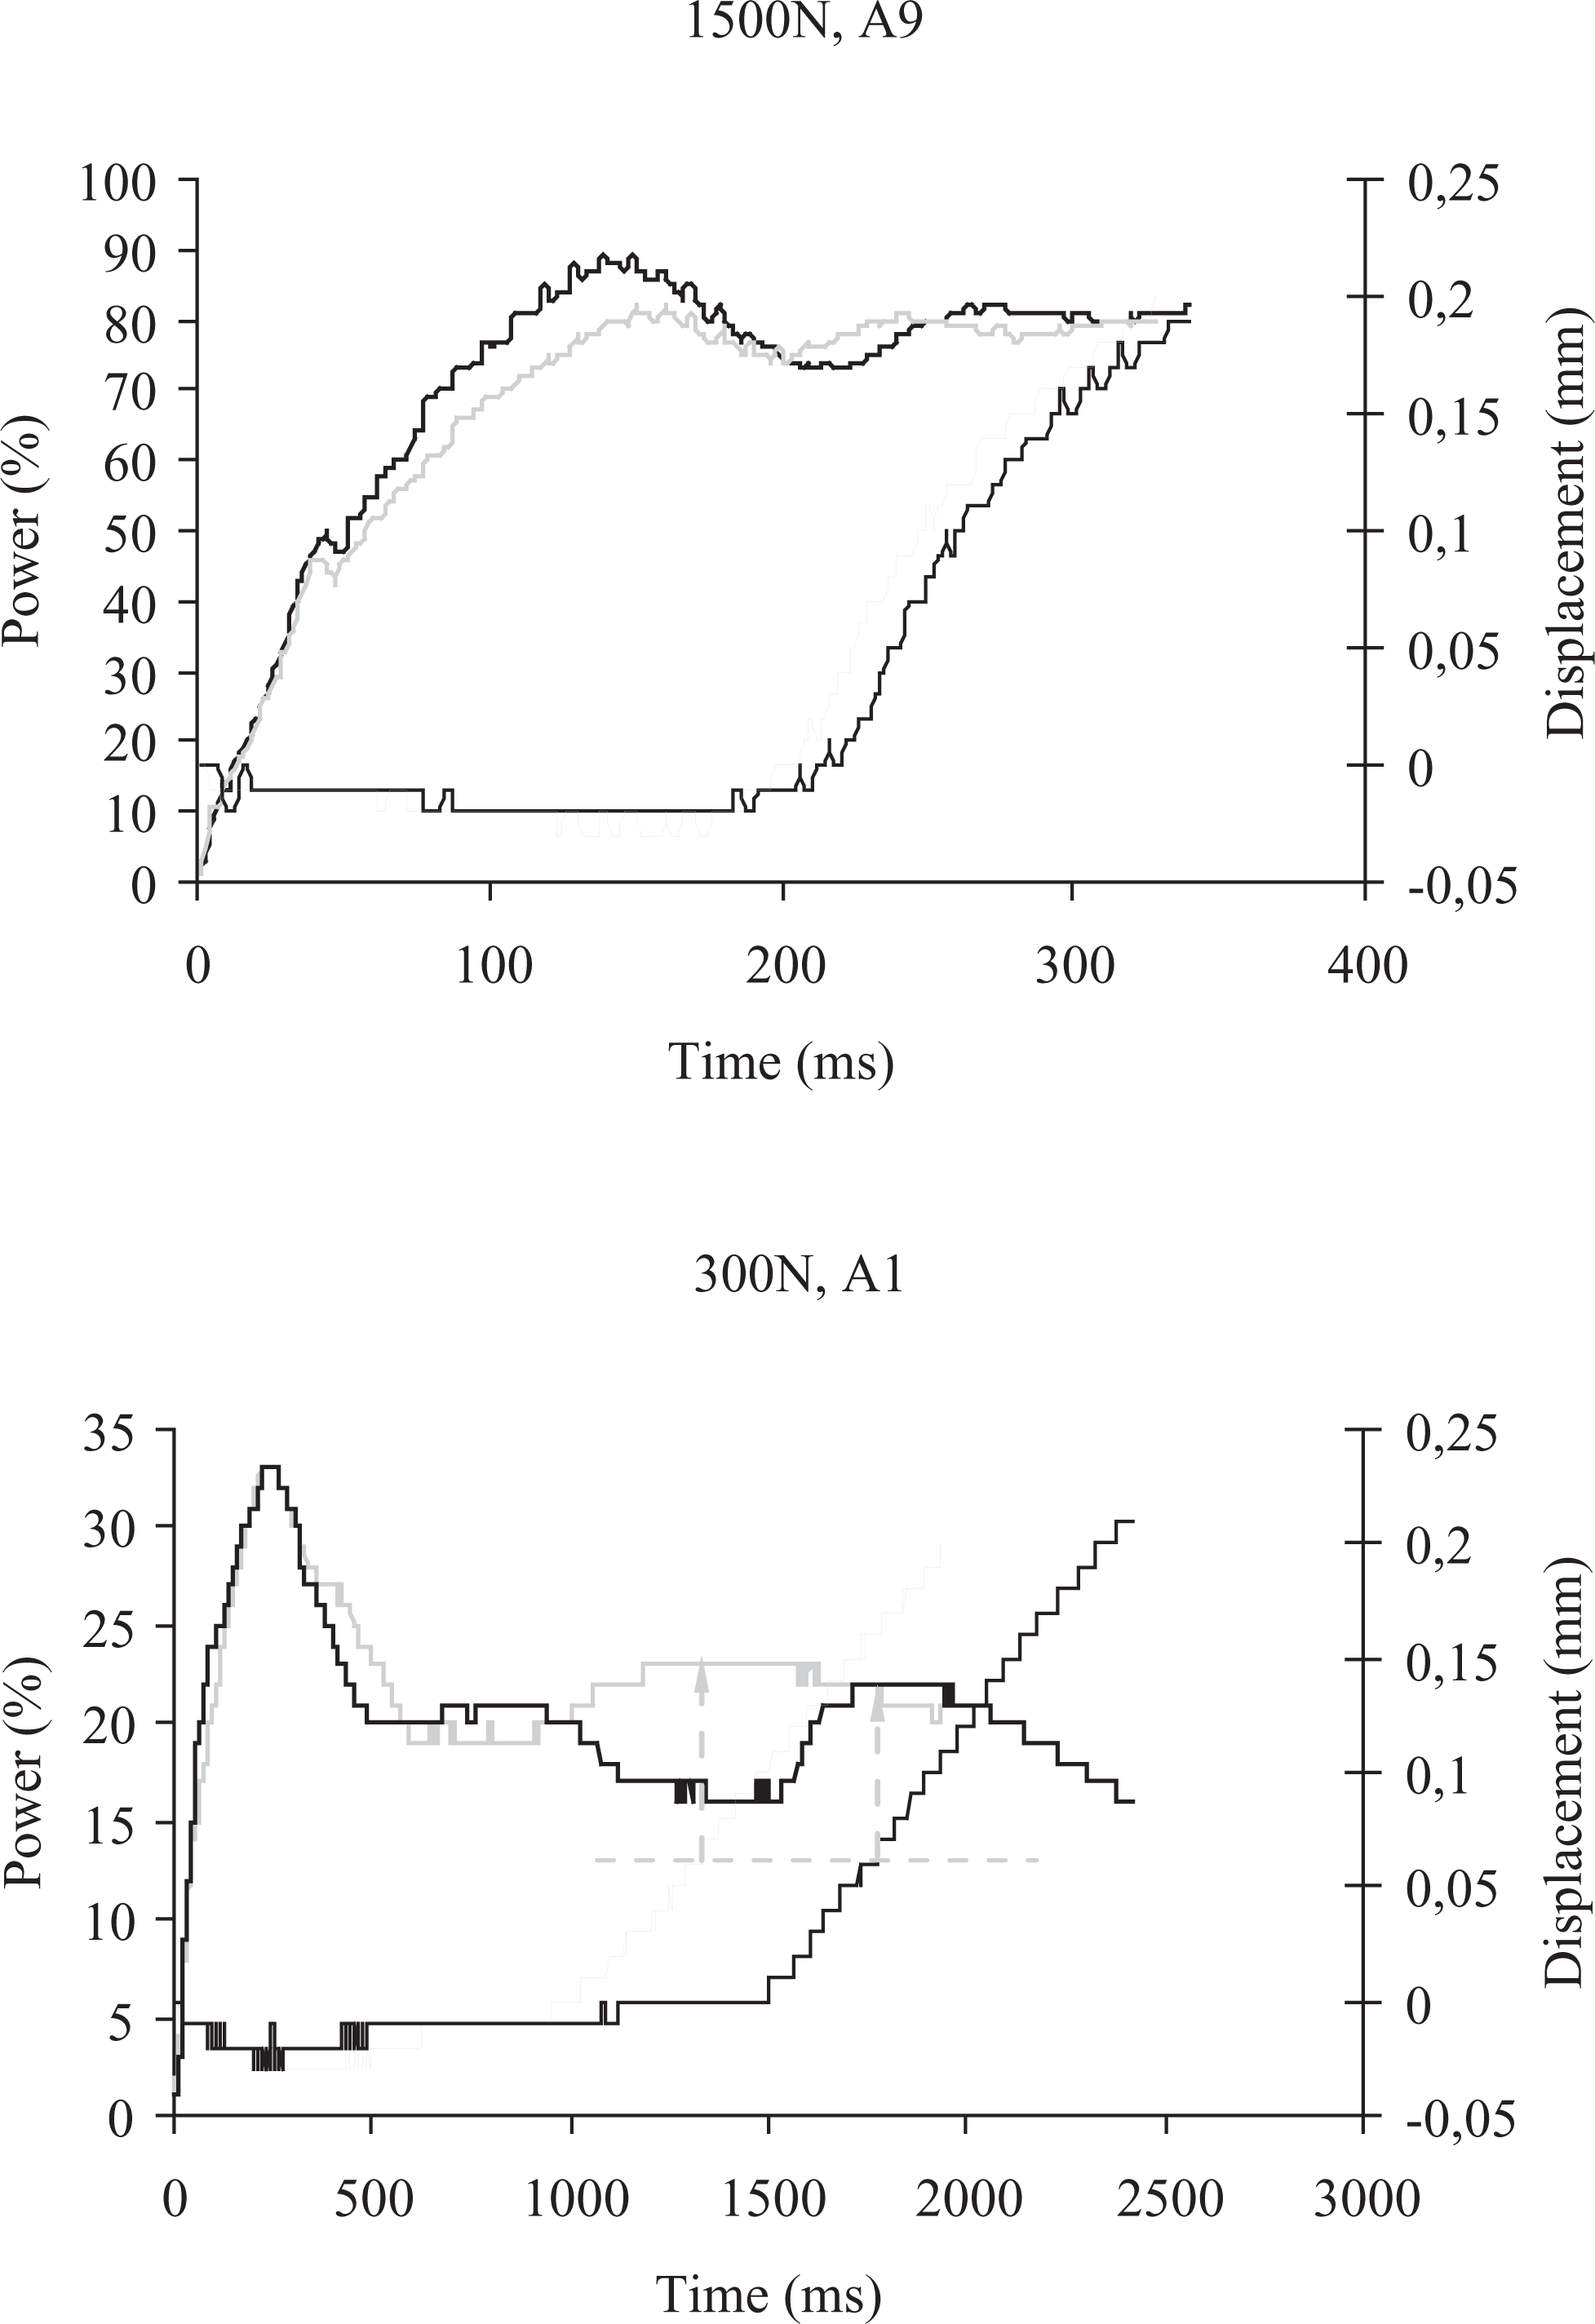
Power and displacement curves for high force/high amplitude (1500 N, A9 = 86.2 µm) and low force/low amplitude (300 N, A1 = 51.8 µm) conditions. Only the samples that yielded the lowest and highest vibration times are represented for improved clarity. The arrows in the low force/low amplitude graph indicate that the same displacement of the sonotrode leads to welds within the same stage as opposed to the vibration time. The power is depicted relative to the maximum power delivered by the welder (3000 W). The displacement of the sonotrode is relative to its position at the beginning of the vibration phase.
This timewise dispersion implies that, especially for low force/low amplitude conditions, a certain vibration time can lead to welds in different stages and most likely to significant scatter in the quality of the joints. However, as observed throughout the graphs presented in this article, there is a consistent relationship between power and displacement that indicates that a much more robust alternative to control the duration of the vibration phase would consist of using the displacement of the sonotrode (Figure 18), which is an option supported by most modern ultrasonic welders. As an example, each set of force/amplitude conditions applied in this study up to a 0.02-mm displacement of the sonotrode for the analysis of the effect of the welding parameters in the power/displacement curves consistently resulted in samples welded up to the same final stage (Figure 19).
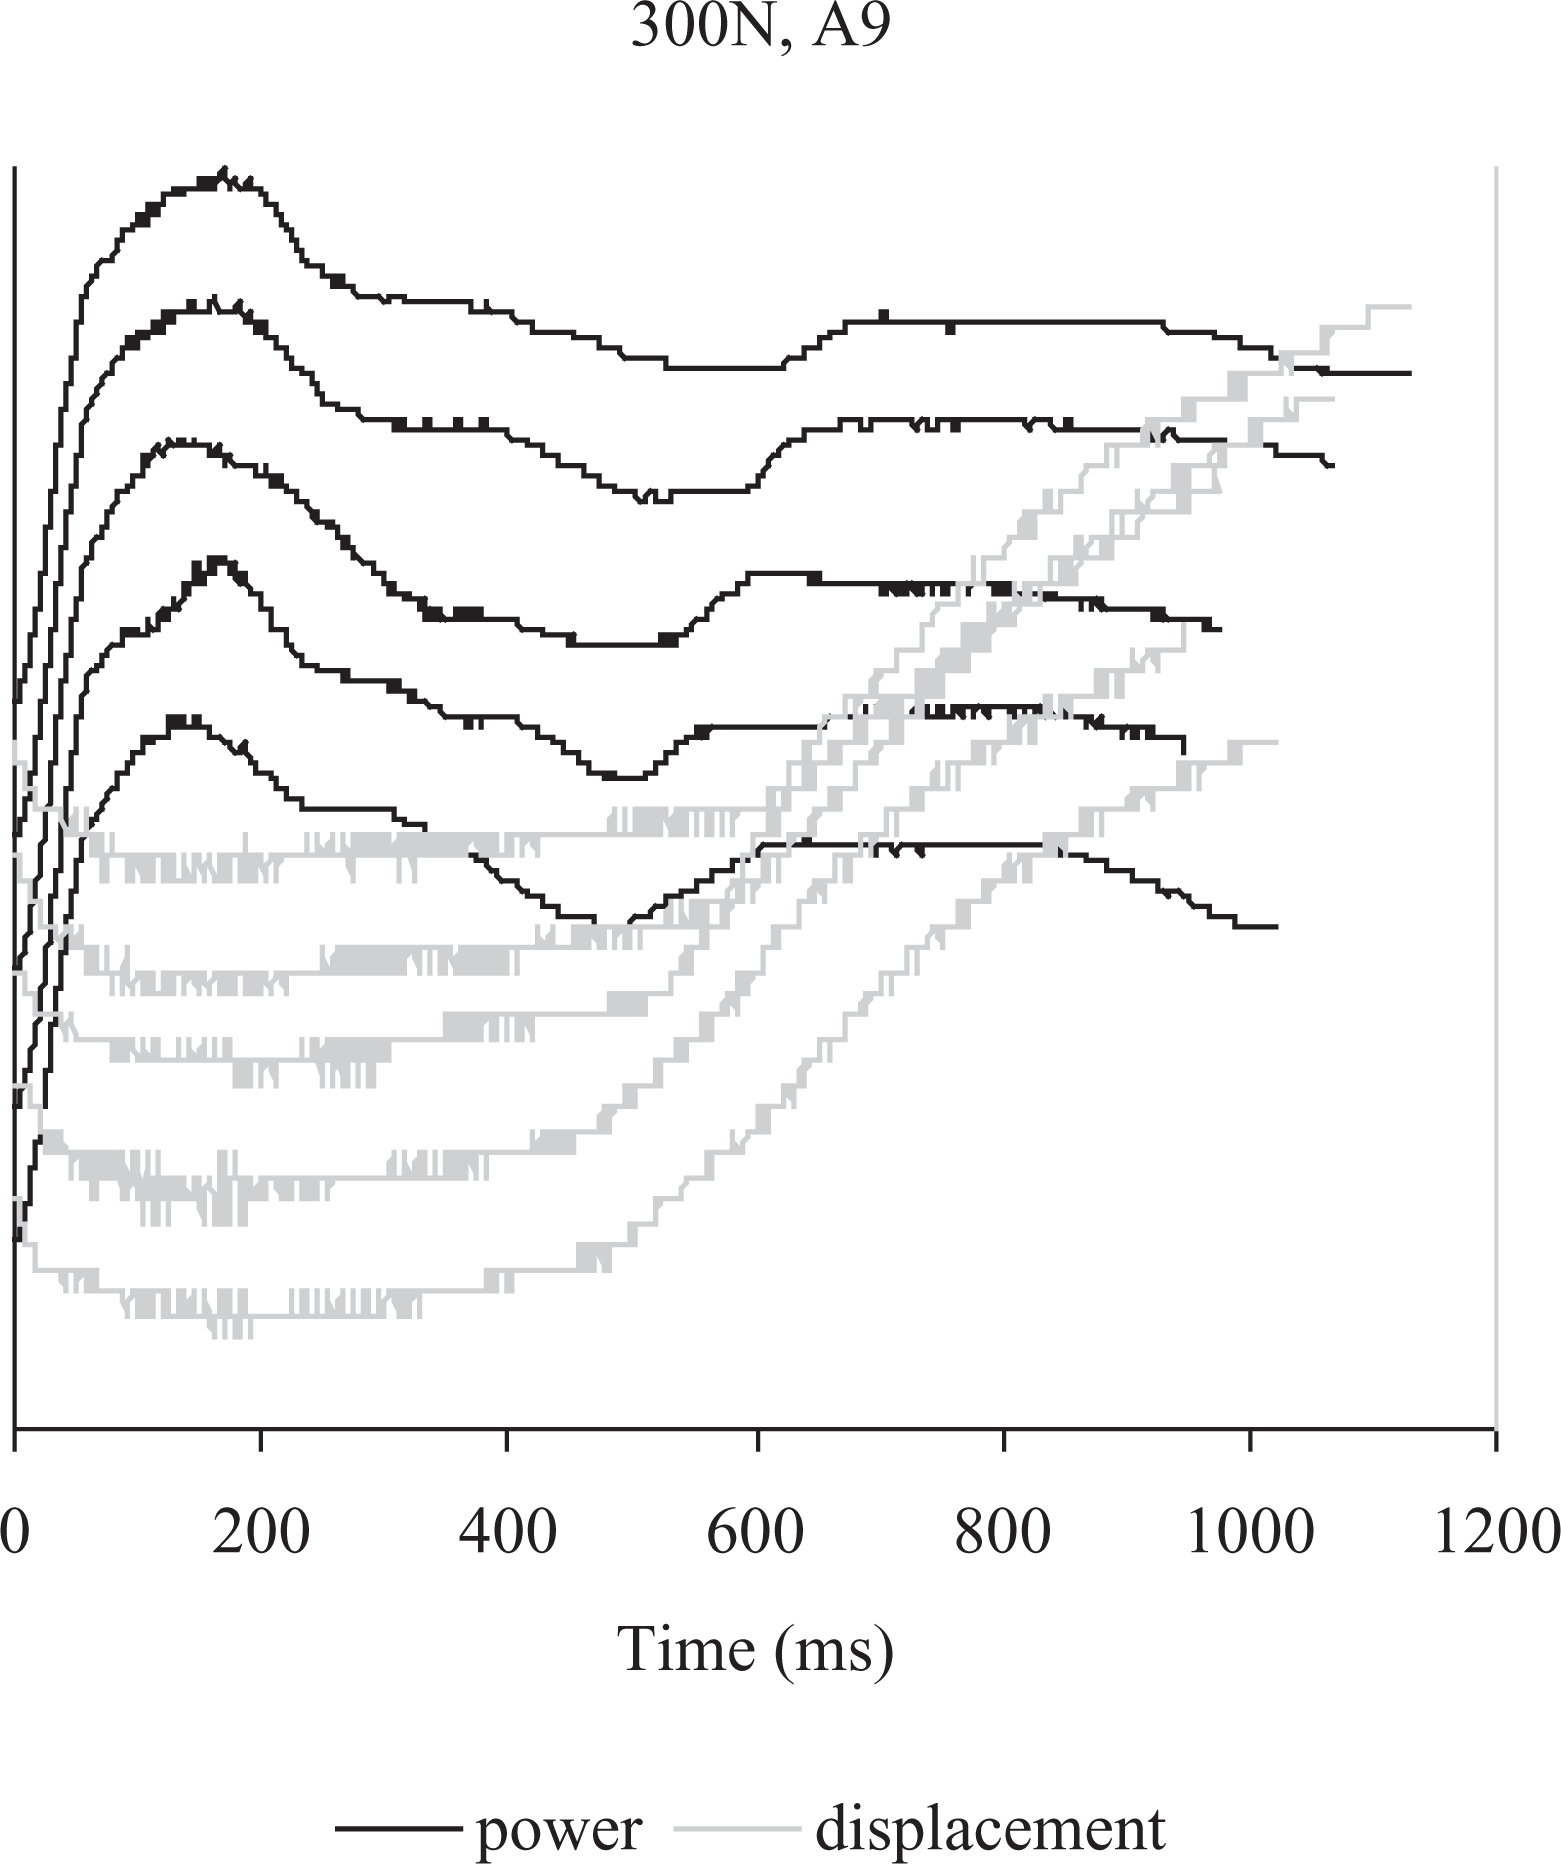
Power and displacement curves for five samples welded in the same conditions (300 N, A9 = 86.2 µm) up to a total of 0.02 mm displacement of the sonotrode. The curves are shifted vertically for improved clarity.
The fact that the shapes of the power and displacement curves and the relationships between them are repeatable and follow the trends explained in the previous sections makes them suitable for monitoring the welding process and as a basis for closed-loop-controlled ultrasonic welding. Moreover, the simultaneous rise in both the power and the displacement when the energy director starts to flow is very useful to detect possible flaws in the system, for instance a sudden frequency increase that would cause a rise in the power without it being necessarily related to any flow at the interface. Another interesting application is the definition of processing parameters for a certain material and welding configuration. Welding is a heat transfer-driven process owing to the local nature of heat generation; therefore, the optimal processing parameters change whenever the heat transfer scenario at the interface changes (e.g. thickness and stacking sequence of the substrates, welding fixture). These parameters can be defined either experimentally, which is frequently a lengthy and labour intensive process, or through models, which require material properties often not easy to measure. The possibility of using the feedback from the ultrasonic welder as a guide for the experimental definition of processing parameters based on the connection between weld quality and transformations at the interface provides ultrasonic welding with a unique advantage as compared to other welding techniques like resistance or induction welding.
Conclusions
In this experimental research work, connections were established between the transformations at the interface during ultrasonic welding of thermoplastic composites and the power and displacement data provided by the ultrasonic welder. Related works are used in the literature to achieve a more complete understanding of different stages occurring during the vibration, that is, heat generating, phase of the process. A deeper insight into the involved heating mechanisms was gained as well.
The main conclusion to be drawn from these results is that the power and displacement data provided for microprocessor-controlled ultrasonic welders can be utilised for in situ monitoring of the welding process and ultimately of the quality of the welds. Moreover, power and displacement data can be easily used to experimentally define the optimal set of processing parameters for a certain material and welding set-up, which is usually a lengthy task for other welding techniques.
Footnotes
Funding
The authors would like to acknowledge the support received from Ten Cate Advanced Composites, The Netherlands, and the valuable contribution of F. Bosch, M. Barroso and R. Dasbach to this research work.