
Abstract
In this article, polypropylene/styrene–ethylene–butylene–styrene grafted with maleic anhydride (PP/SEBS-g-MA) triblock copolymer blends and their samples containing various amounts of organo-modified montmorillonite (1–5 phr) are prepared through melt compounding in an internal mixer. X-Ray diffraction (XRD) and transmission electron microscopy (TEM) are used to evaluate the dispersion of nanoclay particles in the blends. The measurements of mechanical and thermal properties of all the samples are carried out by means of standard methods. XRD and TEM results show existence of exfoliated and intercalated structures in the samples. Furthermore, the measurements of mechanical properties of the samples show that despite the decrease in tensile strength and Young’s modulus of PP in the presence of SEBS-g-MA as a toughening agent, addition of clay as the reinforcing filler improves these properties. So, a good balance between strength/stiffness and toughness/ductility is obtained with the addition of SEBS-g-MA and clay simultaneously and controlling their contents. Finally, thermal studies reveal that addition of clay has no significant influence on the structure and stability of the PP crystals formed.
Introduction
In recent years, polymer–silicate-layered (PSL) nanocomposites attracted academic and industrial attentions due to their outstanding properties, despite low-level loadings of silicate-layered nanoparticles than those of conventional composites. 1 The enhanced properties include high thermal stability, flame retardancy, barrier properties, better strength, stiffness and so forth. 2,3 The main reason for these improved properties is the interfacial interaction between the polymer matrix and silicate layers as opposed to the conventional composites, which is one of the crucial factors in attaining the unique properties. 4
The primary idea of preparation of PSL nanocomposites is carried out by Toyota Co., (Japan) in 1980s, on the polyamide-6/montmorillonite (MMT) clay composites. 5 Since then, many research works have been carried out on different polymer/clay composite materials including polyolefins, 6,7 styrene–butadiene–styrene block copolymers 8,9 and so on.
MMT is the most common silicate used widely in PSL nanocomposites. Since MMT is only used as a nanofiller in polar polymers, to use a non-polar polymer as the matrix, treatment of MMT with certain organic modifiers (e.g. alkylammonium cation) is necessary. 10
Polypropylene (PP) is a semi-crystalline polymer with extensive properties. It also has easy processability and versatility of applications. However, its application as an engineering thermoplastic is somewhat limited because of its relatively poor impact resistance, especially at low temperature or high impact rate. 11 Blending PP with an elastomer is an effective way to improve impact toughness of PP, but its strength and stiffness are reduced. 12 On the other hand, addition of clay can provide the required strength and stiffness of PP, but decreases its impact strength. 13 The stiffness/strength has been challenging toughness/ductility in the case of PP with the addition of elastomer and clay simultaneously. Therefore, the balance between the stiffness and toughness of PP could be achieved by controlling the amount of elastomer and clay.
Styrene–ethylene–butylene–styrene (SEBS) triblock copolymer is one of the most extensive used elastomer, which exhibits good processability and thermal stability. 14,15 However, due to incompatibility between PP/SEBS and clay, some properties may be weakened. To improve compatibility and interfacial adhesion between phases using SEBS grafted with maleic anhydride (SEBS-g-MA) as a compatibilizer is necessary. 13,16 SEBS-g-MA triblock copolymer has been used widely to increase the compatibility and also to improve the toughness of the polymer blends and composites. 17,18
There are many research works on synthesis and properties of compatibilized PP–clay nanocomposites. 19 –21 But study on the properties of PP/MMT nanocomposites toughened with SEBS-g-MA elastomer is few. Paul and co-workers 22 reported that the addition of MMT to PP/elastomer could increase yield strength and decrease elongation at break. Bao and Tjong 23 found that the SEBS-g-MA is mostly used in increasing the impact essential work and non-essential work of PP/MMT nanocomposites at the expense of modulus. However, it seems that the challenge between stiffness and strength of PP reinforced with organo-modified MMT (O-MMT) and toughened with SEBS-g-MA is not studied profoundly. In this work, an attempt is mainly made to prepare PP nanocomposite materials with optimized stiffness and toughness properties via addition of both SEBS-g-MA and clay. This work elucidates the balanced mechanical properties further and also evaluates the thermal behaviour of all the prepared samples by varying elastomer and clay contents.
Experimental
Materials
The materials used in this study are (i) an isotactic PP homopolymer purchased from Iran National Petrochemical Co. (Iran) with the commercial name of PY0400®. The melt flow index (MFI), density and melting temperature (T m) of PP are 3.0 g/10 min (at 230°C and 2.16 kg load), 0.92 g/cm3 and 164°C, respectively. (ii) SEBS triblock copolymer grafted with 1.84 wt% maleic anhydride (SEBS-g-MA) was supplied by Shell Chemical Co. (Moerdijk/Pernis, Netherlands) under the trade name of Kraton FG 1901X®. It has been reported that the ratio of styrene to ethylene/butylene in the triblock copolymer is 28/72 wt% and its MFI value is 22 g/10 min (at 230°C and 5 kg load). (iii) A commercial O-MMT (Cloisite®15A, denoted as C15A in the following) was obtained from Southern Clay Product Inc. (Gonzales, Texas, USA). (iv) A phenolic primary antioxidant with the trade name of Irganox®1010 and chemical name of pentaerythritol tetrakis (3-(3,5-di-tert-butyl-4-hydroxyphenyl)propionate) was supplied by Ciba Specialty Chemicals (Switzerland).
Preparation of samples
In order to prepare PP/SEBS-g-MA blends, the SEBS-g-MA, PP and Irganox1010 were pre-mixed manually and then melt mixed in a Brabender PL2200 internal mixer (Germany) (with a volumetric chamber capacity of 60 cm3) at 190°C and rotor speed of 75 r/min for 12 min. To prepare samples containing nanoparticles, after 3 min compounding, the C15A was added to the mixtures. The composition and the sample codes are presented in Table 1. In all formulations, 0.5 wt% Irganox1010 was added to prevent thermal degradation of PP during the melt mixing.
Sample codes and MFI values of the prepared PP/SEBS-g-MA blends and nanocomposites.
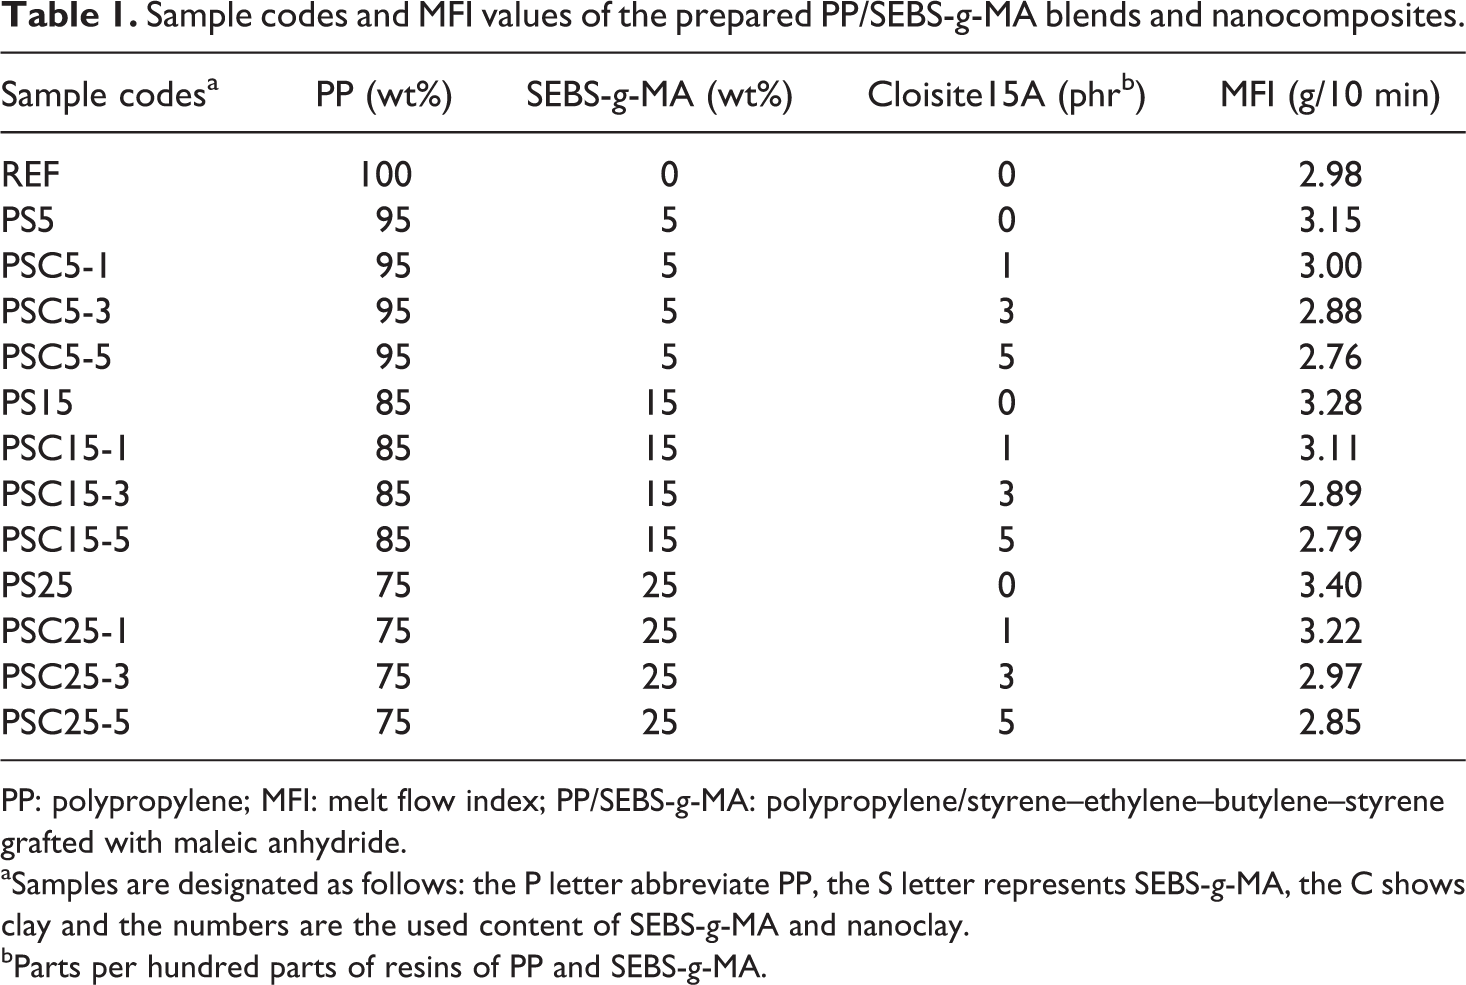
PP: polypropylene; MFI: melt flow index; PP/SEBS-g-MA: polypropylene/styrene–ethylene–butylene–styrene grafted with maleic anhydride.
aSamples are designated as follows: the P letter abbreviate PP, the S letter represents SEBS-g-MA, the C shows clay and the numbers are the used content of SEBS-g-MA and nanoclay.
bParts per hundred parts of resins of PP and SEBS-g-MA.
The prepared samples were then compression moulded according to the ASTM D 4703 in a hot-press machine (Dr Collin type P 300P/M, Germany) under conditions of 190°C temperature and 31 MPa pressure for 9 min to obtain the sheets with appropriate thickness for each mechanical test. Afterwards the plates were cooled to ambient temperature at the rate of 1.5°C/s.
Structure characterization
X-Ray diffraction (XRD) and transmission electron microscopy (TEM) were employed to evaluate the dispersion of nanoclay in the blend samples. A Phillips X-Pert diffractometer unit (Canada), which operates at 40 kV and 40 mA, was used to carry out the experiments at room temperature. The x-ray source was Cu-Kα radiation with a wavelength of 0.154nm. The diffractograms were scanned in the 2θ range of 1.2–10° with the rate of 0.02°/s. TEM observations were obtained by a Phillips CM200 SEM/TEM apparatus (USA) at an acceleration voltage of 200 kV. Ultrathin sections (80 nm) from the samples were obtained with a C-Reichert OMU3 ultra microtome (Austria) under cryogenic conditions.
Morphological studies
Morphology of the samples was observed by means of scanning electron microscopy (SEM). The fractured surfaces of impact test specimens were examined by a Cambridge Instruments S360 Analytical SEM (England). Prior to the test, all samples were coated with a thin layer of gold using a BIO RAD E5200 auto sputter coater (UK) to prevent electrostatic charging and poor resolution during examination.
Mechanical properties
Tensile properties (ultimate tensile strength (UTS), elongation at break and Young’s modulus) were measured according to ASTM D638 using a Gotech Servo Control Universal Testing Machine (Taiwan) with a cross-head speed of 10 mm/min.
Notched Izod impact strength and tensile impact tests were performed by means of a Ceast Resil 5.5J apparatus (Italy) according to ASTM D256 and ASTM D1822, respectively. For Izod test, impact strength is calculated by dividing the impact value to the thickness of specimen (Joules per meter) or to the area of specimen (Joules per square meter) and for tensile impact test, is determined by the kinetic energy extracted from the butterfly pendulum in the process of breaking the specimen. The main scope of the tensile impact test is to investigate the impact behaviour of the samples in the tension mode and this test is aligned with the tensile test.
Flexural properties were determined in a three-point bending configuration using an Instron testing machine (USA) (model no. 4465-5kN), according to ASTM D790. The span distance and cross-head speed used were 100 mm and 2 mm/min, respectively.
The hardness (Shore D Durometer) was measured according to ASTM D2240 using a Zwick-Roell hardness tester (Germany). The specimens for hardness test were cut from 6-mm thick compression-moulded sheet samples.
All the mechanical tests conducted at 23 ± 2°C and 50 ± 5% humidity and the average value of at least five replicates was taken for each composition.
Thermal properties
The crystallization and melting behaviour of the samples were characterized by differential scanning calorimeter (Mettler Toledo DSC 822e thermal analyser, Switzerland) in nitrogen atmosphere under a flow rate of 50 mL/min. The sample weight of 7 mg sealed in aluminium pan was heated from 25°C to 230°C at the rate of 10°C/min and held at this temperature for 5 min to eliminate previous thermal history during processing. Then, the sample was cooled back to 25°C at the rate of 10°C/min, held at this temperature for 5 min and finally, the second heating and cooling, similar to the first, were performed. Before all tests, the heat flow and the temperature of the instrument were calibrated using standard materials, such as indium and zinc. The crystallization and melting thermograms were recorded from the second heating and cooling cycle. The T
m and crystallization temperature (T
c) were determined from the differential scanning calorimetric (DSC) thermograms; and the percentage of crystallinity was calculated using the following equation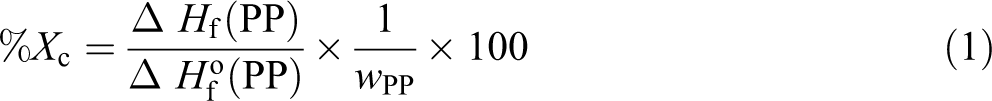
where
Heat deflection temperature (HDT) and vicat softening temperature (VST) of the samples were determined using a CEAST HDT-Vicat analyser (Italy). The HDT test was performed according to ASTM D647 under a three-point bending mode at the heating rate of 2°C/min and the stress of 1.8 MPa. The VST measurement was also carried out under a force of 50 N, according to ASTM D1525.
Results and discussion
Structure
Figure 1(a) to (c) shows the XRD patterns of the blend samples containing (a) 1%, (b) 3% and (c) 5% nanoclay, compared with the pristine C15A as the reference. A characteristic peak that appeared at the angle of 2θ = 2.88° in the XRD pattern of C15A is attributed to the d
001 basal spacing of 3.06 nm according to the Bragg’s diffraction equation
XRD patterns of C15A and PP/SEBS-g-MA nanocomposites. (a) 1%, (b) 3% and (c) 5% of nanoclay. XRD: x-ray diffraction; PP/SEBS-g-MA: polypropylene/styrene–ethylene–butylene–styrene grafted with maleic anhydride; C15A: Cloisite15A.
Morphology
TEM images
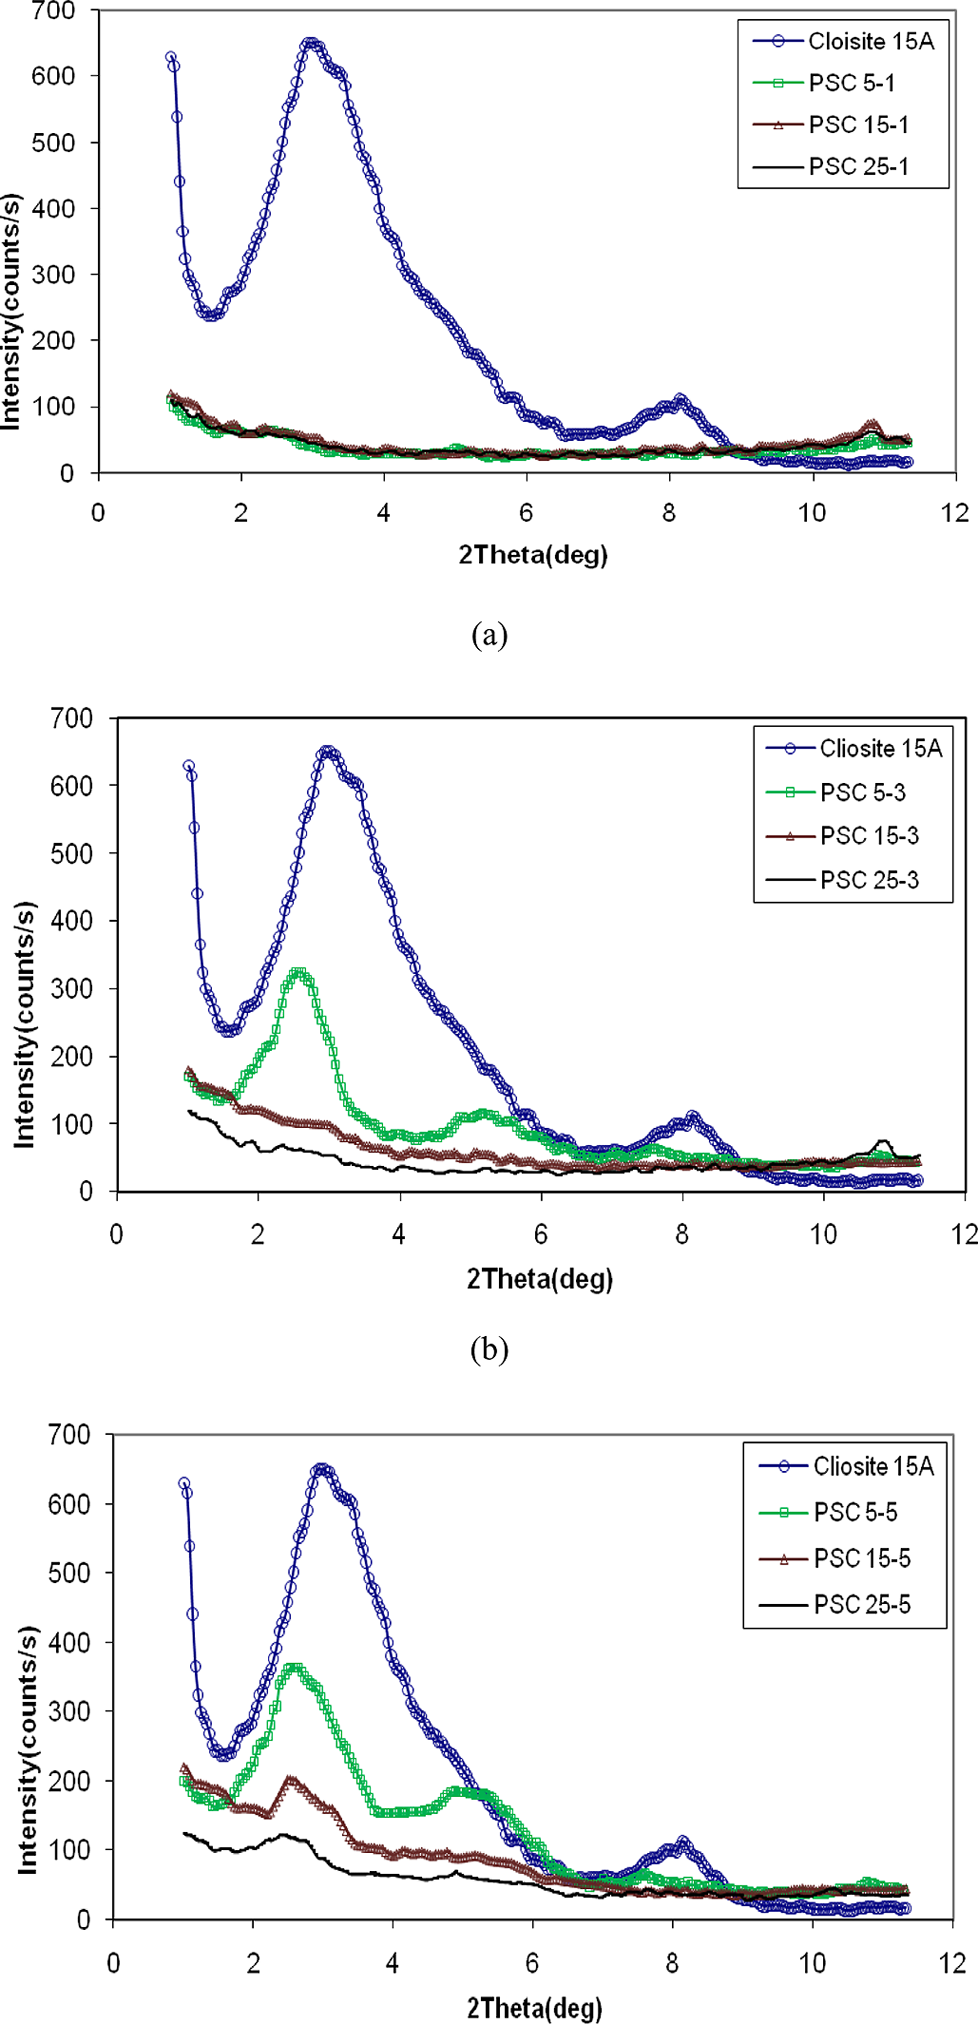
In addition to the XRD investigations, TEM was carried out for some prepared samples, to delineate the dispersion status of the C15A in the matrix. Figure 2(a) shows the TEM image of PSC15-3 as an example, which has high degree of exfoliation. This is in agreement with the XRD results as discussed previously.
TEM of (a) PSC15-3; (b and c) PSC15-5. TEM: transmission electron micrographs.
Figure 2(b) and (c) also shows the TEM images of PSC15-5, which has good intercalated structure, as already observed in its XRD pattern. This micrograph shows that each layer of silicate is well dispersed and intercalated throughout the polymer matrix. The dark regions and lines represent the intersection of individual (b) and agglomerated (a) silicate layer, while the grey base corresponds to the polymer matrix phase. This implies the formation of good intercalated structure and also low degree of exfoliation. Dispersion of clay particles in the blend matrix (exfoliation or intercalation) would affect the mechanical properties of the blend, which will be discussed later.
SEM images
It is necessary to study the morphology of the final product as it affects the mechanical properties. Figure 3(a) to (d) shows the SEM images of impact fracture surface of PS15 and PSC15-3 samples in two different magnifications, as an example. A dispersed phase of SEBS-g-MA in small average particle size can be observed from Figure 3. It can be seen that there is obscure interface between PP matrix and SEBS-g-MA particles, implying a good compatibility and better adhesion between them, because the chemical structure of PP is similar to ethylene–butylene (EB) midblock of SEBS-g-MA chain. Similar observations have been reported by others. 23,26 On the other hand, it appears that the maleic anhydride groups, grafted on the backbone of SEBS, have good compatibility with C15A nanoparticles and causes uniform dispersion of clay in the PP/15%SEBS-g-MA blend matrix. The obtained results lead to an improvement in mechanical properties especially impact resistance in binary blends provided by SEBS-g-MA particles that aid for stress transfer across the interface to matrix. 23
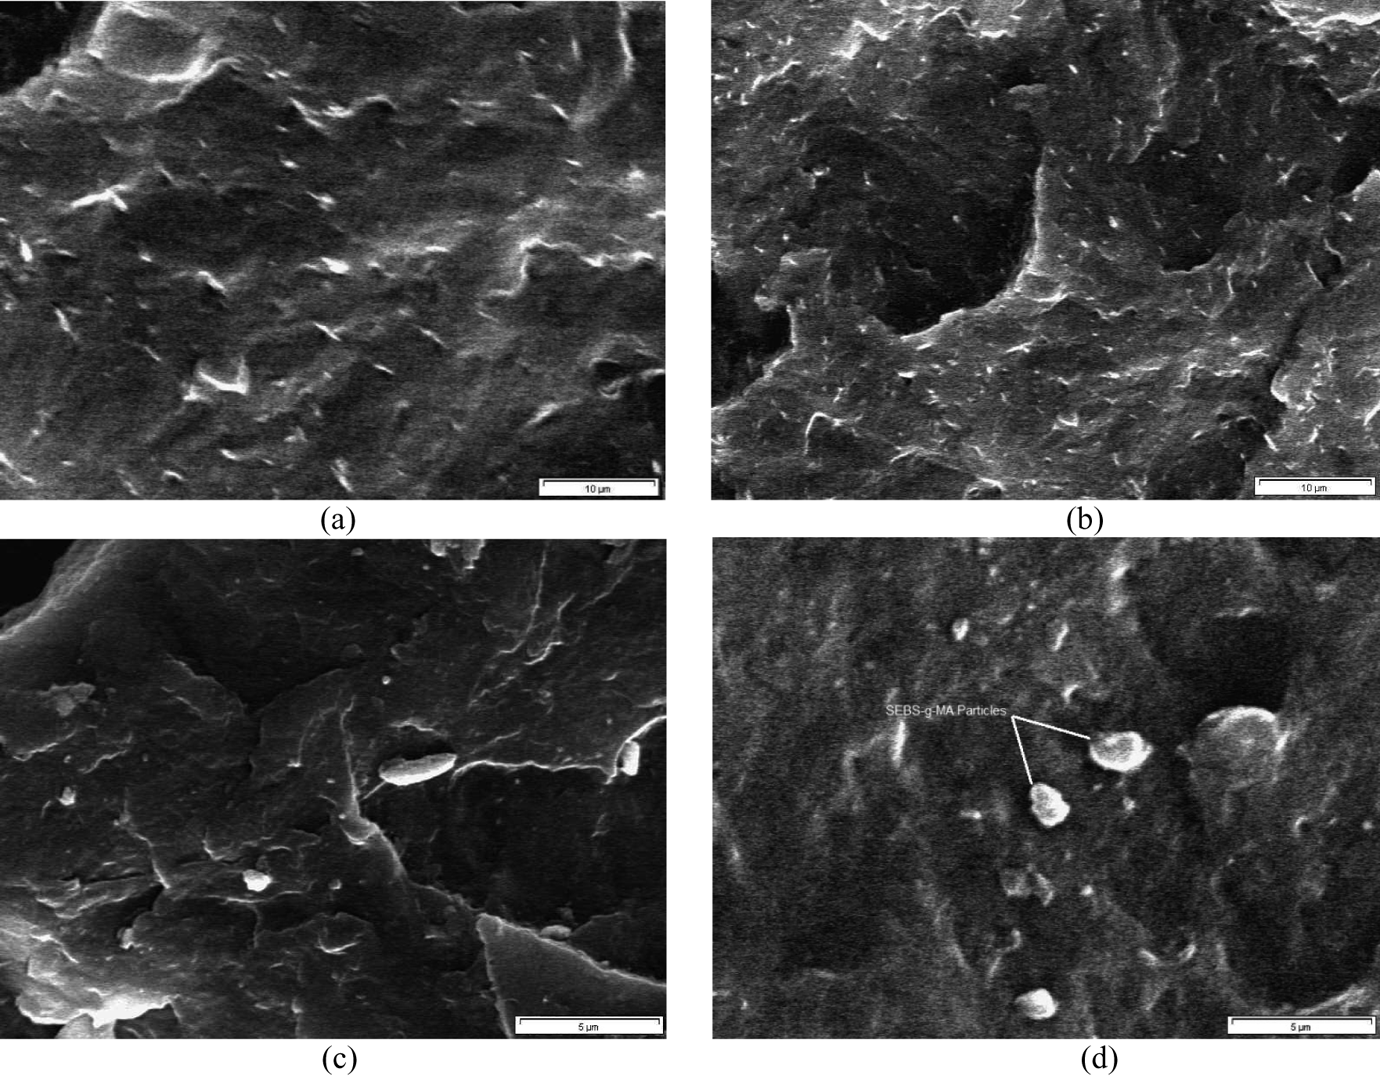
SEM of impact fracture surface of (a) PS15 and (b) PSC15-3. (c) and (d) are higher magnification images of the PS15 and PSC15-3, respectively. SEM: scanning electron micrographs.
Mechanical properties
Tensile properties
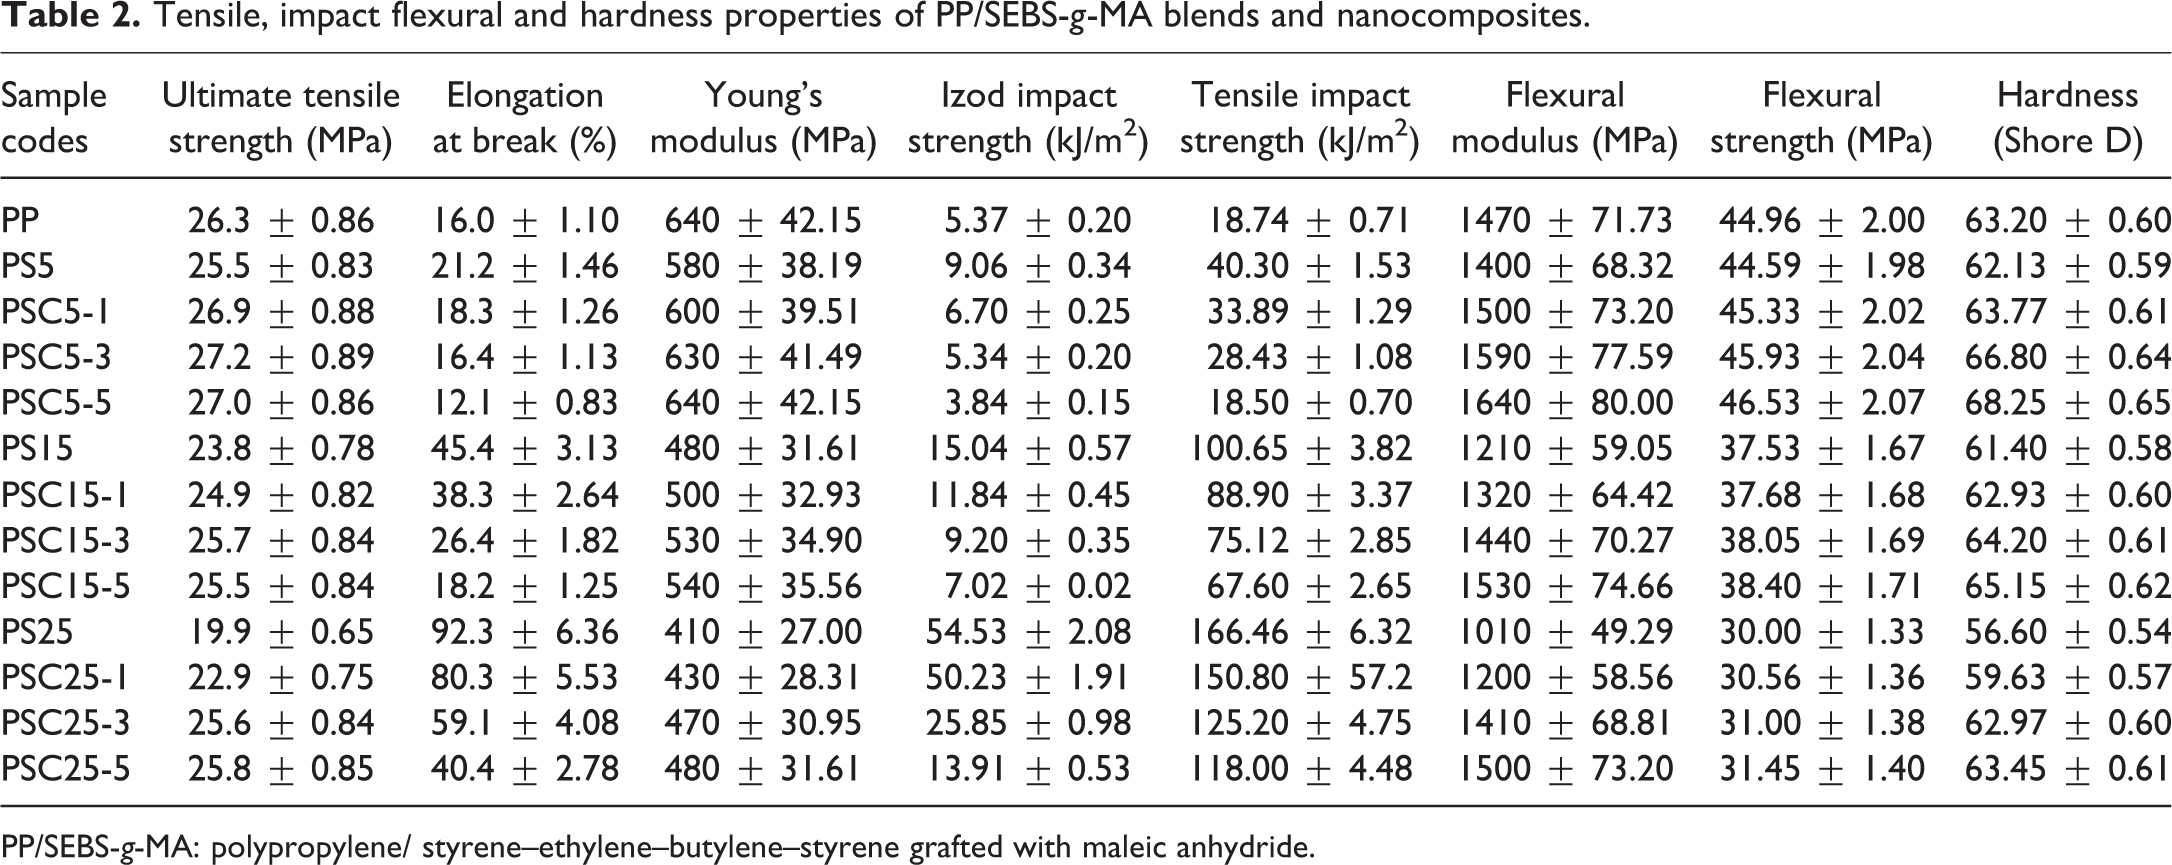
Variation in UTS, Young’s modulus (E) and elongation at break (∊ b) of PP with increasing elastomer and clay contents are presented in Table 2. It can be seen that the incorporation of SEBS-g-MA and C15A influences the tensile properties, as expected. It is seen that there is a continuous decrement in UTS by increasing the SEBS-g-MA concentration. This may be attributed to the elastomeric nature of SEBS-g-MA. 27 On the contrast, the nanocomposite samples exhibit higher UTS compared with the blend samples. But their behaviour is fluctuant, such that with the incorporation of C15A till 3%, the UTS enhances and the decrement trends are observed with increasing 5% clay. It could be due to the decrease in the degree of exfoliation, which is a main factor affecting the amount of UTS (see XRD and TEM results). It should be noted that the presence of more than 3% clay in the blends, which may cause separation and agglomeration, is responsible for lower UTS. 28 But on the other hand, the observed increment in UTS would be influenced by different factors: (1) natural reinforcement effect of clay particles; (2) higher degree of dispersion and distribution (i.e. degree of exfoliation/intercalation) of the C15A in PP/SEBS-g-MA blends and (3) the interfacial interaction between C15A and PP/SEBS-g-MA matrix. 29,30 These factors would be critical for improving the tensile properties of the nanocomposite samples. 28
Tensile, impact flexural and hardness properties of PP/SEBS-g-MA blends and nanocomposites.
PP/SEBS-g-MA: polypropylene/ styrene–ethylene–butylene–styrene grafted with maleic anhydride.
From Table 2, it can also be observed that the ∊ b percentage increases continuously with the addition of SEBS-g-MA. In this work, SEBS-g-MA is added as a tougher (as well as compatibilizing agent), so that the samples containing SEBS-g-MA exhibit higher ductility than the neat PP. However, addition of C15A leads to the insignificant continuous reduction in ∊ b percentage of the blends, due to the immobility of the blend chains caused by the intercalated/exfoliated clay platelets. It seems that the elongation at break of the composites depends on the degree of dispersion of the filler in the blend matrix and the adhesion at the filler–matrix interface, 25 so that the samples containing 5% clay shows lower ∊ b percentage among others. On the other hand, SEBS-g-MA could act as stress concentrator around the clay particles during the tensile test and causes plastic deformation. So, the polymer chains absorb enough loss energy to elongate to larger amounts. 25,31 It also seems that degree of crystallinity (X c) influences the ductility of the samples. Mohd Ishak et al. 16 found that the reduction in the X c is also responsible for improved ductility.
From Table 2, it is also observed that as the amount of SEBS-g-MA increases, Young’s modulus reduces. The obtained decrease may be due to the low modulus of SEBS-g-MA. On the other hand, addition of C15A particles to the blend samples increases the modulus values of the samples considerably. Because of high stiffness, the large aspect ratio and surface area of the clay, polymer–particle interactions are enhanced and as a result cause restriction in the mobility of the polymer chains. These factors can be responsible for increasing Young’s modulus with increasing C15A content. 32 Similar tensile results were observed by other researchers previously. 13,16
Impact strength
Table 2 indicates the effect of SEBS-g-MA and C15A contents on the Izod impact and tensile impact strength of PP and its blends. It can be seen that the addition of nanoclay decreases Izod impact and tensile impact strength negligibly, like elongation at break. This behaviour is commonly observed in the PP nanocomposites. In general, nanofiller incorporations are undesirable to these properties of polymers. 20 Denac et al. reported that different factors may influence the impact properties of the blends and composites, like elasticity of elastomers, particle size, aspect ratio of filler and its concentration, interaction between phases and so forth. 33 The reduction in Izod impact and tensile impact strength could be attributed to the chain immobility of the polymer blends by the clay particles that cause the material to be brittle. This behaviour is intensified with the incorporation of higher clay loading. In addition, each silicate layer or probable aggregates (especially at 5% clay) could act as stress concentrator or microcrack initiator. 16 On the contrary, incorporation of SEBS-g-MA as an impact modifier and also as a compatibilizer improves these properties due to improved interfacial adhesion between PP and EB midblock of SEBS-g-MA chains. 25 Kelnar et al. 34 found that the elastomer particles increase the toughness by both acting as stress concentrators and influencing the clay-induced matrix crystalline structure.
Similar to the elongation at break results (already discussed), X c may affect impact strength of the samples. It is found that the addition of SEBS-g-MA decreases the X c and causes improvement in impact strength. 35 The similar impact strength results were also reported by other researchers previously. 13,16,25,33
Flexural properties
Table 2 presents variation in flexural properties of the samples with the addition of SEBS-g-MA and C15A. The incorporation of SEBS-g-MA into PP decreases its flexural strength and flexural modulus. This could be due to the low modulus elastomeric portion of SEBS-g-MA. On the other hand, addition of clay slightly increases the flexural strength but significantly improves the flexural modulus, as compared to the blend samples. The increments may be related to the reinforcing and stiffness effects of clay particles. 35 The high surface area of the C15A particles exposed to the blend matrix could play a main role in improving the flexural properties of the nanocomposites. 32 As discussed earlier, dispersion of C15A particles and the intercalated/exfoliated structures are critical factors for mechanical properties of PP/SEBS-g-MA nanocomposites, but this effect in case of flexural properties is negligible. The obtained results are found in good agreement with previous reports on PP/PA6/SEBS-g-MA nanocomposites. 16,25
Hardness properties
Hardness results of PP/SEBS-g-MA blends and nanocomposites are presented in Table 2. The results show that introducing SEBS-g-MA in PP matrix significantly decreases the hardness of the samples. On the contrary, addition of clay into the blends does not show a remarkable increase in hardness. As mentioned earlier, because of elastomeric nature of SEBS-g-MA, there is a continuous decrement in hardness by increasing the SEBS-g-MA concentration. Presence of stiff C15A platelets and entanglement of polymer chains made the PP/SEBS-g-MA nanocomposites harder. Similar results have been reported by many researchers for nanocomposites. 29,30
From the above mechanical properties, it can be concluded that a good balance between strength/stiffness and toughness/ductility is obtained with the addition of SEBS-g-MA and clay simultaneously and controlling their contents.
Thermal properties
DSC study
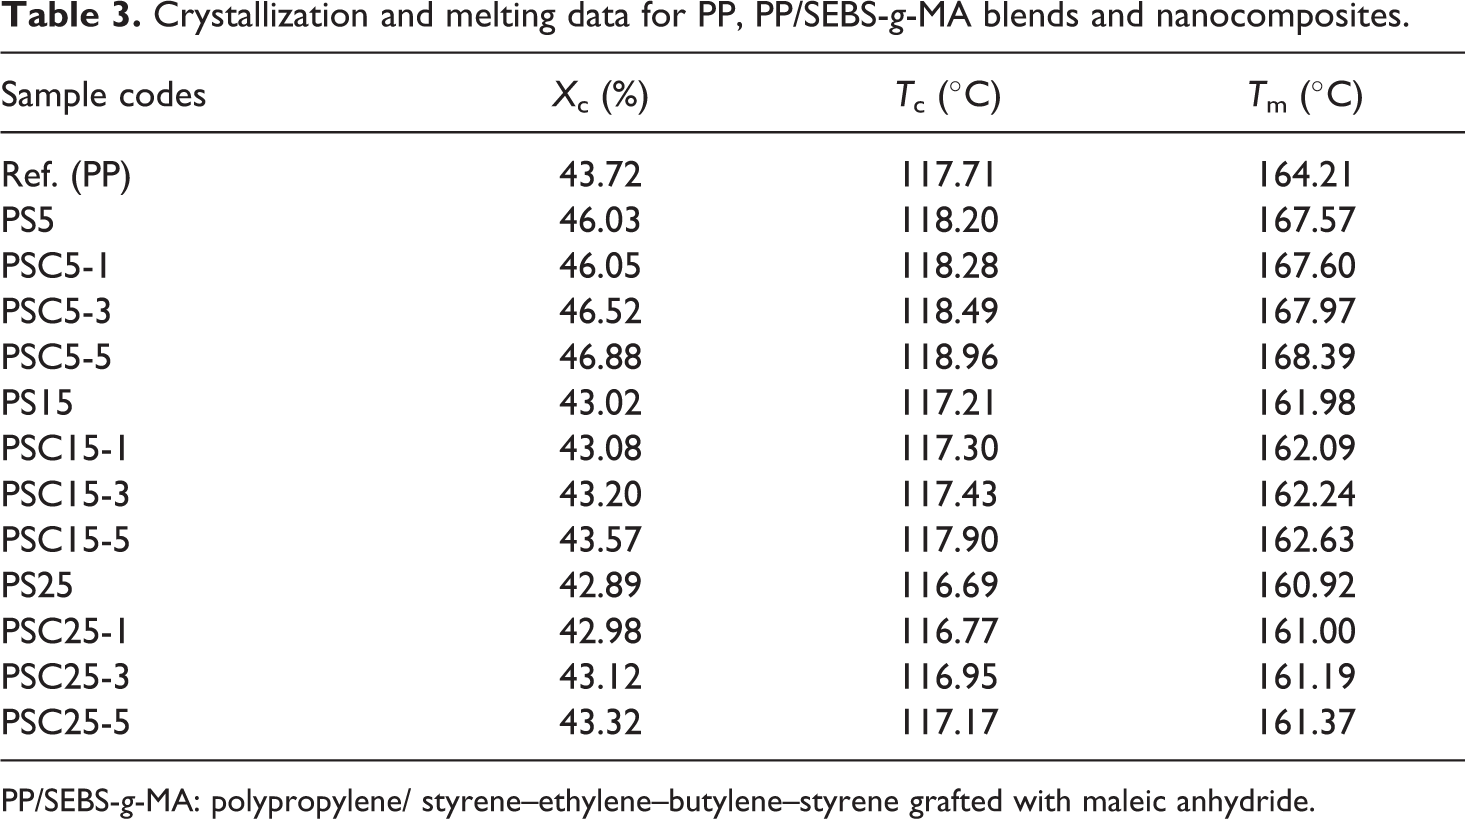
It is interesting to note how the crystallization and melting behaviour of the PP vary with the addition of the SEBS-g-MA and C15A. The T m, T c and X c of all the prepared samples are summarized in Table 3. Figure 4(a) and (b) also shows the DSC cooling thermograms of the PP/SEBS-g-MA blends and PP/15%SEBS-g-MA nanocomposites, respectively. From Figure 4 and Table 3, it can be observed that the addition of 5 wt% SEBS-g-MA to PP increases its T c and X c, but with more increase in the SEBS-g-MA content (from 5 wt% to 15 wt% and then to 25 wt%), an opposite trend is observed. Similar results have also been reported previously. 13,20,25 The same observations are obtained for T m of the mentioned samples based on Figure 5(a) and (b) and Table 3. Furthermore, it is clear that the addition of C15A shows few changes in crystallization and melting behaviour of nanocomposite samples so that insignificant increase in the T c and X c of PP is obtained.
Crystallization and melting data for PP, PP/SEBS-g-MA blends and nanocomposites.
PP/SEBS-g-MA: polypropylene/ styrene–ethylene–butylene–styrene grafted with maleic anhydride.
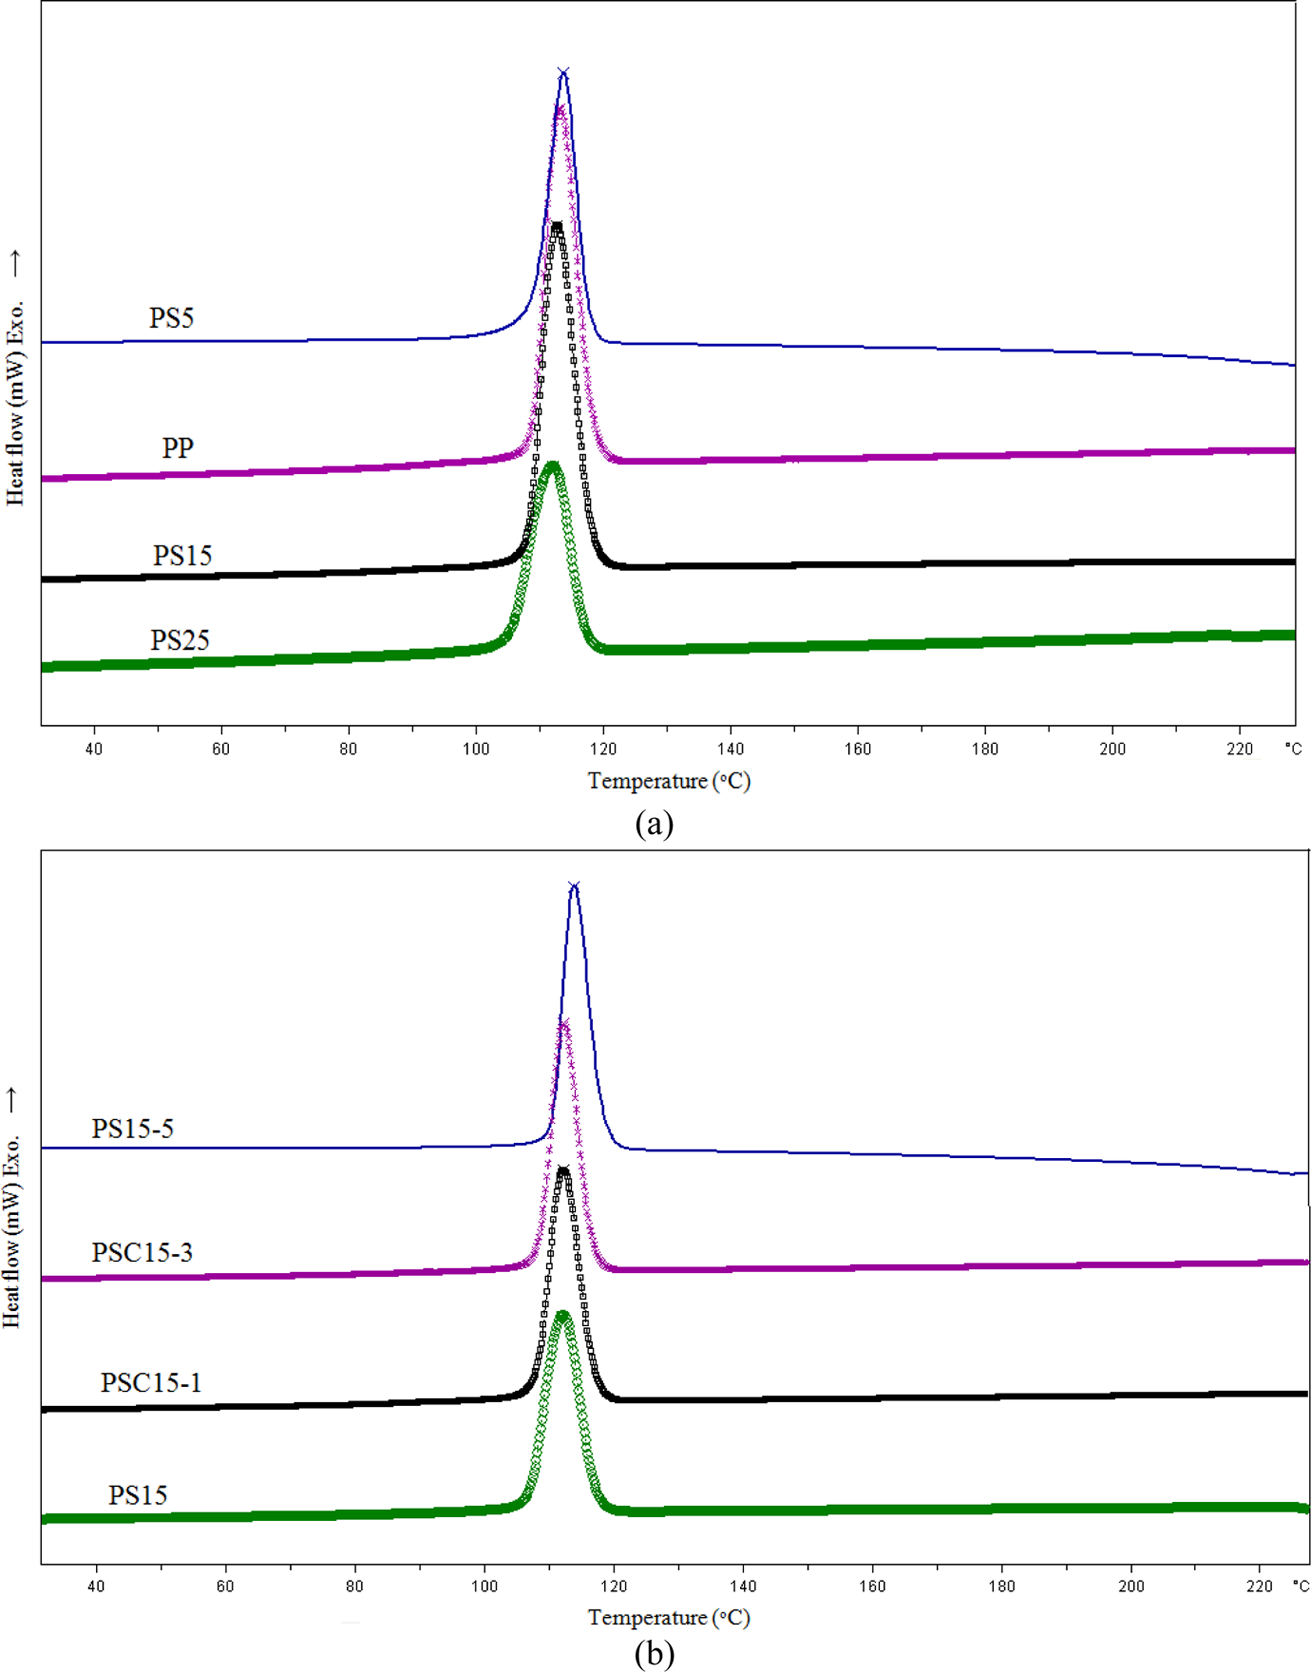
DSC cooling thermograms of the (a) PP/SEBS-g-MA blends and (b) PP/15%SEBS-g-MA nanocomposites. PP: polypropylene; DSC: differential scanning calorimetric; PP/SEBS-g-MA: polypropylene/styrene–ethylene–butylene–styrene grafted with maleic anhydride.
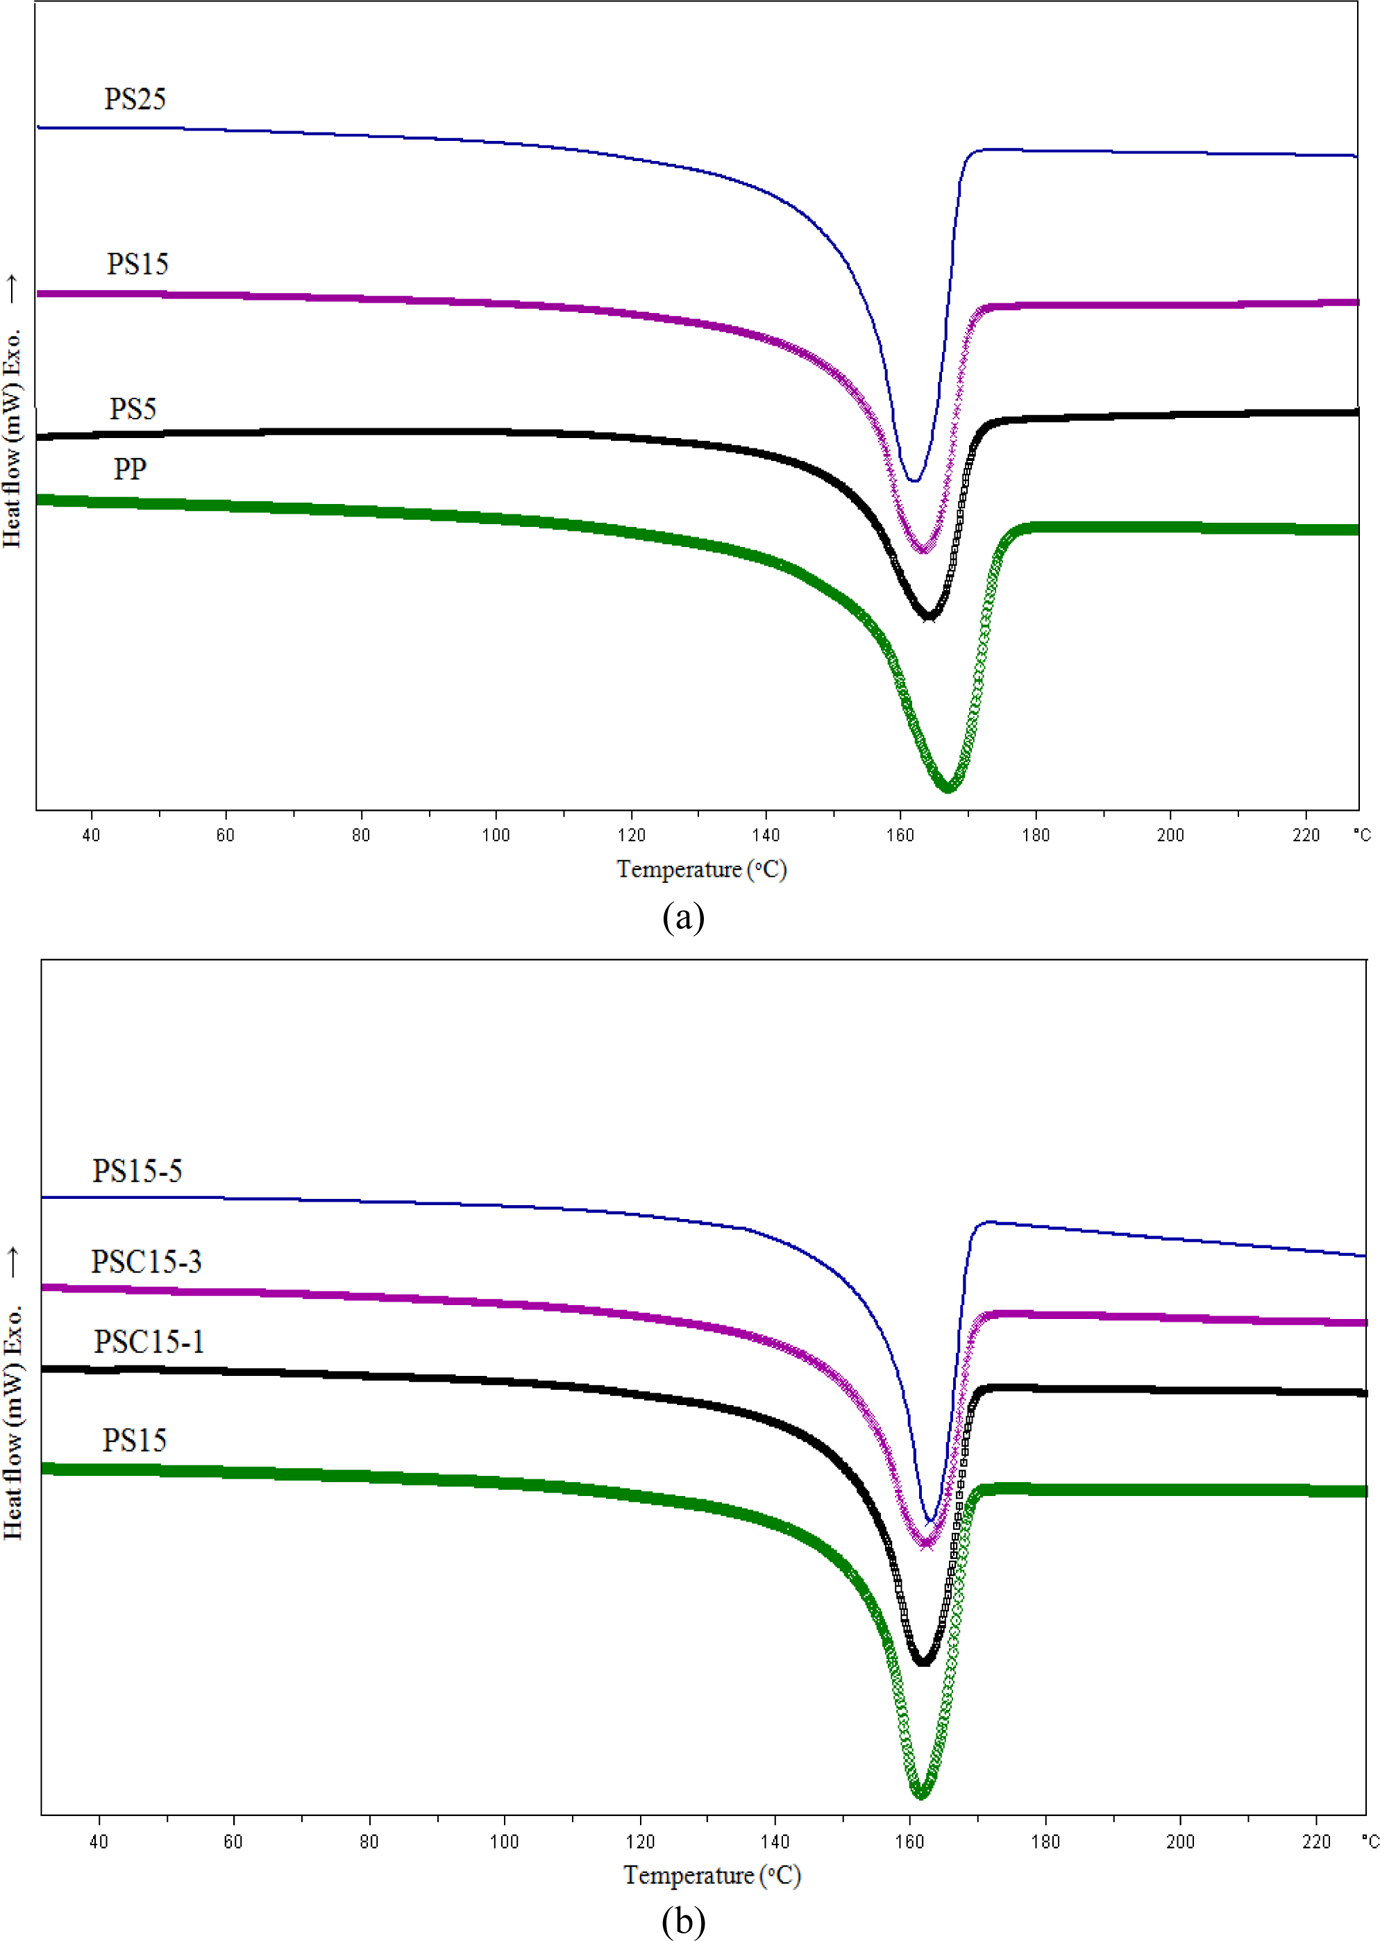
DSC heating thermograms of the (a) PP/SEBS-g-MA blends and (b) PP/15%SEBS-g-MA nanocomposites. PP: polypropylene; DSC: differential scanning calorimetric; PP/SEBS-g-MA: polypropylene/styrene–ethylene–butylene–styrene grafted with maleic anhydride.
The obtained results indicate insignificant nucleation activity of O-MMT in the PP/SEBS-g-MA samples. It is deduced that slight increase in the crystallinity of the samples may be due to the stiffening effect of clay particles that causes immobility of polymer segments. Intercalation of the clay layers within the polymer chains in amorphous regions can provide a good arrangement of the chains in these regions, resulting in the improvement of crystallinity. 36 Consequently, by the formation of crystalline sections, the T m increases. It can be concluded that increase in T m is due to the dispersed platelets in the blend matrix, which may hinder the conduction of heat to crystallites until at higher temperatures that heat flow is enough to melt down the crystallites. 37
HDT and VST
Table 4 shows variation in HDT and VST of PP/SEBS-g-MA blends and nanocomposites with an increase in the SEBS-g-MA and C15A contents. Similar to the DSC results, incorporation of 5 wt% SEBS-g-MA affects the thermal behaviour of PP and increases its HDT and VST values. But with the increasing SEBS-g-MA content, the HDT and VST values reduce due to decreasing X c. It is believed that the presence of SEBS-g-MA has elastomeric features and could act as a plasticizing agent, may be responsible for the reduced HDT values in higher amounts of SEBS-g-MA. 16 It is also clear that the clay incorporations would improve the heat resistance of the blends. From the results, the PSC5-5 sample displayed the highest HDT and VST values among all the prepared nanocomposites, showing better heat resistance than the other samples.
HDT and VST values of PP/SEBS-g-MA blends and nanocomposites.
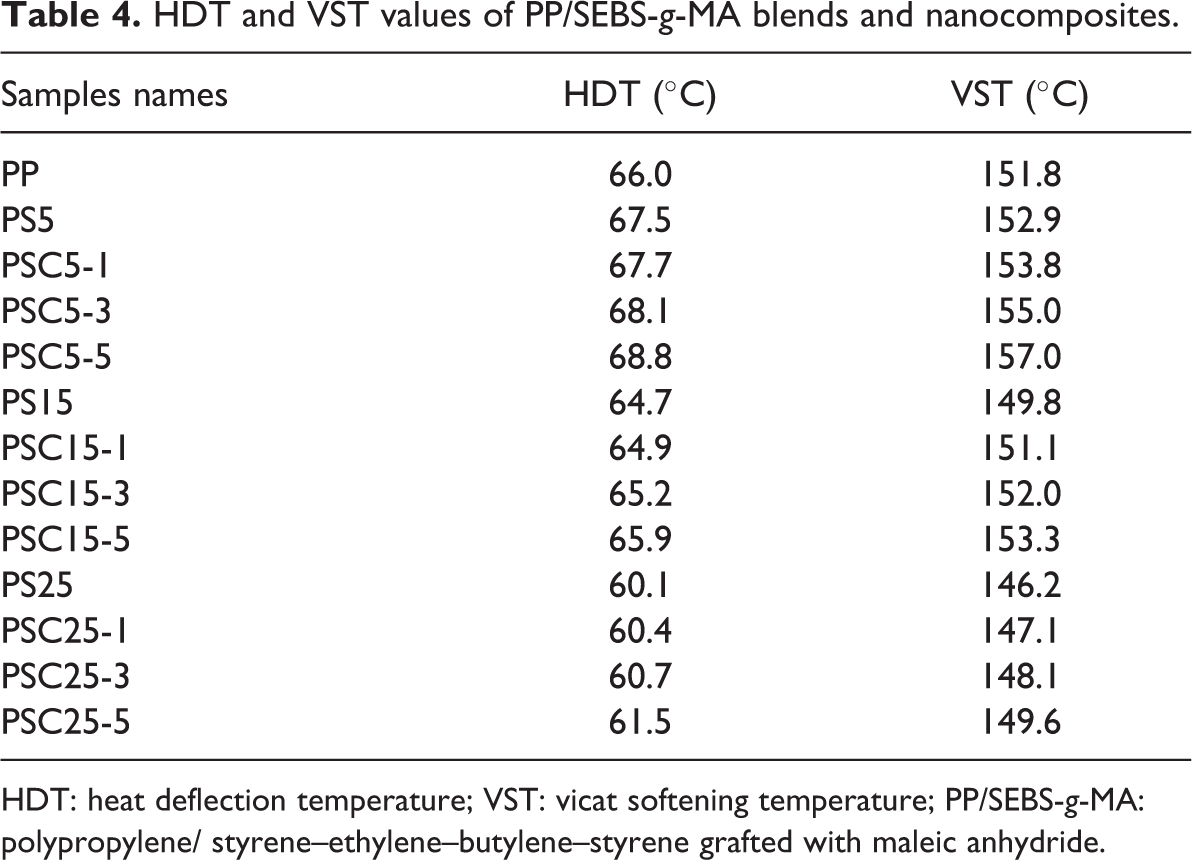
HDT: heat deflection temperature; VST: vicat softening temperature; PP/SEBS-g-MA: polypropylene/ styrene–ethylene–butylene–styrene grafted with maleic anhydride.
Conclusions
Numerous PP/SEBS-g-MA blends and nanocomposites are prepared by melt compounding using an internal mixer. Exfoliated and intercalated structures are obtained based on the XRD and TEM results. The XRD results also indicate that with the incorporation of C15A particles into PP/SEBS-g-MA blends, the diffraction peak of C15A is transferred to lower angles and as a result increase in d-spacing is achieved. The scanning electron micrographs also exhibit an obscure interface between PP matrix and SEBS-g-MA particles, implying a good compatibility and better adhesion between them. Furthermore, the addition of SEBS-g-MA into PP decreases the strength, Young’s modulus, hardness and flexural properties of PP, while increases the elongation at break and impact strength. On the other hand, clay incorporation shows opposite behaviour. Presence of SEBS-g-MA and C15A together in PP matrix causes a balance between the strength and toughness by controlling their contents. Finally, the thermal properties show that the addition of clay does not influence the structure and stability of the PP crystals formed.
Footnotes
Acknowledgement
The authors would like to thank Miss Maryam Sabetzadeh for her insightful discussions that helped to improve the quality of the work.
Funding
This work was financially supported by Parsian University.