
Abstract
This article presents a comparative study on the effects of using nano α-alumina (Al2O3) on toughening mechanisms and structural behaviors of polypropylene (PP) nanocomposites. The role of using dispersant in nanocomposite preparation was also investigated. For nanocomposite preparation, mixing of the elements was performed using a Haake Poly Drive blending machine at 175°C and the rotor speed of 50 rpm. The notched Izod impact energy obtained for PP was about 27 J/m and by the addition of nano α-Al2O3 (4 wt%) to PP, the notched Izod impact energy increases up to ∼43 J/m. However, higher concentration of nano α-Al2O3 in the nanocomposite resulted in the reduction of Izod impact property due to nano α-Al2O3 agglomeration. Fourier transform infrared spectroscopy (FTIR) spectra of pure PP and PP/nano α-Al2O3 composites demonstrated Al–O bond at 568 cm−1 for nanocomposite spectrum that indicates the creation of nano α-Al2O3 particles. The x-ray diffraction patterns and FTIR spectra of PP/nano α-Al2O3 composites showed that the intensity of the peaks when dispersant was used slightly increased and the arrangement of the peaks are normalized. This observation is attributed to homogeneous dispersion of nano α-Al2O3 filler in the matrix when dispersant was used. Scanning electron micrograph of impact fractured surface showed that the fracture surface of PP/nano α-Al2O3 composite becomes rougher with increasing the content of filler.
Introduction
Polypropylene (PP) is a general-purpose, semicrystalline and engineering thermoplastic widely used because of its remarkable properties and relatively low cost, as well as its ease of processability and low density. It is well known that the physical properties of the polyolefin-type polymers are strongly dependent on their morphology and structure. PP displays four interesting polymorphism structures, termed monoclinic (α), hexagonal (β), triclinic (γ) and quenched (smectic). The α-form is the most common crystal structure among the others. The α-form of PP is thermodynamically more stable than the β-form under normal crystallization conditions. The unit cell of the γ-form is generated from the α-form by linear shear. 1 –3 Particulate-filled PP has been broadly utilized in several fields for different purposes. The achievement of particulate-filled PP lies in its enormously beneficial price/volume/performance relations. 4,5
In composites processing, well dispersion of the filler is of great concern, so the material needs to be homogenized and be free of flaws. In order to obtain improved mechanical properties and secure it without increasing the shear viscosity, a good adhesion between the filler particles and the polymer matrix needs to be achieved. These circumstances can be obtained if the polymer wets the filler surface, in which the mixing procedure is able to break all the agglomerates and hence the polymer–filler contacts are promoted over filler–filler contacts and the agglomeration is prevented. 6,7
Nano-alumina (Al2O3) was chosen as filler due to its special combined chemical and physical properties such as excellent resistance to heat and wear, high specific strength and good oxidation resistance. 8 In this work, the dispersant was used and applied for the surface treatment of nano α-Al2O3. Sodium dodecylbenzene sulfonate (SDBS) as the dispersant was applied for the surface treatment of nano α-Al2O3. The effects of dispersant and nano fillers on the toughening and structural behaviors of PP/nano α-Al2O3 composites were investigated.
Materials and methods
Materials
The PP grade 600G (melting temperature and melt flow rate are 165°C and 11 g min−1, its density is 900 kg m−3) supplied by Petronas Polymers Marketing and Trading Division Malaysia was used as a starting material. Nano α-Al2O3 (average particle size of 20–30 nm and density of 3106 kg m−3) was obtained as produced by Mirjalili et al. 8,9,10 Titanium dioxide (TiO2) powder with a minimum assay of 98% supplied by Fisher Chemicals (Malaysia) was used as a coupling agent. SDBS (Merck KGaA, Darmstadt, Germany) was used as a dispersant.
Surface treatment of nano α-Al2O3
Ultrasonication (KQ2200DEUltrasonic Cleanser, 100W, Kunshan of Jiangsu Equipment Company, China), which is a conventional method for dispersing the extremely entwined or aggregated nanoparticle samples, was used for the preparation of miscellaneous aqueous nanosuspensions. About 0.1 g nano α-Al2O3, 99.8 g distilled water and 0.1 g SDBS as an anion surfactant were straight mixed in a 150-ml beaker. The suspension was then sonicated for 1 h and dried at 80°C for 4 h.
Preparation of PP/nano α-Al2O3 composites samples
All materials used for the preparation of PP/nano α-Al2O3 particles were weighted and listed in Table 1. Predrying process was carried out on the nano α-Al2O3 at 80°C for 4 h. Existence of moisture in the filler inclined to cause defects such as voids, pinholes and so on in the manufactured composites. The optimal content of coupling agent (TiO2) was considered as 2 wt% of the filler, according to the results presented in Akil et al. 11 It was shown that, in such a system, using a 2-wt% of TiO2 indicates positive results. 11,12
The weight content of the ingredients for PP/nano α-Al2O3 composites.
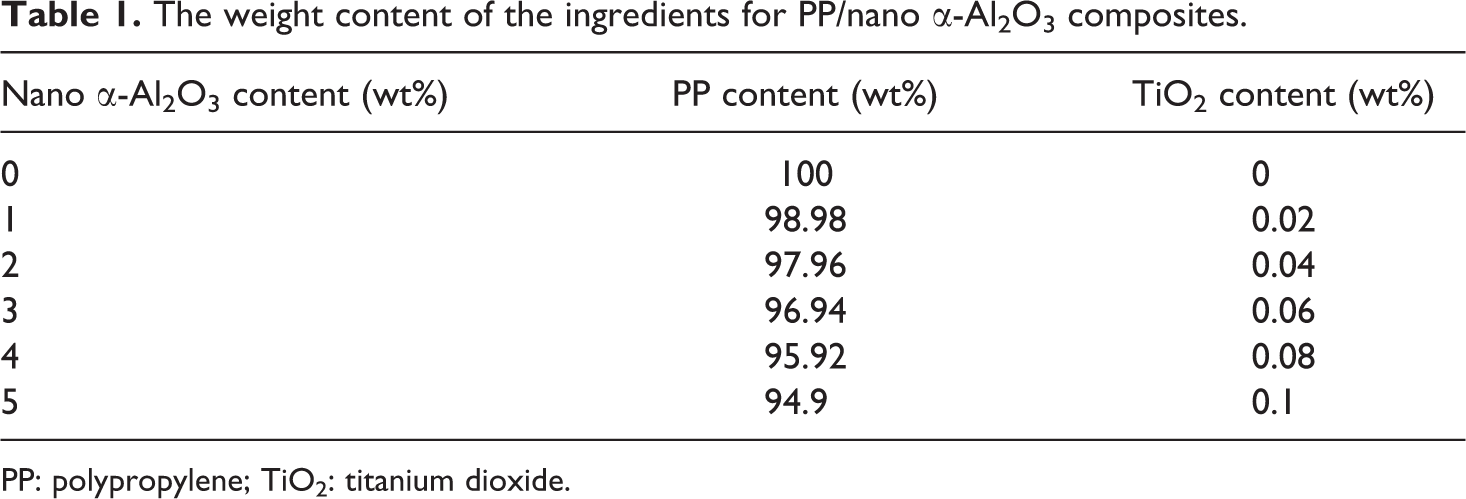
PP: polypropylene; TiO2: titanium dioxide.
Compounding and processing
The melt blending of PP and nano α-Al2O3 powder was carried out using Thermo Haake Poly Drive with RheomixR600/610 blending machine (Chamber volume 120 cm3 , Stainless steel DIN 1.4301) at 175°C with rotor speed of 50 rpm. The first step of mixing involved preheating of PP for about 4 min. After preheating, the speed was preserved at 50 r min−1 for another 8 min of processing time to make sure uniform heat distribution throughout the batch. Then, nano α-Al2O3 particles were added and then 2 min later TiO2 powder was added. The rotor was stopped at the 12th minute and the melted compound was taken out for sheeting. The melt compounded PP/nano α-Al2O3 was then formed by Hsinchu hot press machine, in the size of 15 × 15 cm. The compound was preheated for 2.5 min and hot pressed for another 3 min under the pressure of 150 kg cm−2 at 180°C with 10 times of compression bumping. Finally, the sheet obtained was directly cooled using the cold press for 2.5 min of cooling cycle. 12
Characterization
Notched Izod impact tests
The notched Izod impact test was performed using the International Equipment Pendulum Impact Tester (Model TMI 43-0A-01) equipped with the impact force hammer of 27.1 J with the weight of 0.45 kg and impact speed of 3.8 m s−1. Testing was completed in agreement with the ASTM D 256-00, to settle on the Izod impact strength (IS; Joules per meter) values, which is the energy loss per unit of the specimen thickness. The specimen figure is shown in Figure 1.
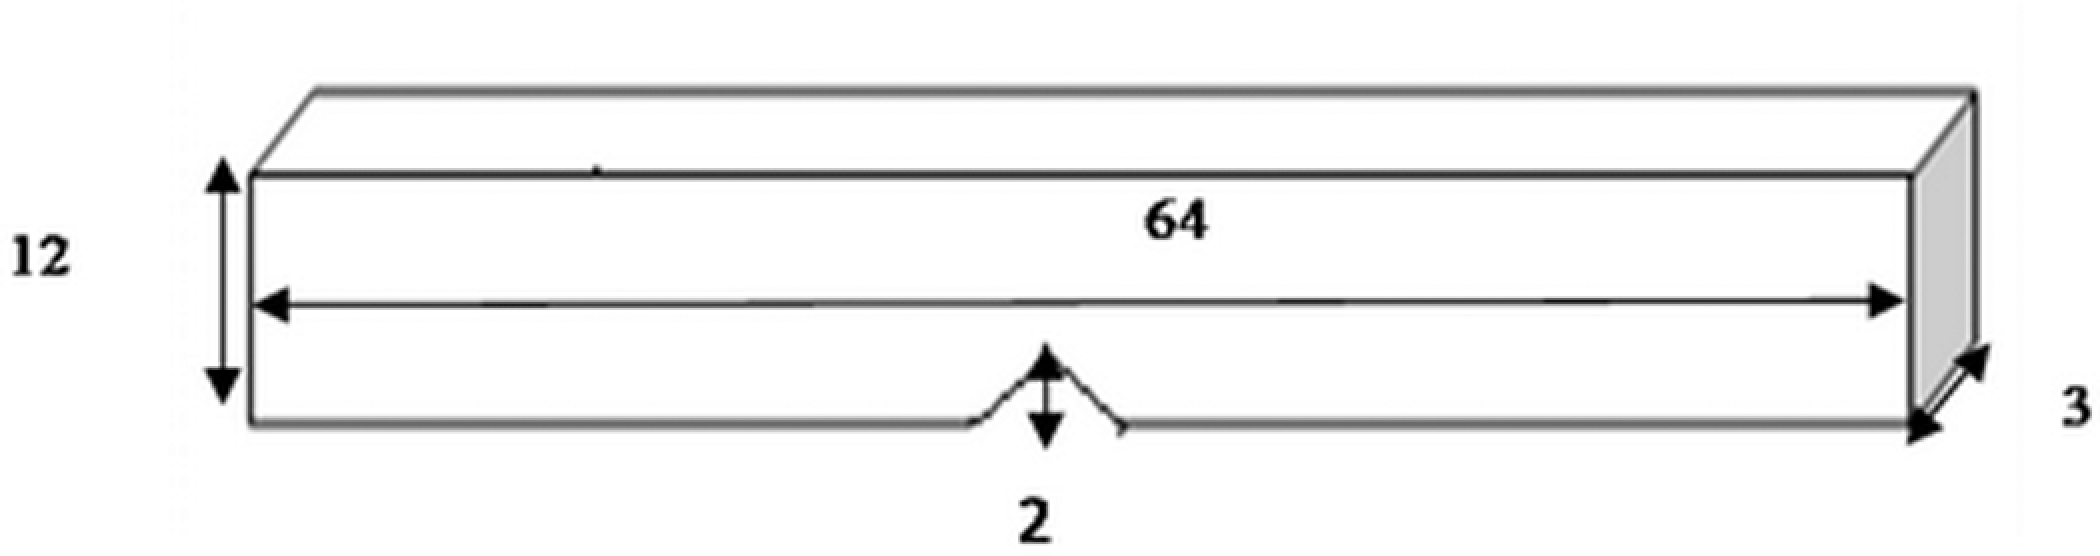
Schematic representation of impact specimen.
XRD of the surfaces of PP/nano α-Al2O3 composites
X-Ray diffraction (XRD) of PP/nano α-Al2O3 composites samples were performed at room temperature using Philips pro PAN Analytical XRD model X Pert X-ray diffractometer. The x-ray beam was nickel filtered Cu Ka (wavelength = 1.542 Å) radiation activated at 30 kV and 30 mA. Data were recorded from 2θ = 2°–30° at a rate of 1°C min−1.
FTIR spectra analysis of nano α-Al2O3 particle and PP/nano α-Al2O3 composites
Fourier-transform infrared spectroscopy (FTIR) analysis was carried out using the Spectrum BX Perkin Elmer equipment. The method used for analyzing the nano particles and nano composites was the universal Attenuated Total Reflectance (ATR sampling accessory, Accessories without transmission cells and KBr pellets. 13 All the resolution spectra were recorded in the 4000–280 cm−1 range.
Scanning electron microscope
Microscopy observation throughout the scanning electron microscopy (SEM) of impact Test Fractured Surface of PP/nano α-Al2O3 composites were achieved using Philips XL 30 ESEM.SEM operated at 20–30 kV.
Transmission electron microscope
Transmission electron microscopic (TEM) observation was carried out on the ultrathin section of the PP/nano α-Al2O3 composites film to confirm the dispersion state of nano α-Al2O3 particles inserted within the PP matrix. The observation was conducted using a HITACHIA-7100 STEM at an acceleration voltage of 120 kV. The specimens were organized using a Leica ultra-cut microtome provided with a cyrochamber.
Characterization on various types of properties for PP/nano α-Al2O3 composites
Notched Izod IS analyses for PP/nano α-Al2O3 composites
Generally, notched impact energy is a measure of crack propagation. The plot of Izod IS for PP/nano α-Al2O3 composites with various weight percentages of filler loading is shown in Figure 2.
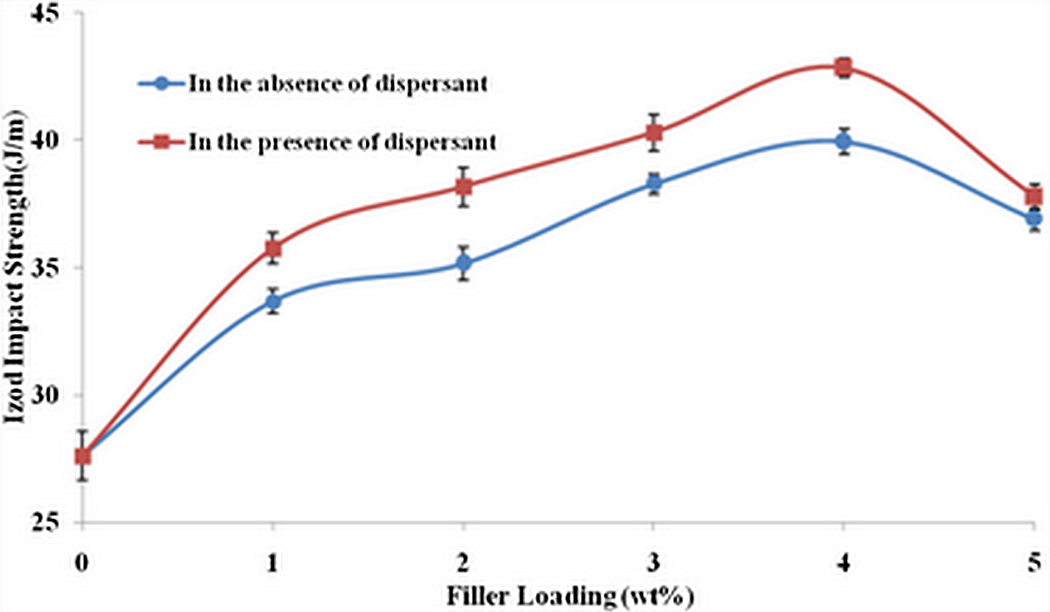
Izod impact strength of PP/nano α-Al2O3 composites at various loading. PP: polypropylene.
It was observed that filler loading, up to 4 wt%, greatly increases the IS of the nanocomposites. The increase in the Izod IS for nano α-Al2O3 loading up to 4 wt% is mostly due to increased wetting of filler with PP. However, further addition of nano α-Al2O3 into the PP matrix (for instance, about 5 wt%) not only did not make any enhancement of IS of the composite but also caused it to be decreased. It seems that at the values of filler loading higher that 4 wt%, agglomeration of nanoparticles in the composite occurs that causes the reduction in IS of the nanocomposite. Decrease in the properties on subsequent loading may be due to inadequate wetting of the filler with the matrix, which leads to an easy composite failure. This observation is consistent with the results of Khalid et al. 14 , who observed that higher amount of filler would provide higher stress concentrations area, where a crack can be imitated more easily. Therefore, less energy is required to initiate the crack, which dominates over the higher energy needed to propagate the crack resulting in lower value of strength. 14,15 Microscopy observation using SEM and TEM also confirmed these findings. The increase of Izod IS by addition of nano α-Al2O3 filler up to 4 wt% is attributrd to the sufficiently well-built bonding among fillers and matrix. In Figure 2, the values achieved from these composites are considerably good and numerically higher when compared with the pure PP system for about 55% for nanocomposites in the presence of dispersant and 44.7% for nanocomposites in the absence of dispersant. The values of IS in the presence of dispersant are higher than the values of IS in the absence of dispersant. It is because the dispersant aid in better dispersion of the nanocomposite elements and hence produces less agglomeration leading to enhanced energy absorption and icreased Izod IS.
Analysis of XRD data for PP/nano α-Al2O3 composites
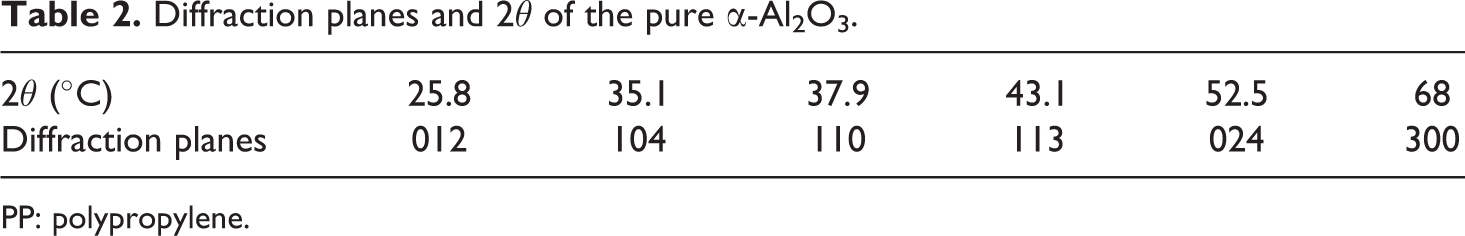
To further understand the structure of the PP-filled nano α-Al2O3 composites, XRD characterization of nano α-Al2O3, pure PP and PP/nano α-Al2O3 composites with various nano α-Al2O3 contents were conducted. The XRD analysis in Figure 3 shows that the most stable phase, a-Al2O3, has occurred. This observation was also reported by Hyuk-Joon et al. 16 The diffraction planes are 012, 104, 110, 113, 024 and 300 for 25.8°, 35.1°, 37.9°, 43.1°, 52.5° and 68° of 2θ, respectively (refer Table 2). This finding is in agreement with the results presented by other researchers such as Trunov et al. 17 and Li et al. 18
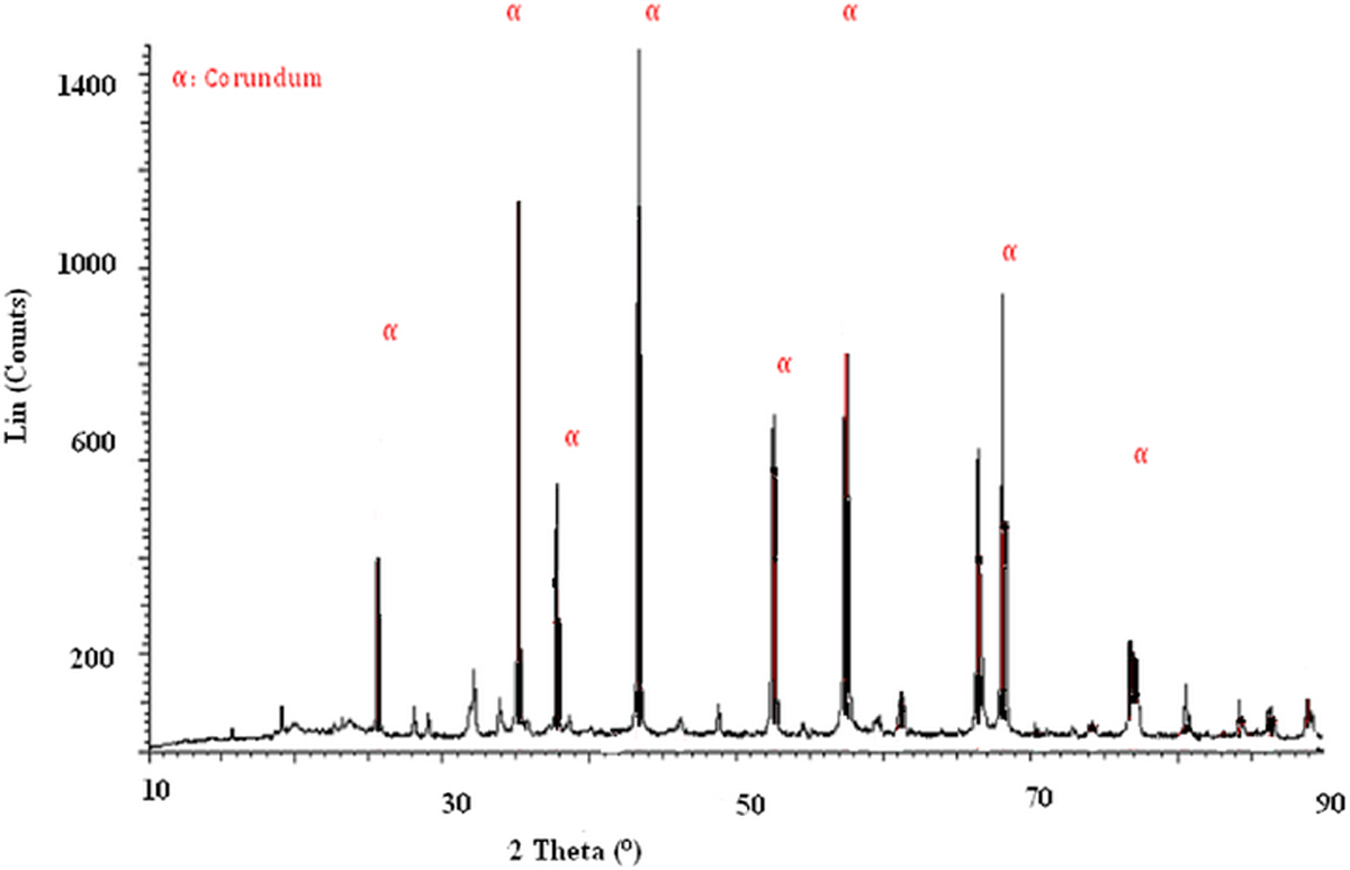
XRD spectra of α-Al2O3. XRD: x-ray diffraction.
Diffraction planes and 2θ of the pure α-Al2O3.
PP: polypropylene.
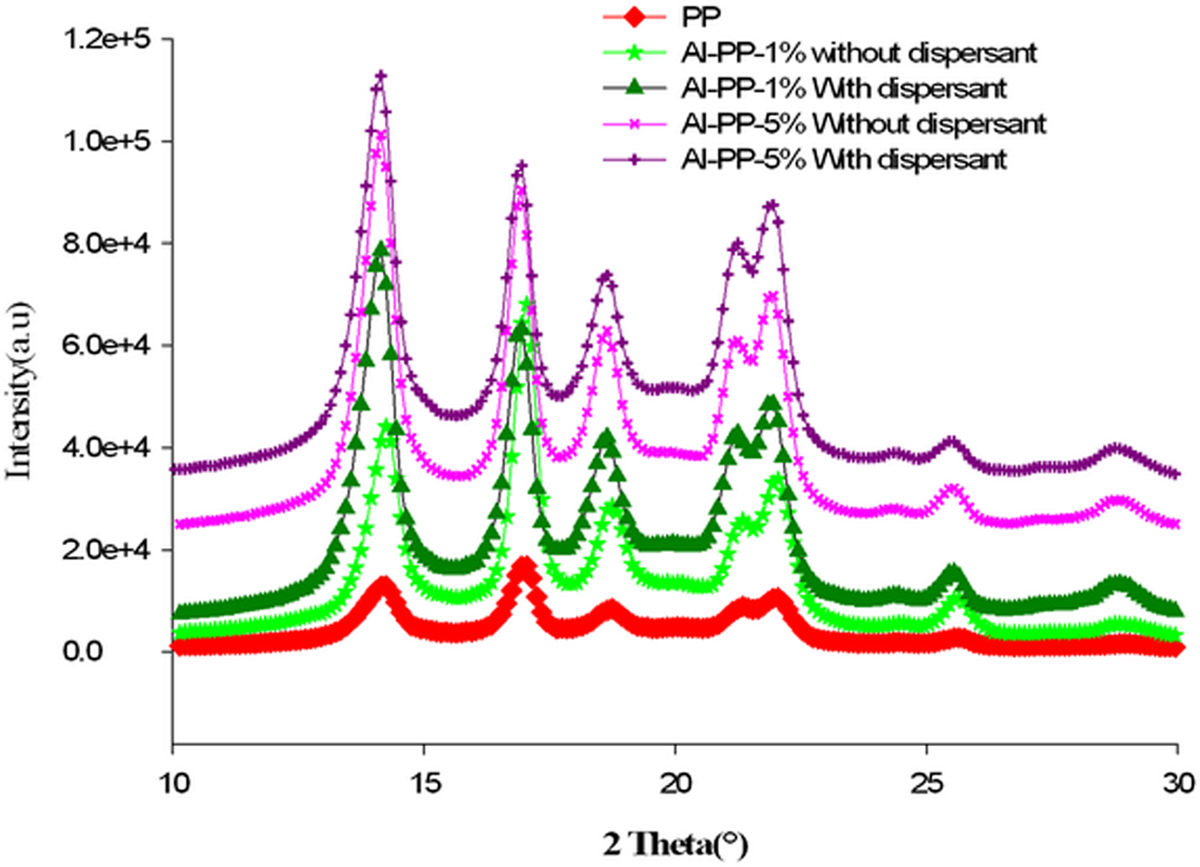
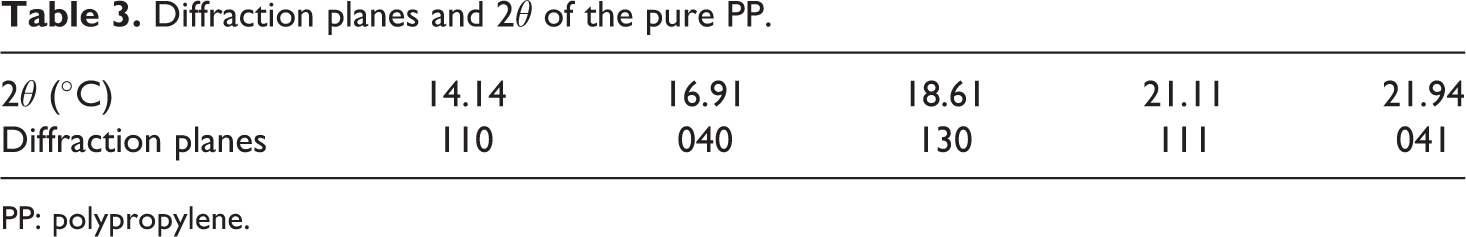
Diffraction pattern of PP/nano α-Al2O3 composites with various percentages of filler loading within 10°–30° of diffraction angle (outstanding diffraction range) is presented as in Figure 4. XRD spectra indicated that the pure PP is in form of α crystal. The diffraction planes are 110, 040, 130, 111 and 041 for 14.14°, 16.91°, 18.61°, 21.11°and 21.94° of 2θ, correspondingly (refer Figure 4 (a) and (b) and Table 3).
Diffraction pattern of PP/nano α-Al2O3 composites with various percentages of filler loading. PP: polypropylene.
Diffraction planes and 2θ of the pure PP.
PP: polypropylene.
In Figure 4, profile of the identical peaks for all samples is similar, despite weight percentages of nano α-Al2O3 are different in each fabricated composites. This observation can be attributed to the rapid cooling rate. The rapid quenching does not leave enough time for the PP and PP/nano α-Al2O3 nanocomposites to produce defects within the crystal and thus the formation of β or γ forms. 1,3,19,20
Based on Figure 4, the peak intensity for PP/nano α-Al2O3 composites was more strong and narrow with the extra amount of nano α-Al2O3 filler, in comparison with the virgin PP employed. This observation might indicate that the addition of nano α-Al2O3 particles into PP will eventually generate highly crystalline nanocomposites. 21,22 In this situation, adding of nano α-Al2O3 particles into PP offers a large interface between the nano α-Al2O3 particles and the PP, consequently, generates very suitable conditions for the nucleation and crystallization procedure that takes place in the rubbery temperature range during heating. 3,9 The intensities of the peaks with dispersant compared with the intensities of the peaks without dispersant, enhanced slightly, which means when SDBS was added as a surfactant, the intensities of the peaks increased.
Due to the dissociation of SDBS, phenyl sulfuric group was produced and adsorbed on the Al2O3 particle, which in order, the lattice negative charge of powder surface was enhanced and therefore the repulsive forces improved, which caused a good dispersion of system. 23 As mentioned by Mirjalili et al., 12 the filler orientation and distribution could influence the reorganization and growth of the crystalline unites, and good dispersion and progressed particle orientation decreased the barrier of the particles and allowed improved rearrangement of particles.
FTIR analysis for PP/nano α-Al2O3 composites
Figure 5 shows the FTIR spectra of the nano α-Al2O3 in the wave number region of 4000–280 cm−1. The absorption was recorded at about ∼650 cm−1, and this is due to the stretching vibration and the deformation vibration characteristics of hydroxylate (O–H). 23,24
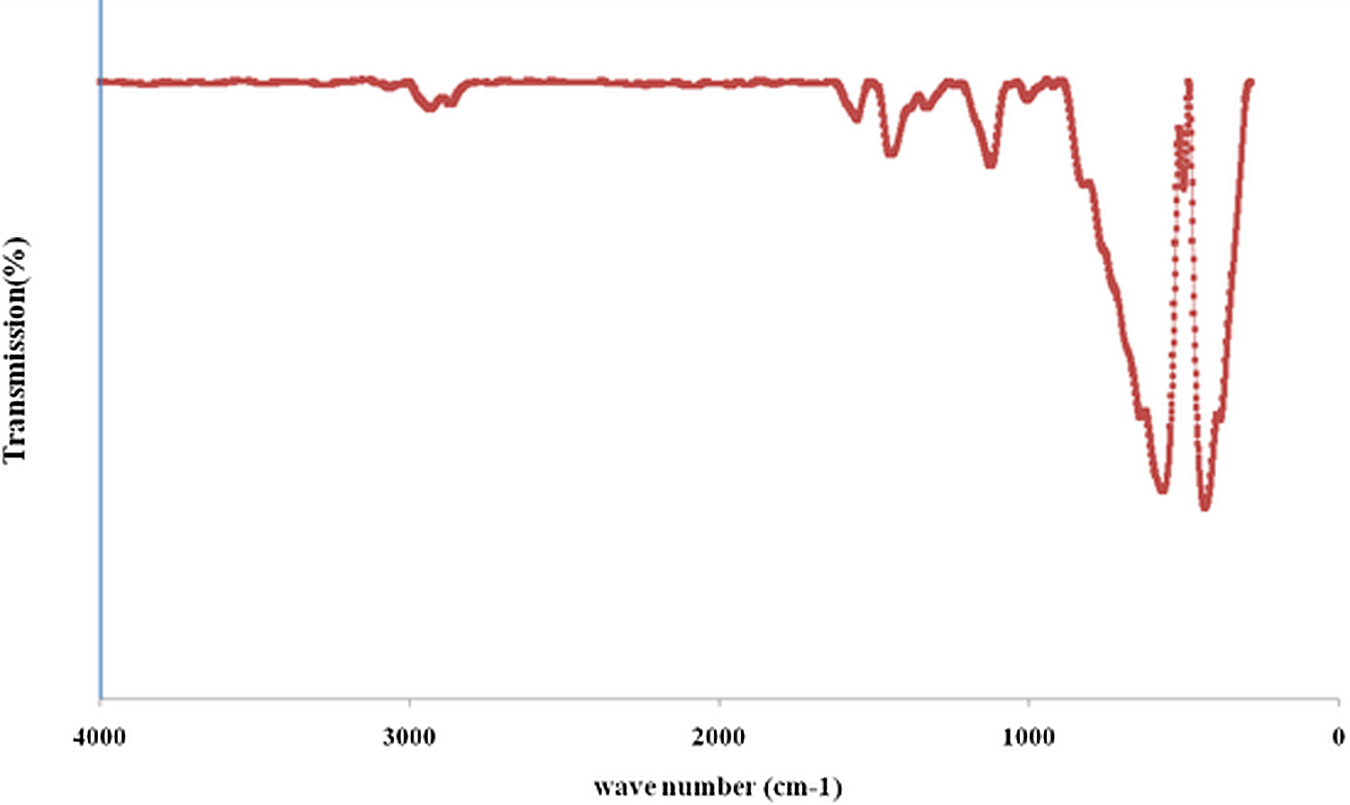
FTIR spectra of Al2O3 precursor. FTIR: Fourier Transform Infrared Spectroscopy.
The bands at 1121–1328 cm−1 are due to the stretching vibration and deformation vibration characteristics of SO2 and band at 1556.73 cm−1 is the characteristic of absorption peak of SDBS. 7 There are wide and high peaks of Al–O stretching (AlO4 or AlO6 vibration) in the range of 500–1000 cm−1. These peaks are related to transitional phases of Al2O3 and stable phase of Al2O3 (alpha). The significant spectroscopic bands at 568.15 and 431.99 cm−1 appear, which are identified to be the characteristic absorption bands of α-Al2O3. 6 Figure 6 illustrates the FTIR spectra of the pure PP and PP/nano α-Al2O3 composites with a variety of filler loadings. Al–O bond at 568 cm−1 resulting from the nano α-Al2O3 particle are observed in all of nanocomposite spectrums. This main band implies the formation of Al2O3 cluster in the pores of PP. Moreover, with the additional amount of nano α-Al2O3 loading, the intensity of remarkable transmittance peaks is improved. These FTIR assignments further confirm that nano α-Al2O3 particle is successfully intercalated into the gallery of the PP. The spectra of PP/nano α-Al2O3 composites in Figure 6 presents the characteristics peaks at 2960, 2916, 2840 and 2800 cm−1 (around 2800–2960 cm−1), related with the stretching and bonding of CH3, 1456 cm−1 from the asymmetry stretching vibration of CH3, 1376 cm−1 from the symmetry bending vibration of CH3 and 1163, 975, 853 and 812 cm−1 from the vibration of the rocking of CH3 and CH2 and the stretching of CH–CH2 and CH–CH3. 5 Comparing the FTIR spectra of PP/nano α-Al2O3 composites fabricated with dispersant and without dispersant, it can be clearly seen that, both the FTIR spectra of nanocomposites are almost the same. However, the intensity of the peaks in the range of 500–1000 cm−1 when dispersant used slightly was increased and the arrangement of the peaks are normalized that is due to homogeneous dispersion of nano α-Al2O3 filler in the matrix. From this finding, it can be concluded that the dispersant does not create any effect to the initial chemical properties of the matrix used (Figure 6).
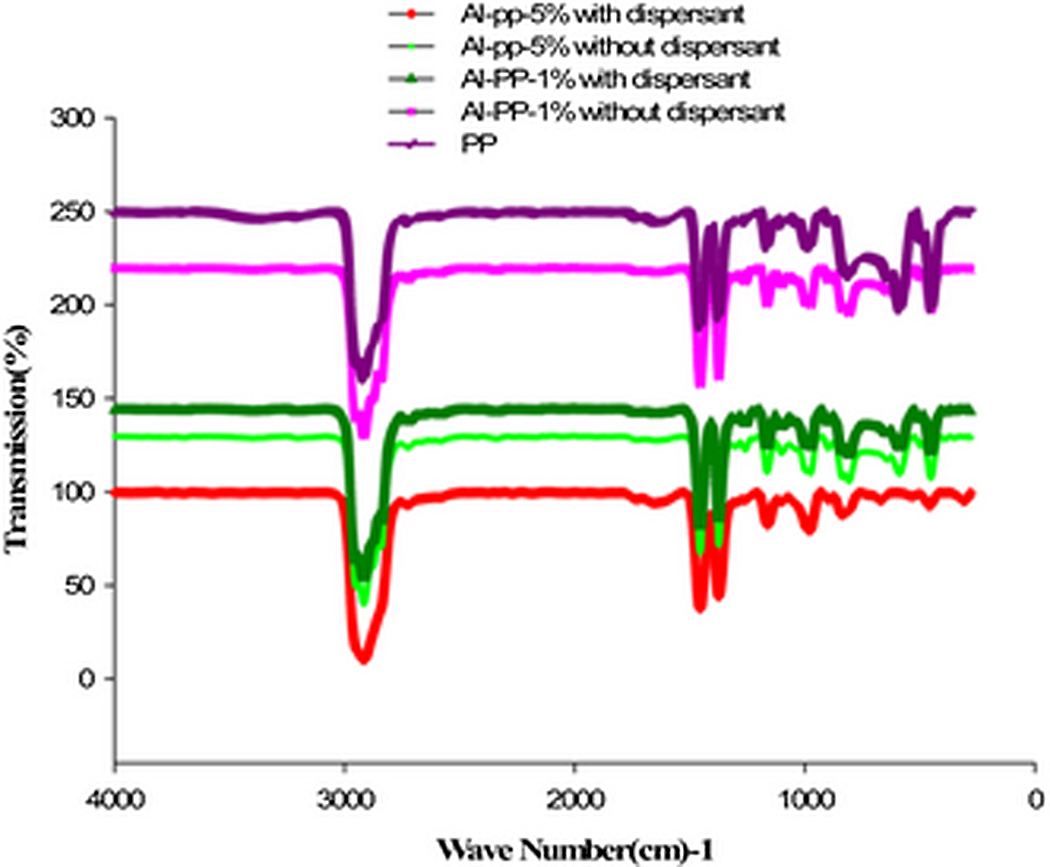
FTIR spectra of PP/nano α-Al2O3 composites with various percentages of filler loading. FTIR: Fourier transform infrared spectroscopy; PP: polypropylene.
Morphological analysis of PP/nano α-Al2O3 composites
To study the morphological structure of PP/nano α-Al2O3 composites, SEM and TEM analyses were carried out. Vladimirov et al. 4 found out that the filler dispersion and adhesion with the polymer matrix are basic elements for efficient enhancement of the composites mechanical behavior. Fine control of the interface morphology of the polymer nanocomposites is one of the most serious factors to convey desired mechanical properties on such materials.
SEM analysis of impact test fractured surface of PP/nano α-Al2O3 composites
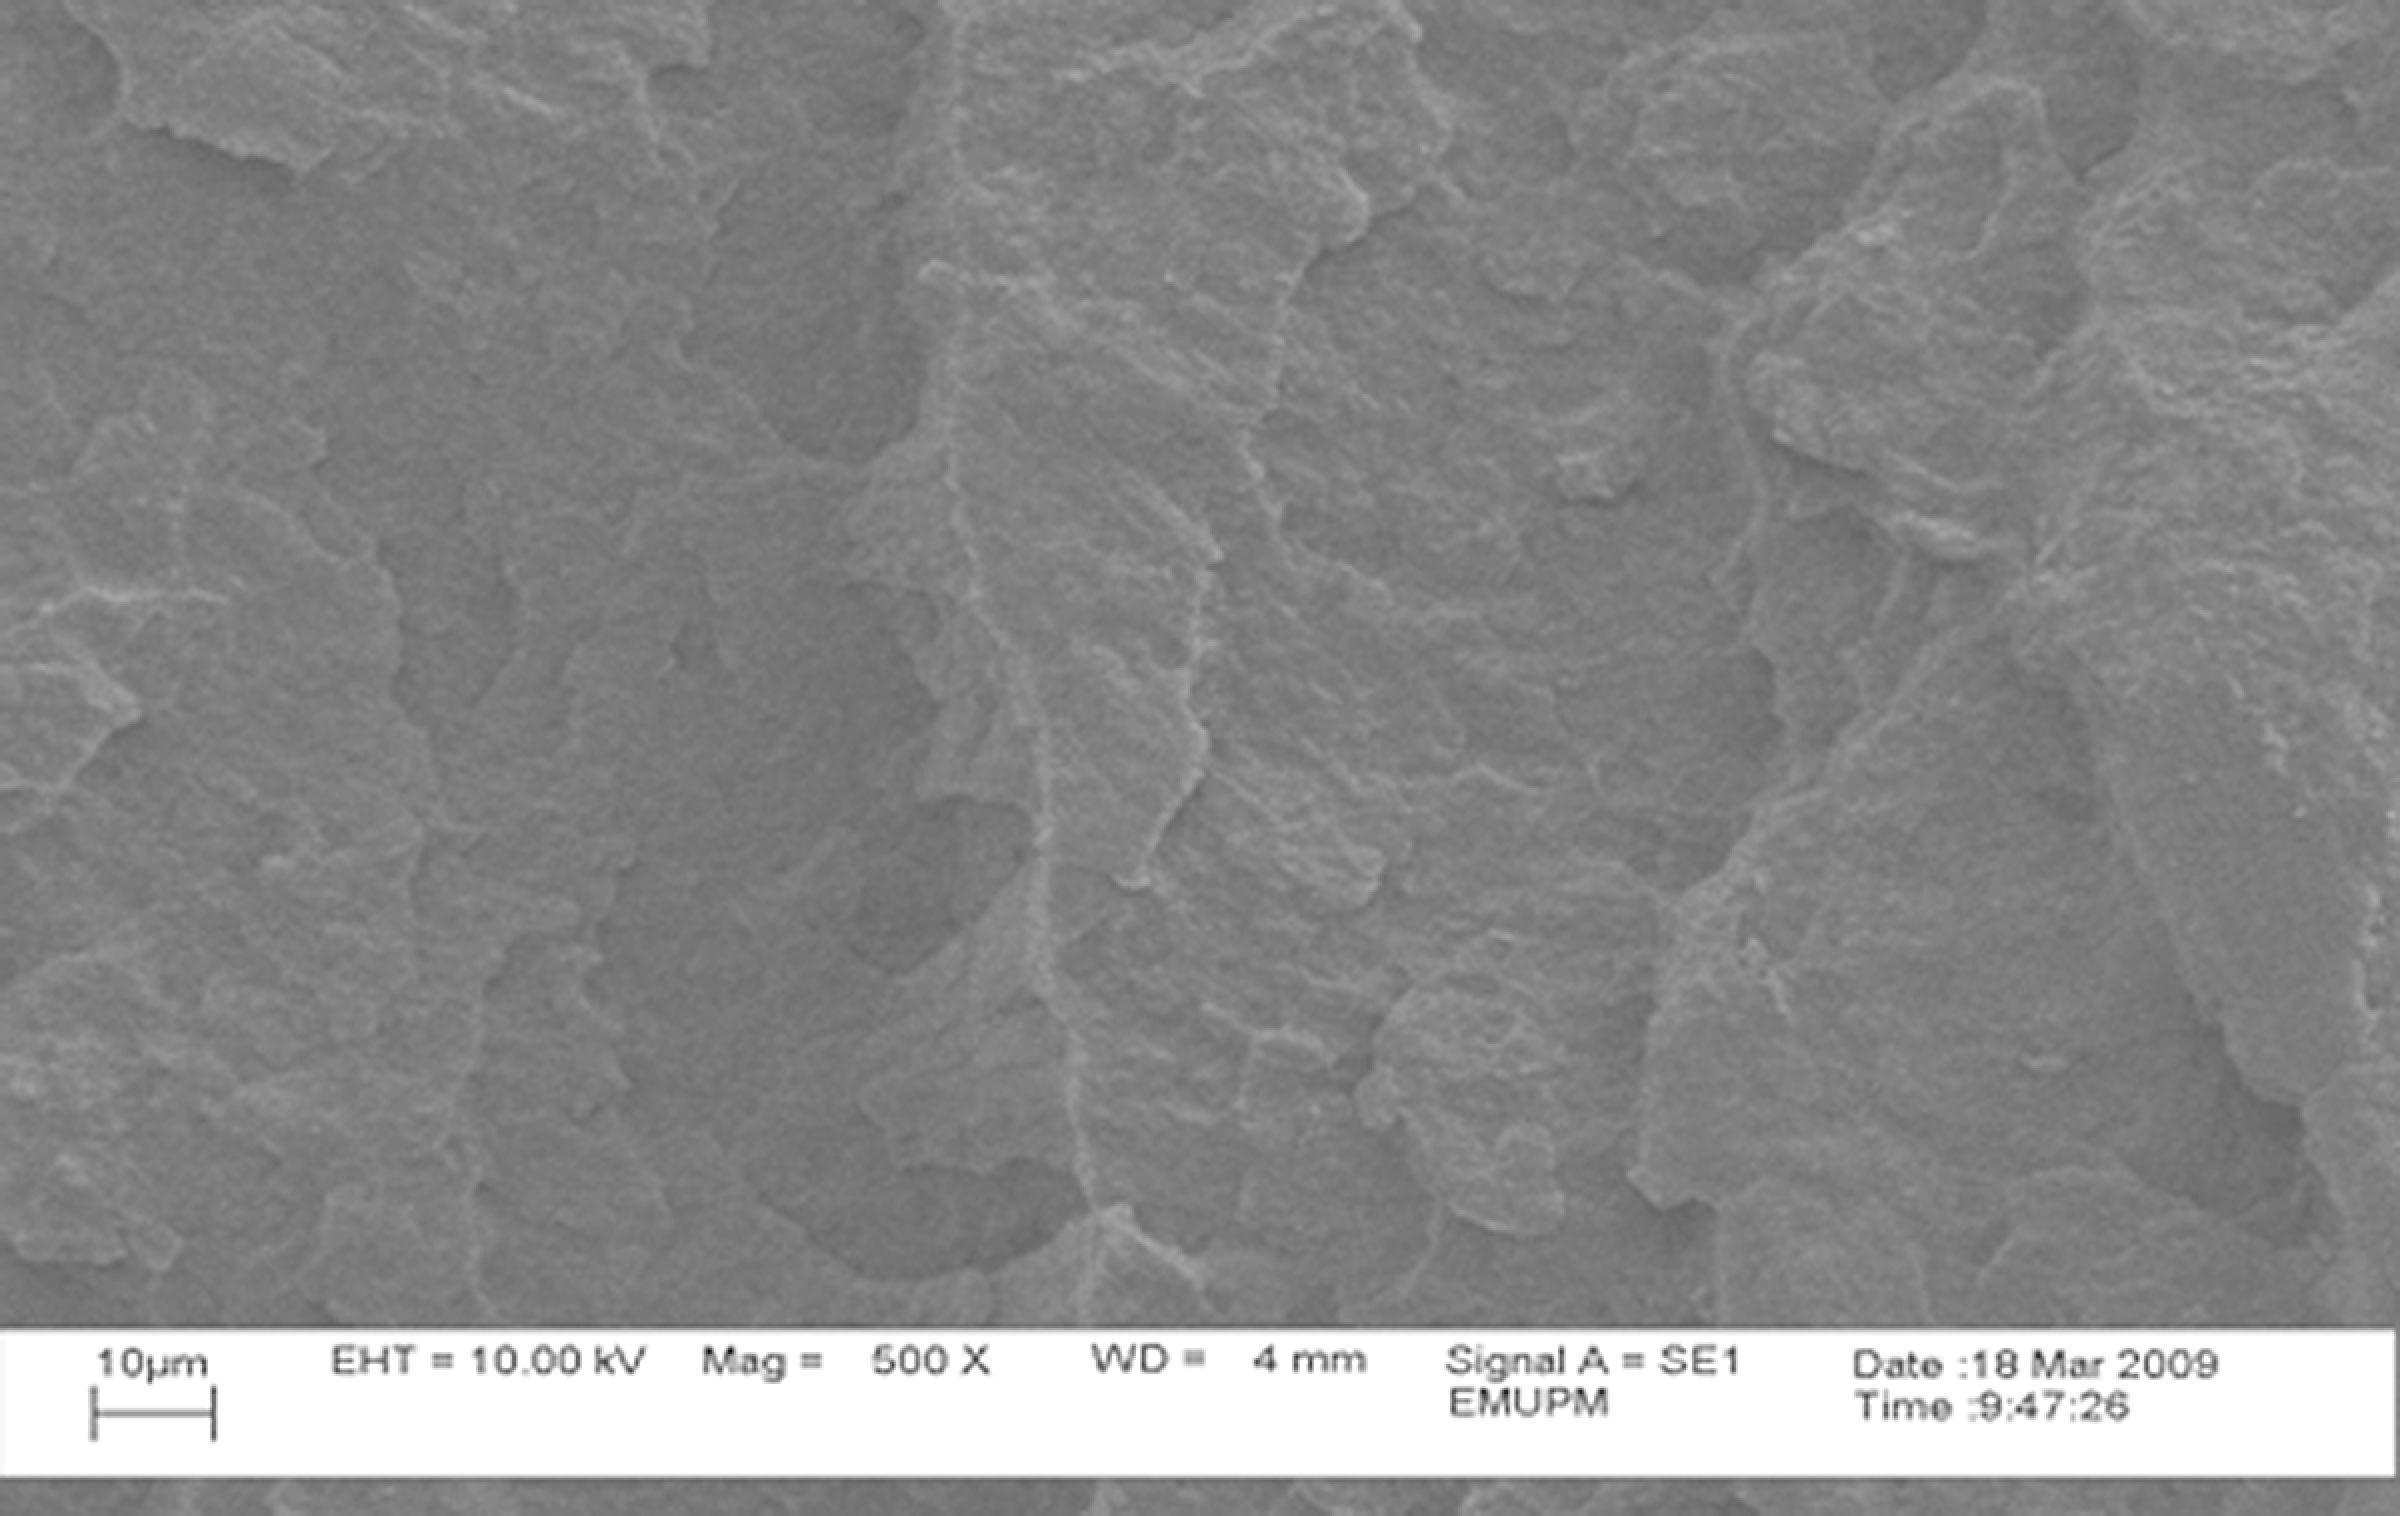
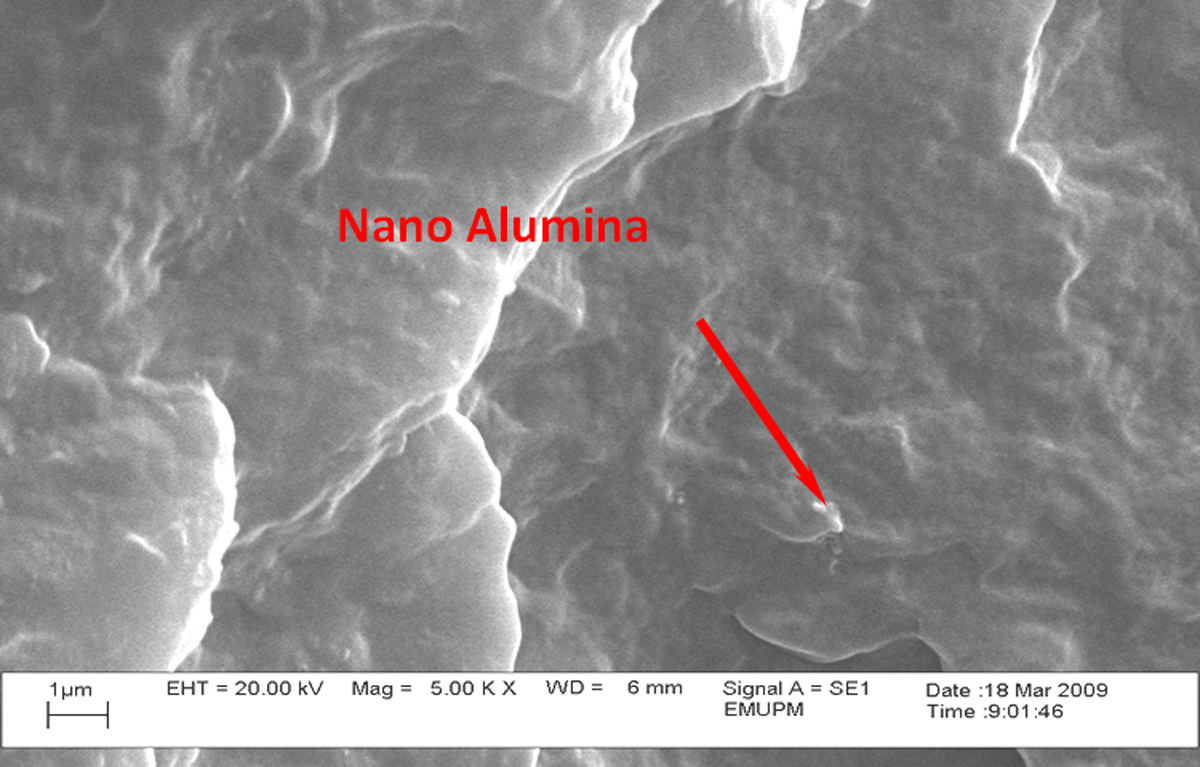
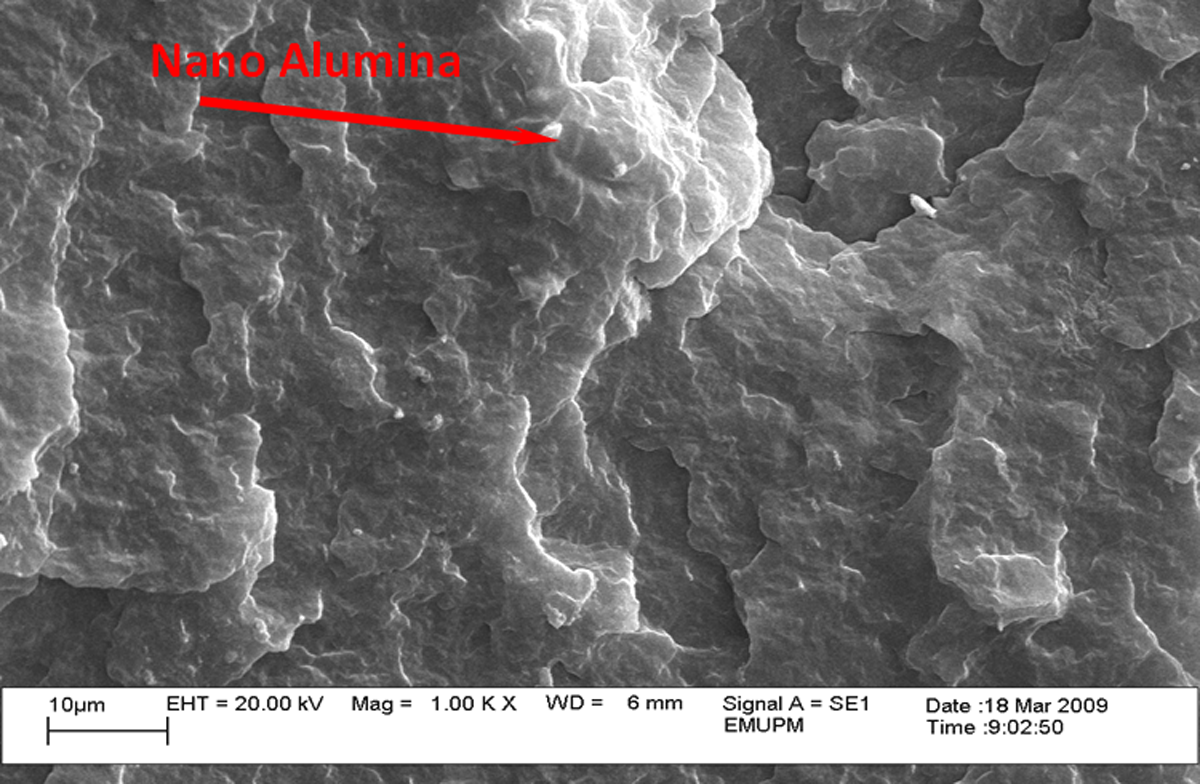
Impact fractured of PP matrix and its composites with different nano α-Al2O3 loading viewed under the SEM observation are presented in Figures 7 to 10. Figure 7 is the scanning electron micrograph of impact fractured surface of the specimen for the pure PP.
Scanning electron micrograph of the impact fractured surface of PP sample. PP: polypropylene.
Scanning electron micrograph of the impact fractured surface of PP/1% nano α-Al2O3 composites. PP: polypropylene.
Scanning electron micrograph of the impact fractured surface of PP/4% nano α-Al2O3 composites. PP: polypropylene.
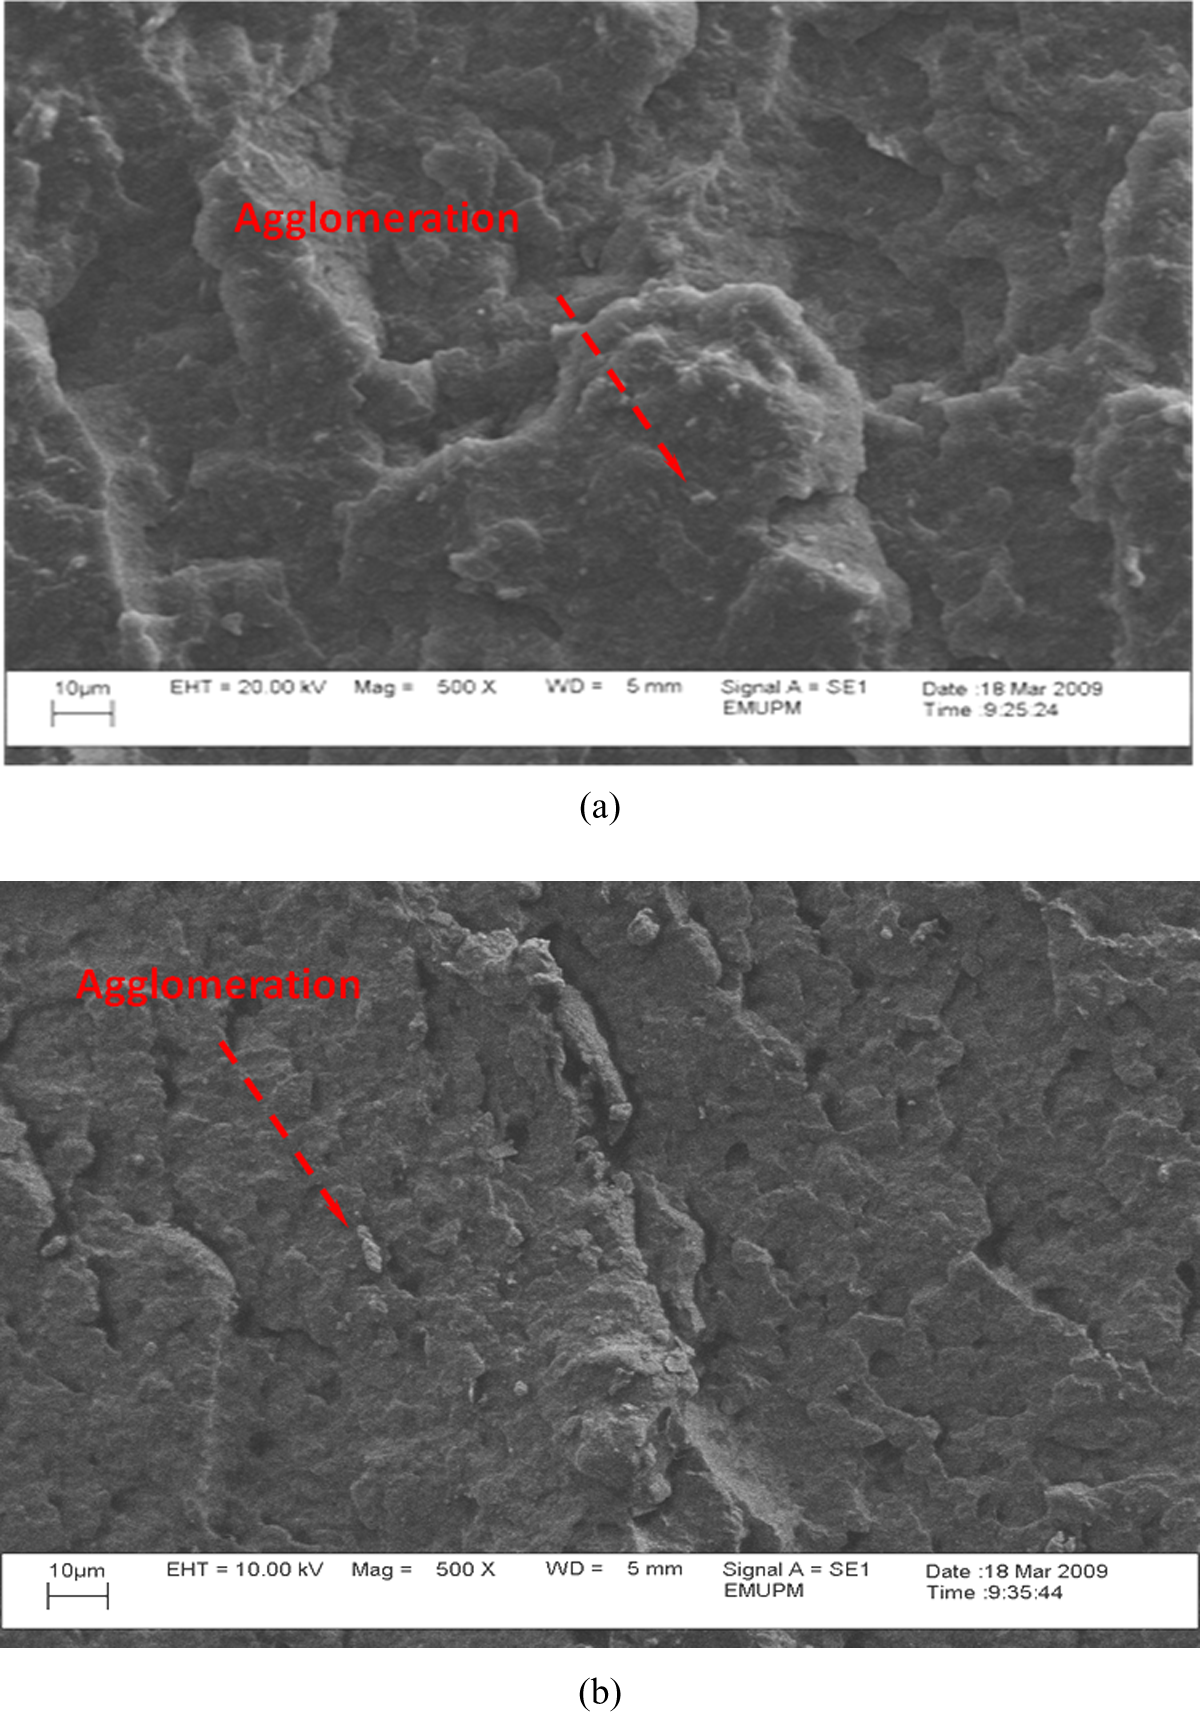
Scanning electron micrograph of the impact fractured surface of PP/5% nano α-Al2O3 composites (a) in the presence of dispersant and (b) in the absence of dispersant. PP: polypropylene.
The morphology of the segment is observed like a sea-wave, and the wave peak and the depression are very clear. Similarly, the collection and direction of the waves are usual and vertical to the impact direction. 3
The results of dissimilar percentages of nano α-Al2O3 loading used on the morphological structure of the manufactured composites can be examined. Figures 8 and 9 show the scanning electron micrographs of impact fractured surface of the sample for 1 and 4 wt% of nano α-Al2O3-filled PP, respectively. The surface of samples contains well-dispersed particles in the PP matrix and a slight agglomerate of nano α-Al2O3. This is possibly due to the low-filler loading added to the PP and using melt blending process that dispersed the nano α-Al2O3 particles effectively. Furthermore, it shows certain degree of good wetting and phase adhesion.
The impact fracture surface of the PP/5% nano α-Al2O3 composites in Figure 10(a) and (b) demonstrate debonding–cavitation at matrix–particle interface especially in the absence of dispersant. Figure 10 shows the debonding–cavitation at the PP/5% nano α-Al2O3 composite due to the impact loading propagates through the matrix material. It can be clearly seen that the nano α-Al2O3 particles were pulled out from the matrix. In the absence of filler–matrix interaction, the filler particles tend to agglomerate and become irregularly distributed throughout the matrix. These results confirmed the Izod IS of PP/nano α-Al2O3 composites.
The interfacial adhesion of PP/nano α-Al2O3 composite with dispersant is higher and closer to the optimum interfacial strength that can distribute the higher toughness, because the aggregates are shifting to the primary particles during the ultrasonication process. Consequently, better wetting of filler contributes to the enhancement of the properties of the nanocomposites. 2
TEM analysis of PP/nano α-Al2O3 composites
In order to explain the behaviors of the nanocomposites, the cryo thin section of specimens were examined by TEM as illustrated in Figure 11. High magnification transmission electron micrographs of PP/2% α-Al2O3 nanocomposites with dispersant shows that the nano α-Al2O3 particles are close to spherical shape; however, their sizes are not mono disperse and the particles size between 27 and 40 nm are detected in nanocomposite. These results are in good agreement with the Zhao and Li et al. 25 findings, that increasing the nano α-Al2O3 particles loading causes a little poorer dispersion of the nanoparticles than more agglomeration. As depicted in Figure 11(b), it can be clearly seen that the nano α-Al2O3 particles are agglomerated in the matrix and the diameter range of them are about 60–70 nm.
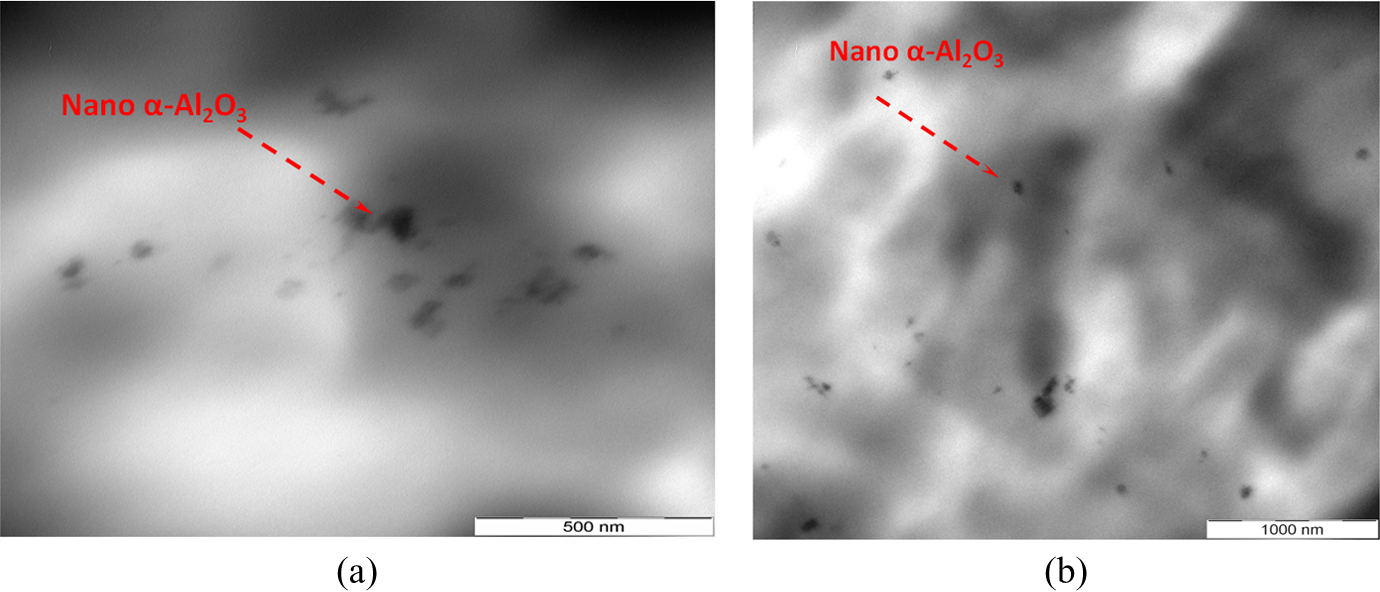
TEM observation of cryo thin sections for PP/2% nano α-Al2O3 composites (a) with dispersant and (b) without dispersant. TEM: transmission electron microscope; PP: polypropylene.
Figure 12 shows that the higher concentrations of nano α-Al2O3 particles, more than 4 wt%, did not result in well-dispersed individual nanoparticles, and even some nanoparticles are entangled together in the type of casual orientation, which generates the interconnecting structure. The size ranges of nano α-Al2O3particles with dispersant and without dispersant were between 100 and150 nm and 200–300 nm, respectively. These results are in good agreement with the findings of Bikiaris et al. 26 as reported increasing of the nanoparticles content in the matrix leads to larger agglomerates. From these micrographs, it is obvious that the individual nano α-Al2O3 particles are strongly joined together and form agglomerates. Presence of all these entities reasoned the declining to the mechanical properties of the fabricated composites. The decrease in IS after addition of 5 wt% of nano α-Al2O3 particles were validated from the observation of Figure 12.
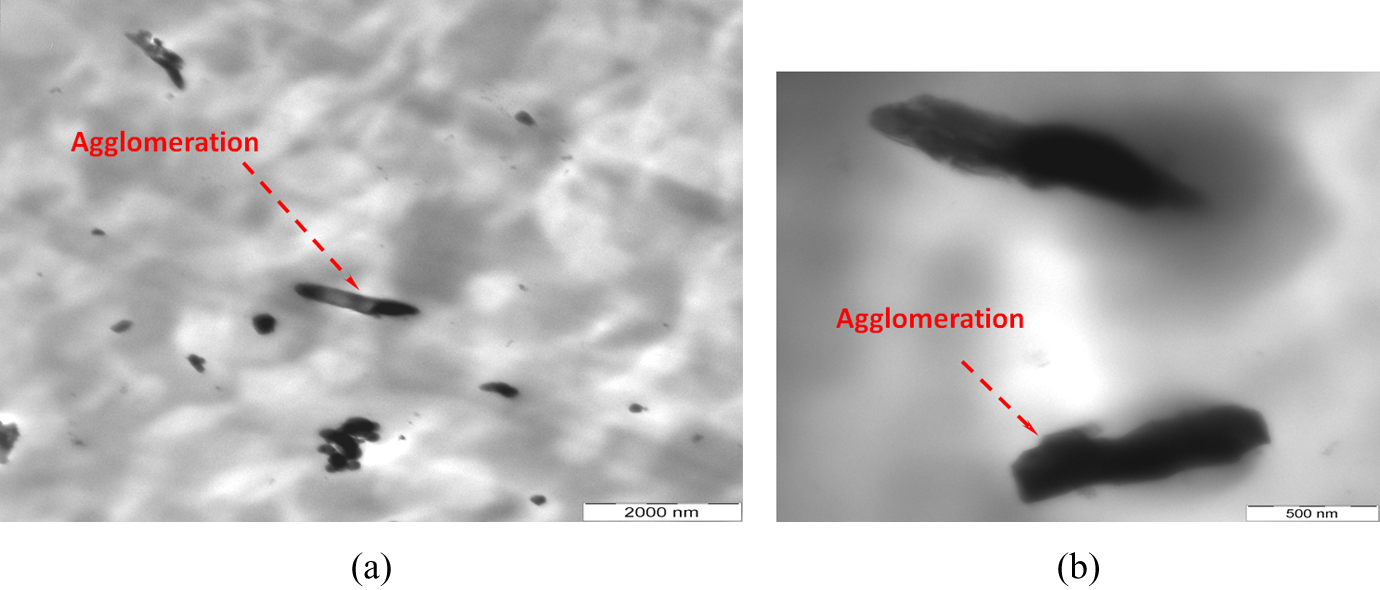
TEM observation of cryo thin sections for PP/5% nano α-Al2O3 composites (a) with dispersant and (b) without dispersant. TEM: transmission electron microscope; PP: polypropylene.
From transmission electron micrographs, it was found that the presence of dispersant directly influence the size of the nanoparticles agglomerates. When the SDBS is used, the nanoparticles agglomerates were broken up into stretched bonds. 2 In this study, the agglomerate formation of nanoparticles is more serious, since the dispersion process was completely relying on the ability to separate the nano α-Al2O3 particles. At lower filler content, nano α-Al2O3 particles were dispersed very well, especially for the PP/nano α-Al2O3 composites with filler loading of lower than 5 wt% and increased the mechanical properties.
Conclusions
PP nanocomposites containing 1–5 wt% of α-Al2O3 nanoparticles were prepared using a Haake Poly Drive blending machine. Dispersion of nano α-Al2O3 powders through the ultrasonication process with dispersants was investigated. FTIR spectra of the pure PP and PP/nano α-Al2O3 composites demonstrates in all of nanocomposite spectrums Al–O bond at 568 cm−1 resulting from the fact that the nano α-Al2O3 particles were recently created.
The effects of dispersant (SDBS) on the FTIR spectra for PP/nano α-Al2O3 composites was also observed and revealed when dispersant is used, the intensity of the peaks in the range of 500–1000 cm−1 slightly increases. From transmission and scanning electron micrographs of impact fractured surface, at lower filler content, nano α-Al2O3 particles were dispersed very well, especially for the PP/nano α-Al2O3 composites with filler loading of lower than 5 wt%. Agglomeration and rough dispersion of nano α-Al2O3 can be clearly observed at higher filler loading. Moreover, it was established that the presence of dispersant directly affected the good wetting behavior between the filler and matrix. A well dispersion and wetting situations may generate suitable stress distribution from the matrix to the filler throughout the tensile loading.
Footnotes
Acknowledgements
The authors wish to thank the University Putra Malaysia and Fundamental Research Grant Scheme (FRGS).
Funding
This work was supported by Ministry of Higher Education, Malaysia.