
Abstract
An attempt has been made to study the influence of wear parameters like applied load, sliding speed, sliding distance on the dry sliding wear of polytetrafluroethylene (PTFE), PTFE + 25% glass and PTFE + 40% bronze composites. Experiments, based on the techniques of Taguchi, were performed to acquire data in a controlled way. An orthogonal array and the analysis of variance were employed to investigate the influence of process parameters on the wear of composites. The worn surfaces were examined using scanning electron microscope (SEM). The experimental results show that sliding distance and applied load were found to be the more significant factors among the other control factors on wear. The objective is to establish a correlation between dry sliding wear of composites and wear parameters. These correlations were obtained by multiple regressions. A good agreement between the predicted and actual wear resistance was seen.
Introduction
Polytetrafluroethylene (PTFE) is currently finding increasing utility in high-performance mechanical seals due to its unique properties like high chemical resistivity, low coefficient of friction and high temperature stability.1,2 However, PTFE exhibits poor wear and abrasion resistance, leading to early failure and leakage problems in the seals. The wear resistance of PTFE can be significantly improved by the addition of suitable filler materials. 3 Besides the type, the shape and size of the materials also influenced the tribological properties. 4
Selecting the correct operating conditions is always a major concern as traditional experiment design would require many experimental runs to achieve satisfactory result. Several mathematical models based on statistical regression techniques have been constructed to select the proper testing or cutting conditions.5,6 The Taguchi’s design can be simplified by expending the application of the traditional experimental designs to the use of orthogonal array and linear graphs. It is an efficient and systematic approach to optimize the designs for performance, quality and cost. The Taguchi method has led to limited numbers of applications in a worldwide range of industries in recent years.7,8 The dry sliding wear of composites also depends on several factors such as size, shape, and content of particle, environment and the test conditions, such as load, speed and temperature.9,10 However, most of the above studies are confined to dry sliding wear of various polymers and their composites. The improved performance of polymers and their composites in tribological applications by the addition of filler materials has shown great promise and so has lately been a subject of considerable interest. 11
To study the correlation between the dry sliding wear properties and the characteristic parameters, for example the composition of the composite and the operating conditions is of prime importance for designing proper matrix–fiber filler combinations to satisfy the various functional requirements. It is important, as in actual practice, that the resultant wear rate is the combined effect of more than one interacting variable. But visualization of impact of any individual operating parameter or control factor in an interacting environment really becomes difficult. To this end, an inexpensive and easy-to-operate experimental strategy based on Taguchi’s parameter design may be adopted to study the effects of various parameters on the dry sliding wear rate of the composites. 12
On implementation of design of experiment
Wear processes in composites are complex phenomena involving a number of operating variables, and it is essential to understand how the wear characteristics of the composites are affected by different operating conditions. Although a large number of researchers have reported on properties, performance and on wear characteristics of composites, neither the optimization of wear processes nor the influence of process parameters on wear rate has adequately been studied yet. Several mathematical models based on statistical regression techniques have been constructed to select the proper testing conditions required for full factorial design increases geometrically, whereas the fractional factorial design is efficient and significantly reduced the time. This method is popular because of its simplicity, but this simplicity has led to unreliable results and inadequate conclusions. The fractional design might not contain the best design point. Moreover, the traditional multifactorial experimental design is the “change-one-factor-at-a-time” method. Under this method only one factor is varied, while all the other factors are kept fixed at a specific set of conditions. To overcome these problems, Taguchi and Konishi 12 recommended the use of orthogonal arrays. This inexpensive and easy to operate experimental strategy based on Taguchi’s parameter design has been adopted to study the effect of various parameters and their interactions in a number of engineering processes.
The aim of the present study was, therefore, to investigate the tribological behavior of pure PTFE and its composite under various testing conditions. The wear model for the tested materials was developed based on the applied load, sliding speed and sliding distance. Furthermore, analysis of variance (ANOVA) using the statistical software “MINITAB R14” is employed to investigate the testing characteristics of these materials.
Materials and experimentation
Materials
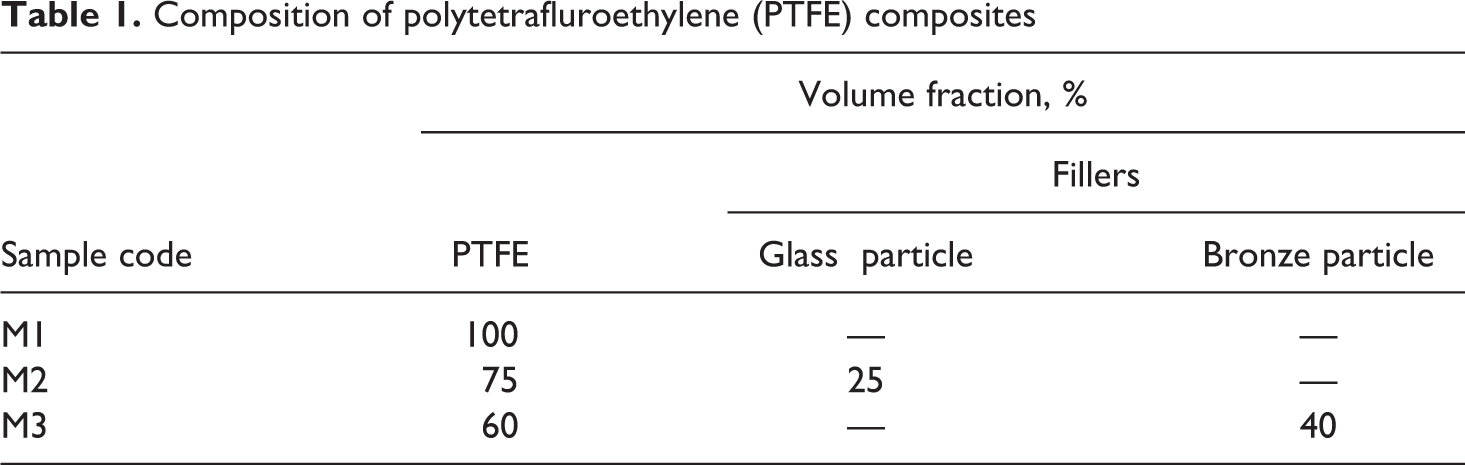
The compression molded pure PTFE and two PTFE-based composite materials were studied in the present work. The compositional details of each material are presented in Table 1. The materials are purchased in the form of rectangular sheets with dimensions 100 mm × 100 mm × 3 mm by Poly fluoro Ltd. (Bangalore, India). The size of the pure PTFE, glass particle and bronze particle used for manufacture is 23.5 µm, 40 µm and 48 µm, respectively.
Composition of polytetrafluroethylene (PTFE) composites
Experimental procedure
A pin-on-disc test apparatus was used to investigate the dry sliding wear characteristics of the pure PTFE and their composites per ASTM G 99-95 standards. The disc used is En-32 steel hardened to 62HRC, 120 mm track diameter and 8 mm thick, with surface roughness of 10 μm Ra. The tests were conducted by selecting test duration, load and velocity and performed in a track of 130 mm diameter. The test specimen 10 mm × 10 mm × 3 mm is affixed to a pin of dimensions 3 mm diameter and 30 mm height, with an adhesive of high bonding strength. The composite specimen makes contact to the counter surface. Prior to testing, the samples are rubbed over a 600-grade silicon carbide (SiC) paper to ensure proper contact with the counter surface. The surface of both the samples and disc are cleaned with a soft paper soaked in acetone before the test. The test set up used for the experimentation is as shown in Figure 1. The initial weight of specimen was measured in a single pan electronic weighing machine with a least count of 0.0001 g. During the test, the pin was pressed against the counter part rotating against the steel disc by applying load. After running through a fixed sliding distance, the specimen were removed, cleaned with acetone, dried and weighed to determine the weight loss due to wear. The difference in the weight measured before and after test gives the sliding wear of composite specimen. The sliding wear behavior of the composites studied as a function of weight loss, applied load, sliding speed and sliding distance.
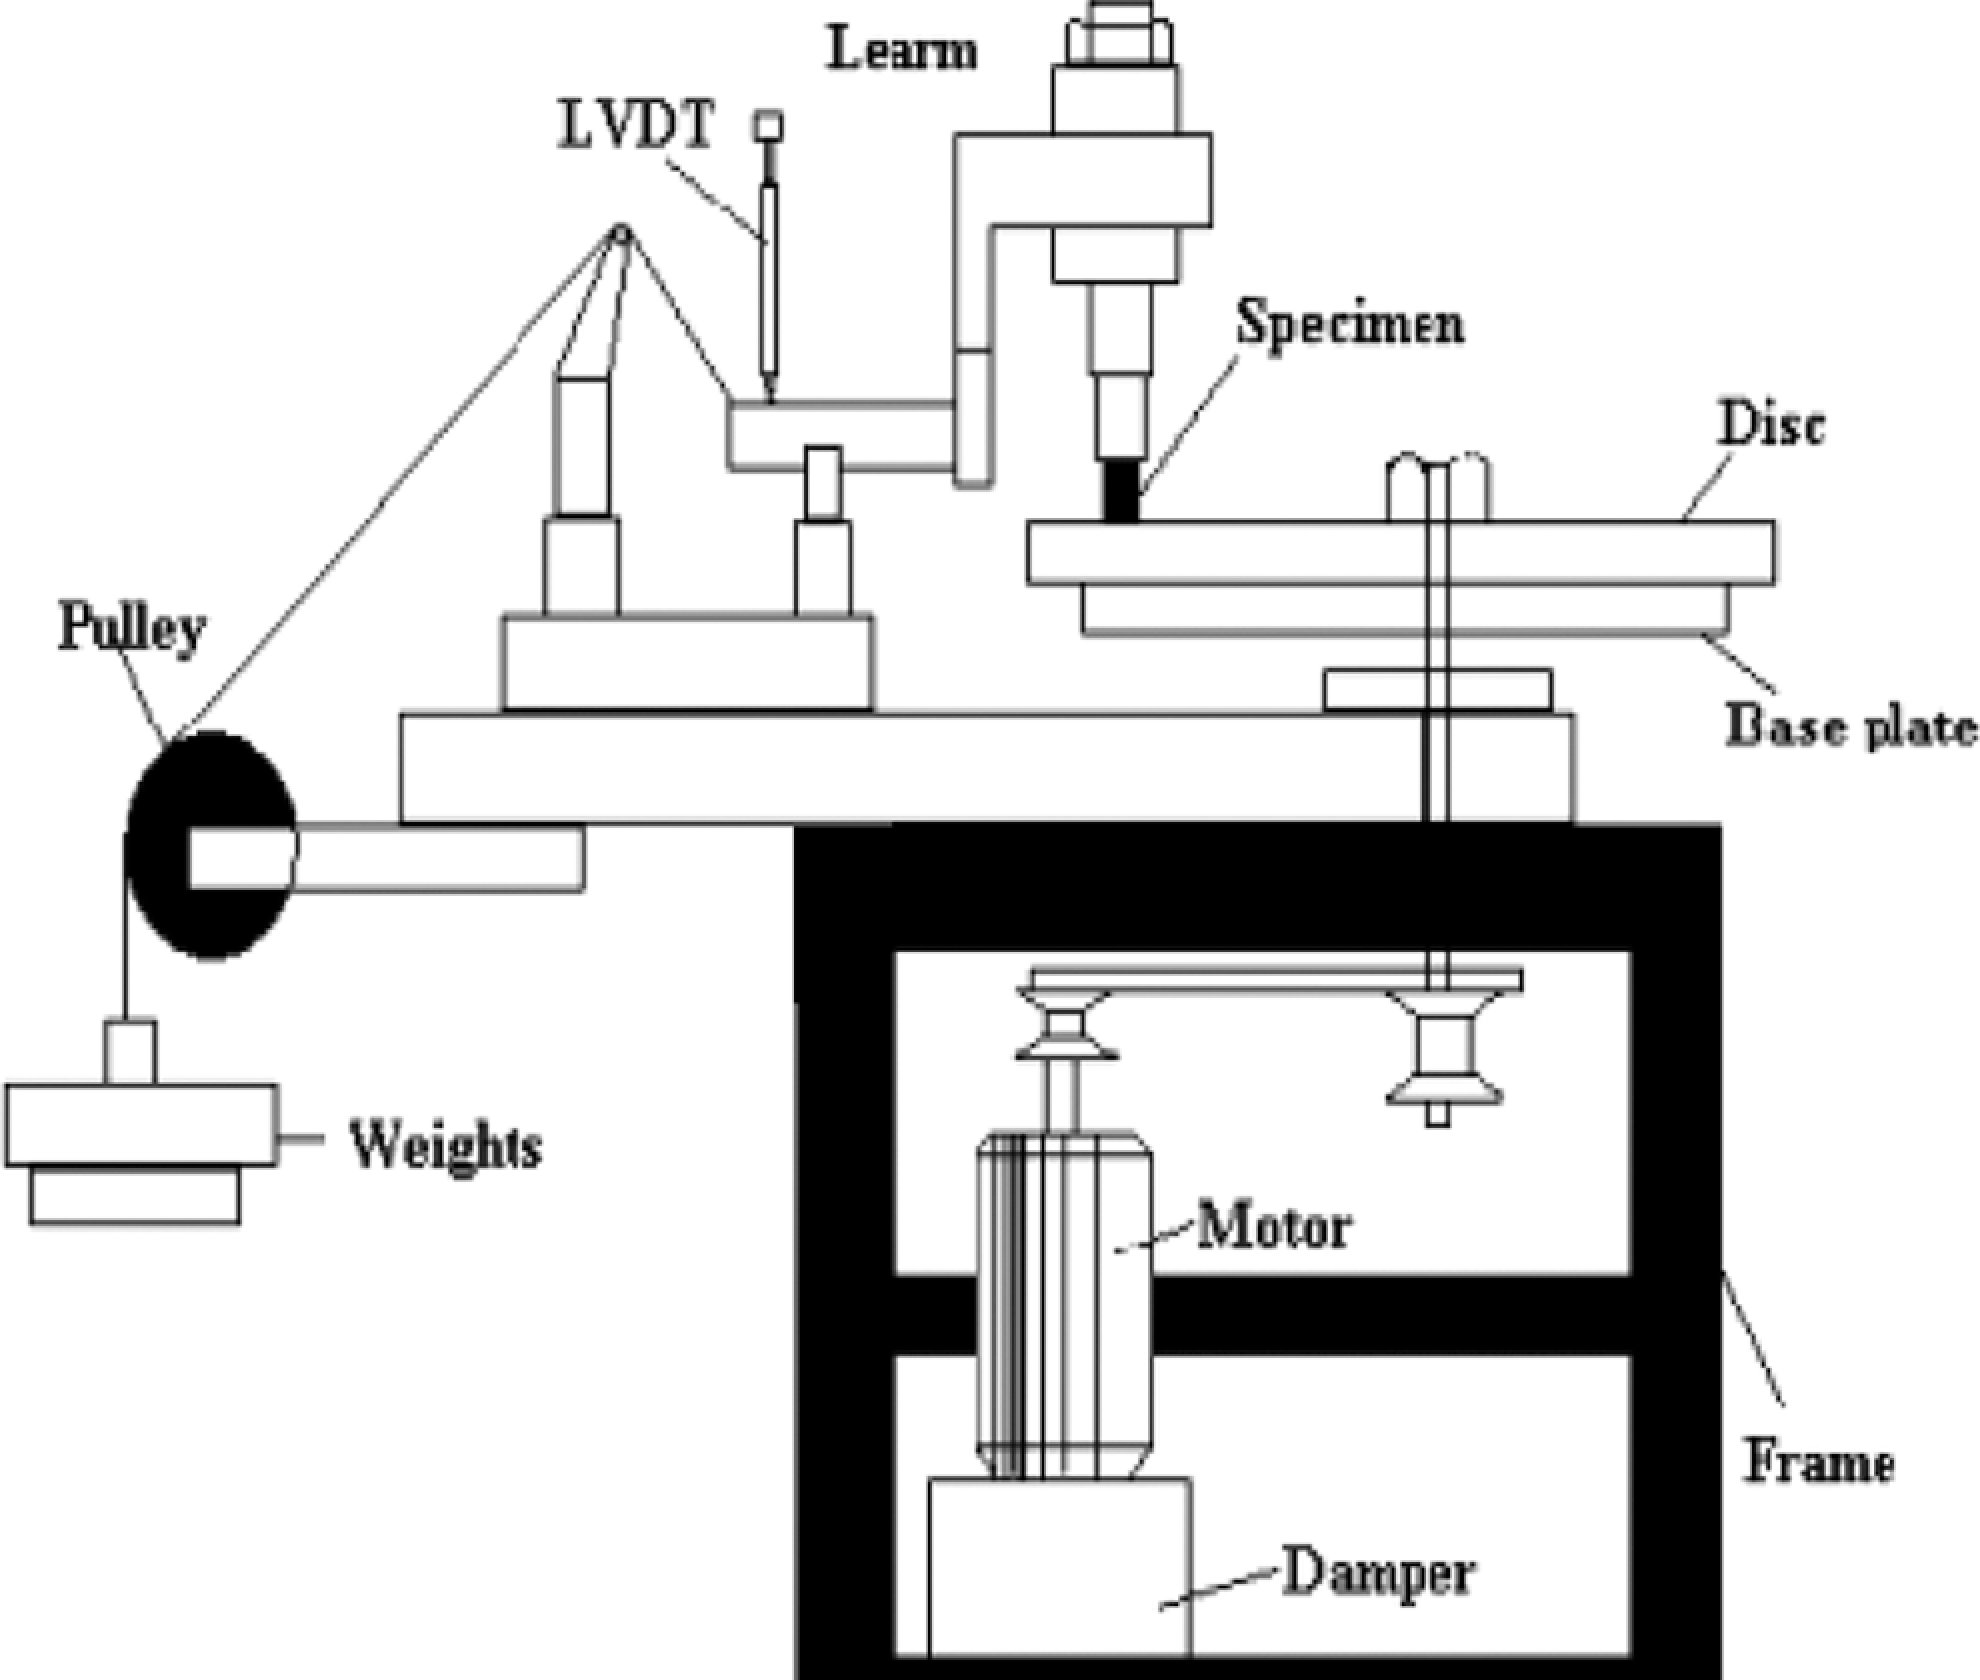
Schematic diagram of pin-on-disc apparatus.
Taguchi design of experiments
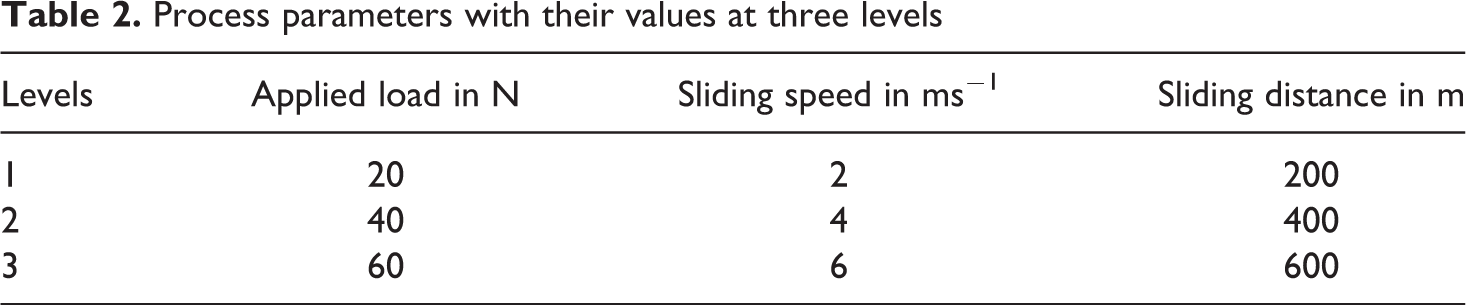
Design of experiments is a scientific approach to effectively plan and perform experiments, using statistics. In such designs, the combination of each factor at every level is studied to determine the combination that would yield the best result. The advantage of such design schemes is that it will always determine the effect of factors and possible interactions (between factors) on the performance output. Taguchi design of the experiment is a powerful analysis tool for modeling and analyzing the influence of control factors on performance output. The most important stage in the design of experiment lies in the selection of the control factors. Therefore, initially a large number of factors are included so that no significant variables can be identified at earliest opportunity. The experiments were conducted as per the standard L 27 orthogonal array. The plan of experiments, the Taguchi method with their values at three levels, was used. The wear parameters selected and their levels are presented in Table 2.
Process parameters with their values at three levels
Results and discussion
The experiments were conducted with an aim of relating the influence of applied load (L), sliding speed (S) and sliding distance (D) on dry sliding wear of pure PTFE, 25% glass particle + PTFE and 40% bronze particle + PTFE composites under study.
ANOVA and effect of factors
The ANOVA allows analyzing the influence of each variable on the total variance of the results. Table 3 shows the results of ANOVA of dry sliding wear of pure PTFE test samples. This analysis was performed with a level of significance of 1% that is for a level of confidence of 99%.13,14
ANOVA for pure polytetrafluroethylene (PTFE)
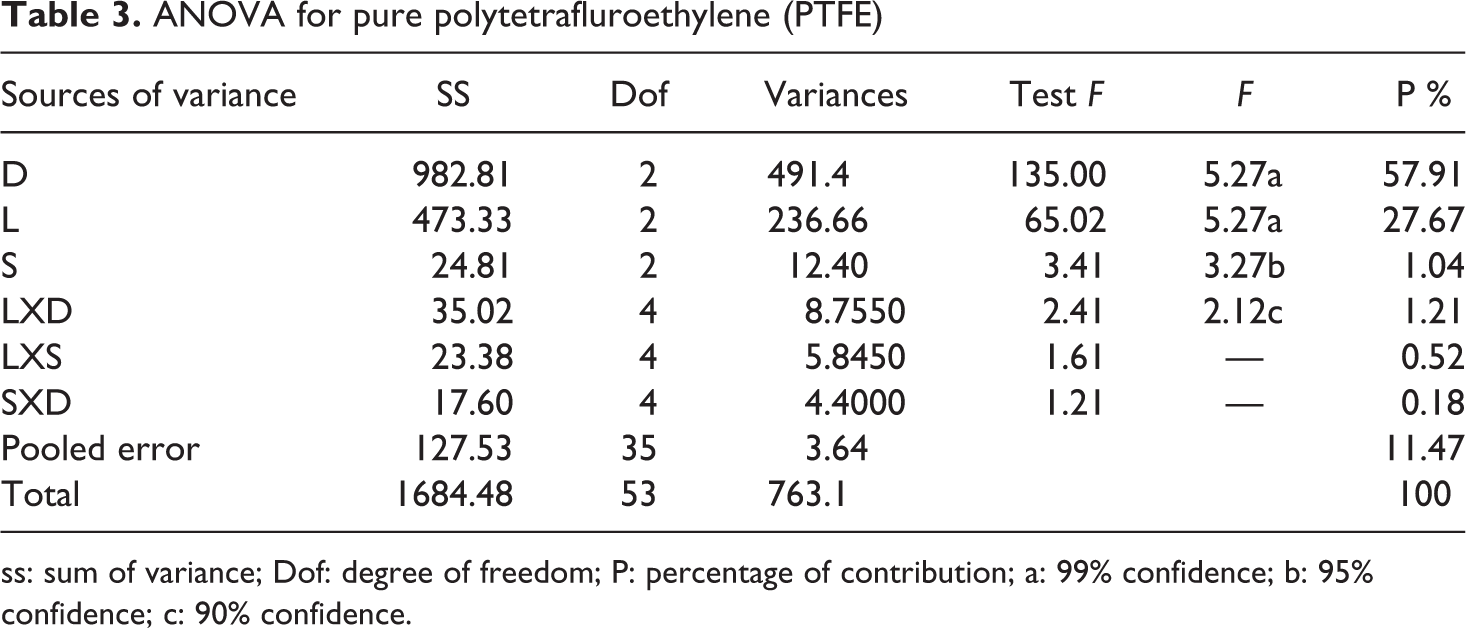
ss: sum of variance; Dof: degree of freedom; P: percentage of contribution; a: 99% confidence; b: 95% confidence; c: 90% confidence.
The last column of Table 3 shows the contribution percentage (P) of each variable in the total variation, indicating the influence degree on the wear of contact pair. If the “Test F” value is greater than the F (1%) column value, then the assigned variable is statistically significant. One can observe from the ANOVA in Table 3 that the sliding distance (P = 57.91%), applied load (P = 27.67%) and sliding speed (P = 1.04%) have great influence on the wear. However, the interactions between applied load/sliding distance (1.21%), applied load/sliding speed (0.52%), sliding speed/sliding distance (0.18%) also has an influence on the wear. The pooled error associated with ANOVA in Table 3 is about 11.47%.
The ANOVA for 25% glass particle + PTFE composites is shown in Table 4. It can be observed that the sliding distance (P = 41.22%) is the major factor followed by applied load (P = 39.08%), sliding speed (P = 1.95%) and the interactions between applied load/sliding distance (5.10%), applied load/sliding speed (0.07%) exerts a significant influence. But sliding speed/sliding distance does not have significant effect on the dry sliding wear. The pooled error is 12.58%.
The ANOVA for 40% bronze + PTFE composites is shown in Table 5. It can be observed that the sliding distance (P = 61.23%) is the major factor followed by applied load (P = 10.62%) and sliding speed (P = 0.74%), and the interactions between applied load/sliding speed (6.42%) and sliding speed/sliding
distance (3.95%) exert a significant influence, but the applied load/sliding distance (1.48%) also have a significant effect on the dry sliding wear. The pooled error is 15.56%.
ANOVA for 25% glass particle + polytetrafluroethylene (PTFE) composites
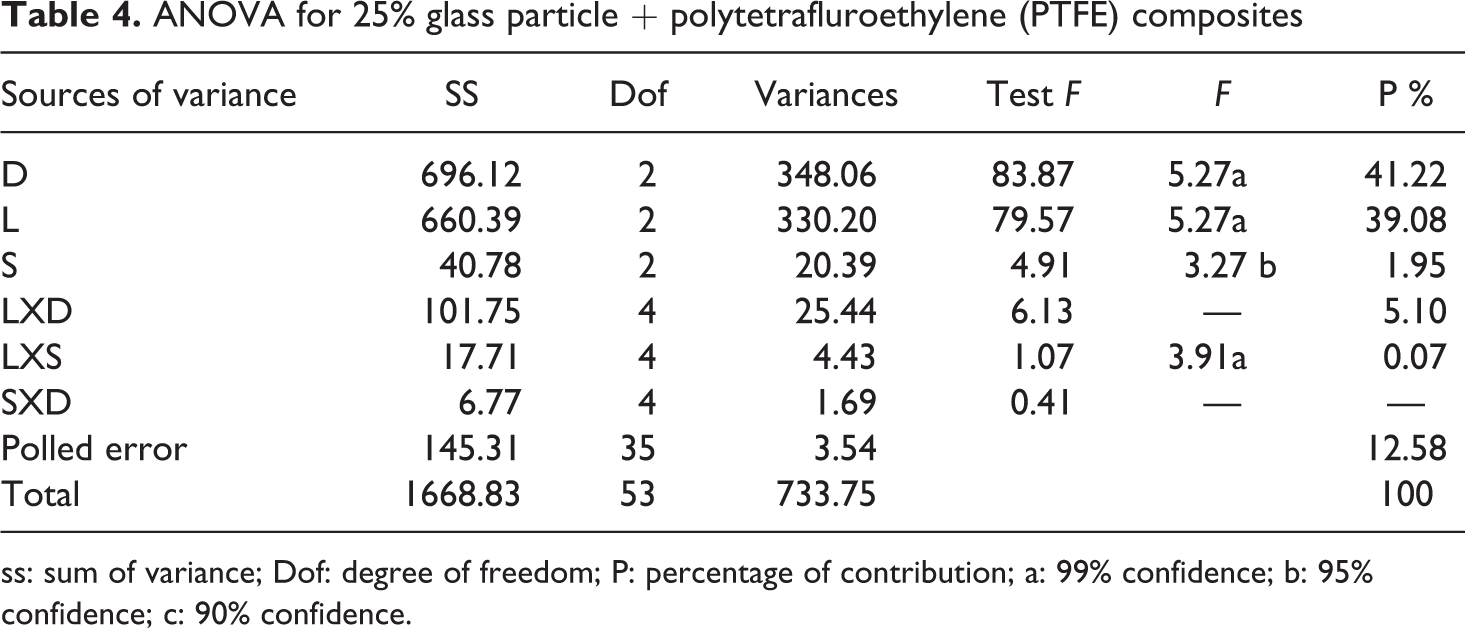
ss: sum of variance; Dof: degree of freedom; P: percentage of contribution; a: 99% confidence; b: 95% confidence; c: 90% confidence.
ANOVA for 40% bronze particle + polytetrafluroethylene (PTFE) composites
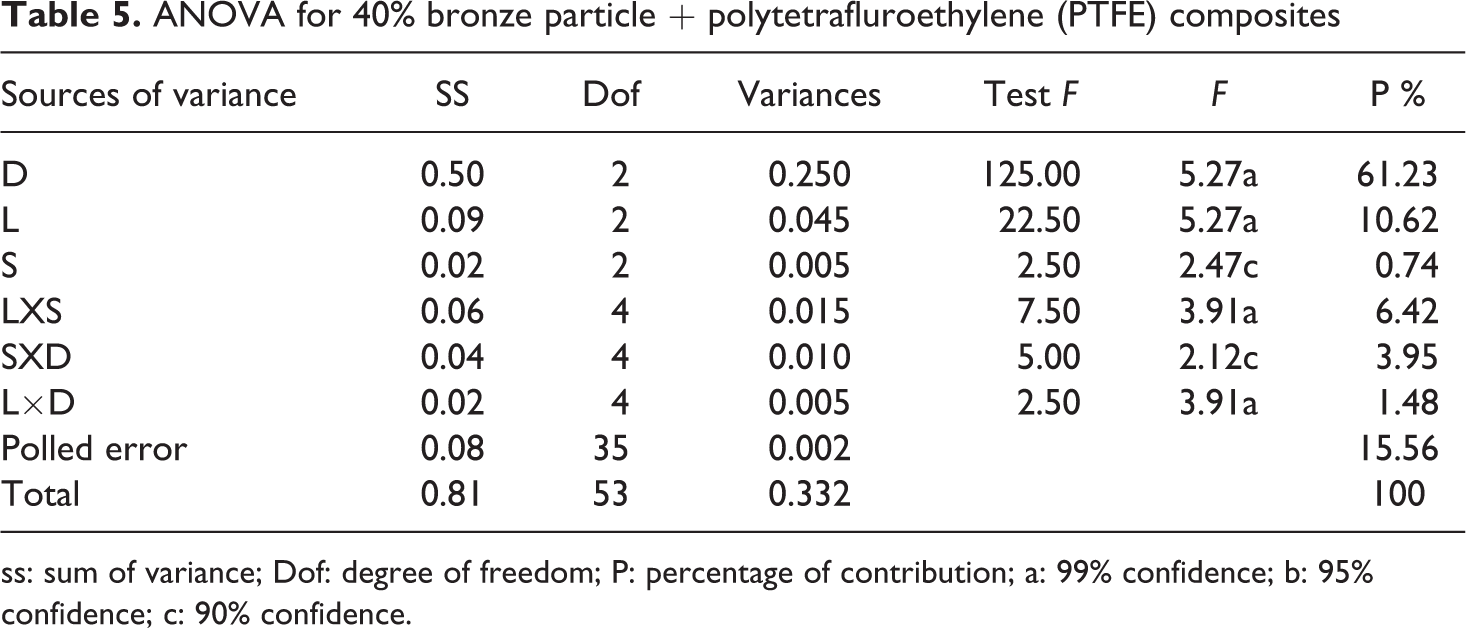
ss: sum of variance; Dof: degree of freedom; P: percentage of contribution; a: 99% confidence; b: 95% confidence; c: 90% confidence.
Regression analysis
Based on the experimental results, the correlation between the wear parameters is obtained as follows using linear regression technique:
Regression equation for pure PTFE composites is


Conformation test
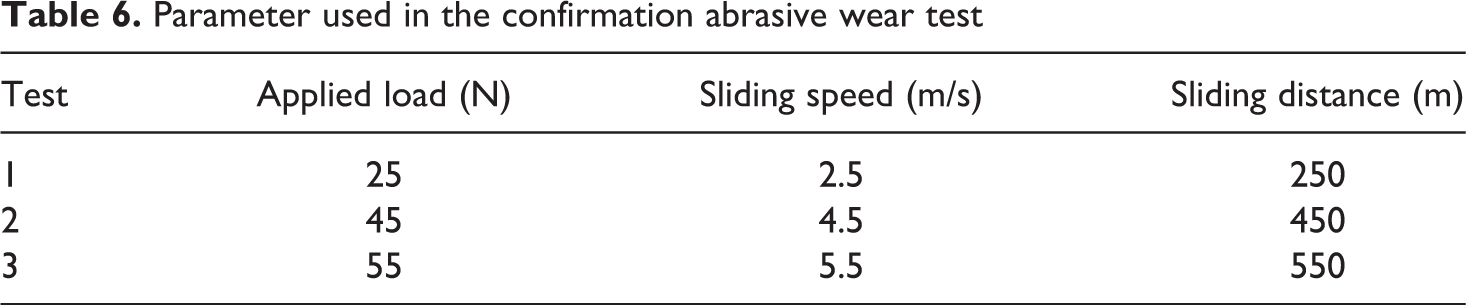
Table 6 shows the experimental conditions selected for the confirmation tests. Table 7 shows the results obtained from the tests, and a comparison is made between the computed values from the regression model developed in the present work (equations (1), (2) and (3)) and the values obtained experimentally.
By analyzing the data in the tables, it is understood that the error associated with the relationship between the experimental values and the calculated values from the regression model for pure PTFE is between 1.04% and 22.15%; for 25% glass particle + PTFE composites, it is between 8.64% and 24.25%; while for 40% bronze + PTFE composites it is between 2.44% and 23.33%. Hence, the model demonstrates a feasible and effective way to evaluate the dry sliding wear behavior of pure PTFE and their composites (Figures 2 to 4).
Parameter used in the confirmation abrasive wear test
Conformation test results and their comparison with regression model
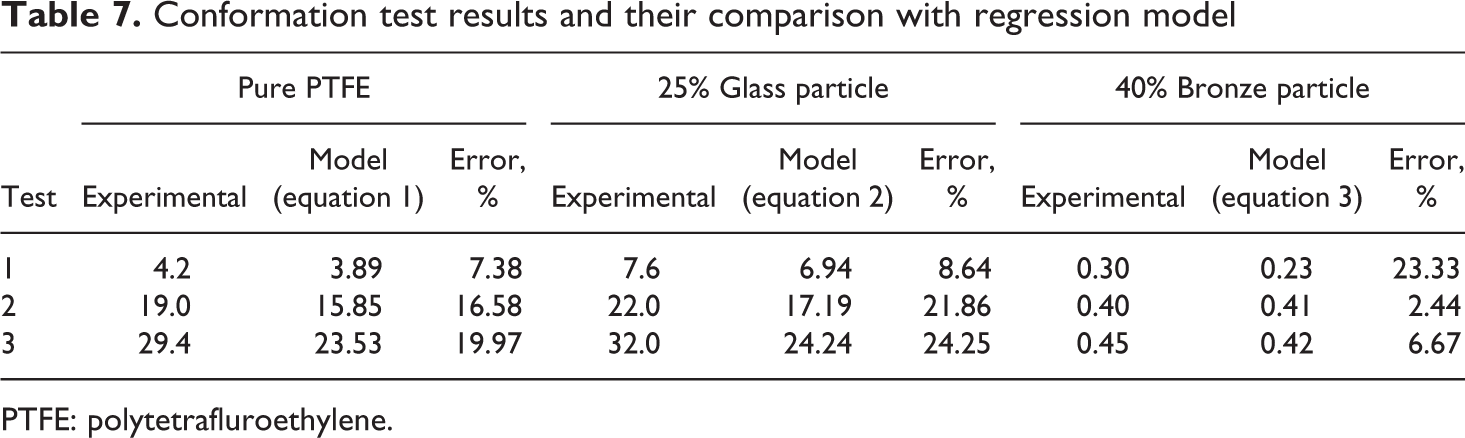
PTFE: polytetrafluroethylene.
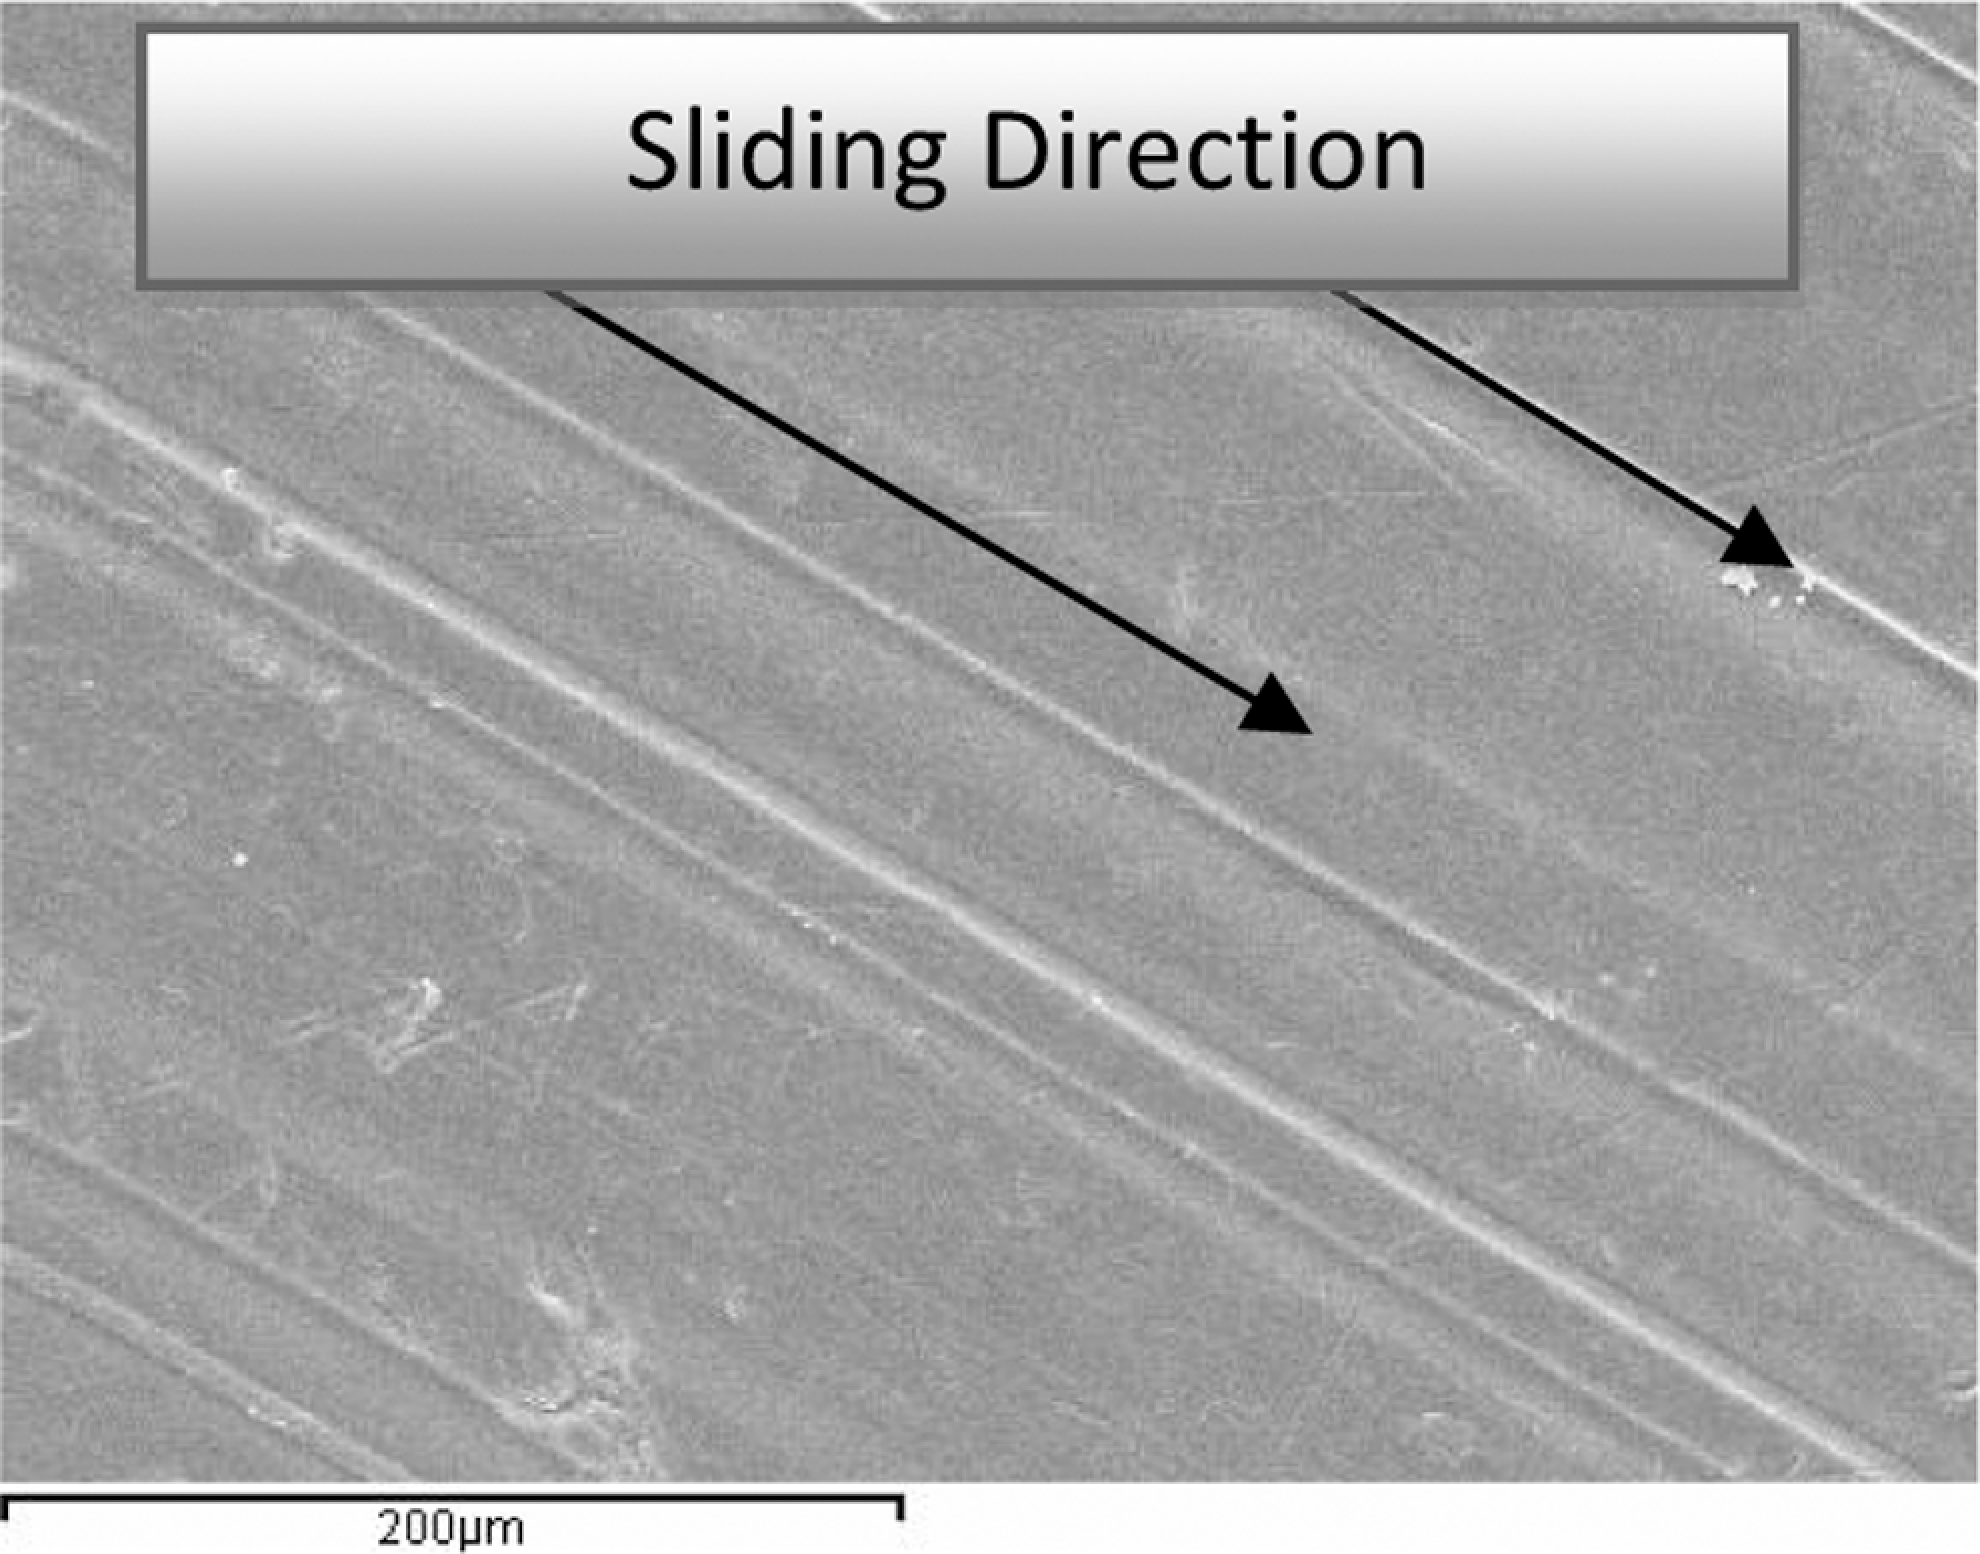
Pure polytetrafluroethylene (PTFE), L = 20 N, V = 6 m/s, N = 600 r/min, d = 600 m, t = 2.07 min, magnification = ×300.
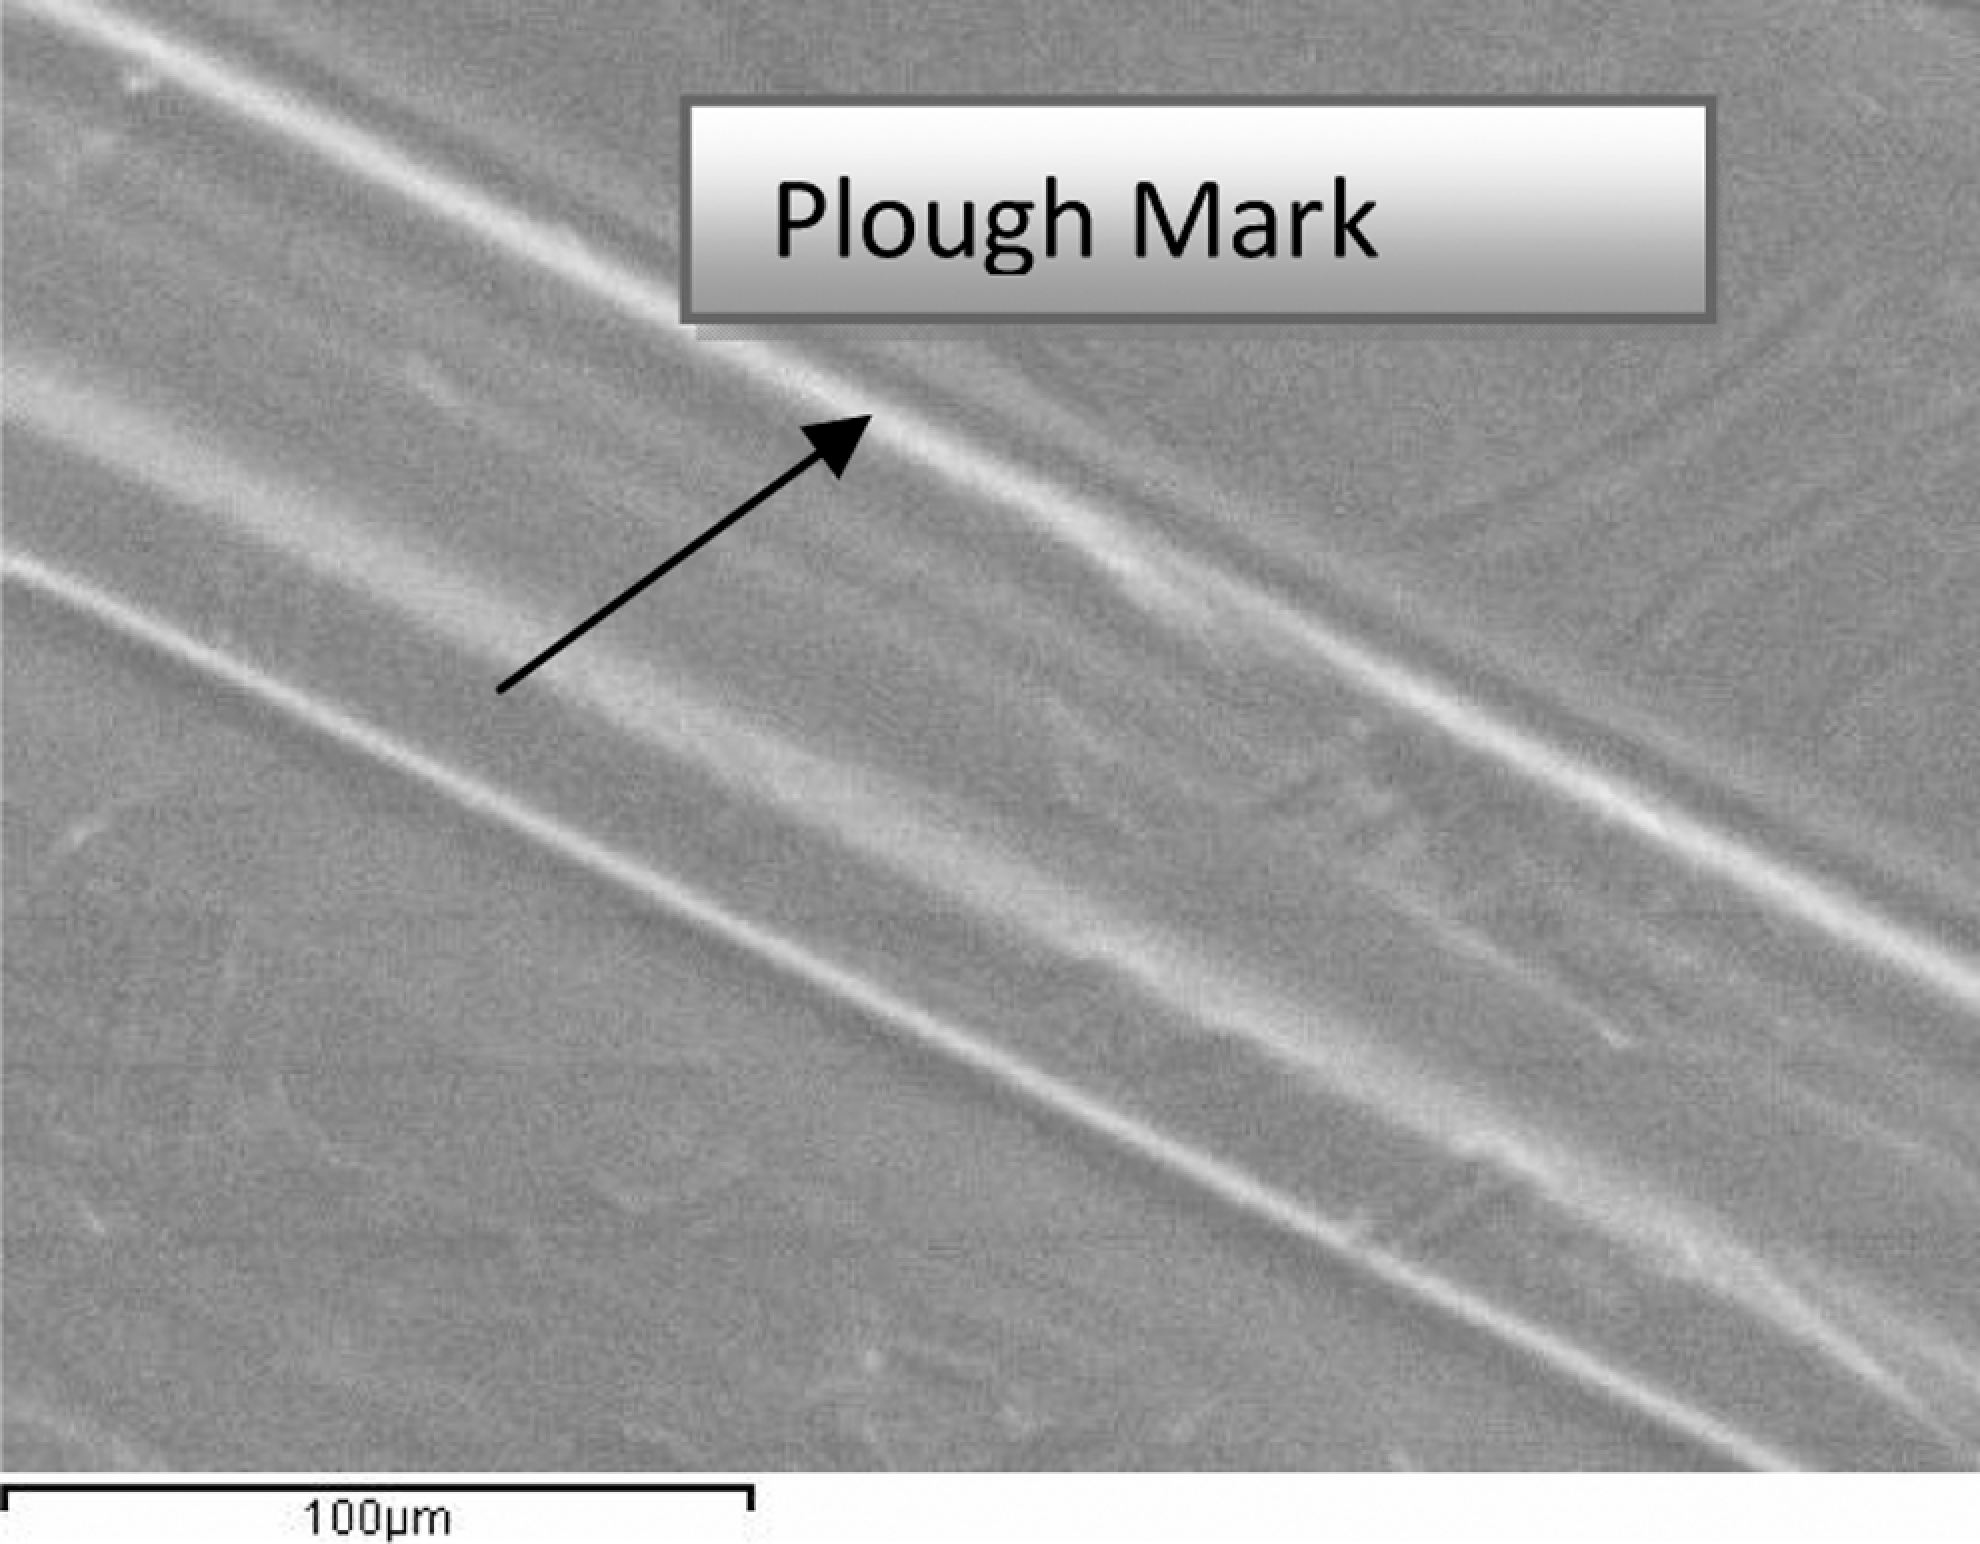
Pure polytetrafluroethylene (PTFE), L = 20 N, V = 6 m/s, N = 600 r/min, d = 600 m, t = 2.07 min, magnification = ×500.
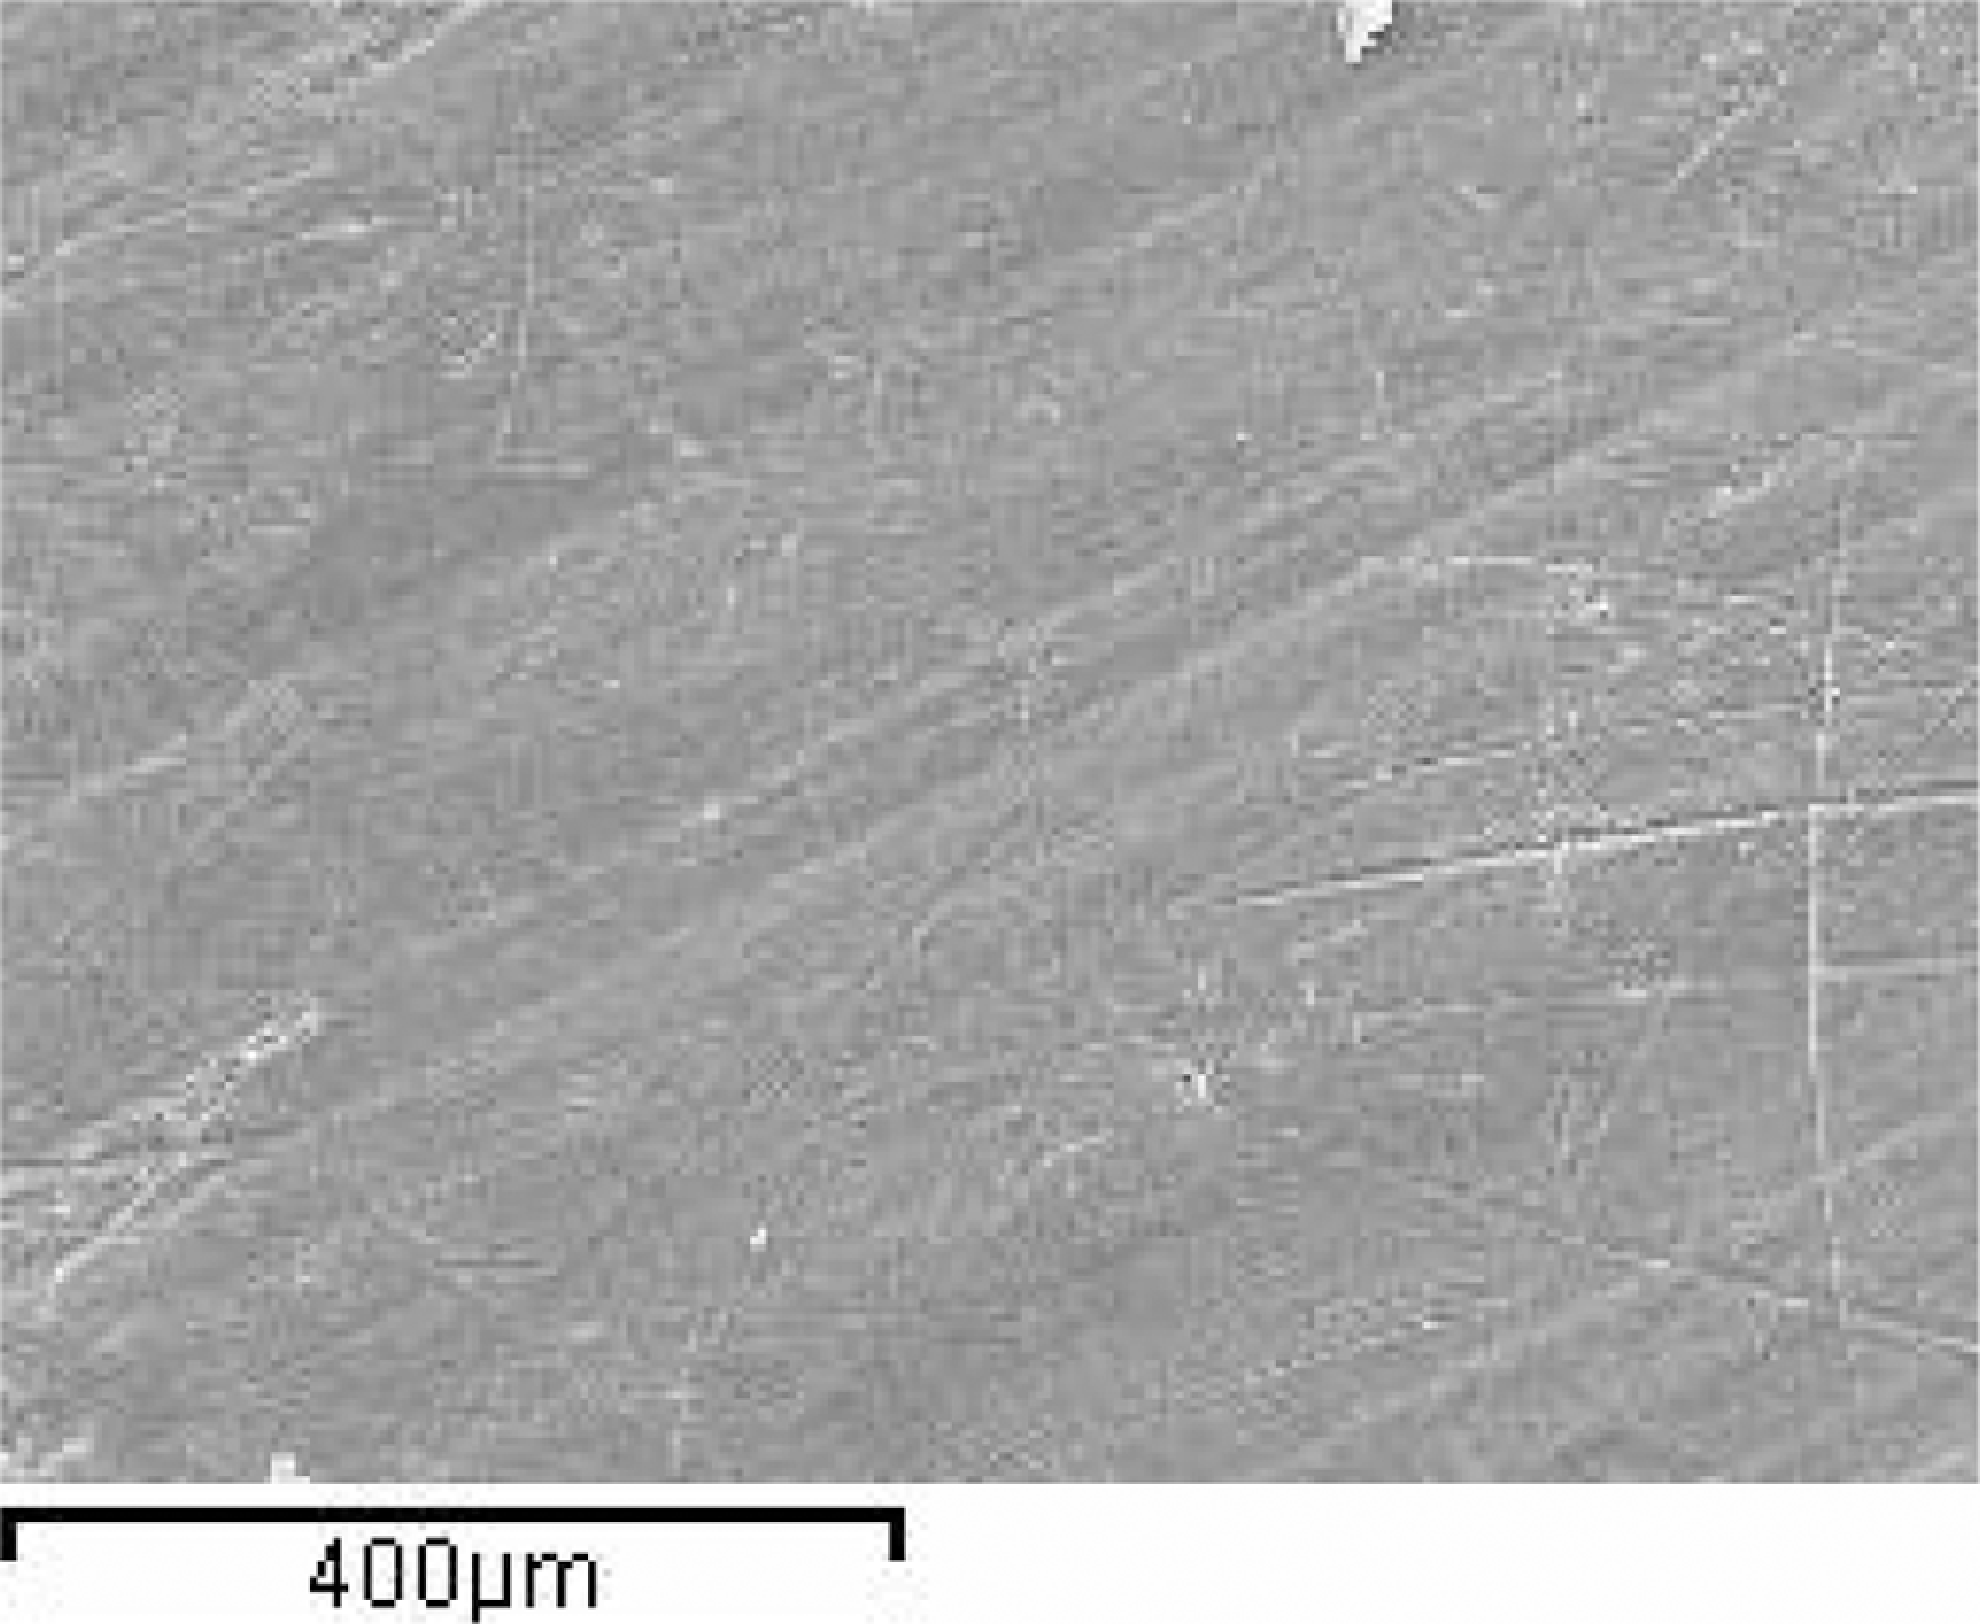
Pure polytetrafluroethylene (PTFE), L = 60 N, V = 6 m/s, N = 600 r/min, d = 600 m, t = 2.07 min, magnification = ×150.
Surface morphology
SEM morphology
The surface morphology of PTFE composites surface was studied by scanning electron microscopy (SEM). Some of the features about the region on the worn surfaces are illustrated and details interpreted in the following sections.
Observations from the wear track revealed regions of localized wear along the sliding direction. It is clear that there is an inhomogeneous distribution of the filler, due to the compression molding process. The pure PTFE particles have a characteristic size on the order of 23.5 µm, and the glass and bronze particles have a characteristic size in the order of 40 µm each. The filler particles are larger than the matrix particles. The SEM analysis of pure PTFE indicated a large average wear particle size, which could be a result of the removal of the nanometer scale film build on the counterface during the wear action.
This is in agreement with Blanchet et al 15 who cite that the wear debris is generated due to the disruption of nanometer scale transfer films and thicker plates, lumps and slabs of polymer formed on the counterface during the repetitive sliding action.
The worn surfaces of the virgin PTFE appear smooth, the worn surfaces of the unfilled PTFE show very slightly ploughed marks, which can be seen from Figure 3. This indicates that adhesion is the dominant wear mechanism of unfilled PTFE. However, in the case of the composites, the presence of the filler materials in the PTFE matrix impedes the film buildup process, resulting in a wear debris particle smaller in size than the virgin PTFE. When the load is increased from 20 to 60 N for the same material, more wear rate occurs and the effect of micro-cracking and delamination on the disc track surface of unfilled PTFE due to the sliding contact and Hertz pressure of the pin of SAE 1045 steel for the load 60 N can be clearly observed from Figure 5. In Figures 6 and 7, the process of wear by micro-plowing and micro-cutting in the PTFE with 25% glass particles can be observed. The presence of the glass particles makes it difficult to wear by micro-plowing and micro-cutting. However, we can observe little amount of wear debris patches attached to the surface of the PTFE + 25% glass particle composites. If the filler or environmental conditions are too abrasive, rapid wear will occur through ploughing. The entrapment of wear debris can have a similar effect. It has been suggested that chemical reactions at the interface may be important. As is well known, the tribological properties of polymers and their composites sliding against a metal under friction conditions are strongly influenced by their ability to form a transfer film on the counterpart surface. Once a transfer film is formed, subsequent interaction occurs between the polymer and a layer of similar material, irrespective of the composition of the substrate. 16
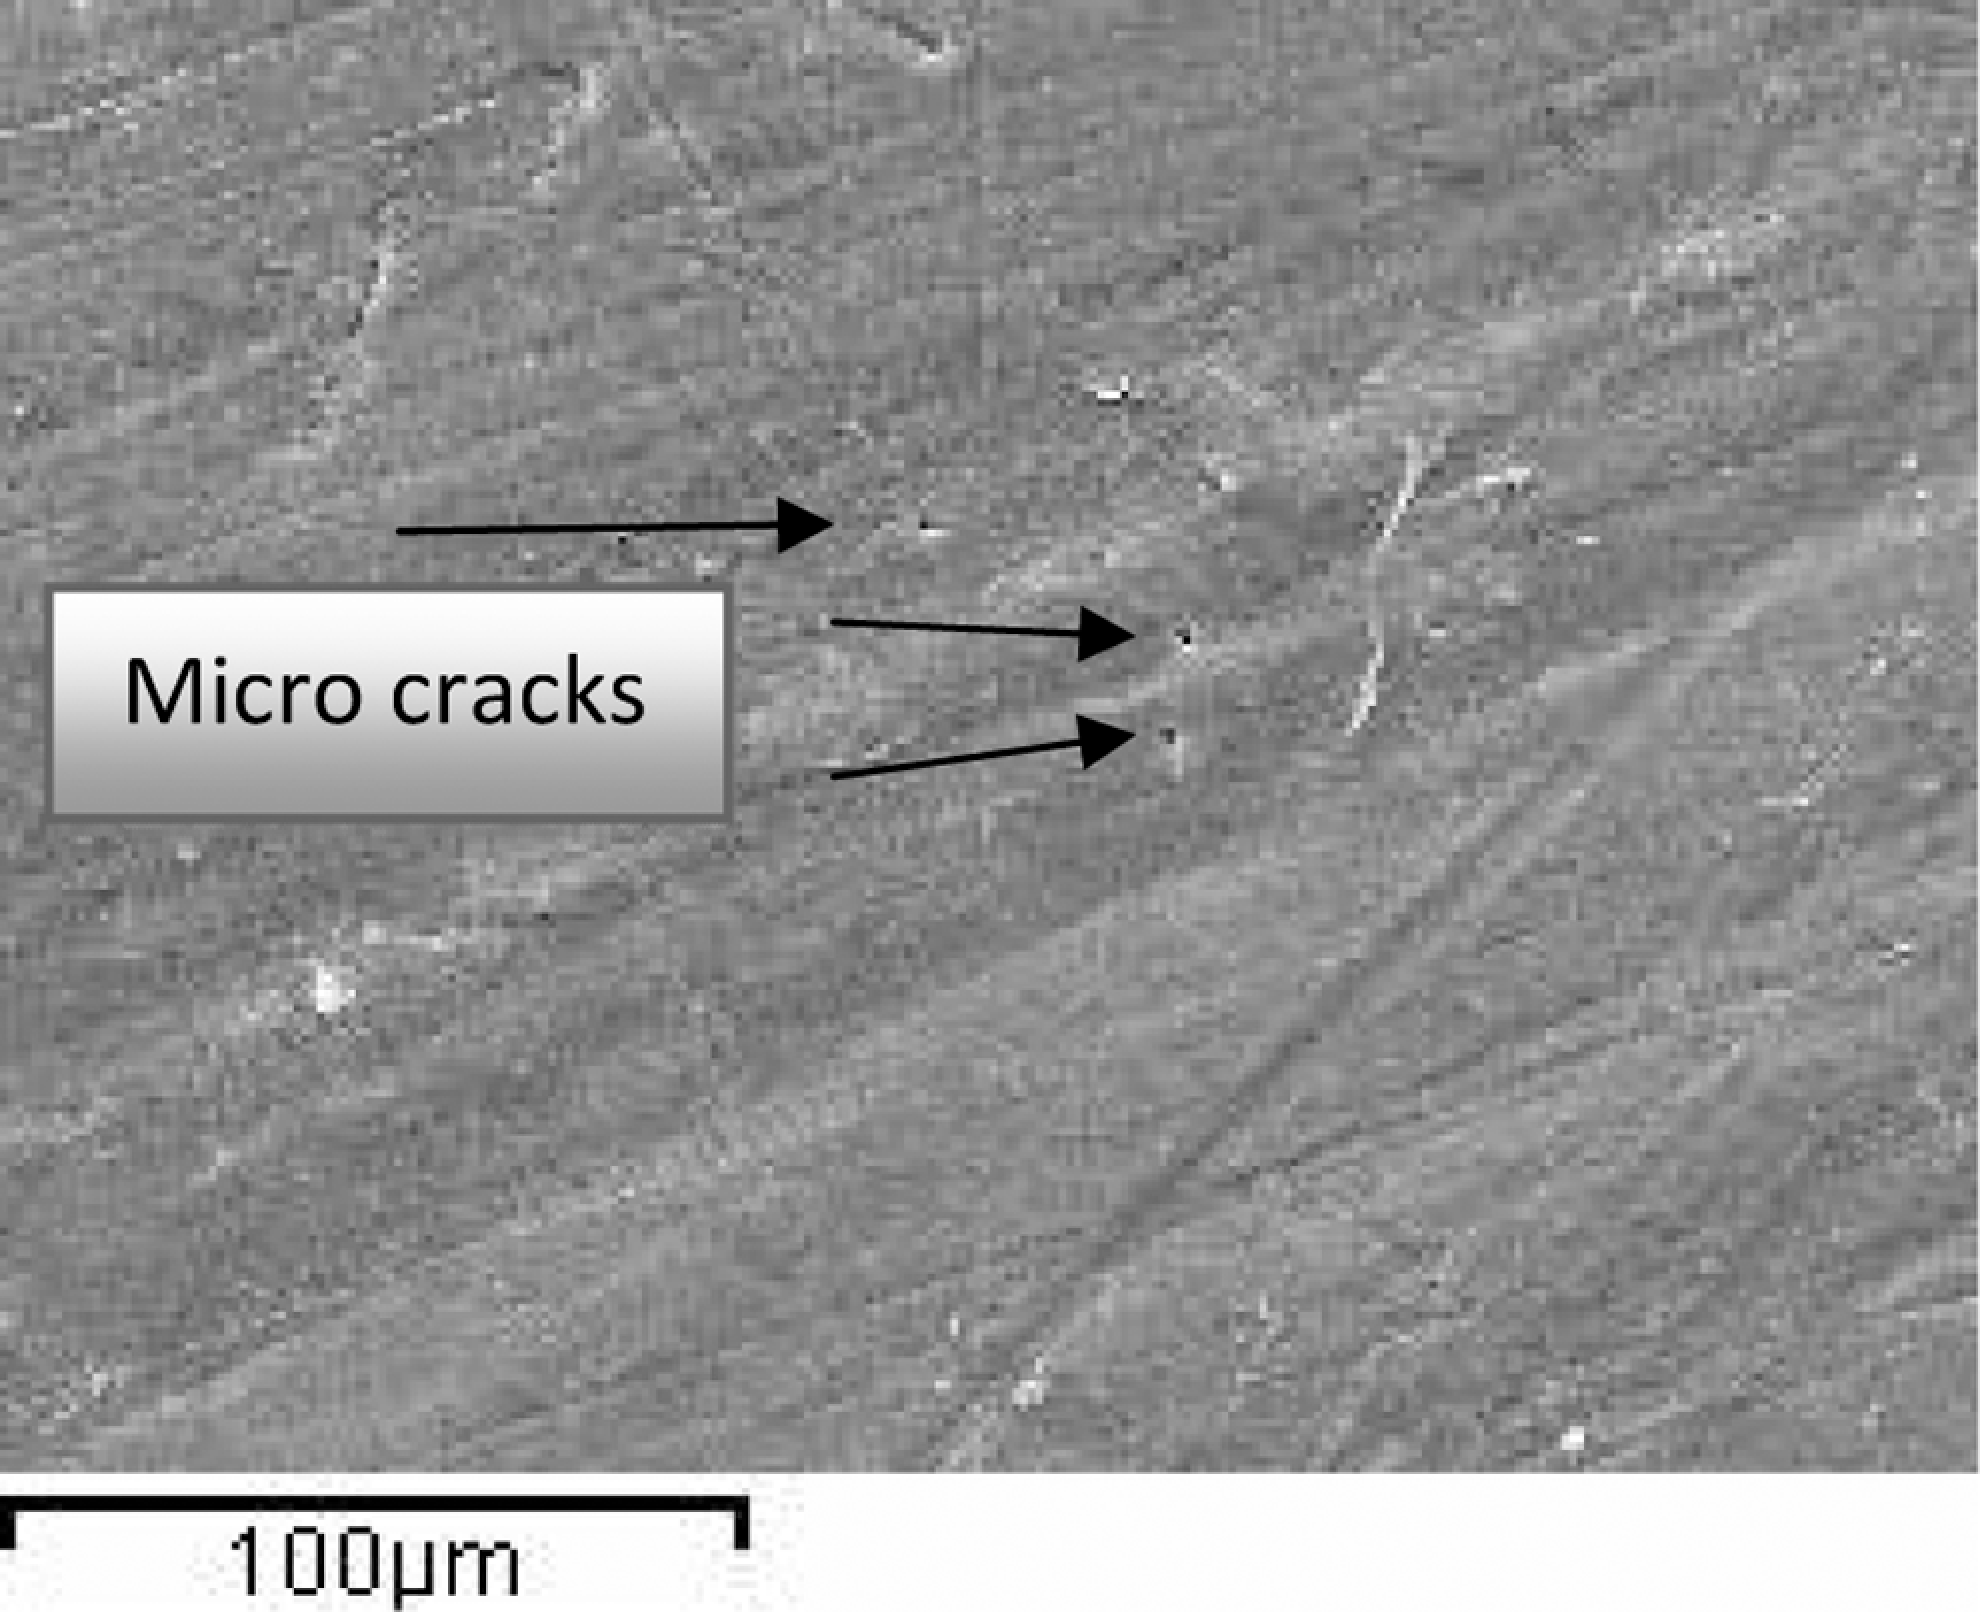
Pure polytetrafluroethylene (PTFE), L = 60 N, V = 6 m/s, N = 600 r/min, d = 600 m, t = 2.07 min, magnification = ×500.
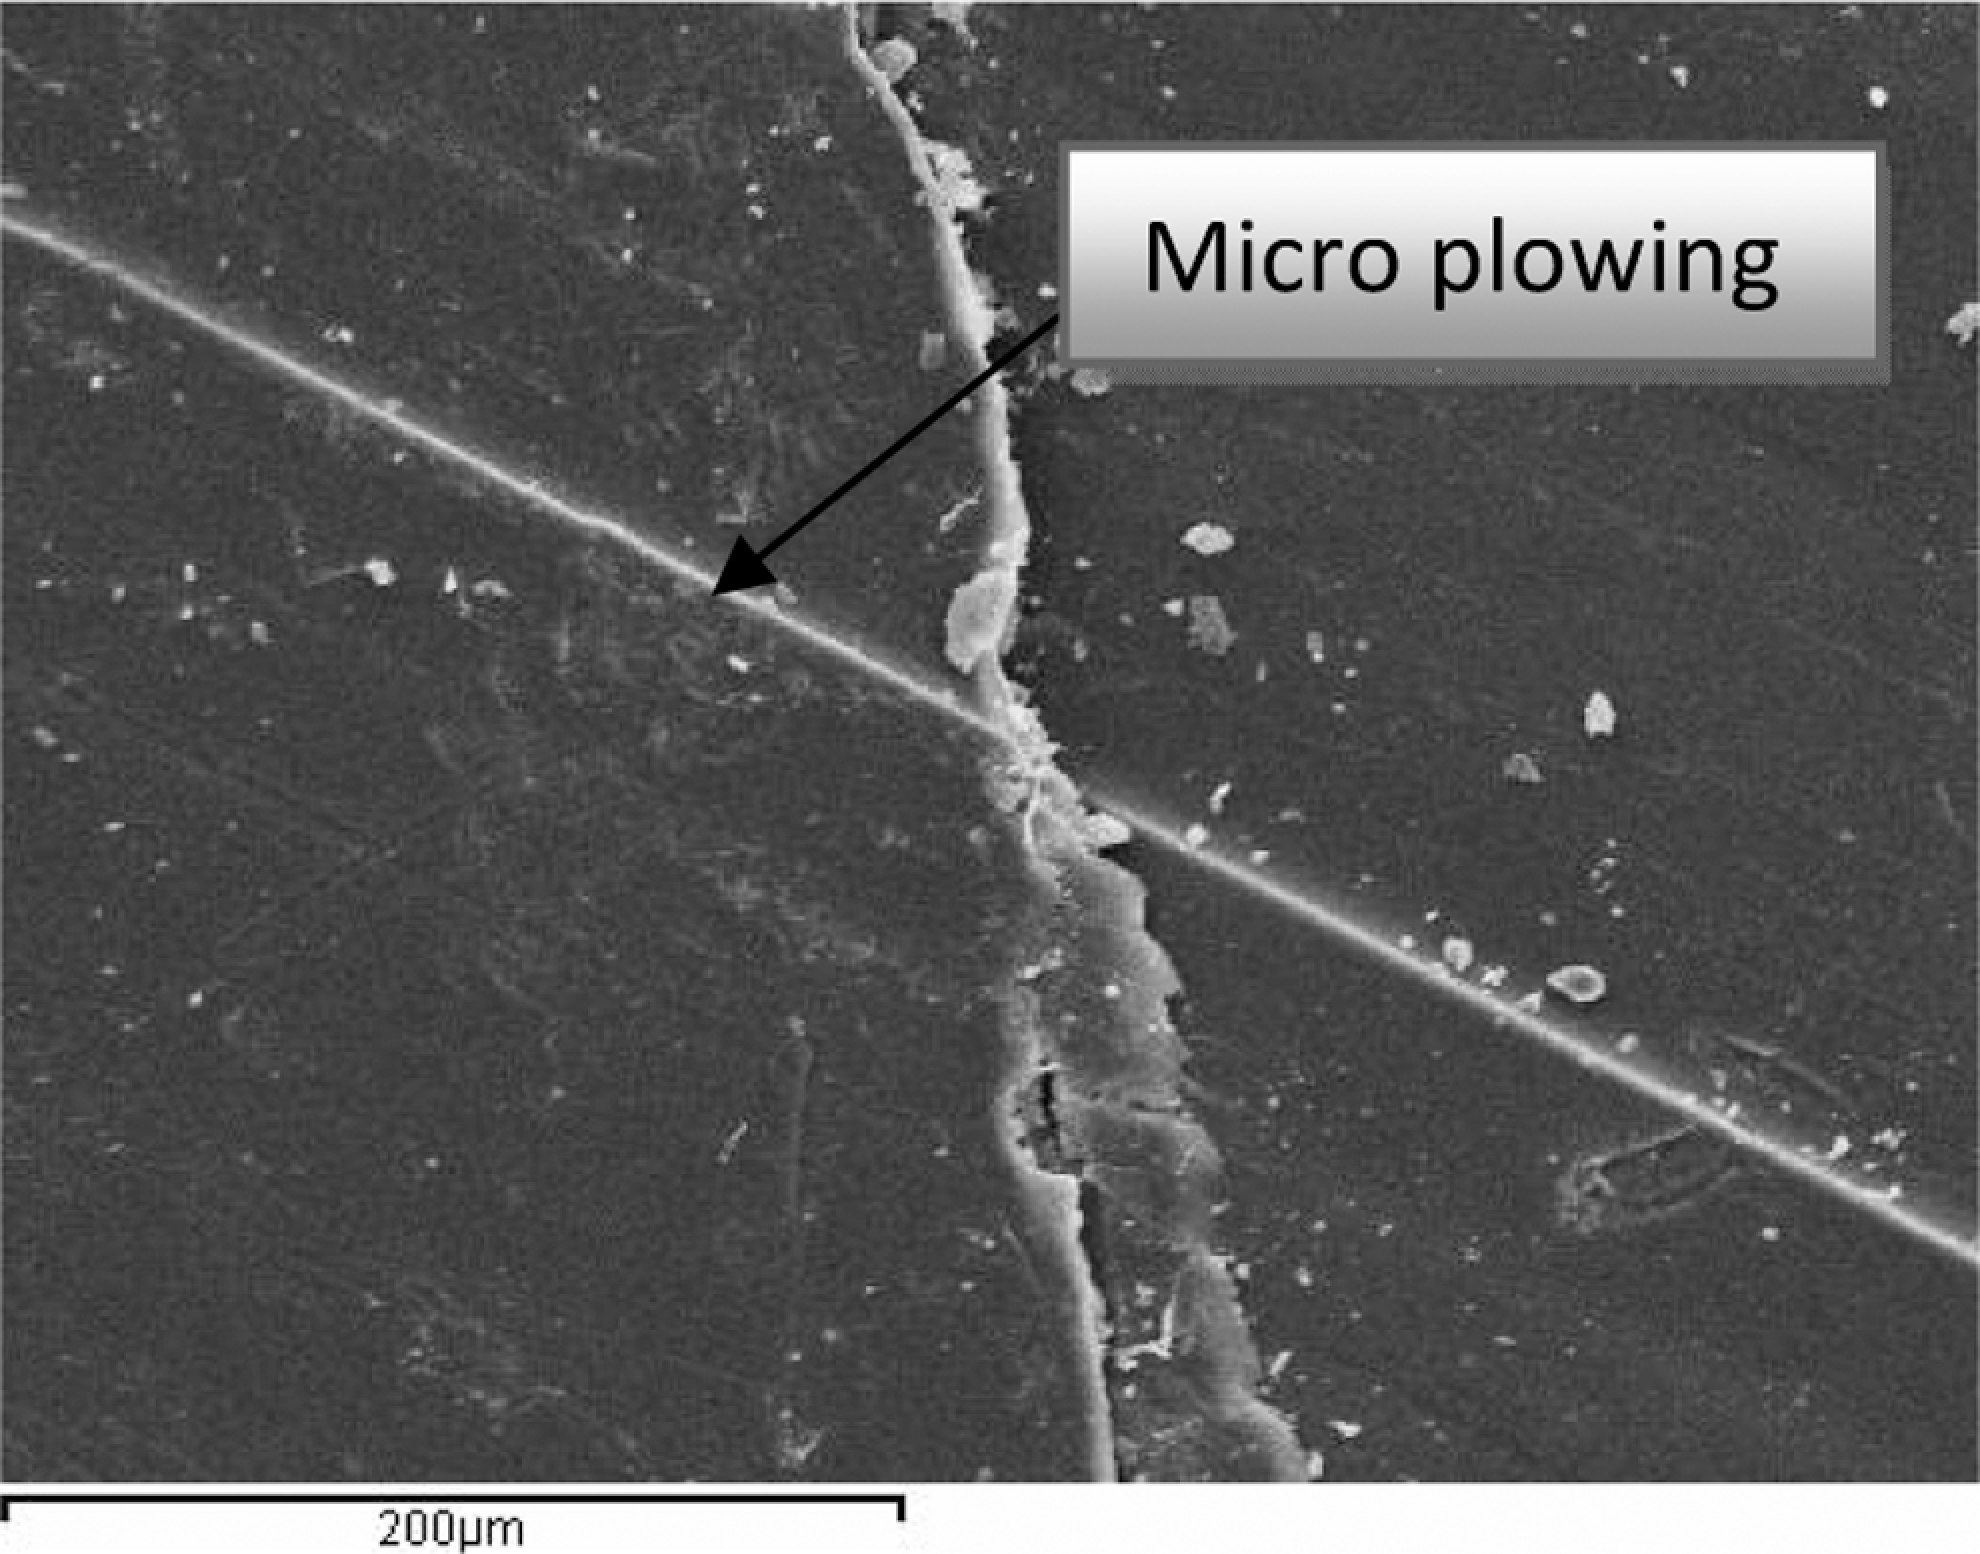
Polytetrafluroethylene (PTFE) + glass, L = 20 N, V = 6 m/s, N = 600 r/min, d = 600 m, t = 2.07 min, magnification = ×300.
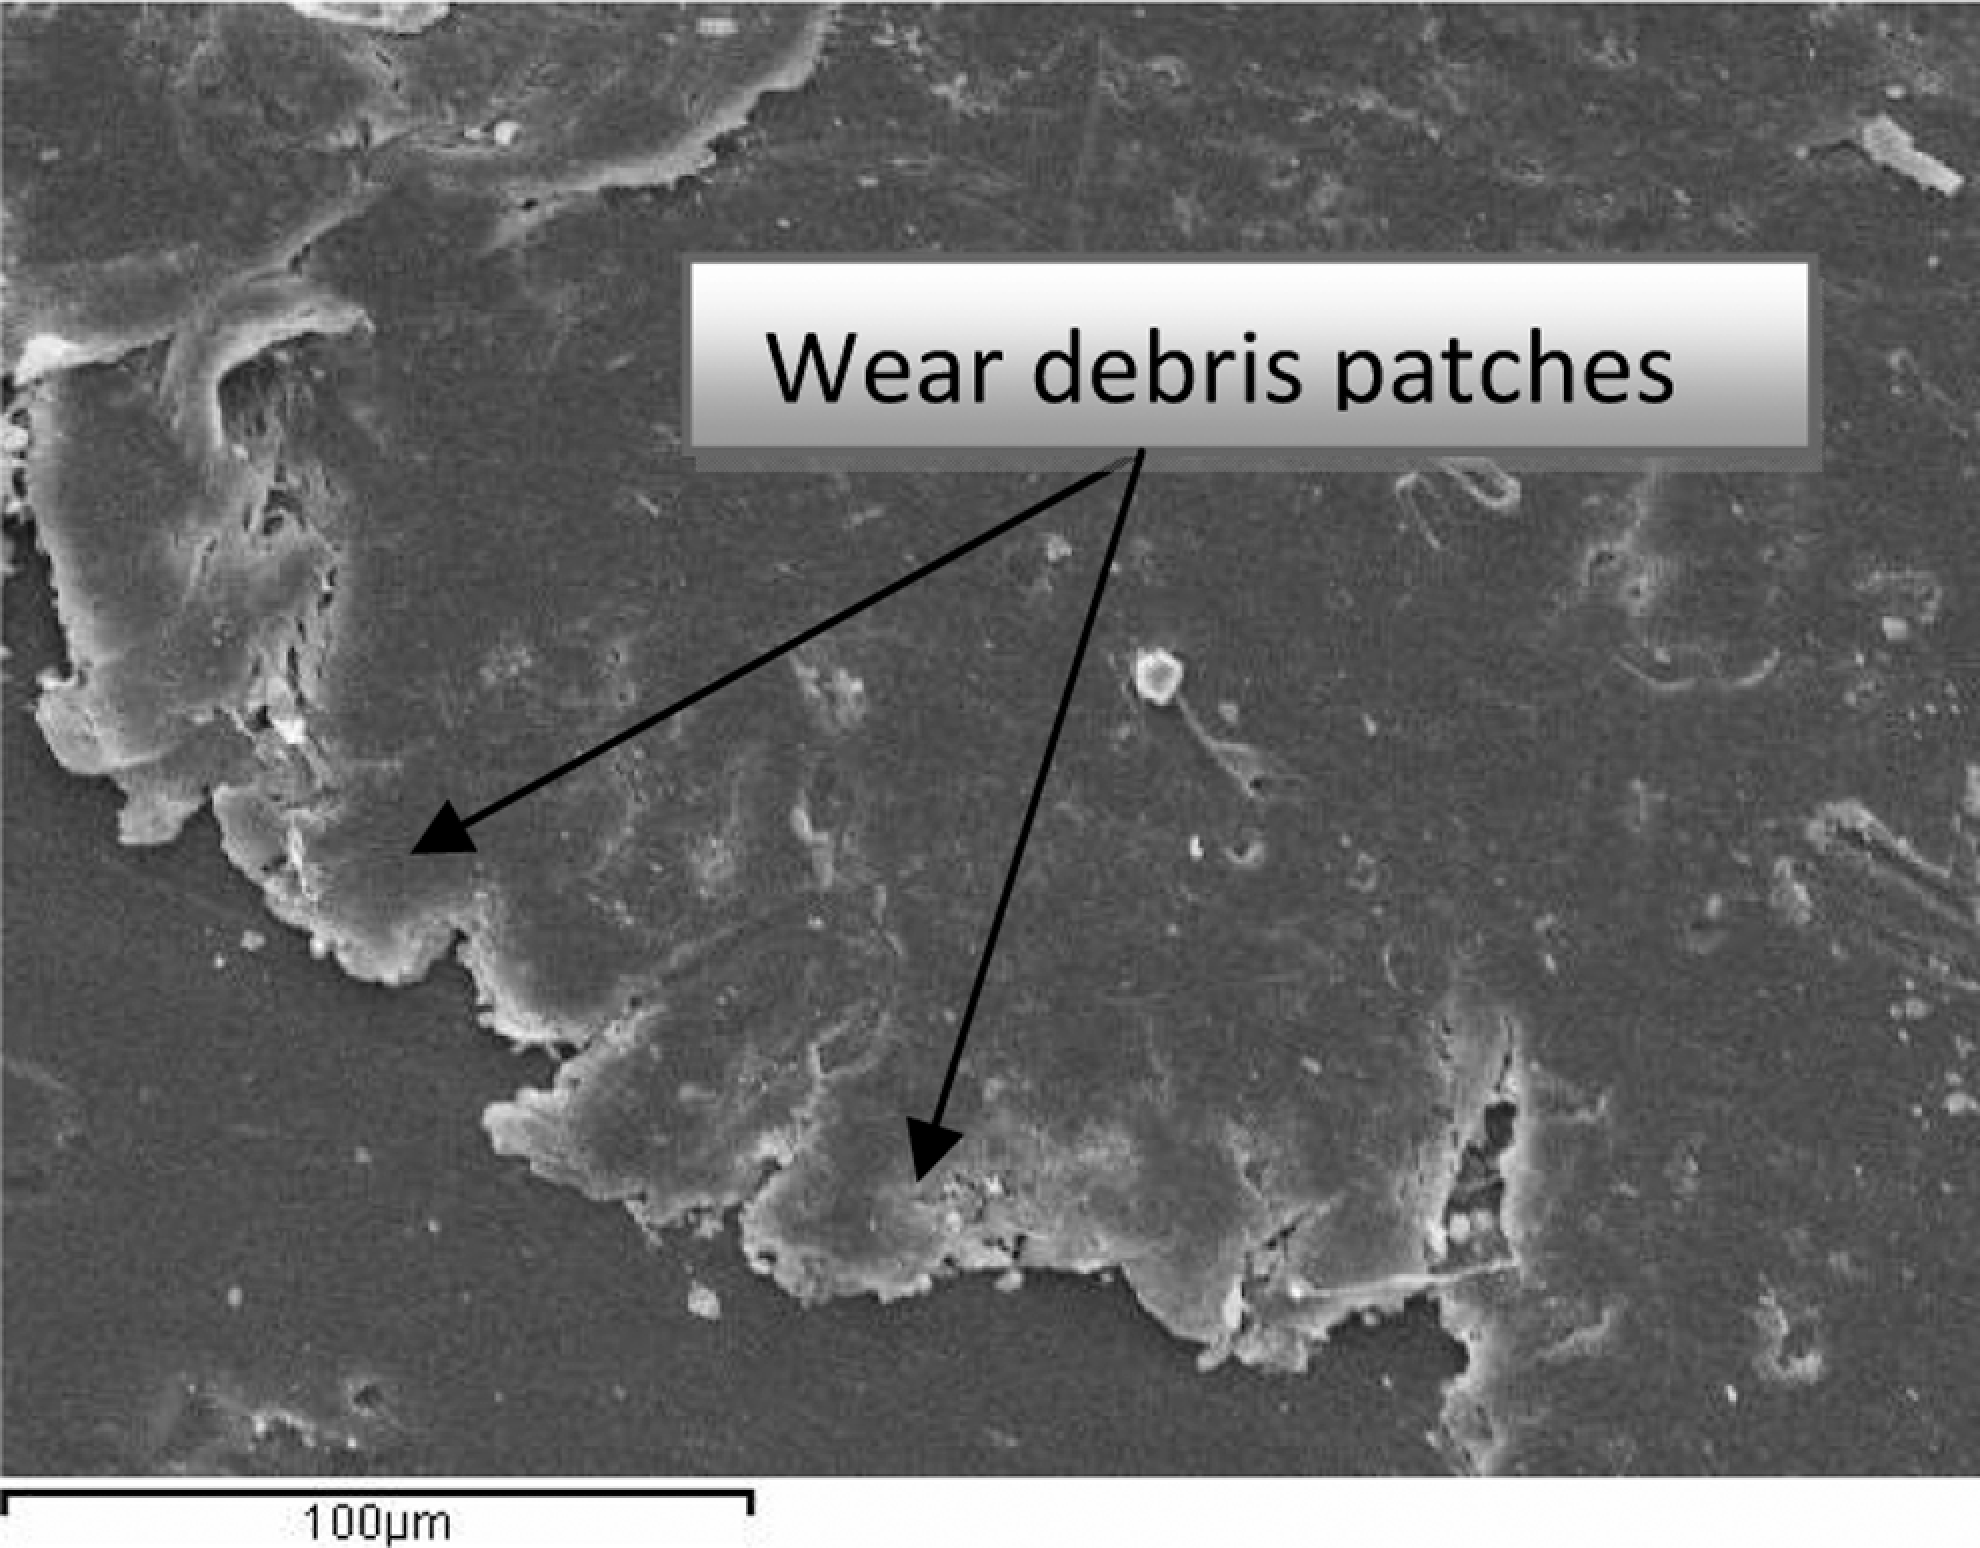
polytetrafluroethylene (PTFE) + glass, L = 20 N, V = 6 m/s, N = 600 r/min, d = 600 m, t = 2.07 min, magnification = ×500.
In the case of 25% glass-filled composites, there is a homogeneous distribution of the filler to some extent, a little amount of transfer film covered the surface and the spread of the PTFE matrix is noticed on the worn surfaces of the virgin PTFE composite. On the other hand, the increase in the load to 60 N produces a more severe effect on the wear mechanisms by micro-cracking and micro cutting as can be observed in Figures 8 and 9.
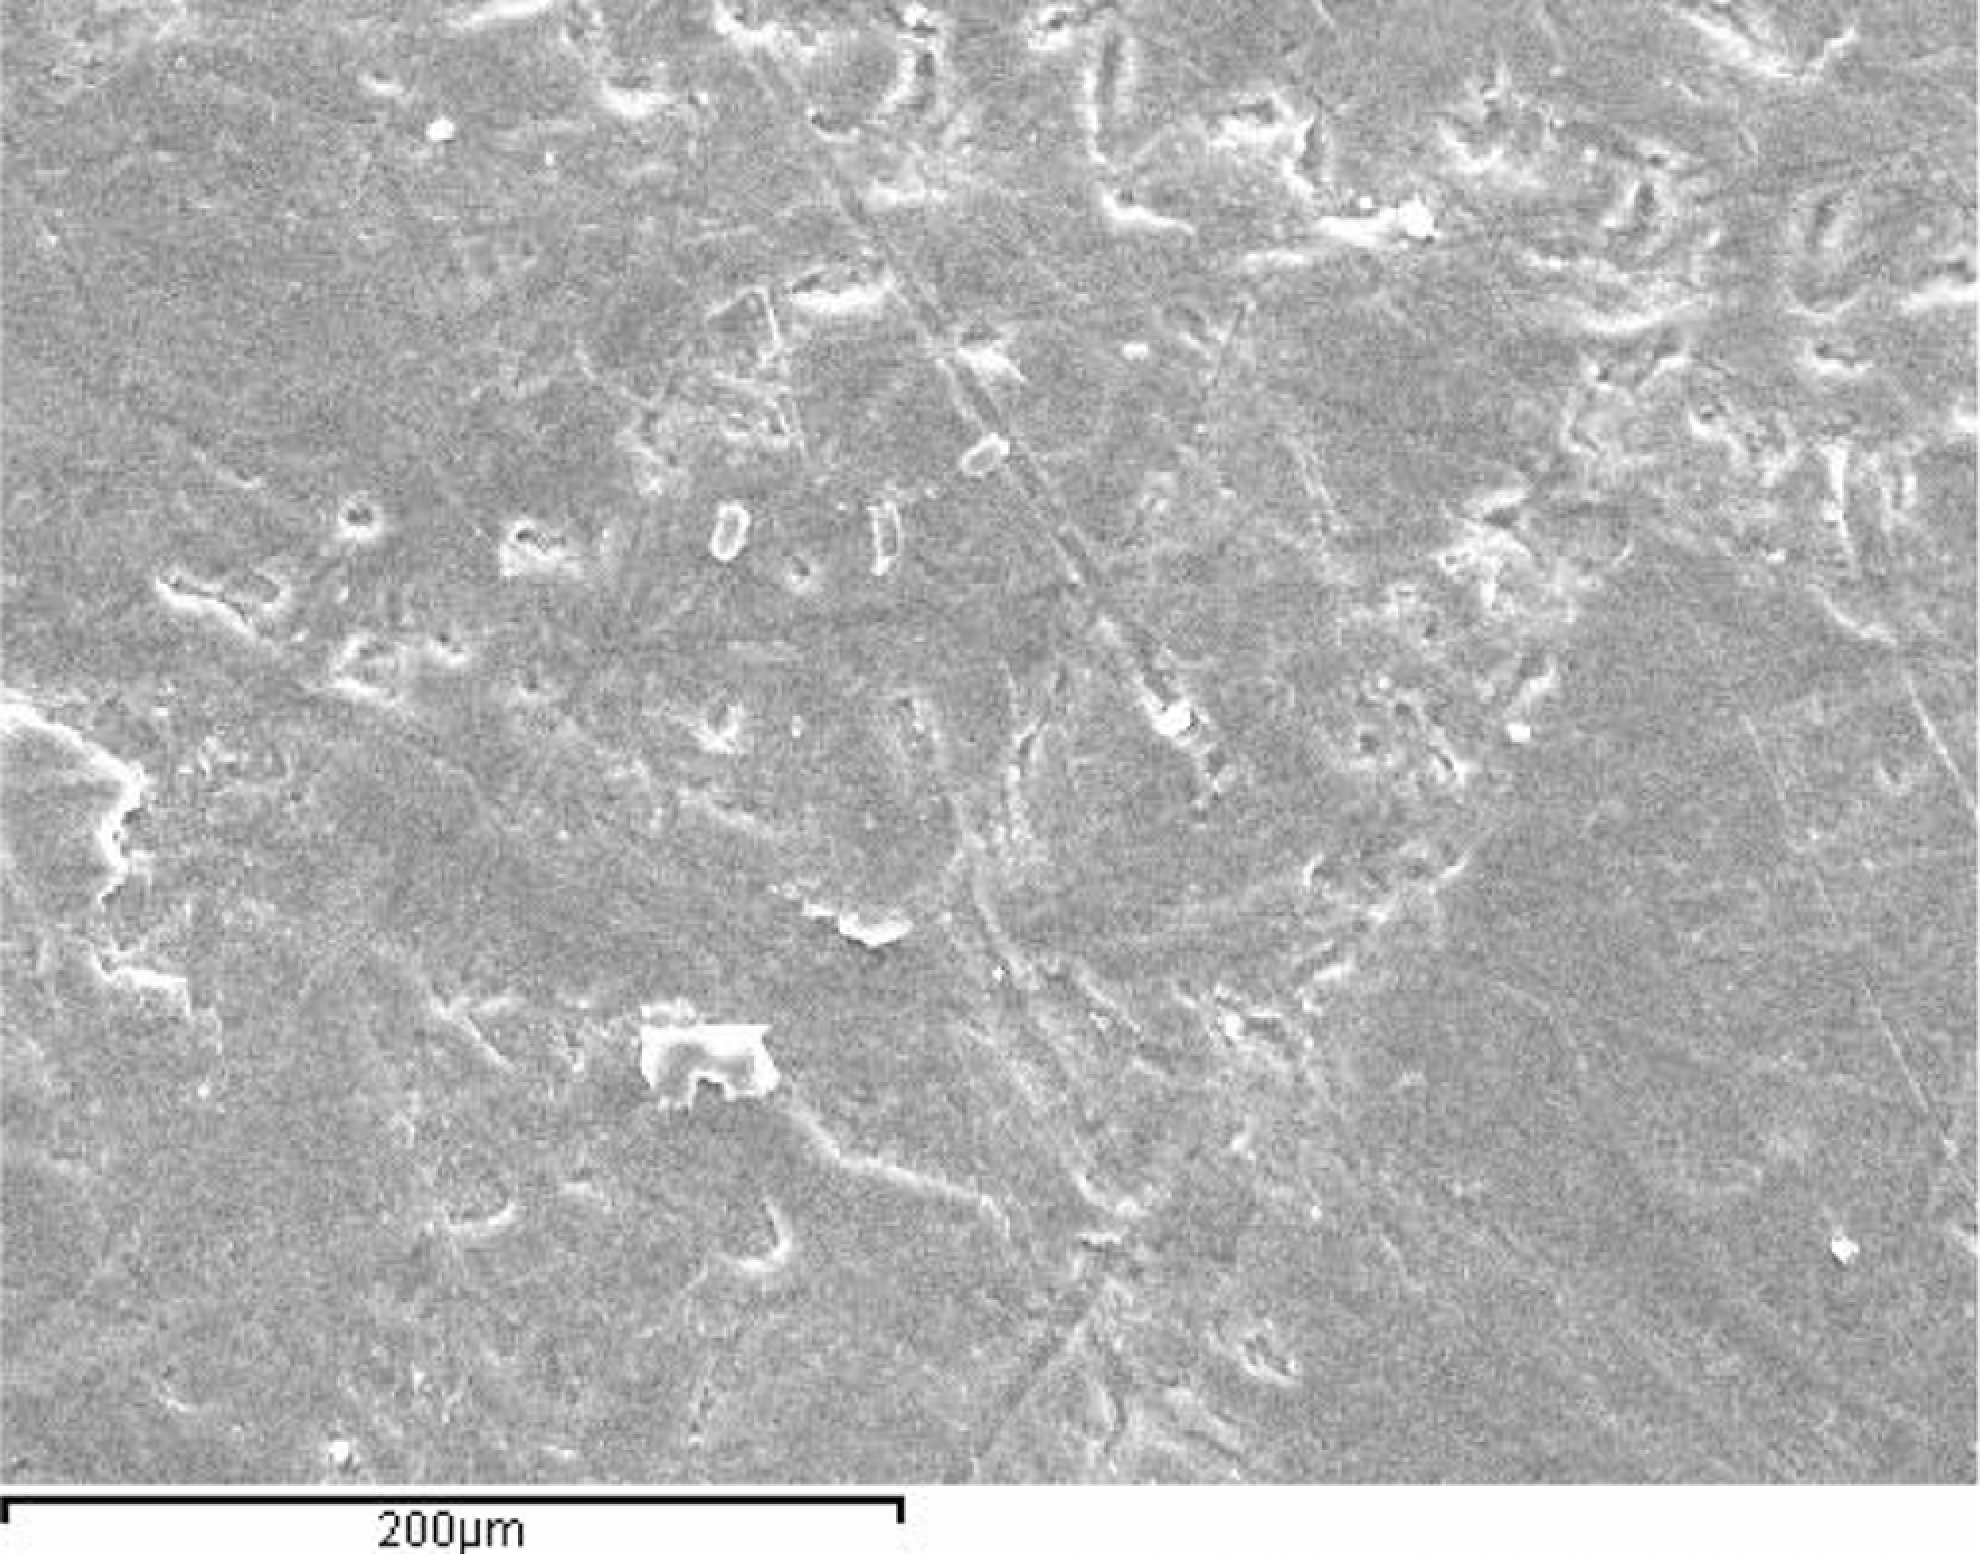
Polytetrafluroethylene (PTFE) + glass, L = 60 N, V = 6 m/s, N = 600 r/min, d = 600 m, t = 2.07 min, magnification = ×300.
Polytetrafluroethylene (PTFE) + glass, L = 60 N, V = 6 m/s, N = 600 r/min, d = 600 m, t = 2.07 min, magnification = ×500.
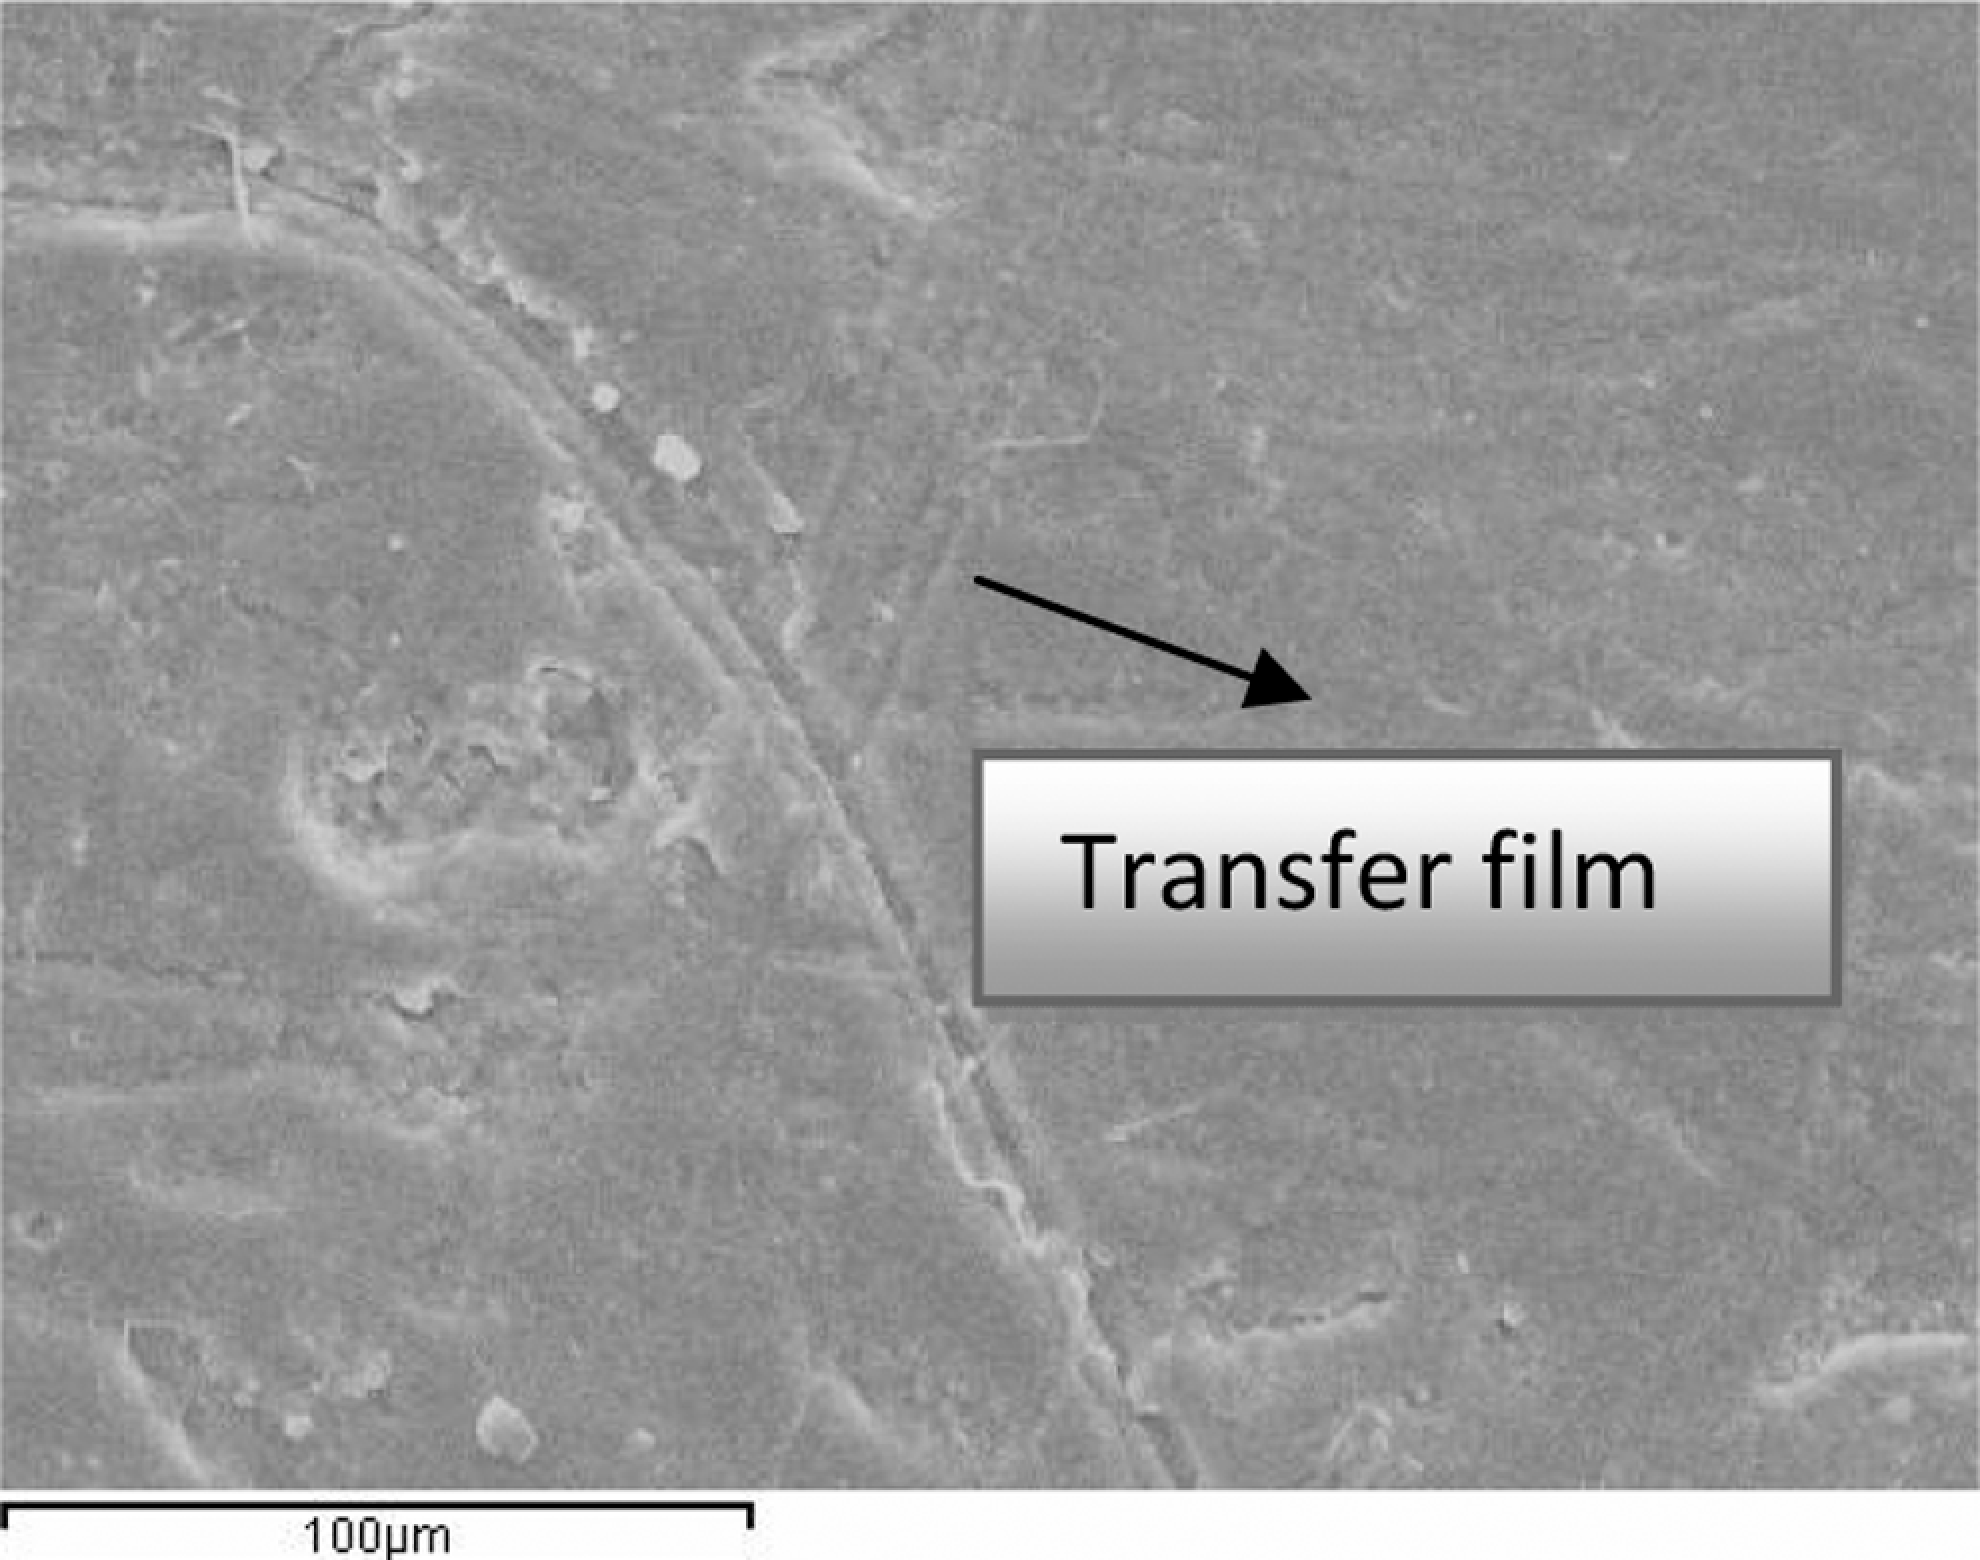
The SEM images of worn surfaces of the PTFE composites filled with 40% bronze under load conditions are shown in Figures 10 and 11. It is seen that there is an obvious tribolayer on the counterface of the PTFE composites under these loading conditions. However, the transfer films formed with the PTFE composites filled with glass and bronze particles are thinner and more uniform than those formed for the virgin PTFE composites. This reveals that fillers such as glass particle enhance the adhesion of the transfer films to the surface of the PTFE + 25% glass particle and PTFE + 40% bronze composites. Therefore, thin and uniform transfer films largely decrease the wear of the PTFE composite. It is noticed that PTFE + 40% bronze powder formed on the counterface are thinnest and most uniform. This reveals that the adhesion strength between the transfer film and the counterface is strong. The tribolayers formed on the counterpart for the PTFE composite with the virgin PTFE are easily peeled off from the surface of the counterpart in dry sliding, but the bronze-filled PTFE composites increase the formation ability of the tribolayer, and the adhesion of the tribolayer to the counterface is as shown in Figure 10. Therefore, the friction and wear properties of PTFE + 40% bronze composites are the best under these conditions.
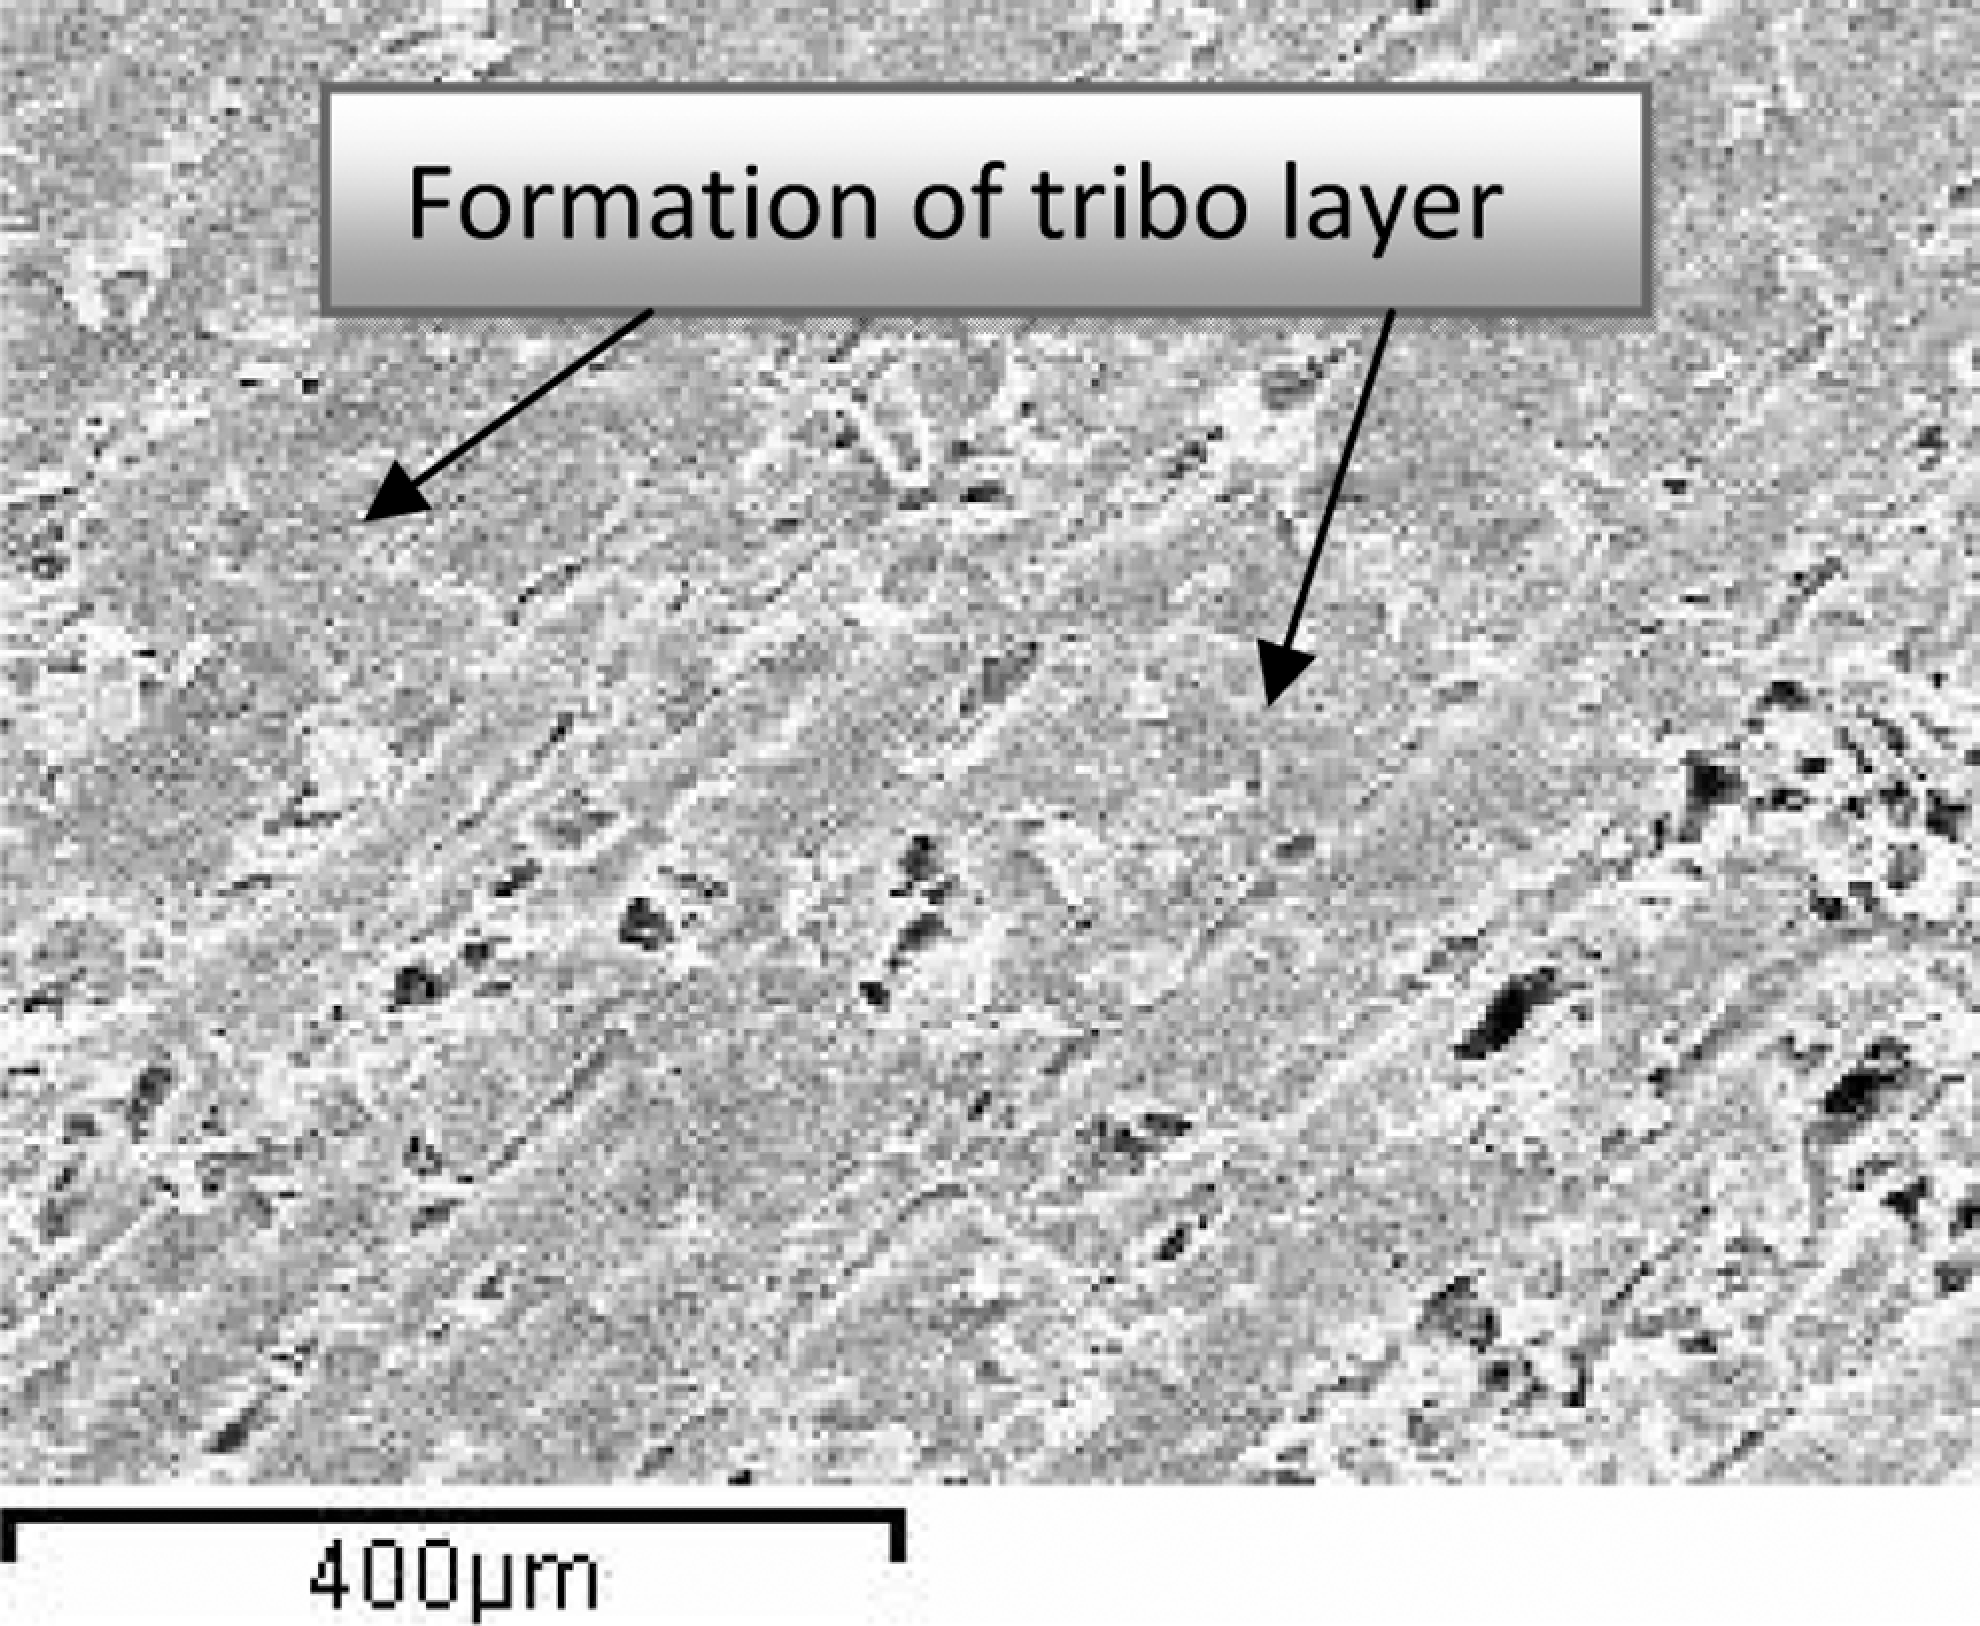
Polytetrafluroethylene (PTFE) + bronze, L = 20 N, V = 6 m/s, N = 600 r/min, d = 600 m, t = 2.07 min, magnification = ×150.
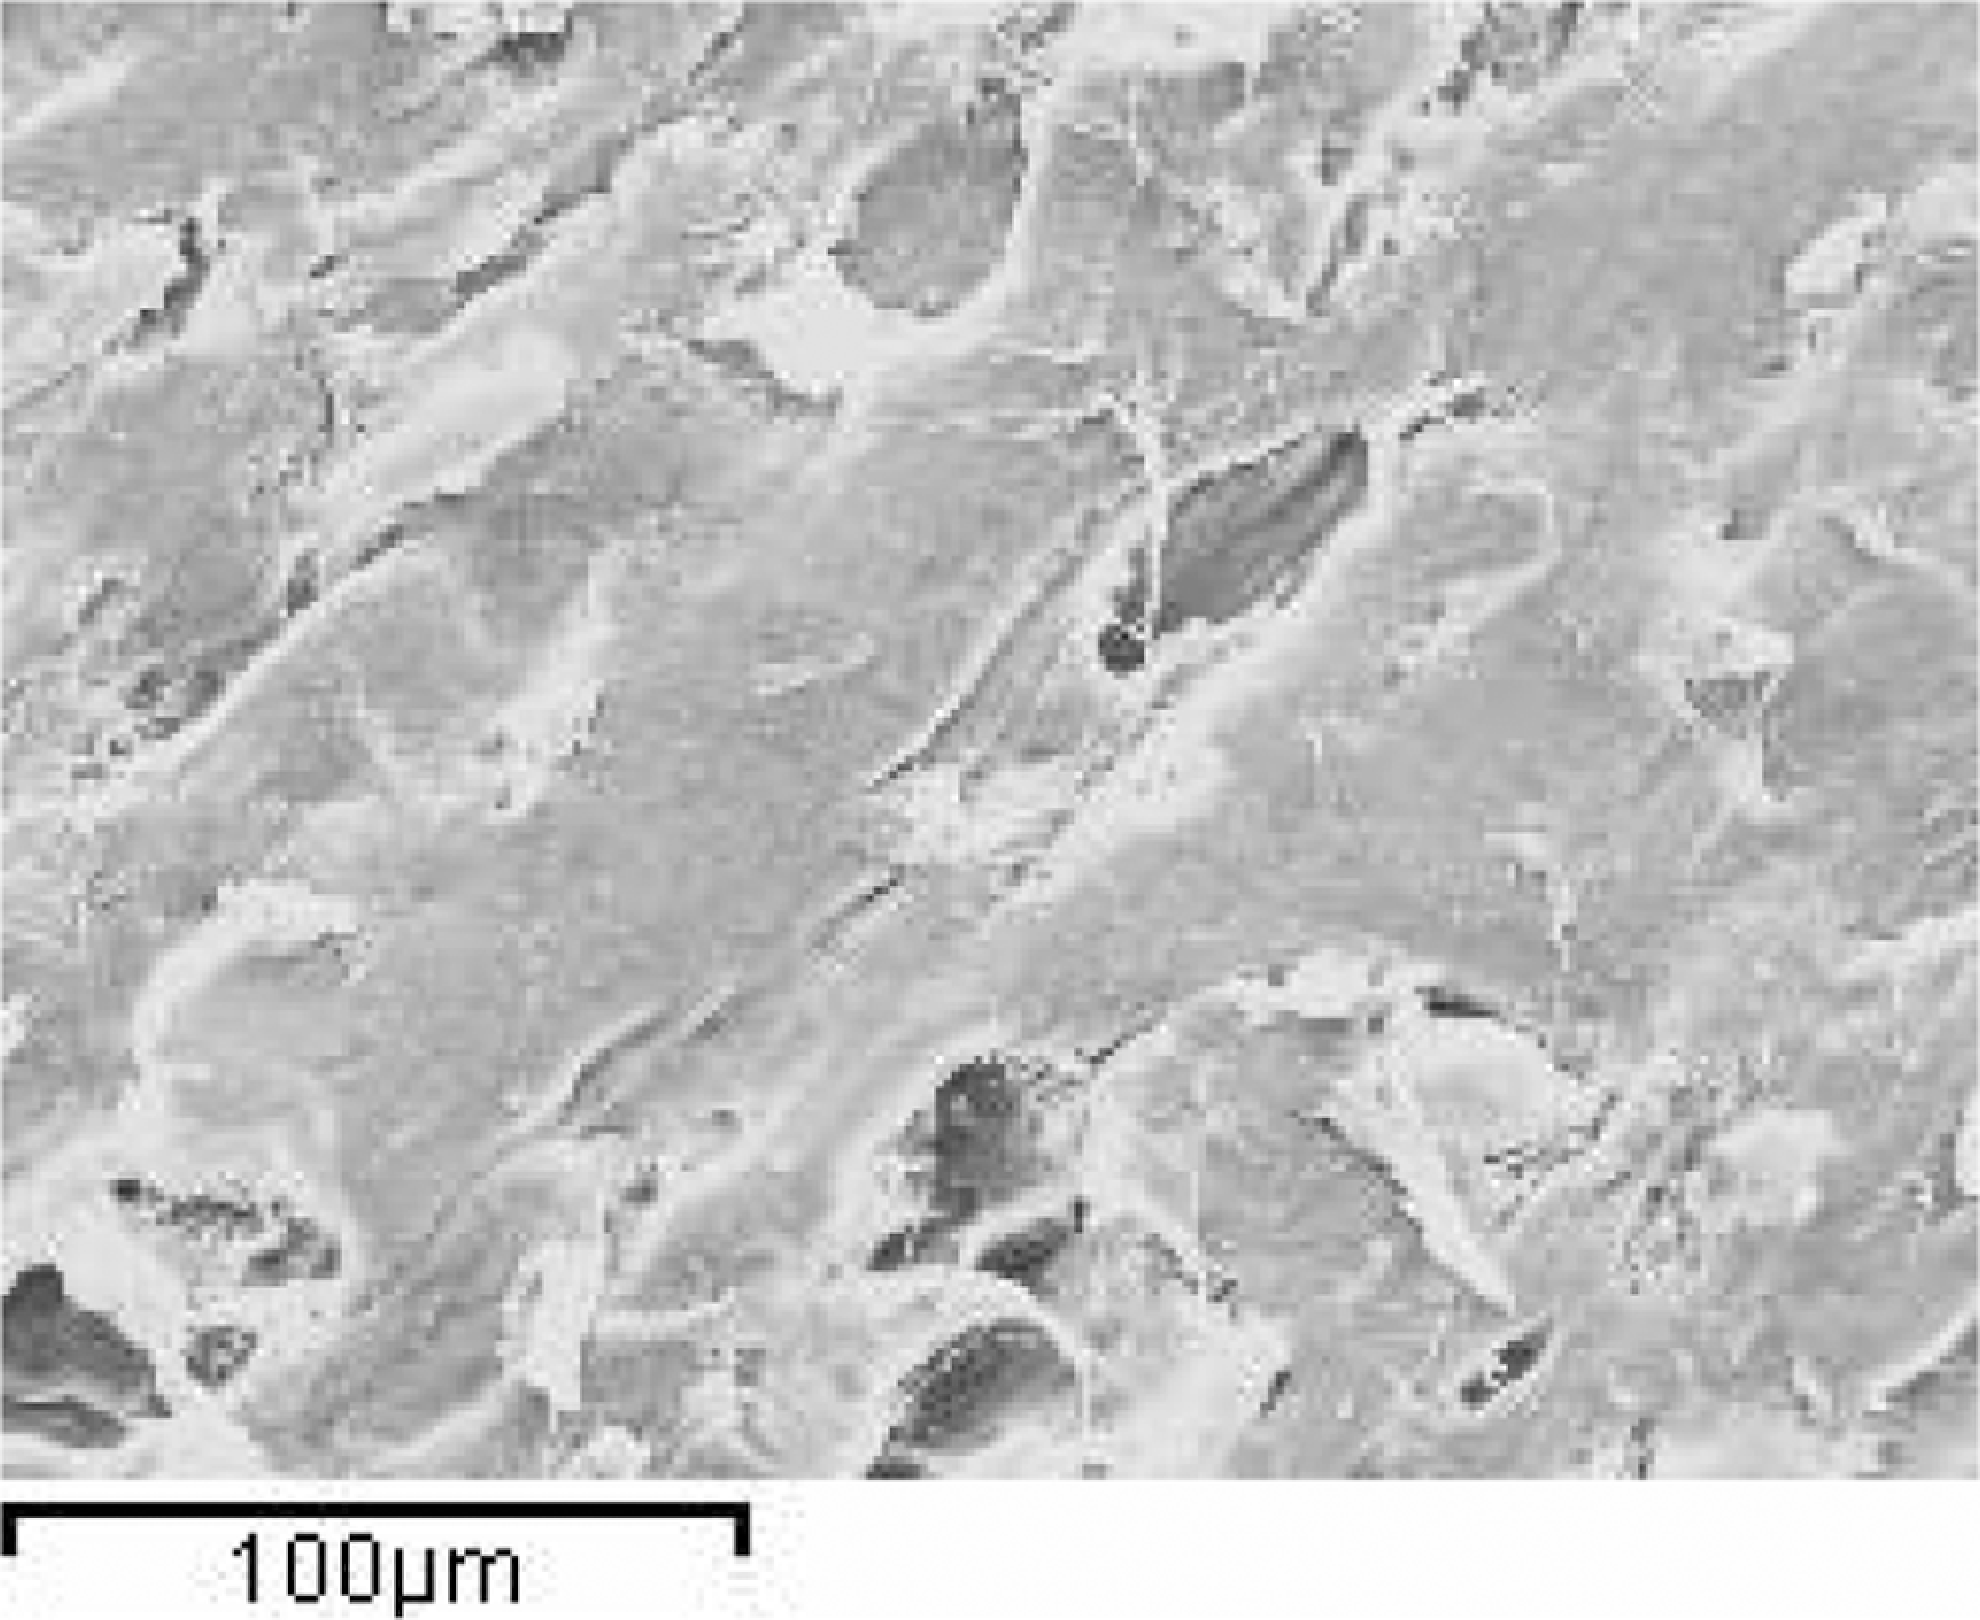
Polytetrafluroethylene (PTFE) + bronze, L = 20 N, V = 6 m/s, N = 600 r/min, d = 600 m, t = 2.07 min, magnification = ×500.
Figures 12 and 13 show the worn surfaces of PTFE + 40% bronze under the load of 60 N, there is breakage of matrix at maximum speed, more heat is generated and the formation of transfer film or tribolayers disrupt from the surface. The matrix is exposed, as can be seen in Figure 13.
The interface of the bronze with PTFE results in the formation of copper fluoride, presumably caused by the local degradation of PTFE and bronze. They do not, however, attribute to the reduction in wear accompanying the formation of copper fluoride to the chemical action, but rather to the fact that the area of contact at the interface increases with time, which reduces the interface temperature. When the load is increased to 60 N, these observations are consistent with the experimental weight loss presented earlier. A decrease in wear loss with increasing amount of filler material like 40% bronze in the PTFE composites has been reported. 17 The highest wear resistance was for PTFE with 40% bronze additive and the smallest was for pure PTFE. Thus, the present results on PTFE + 40% bronze corroborate the previous finding.
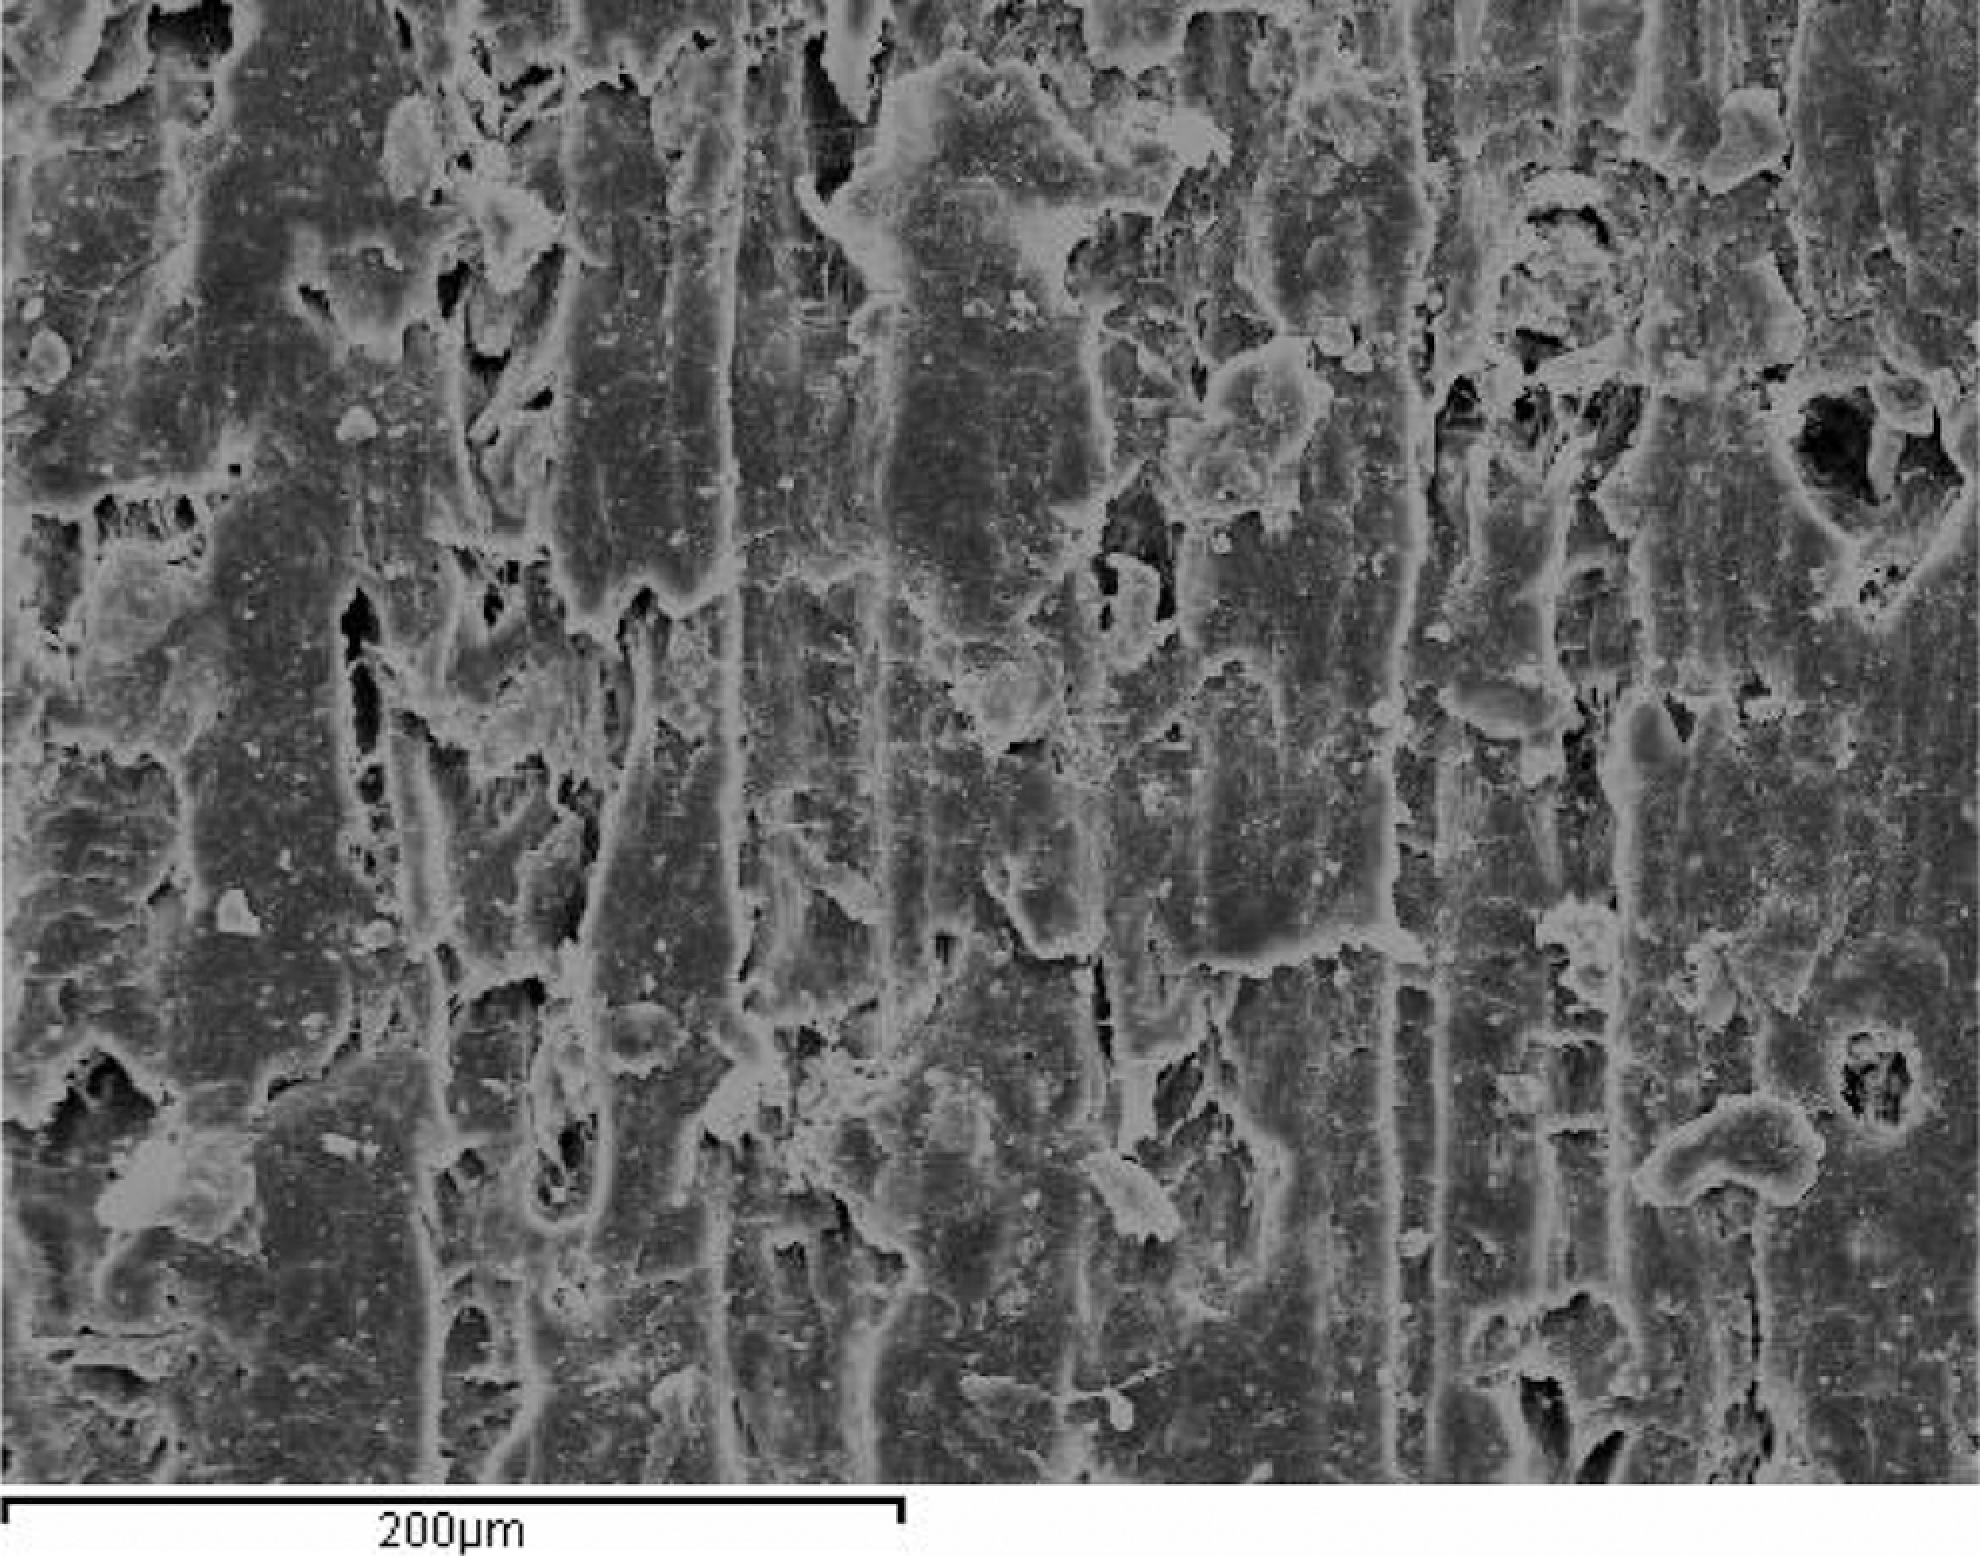
Polytetrafluroethylene (PTFE) + bronze, L = 60 N, V = 6 m/s, N = 600 r/min, d = 600 m, t = 2.07 min, magnification = ×50.
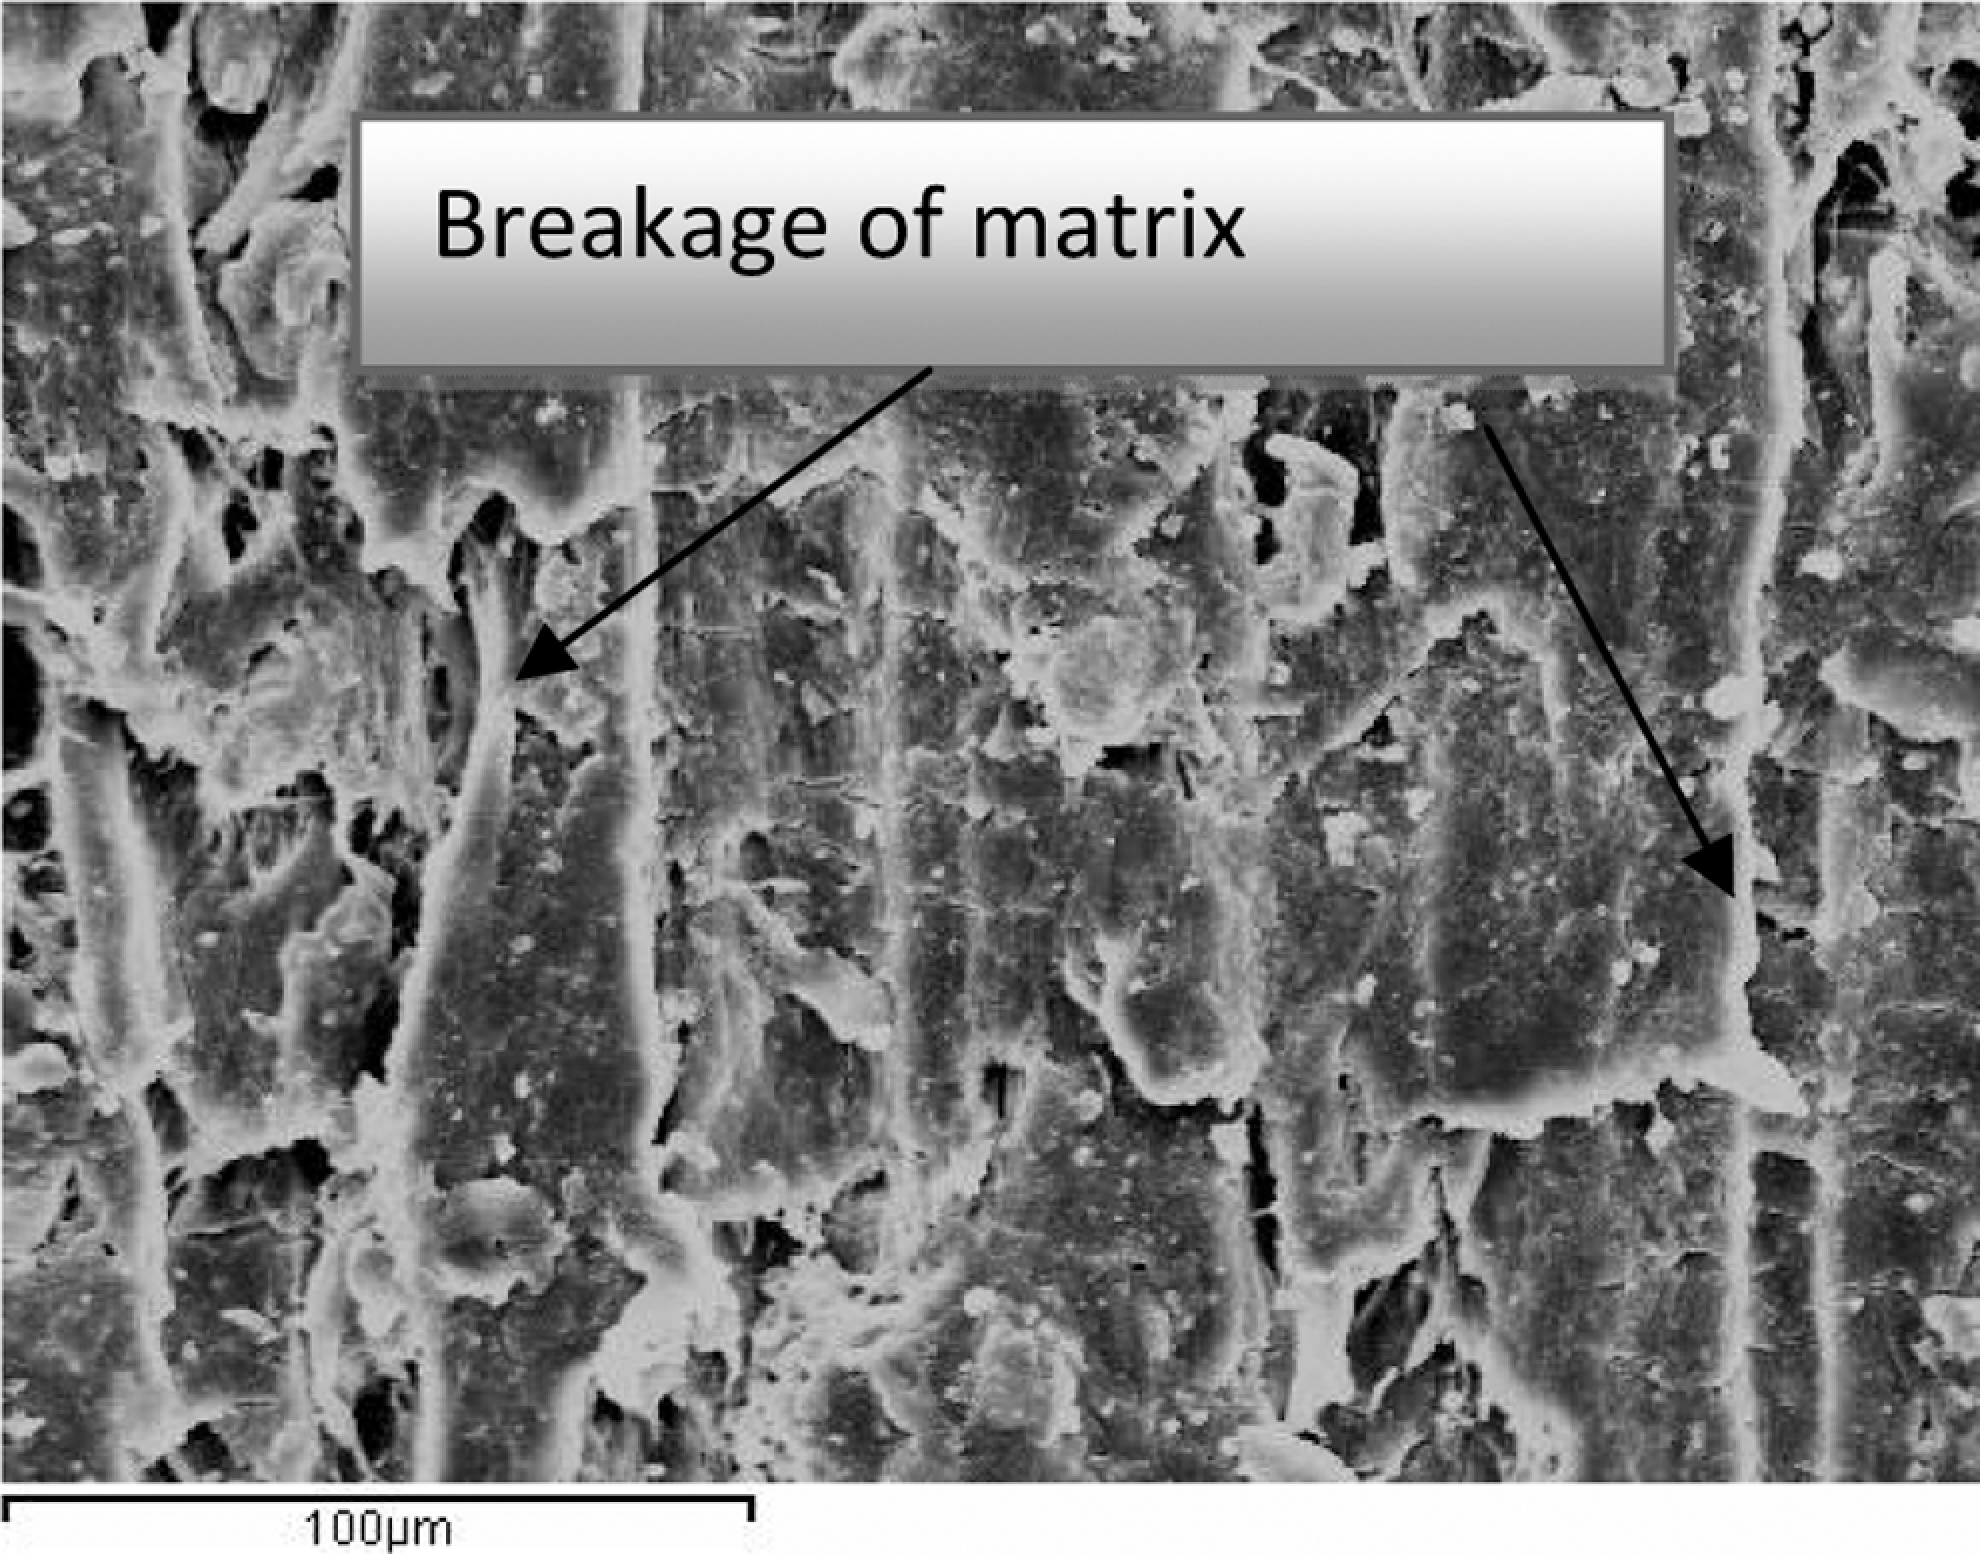
Polytetrafluroethylene (PTFE) + bronze, L = 60 N, V = 6 m/s, N = 600 r/min, d = 600 m, t = 2.07 min, magnification = ×300.
Conclusions
Based on the experimental analysis presented, the following conclusions are drawn from the dry sliding wear behavior of pure PTFE and their composites.
Addition of glass and bronze particles as fillers increases the wear resistance of the material. However, significant improvement in wear resistance is observed by the incorporation of bronze particles.
The error associated with the ANOVA Table (maximum 15.56% and minimum of 11.47%) for the factors and the coefficients of regression obtained with the multiple regression (maximum 0.926% and minimum 0.776%) shows that satisfactory correlation was obtained.
The confirmation tests showed that the error associated with pure PTFE (maximum value 19.97% and minimum 7.38%), for 25% glass particle + PTFE composites (maximum value 24.25% and minimum 8.64%) and for 40% Bronze particle + PTFE composites (maximum value 23.33% and minimum 2.44 %) are excellent.
The debris of PTFE composites is much smaller than that of the virgin PTFE.
The addition of glass and bronze particles improves the wear resistance of pure PTFE. However, drastic increment in wear resistance is observed by the addition of bronze particles.
Footnotes
Funding
This research received no specific grant from any funding agency in the public, commercial, or not-for-profit sectors.