
Abstract
Polyethylene (PE)/clay nanocomposites were prepared by melt mixing using PE grafted with maleic anhydride (PEg) as compatibilizer. Concentrations between 2 and 15 wt% of an organophilic montmorillonite (MMT) and concentration ratios of 1:1, 2:1 and 3:1 of PEg/MMT were employed. The materials were characterized using X-ray diffraction, scanning electron microscopy (SEM) and thermogravimetry. The SEM images show that the presence of PEg results in a large degree of exfoliation at all clay concentrations. For 5 wt% MMT, the best degree of exfoliation is obtained for a 2:1 ratio of PEg/MMT. This ratio results in higher increase in the elastic modulus, mainly at low frequencies, with respect to that of the corresponding matrix. As the clay concentration increases, for a 2:1 ratio of PEg/MMT, the dynamic moduli increase showing pseudo solid-like behavior at clay concentrations higher than 8 wt%. Moreover, the nanocomposites show rheological properties that are affected by annealing at 200°C signaling further exfoliation or improved platelet and tactoid distributions. The oxygen permeability of PE decreases gradually with the clay concentration, reaching a maximum reduction of ∼30% for 15 wt% MMT.
Introduction
Polyethylene (PE) is a semicrystalline polymer widely used due to its high strength, excellent processability and high chemical resistance, combined with very low cost. To further increase the range of applications, this polymer is frequently modified by physical and chemical methods. For example, nanoparticles, such as clays and carbon nanotubes, have been added to different PEs to improve the barrier properties, flame resistance and mechanical properties. 1 –3
The field of polymer nanocomposites (PNCs) has expanded rapidly in the last couple of decades. This vast interest relays in the fact that the addition of small amounts of nanofillers may produce properties equivalent to those of traditional composites. 1 –3 Different polymer–clay nanocomposites based on several thermoplastic polymers have been successfully prepared using different methods. However, since Vaia and coworkers used melt intercalation in 1993, 4 this method has become a main stream for the preparation of PNCs. This method has the advantage that it can be applied in post-reactor stages using regular processing equipment.
One of the main difficulties in the production of PNCs is the dispersion of the filler in the polymeric matrix. This step becomes even more challenging when the PNCs are based on nonpolar polyolefins and silicate fillers. 2 To facilitate the exfoliation and dispersion of the clay in the polyolefin, two actions are normally taken. One is the addition of a relatively small amount of a compatibilizer, and the other is the modification of the hydrophilic nature of the clay. In the case of PNCs based on PE, ethylene copolymers and functionalized polymers such as grafted PE are frequently used to enhance the filler–matrix compatibility. 5 –8 The modification of clay, in particular the typically used montmorillonite (MMT), is done by the exchange of small surface cations with alquil-ammonium cations. This process confers a more organophilic character to the clay and increases the interlayer spacing facilitating its future exfoliation and delamination. 1,3 The large aspect ratio structures achieved in this way has been associated with the improvement in the properties observed in many PNCs based on MMT.
Previous works have established that the blending method and types and concentrations of compatibilizer and clay are the most important factors that affect the intercalation and exfoliation process of MMT in a PE matrix. In particular, compatibilizers such as ethylene vinyl acetate copolymer, polyethylene glycol, waxes and acrylate, acrylic acid or silane grafted PEs have been used, 8 –12 PE grafted with maleic anhydride (PEg) being the most frequently used. 5,7,8,13 –29 These works based on PE/PEg/MMT have analyzed the morphological, 5,7,13 –21,24,26,28,30,31 thermal, 8,14 –17,23,25,28,30 rheological, 7,13,18,22,29 mechanical, 8,13,15 –17,20,22 –28,30,31 optical 28 and barrier 13,15,19,20,22,30,31 properties. The rheological properties are studied not only because of their importance in polymer processing but also because the rheological parameters are sensitive to the structure, size, shape and surface characteristic of the phase dispersed.
Previous works have reported that the molten PNCs with a percolated structure of clay particles and tactoids exhibit a pseudo solid-like behavior of the dynamic moduli at low frequencies and have used this behavior as an indirect measure of the extent of delamination and dispersion of the silicate layers in the polymeric matrix. 32,33 The augment of the viscoelastic parameters, mainly the elastic ones, at low frequency with the addition of clay has also been observed by several authors who have studied PE nanocomposites. 7,18,22,29 Devendra et al. 18 reported an increase in the complex viscosity and elastic modulus of nanocomposites based on an ethylene–octene plastomer by the addition of clay (2 and 4 wt% Nanomer I.44P) and PEg. For 4 wt% concentration, they observed solid-like behavior for a PEg concentration larger than 50 wt%. Durmus and coworkers 7 prepared nanocomposites based on a linear low-density polyethylene (LLDPE; 50.000 g/mol) and Cloisite 20A by melt processing using two different compatibilizers, PEg and oxidized polyethylene. In both cases, they observe improvement in the storage modulus at low frequency with an increase in clay loading. The percolation threshold is estimated at approximately 2 wt% of clay for a PE/PEg ratio of 94:6. In another study, Lotti et al. 22 used high-density polyethylene (HDPE), 5 wt% of Cloisite 20A and a HDPE grafted with maleic anhydride in a 3:1 ratio. They prepared two nanocomposites by varying the conditions in a twin-screw extruder. Both materials display intercalation and partial exfoliation of the clay although, according to the rheological study, the structures are not time stable. The composites display larger viscosity and elastic modulus than the matrices. Tang et al. 29 also studied a series of PE nanocomposites based on the PEg and clay loadings up to 8 wt%. As in the previously mentioned works, these authors observed an important increase in the viscoelastic parameters at low frequencies or shear rates, and they attribute it to the presence of anisotropic stacks of randomly oriented organoclay sheets and the formation of network structures. Moreover, they observe initial stress overshootings in steady shear, even at low shear rates, which can be eliminated by preshear, that is, by the alignment of the organoclay particles.
The presence of nanofillers also affects the barrier properties of a polymer. Nanocomposites are multiphase materials in which the coexistence of phases with different sorption and diffusion properties can cause complex transport phenomena. 1 Permeability, for example, may decrease due to the retarded diffusion of the molecules which follow more tortuous paths to bypass the plate-like nanofillers with high aspect ratio. Most of the works in the literature that study PNCs based on PE/PEg/MMT agree with the fact that the permeability of the composites is lower than that of the PE and that it decreases as the clay concentration increases. 13,15,22,34 Those works, which are based on the diffusion of oxygen, nitrogen, carbon monoxide and dioxide and water through compression molded membranes or blown films with 1–7 wt% clay concentration, observe a decrease of up to 20–50% with respect to the permeability of PE. However, it should be mentioned that in any of these works, the permeability of the composites is compared with that of the corresponding PE/PEg matrices. A study by Picard et al. found that the presence of PEg and/or MMT has no effect on the permeability of PE. 19 These authors analyzed the blown films of HDPE/PEg/MMT based on 5 wt% MMT modified with different quaternary ammonium salts and 4:1 PEg/MMT ratio. Additionally, Zhong et al. 20 observed an important increase in the permeability of PE by the addition of 5 wt% of PEg but practically no change with the further addition of 5 wt% of clay.
In the present work, we study the thermorheological behavior and permeability of PNCs based on PE/PEg/MMT as a function of clay and PEg concentrations. The structure of the composites is also analyzed using scanning electron microscopy (SEM), infrared spectroscopy, X-ray diffraction, differential scanning calorimetry and thermogravimetry.
Experimental
Materials
The commercial polymer used in this study is a high-density PE from Dow-Polisur S.A. (Bahía Blanca, Argentina) (M w = 65,000 g/mol and M w/M n = 2.8). The PEg (M w = 72,000 g/mol and M w/M n = 2.8) was obtained in the laboratory by grafting maleic anhydride onto the PE by reactive extrusion using 2,5-dimethyl-2,5-di(tert-butylperoxy)-hexane as an initiator. The grafting reaction was carried out in a twin-screw extruder (Goëttfert) operated at 200°C and 20 r/min. The obtained material was dissolved in hot xylene and precipitated in methyl ethyl ketone to eliminate the secondary reaction products and free maleic anhydride. According to infrared analysis (Fourier transform infrared (FTIR)), 0.17 wt% of maleic anhydride was grafted onto the PE. The clay used as reinforcement is a commercial MMT modified with dimethyl dihydrogenated tallow ammonium halide (Nanomer I.44P from Nanocor (Illinois, USA)). This clay has particle size in the range 15–25 μm, a modifier concentration of 1.04 mEq/g of inorganic clay with surface coverage of about 70%, a decomposition temperature of 200°C and 2.6 nm of interlayer spacing, d 001. 33,35
The composites were obtained by melt mixing the polymers with the clay during 20 min in a Brabender Plastograph at a nominal temperature of 160°C under nitrogen atmosphere. Fifty grams of the mixture was prepared per batch using cam blades rotating at 40 r/min. Both the polymers and the clay were dried under vacuum at 100°C before mixing. The materials were removed from the mixer chamber with a spatula and compressed rapidly between aluminum plates to obtain 1- to 3-mm-thick specimens. Concentrations of clay in the range 2–15 wt% are considered with a 2:1 relation of PEg/MMT. Composites with a constant 5 wt% clay concentration and 1:1, 2:1 and 3:1 of PEg:clay ratios are also analyzed (see Table 1). The code used to identify the materials is PEN#-xy, where # corresponds to the concentration of clay and xy to the relation of PEg (x) to clay (y) weight. For simplification, the code PEN# is used to identify composites prepared with a 2:1 relation of PEg/MMT.
Composition of the studied materials and remaining weights after degradation.
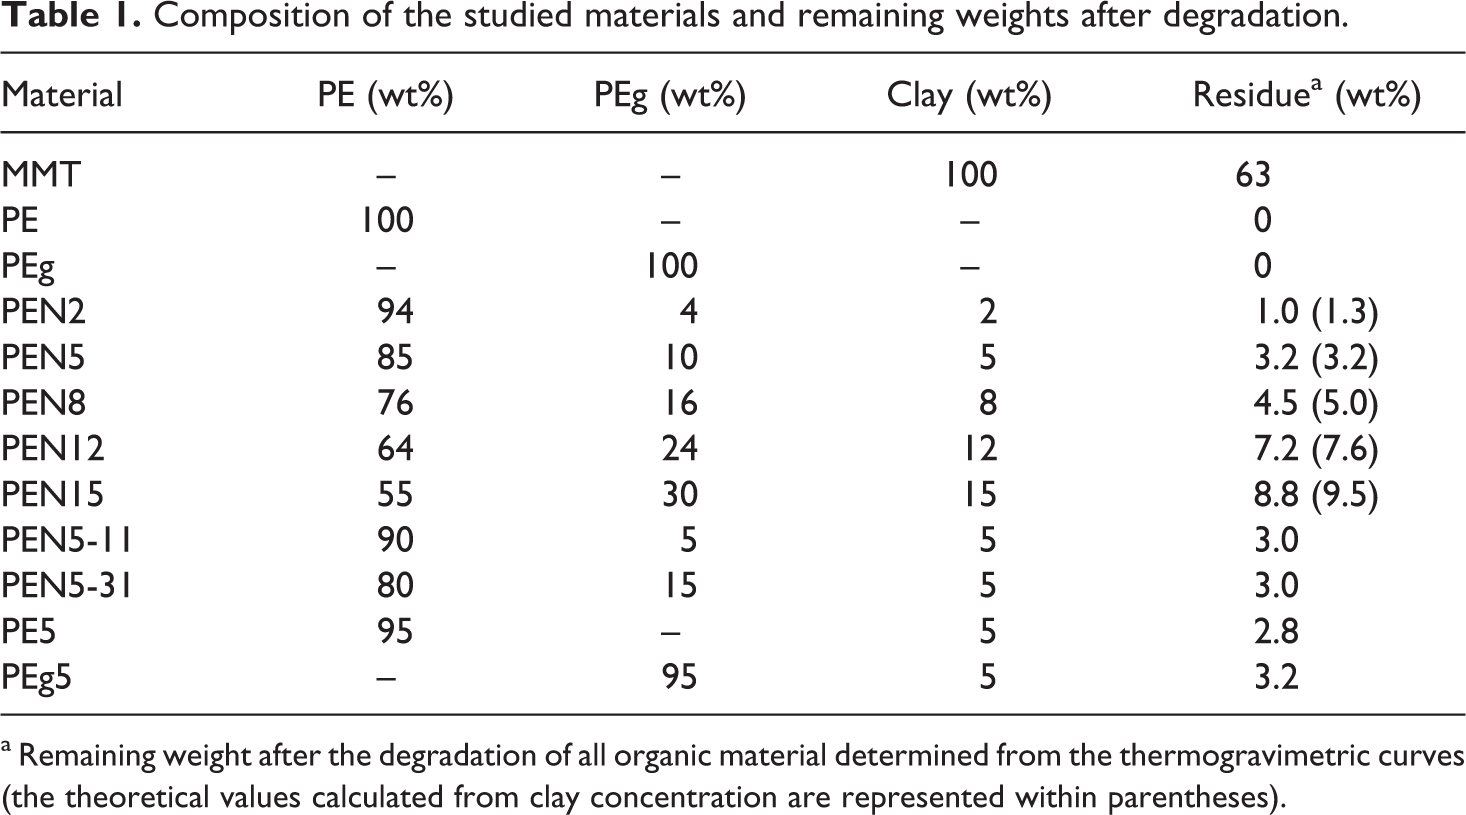
a Remaining weight after the degradation of all organic material determined from the thermogravimetric curves (the theoretical values calculated from clay concentration are represented within parentheses).
Characterization
X-ray diffraction (XRD) was used to analyze the structure of the materials and to determine the clay interlaminar spacing. The study was done using a Phillips PW1710 X-ray diffractometer (Philips Corp., USA) equipped with a Cu Ka radiation source of wavelength 1.54 Å operated at 45 kV and 30 mA. The diffraction spectra were recorded in the reflection mode over a 2θ range of 2–45° in steps of 0.035° using a rate of 4°/min. The clay and the composites were characterized with this technique. To complete the structural characterization of the materials, the morphologies of the nanocomposites were observed by SEM using a LEO EVO-40 XVP (LEO Microscopy Group, Germany) equipment.
The dynamic moduli of polymers and composites were measured using Reometrics RDAII rheometer using small amplitude oscillatory shear flow between parallel plates under nitrogen atmosphere. The elastic (G′) and the viscous (G′′) moduli were measured at 150°C in a frequency range between 0.04 and 400 s−1. The samples used in the rheological characterization were disks of 25 mm in diameter cut from the polymeric pieces obtained after the melt mixing process. Dynamic strain sweeps were also performed on each sample to determine the strain range of linear response of each material.
The oxygen permeability coefficient was measured using a MOCON Ox-Tran 2/21 according to the ASTM standard D3985, using an exposed film area of 5 cm2. The tests were performed at 23°C and 0% of relative humidity using the oxygen flow at 1 atm. The films, which were prepared by compression molding at 160°C, have the thickness in the range of 100–150 μm. These values were measured using a micrometer Mahr Millimar C 1208 (Mahr GmbH-Göttingen, Germany) and an inductive probe with an accuracy of 99.7%. The thickness variation among the specimens of a given material was no larger than 10 μm. Each permeability data presented in the article corresponds to the average of at least four measurements. The morphologies of the films were also observed by SEM.
Differential scanning calorimetry was used to determine the fusion endotherms of all materials to calculate the corresponding heat of fusion and melting temperature. The equipment, a Perkin-Elmer (USA) Pyris I system, was operated at the temperature 30–170°C, at a rate of 10°C/min, under nitrogen atmosphere.
Thermogravimetric analysis (TGA) was performed using a TGS-2 (Perkin Elmer Instrument, USA). Samples taken from the films used in the permeability study were heated from room temperature to 700°C at a rate of 10°C/min using nitrogen atmosphere. In this way, the decomposition behavior of the composites as well as that of the clay and the polymers was recorded.
Results and discussion
Figure 1 displays the thermogravimetric curves up to a temperature of 500°C. The dried MMT displays two stages of weight loss, one starting at approximately 200°C associated with the degradation of the organic material and another, not shown in the figure, above approximately 500°C produced by the dehydroxylation of the aluminosilicates. 2,35,36 As it can be observed in Figure 1, the degradation of the polymers begins at approximately 390°C. The addition of clay reduces the value of the temperature at which the degradation begins. This temperature decreases gradually as the clay concentration increases approaching the degradation temperature of the organic material in the MMT. Furthermore, it is interesting to notice that the weight lost at the end of this initial stage of degradation practically coincides with the theoretical amount of organic material in the clay (i.e. 0.7, 1.8, 3, 4.4 and 5.5 wt% of the composites for 2–15 wt% of clay, respectively). This result and the superposition of the curves after this initial stage of degradation (above 400°C) suggest that all the organic material in the clay degrades before the polymer and that there is no noticeable effect due to the presence of the clay on the thermal stability of the polymers.
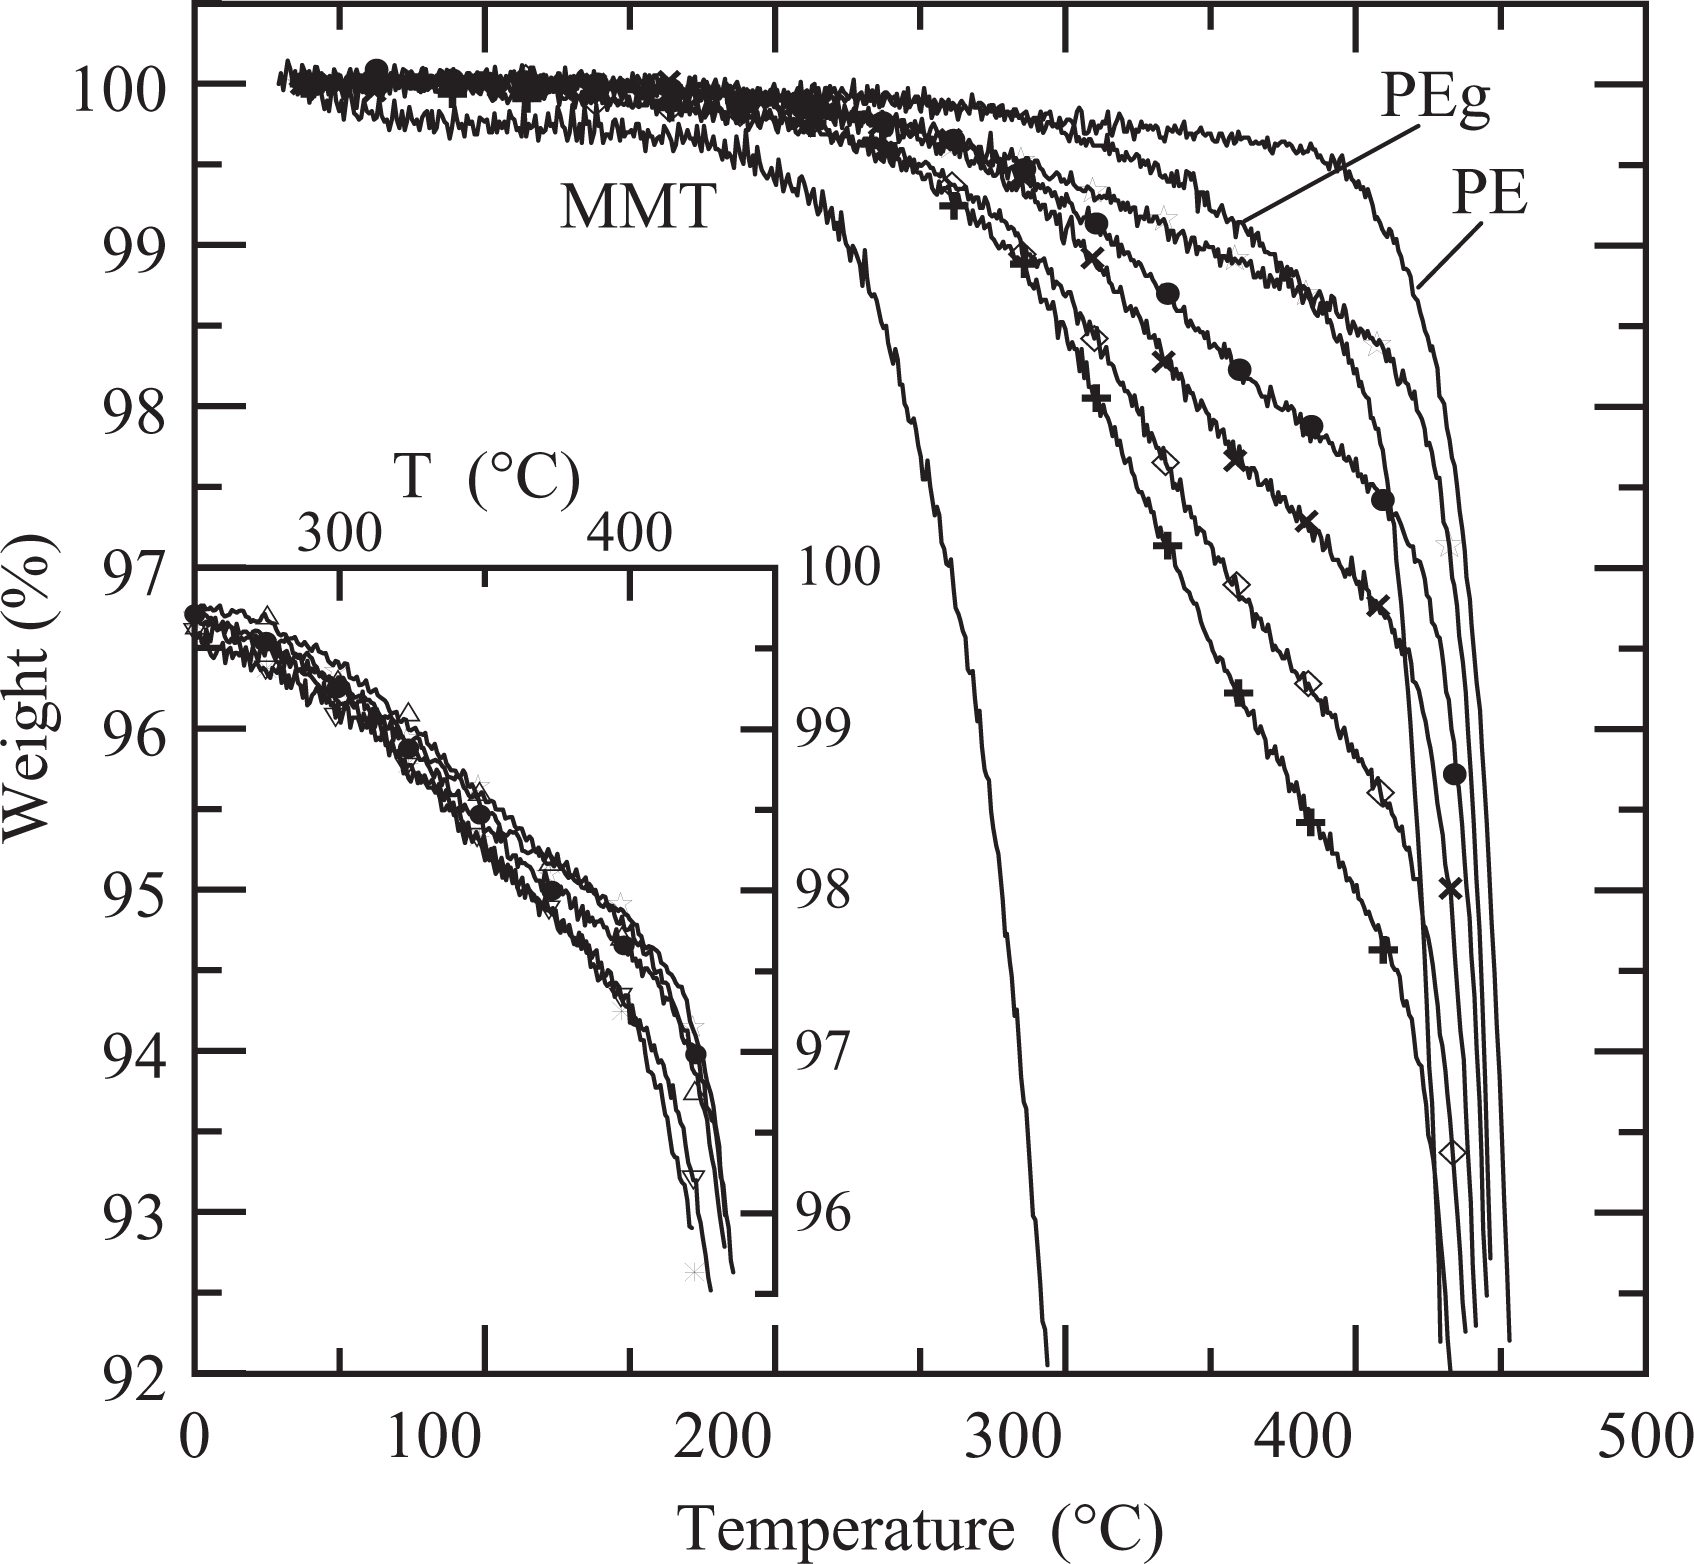
Thermogravimetric analysis (TGA) curves of clay, polymers and composites PEN2 (☐), PEN5 (•), PEN8 (×), PEN12 (⋄) and PEN15 (+). Inset: composites PE5 (Δ), PEg5 (▽), PEN5 (^), PEN5-11 (⋆) and PEN5-31 (*). PEg: polyethylene grafted with maleic anhydride.
With respect to the composites prepared with 5 wt% of clay, that is, PE5, PEg5, PEN5-11, PEN5 and PEN5-31, they all have very similar degradation behavior (see inset in Figure 1). Consequently, the thermogravimetric results indicate that practically no degradation is expected to occur during processing or rheological characterization of the materials, since they are performed at 15–200°C. Table 1 displays the value of the residual weight percentage calculated from the thermogravimetric curves above 500°C, after the organic material has been removed. The remaining 63 wt% in the case of the MMT indicates that 37% of the weight corresponds to the organic modifier. 35 The residual weights of the composites increase as the concentration of clay increases, and they are very similar to the nominal ones that can be calculated from the concentration of clay used to prepare the mixtures (reported within parentheses).
The XRD patterns of the original clay and the PENs containing different amounts of clay and a constant PEg/MMT ratio of 2:1 are displayed in Figure 2. The diffractograms of the composites prepared with 5 wt% of clay and 3 different PEg/clay ratios are included in the figure inset. The composite specimens employed to obtain the diffractograms are the films used to measure oxygen permeability. According to the results displayed in the inset of Figure 2, the characteristic peak of the (0 0 1) plane of the MMT, which appears at 2θ of approximately 3.3 practically showed no change in its position with the addition of PEg, when 5 wt% of clay concentration is used. However, the composite prepared with 10 wt% of PEg is the one with the lowest intensity of that peak. Based on this result, and those from the rheological and SEM characterization that will be discussed later, it was concluded that the 2:1 ratio of PEg/MMT produces the largest degree of delamination. Thus, the 2:1 ratio was the one selected to use in the preparation of the series of composites with different clay concentrations.
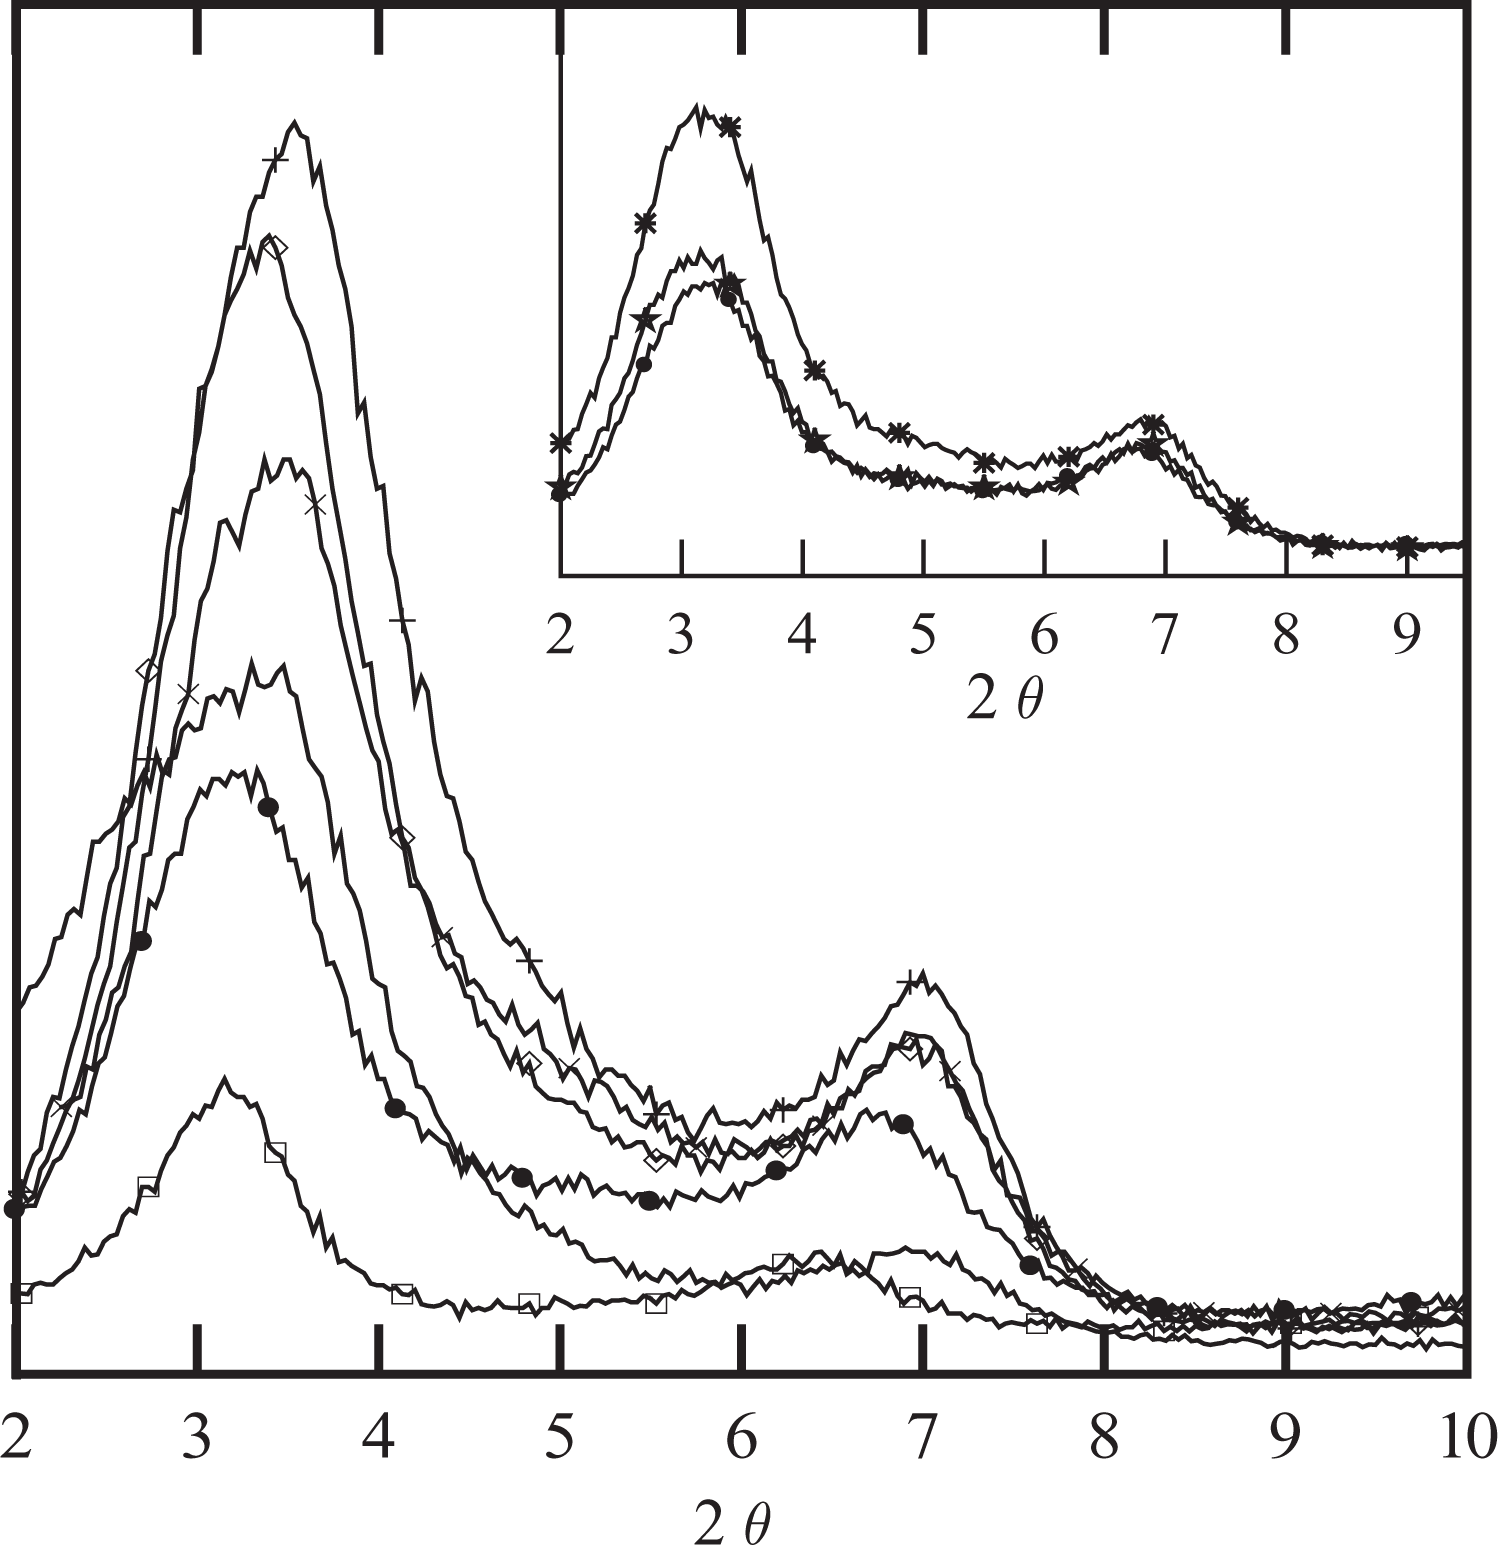
X-ray diffractograms of clay and composites PEN2 (☐), PEN5 (•), PEN8 (×), PEN12 (⋄) and PEN15 (+), all with PEg/MMT ratio = 2:1. Inset: composites PEN5 (•), PEN5-11 (⋆) and PEN5-31 (*). MMT: montmorillonite; PEg: PE grafted with maleic anhydride.
The diffractograms in Figure 2 show that the position of the characteristic peak of the (0 0 1) plane of the MMT also remain practically unaffected by the clay concentration. At most, a slightly shift to the lower values of 2θ can be appreciated as the concentration of clay decreases. On the other hand, as expected, the intensity of the peek reduces noticeably as the concentration of clay decreases. These results, which do not discard the possibility of partial exfoliation and delamination, indicate that at all concentrations, the d-spacing of the clay particles and tactoids is similar to that of the original clay. A similar behavior was observed by Hotta and Paul 13 for PNCs based on LLDPE, lineal low density polyethylene grafted with maleic anhydride (LLDPE-g) and a similar MMT to the one used in this work. These authors observe that the position of the (0 0 1) plane peak practically did not change with the clay concentration (for PEg/MMT = 1:1) and PEg/MMT ratio (for clay concentration up to ∼9 wt%). Similarly, Ranade et al., 17 observe that the presence of PEg improves the compatibility of clay and PE, but the position of the (0 0 1) peak of the organophilic MMT is not affected by the concentration and composition of the PNCs. Spencer et al. 26 also practically observed no effect of the PEg concentration in the position of the (0 0 1) peak for PNCs prepared with 5 wt% MMT, although a slight shift to larger angles is observed with respect to the peak of the original clay. On the contrary, Zhong et al. 20 observed a slight shift (of approximately 0.5°) toward the lower angles when HDPE or low density polyethylene (LDPE) was mixed with PEg and MMT in a 90:5:5 ratio. Similarly, Durmus and coworkers 7 observed a shift toward lower angles when LLDPE was mixed with PEg and 5 wt% of MMT in a practically 3:1 ratio. Devendra and coworkers, 18 who prepared the composites with 4 wt% of Nanomer I.44P, also observes a shift of approximately 0.7° toward lower values of 2θ when the clay was mixed with an ethylene–octene copolymer, regardless the presence of PEg. No correlation could be found among the materials and processing conditions used in the cited references that could explain the different behaviors observed.
The rheological study is based on the analysis of the dynamic moduli G′ and G″. Consequently, dynamic strain sweep tests were performed initially to find the corresponding region of linear viscoelastic behavior of all materials. The critical strain of onset of nonlinear viscoelastic behavior was determined to be 20% in the case of PE and all the PE/PEg matrices. The presence of clay reduces this value from 10 to 2% as the clay concentration increases from 2 to 15 wt%. Equivalent results were found by other authors. 7,18,22 All data shown in this article were obtained using strains well below the critical one for each material.
Figure 3 displays the elastic moduli and the dynamic viscosity (η′(ω) = G″(ω)/ω) of PE, PEg and the PE/PEg blends that constitute the matrices of the composites with PEg/MMT in the ratio of 2:1. These data were obtained at 150°C. All matrices present dynamic moduli between those of the homopolymers, albeit a little larger than those predicted by the logarithmic mixing rule.
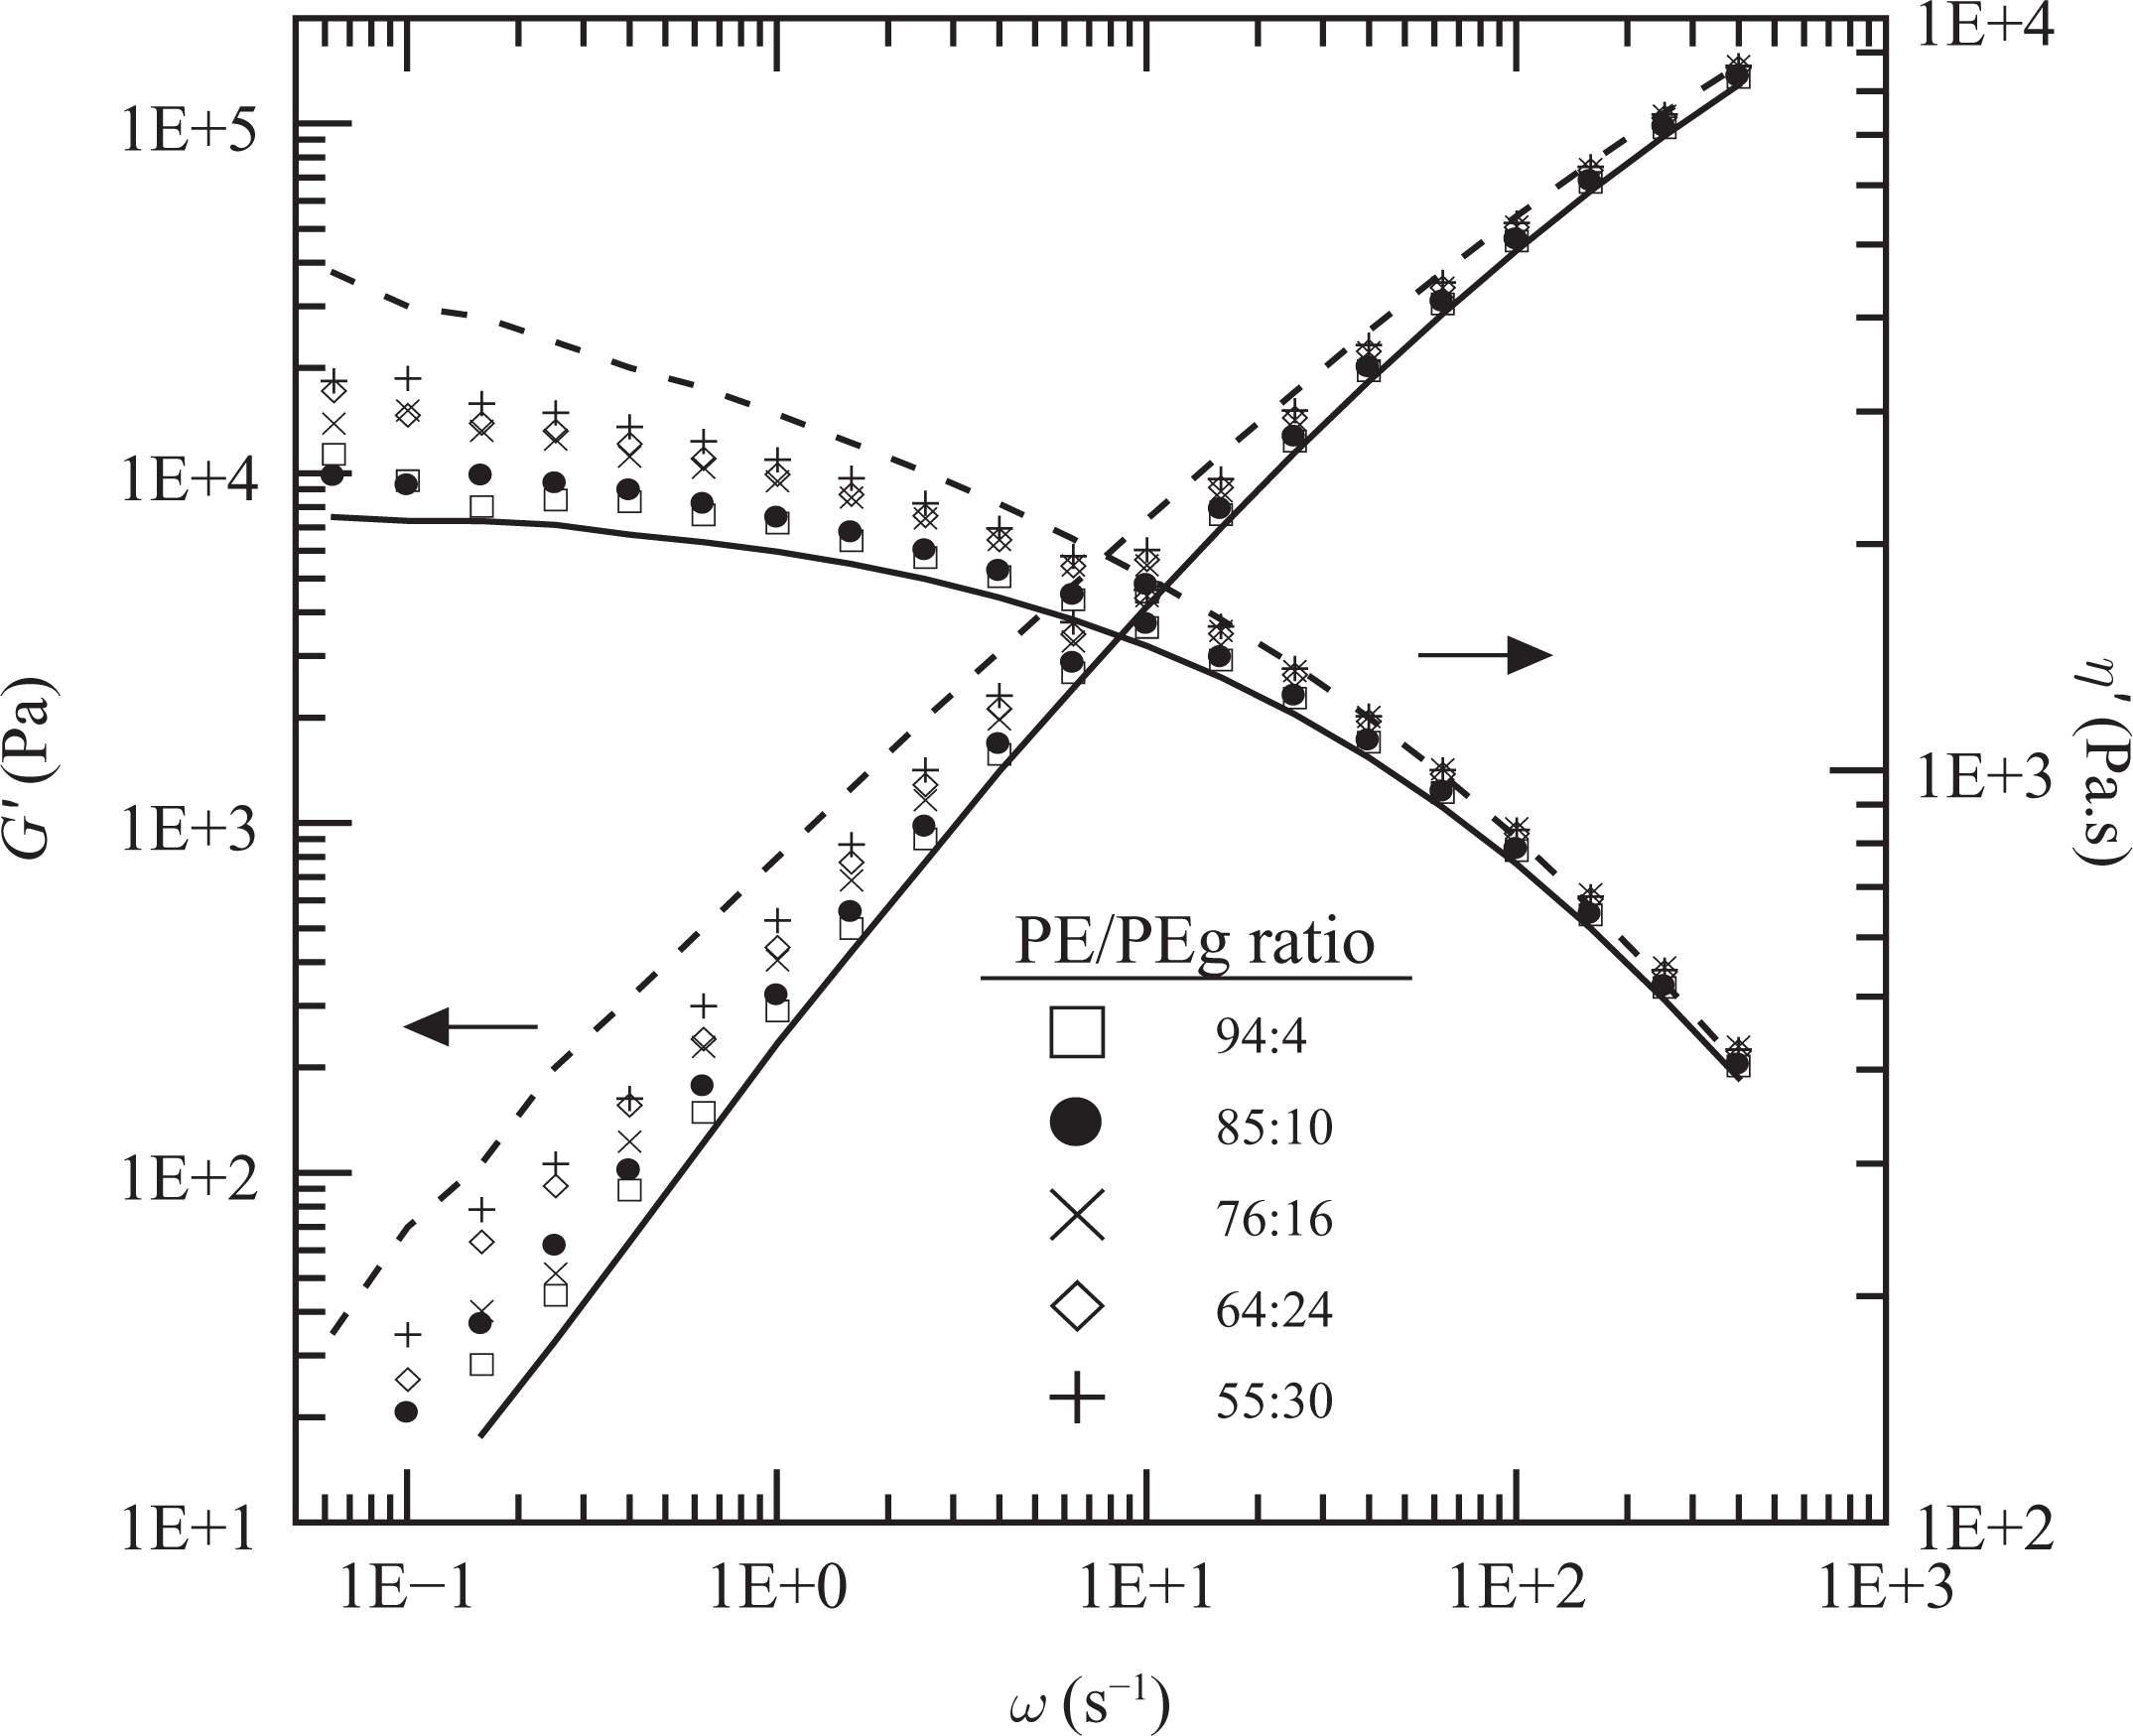
Elastic modulus and dynamic viscosity as a function of frequency measured at 150°C. PE (full lines), PEg (dashed lines) and PE/PEg blends corresponding to PEN2 (☐), PEN5 (•), PEN8 (×), PEN12 (⋄) and PEN15 (+). PE: polyethylene; PEg: PE grafted with maleic anhydride.
The elastic modulus of the composites prepared with 5 wt% of clay and different PEg/MMT ratios are shown in Figure 4, where they are presented relative to that of the corresponding polymeric matrices. Both, the data obtained at 150°C before and after the annealing treatment are displayed. In this treatment the sample was maintained at 200°C temperature for 1 h in the rheometer chamber after the initial dynamic frequency sweep (DFS) at 150°C. Immediately after the treatment, the temperature is reduced to 150°C and another DFS is performed. The inset of each figure shows the tan δ data (tan δ = G″/G′). According to the results (Figure 4(a)), the elastic modulus of PE5, which has no compatibilizer, is very similar to that of PE at all frequencies. The presence of PEg increases the elastic and viscous moduli of the composites (and reduces the tan δ). However, when G′ is presented relative to the moduli of the corresponding matrices (G′mat), it is observed that the composite with 10 wt% of PEg (i.e. PEN5) has the larger relative increment. This effect is more noticeable at low frequencies. The annealing treatment produces a further increase in the dynamic moduli of the three composites, G′ being more affected than G″ and mainly at low frequencies (see Figure 4(b) and its inset). For example, PEN5 has a final value of G′/G′mat that is approximately 50% larger than the initial one at 0.1 s−1. Although the three materials display larger moduli during the final DFSs, PEN5 is still the one with the largest ratio G′/G′mat. The effect of the thermal treatment then suggests a change in the distribution of clay particle and intensification of the interactions between particles.
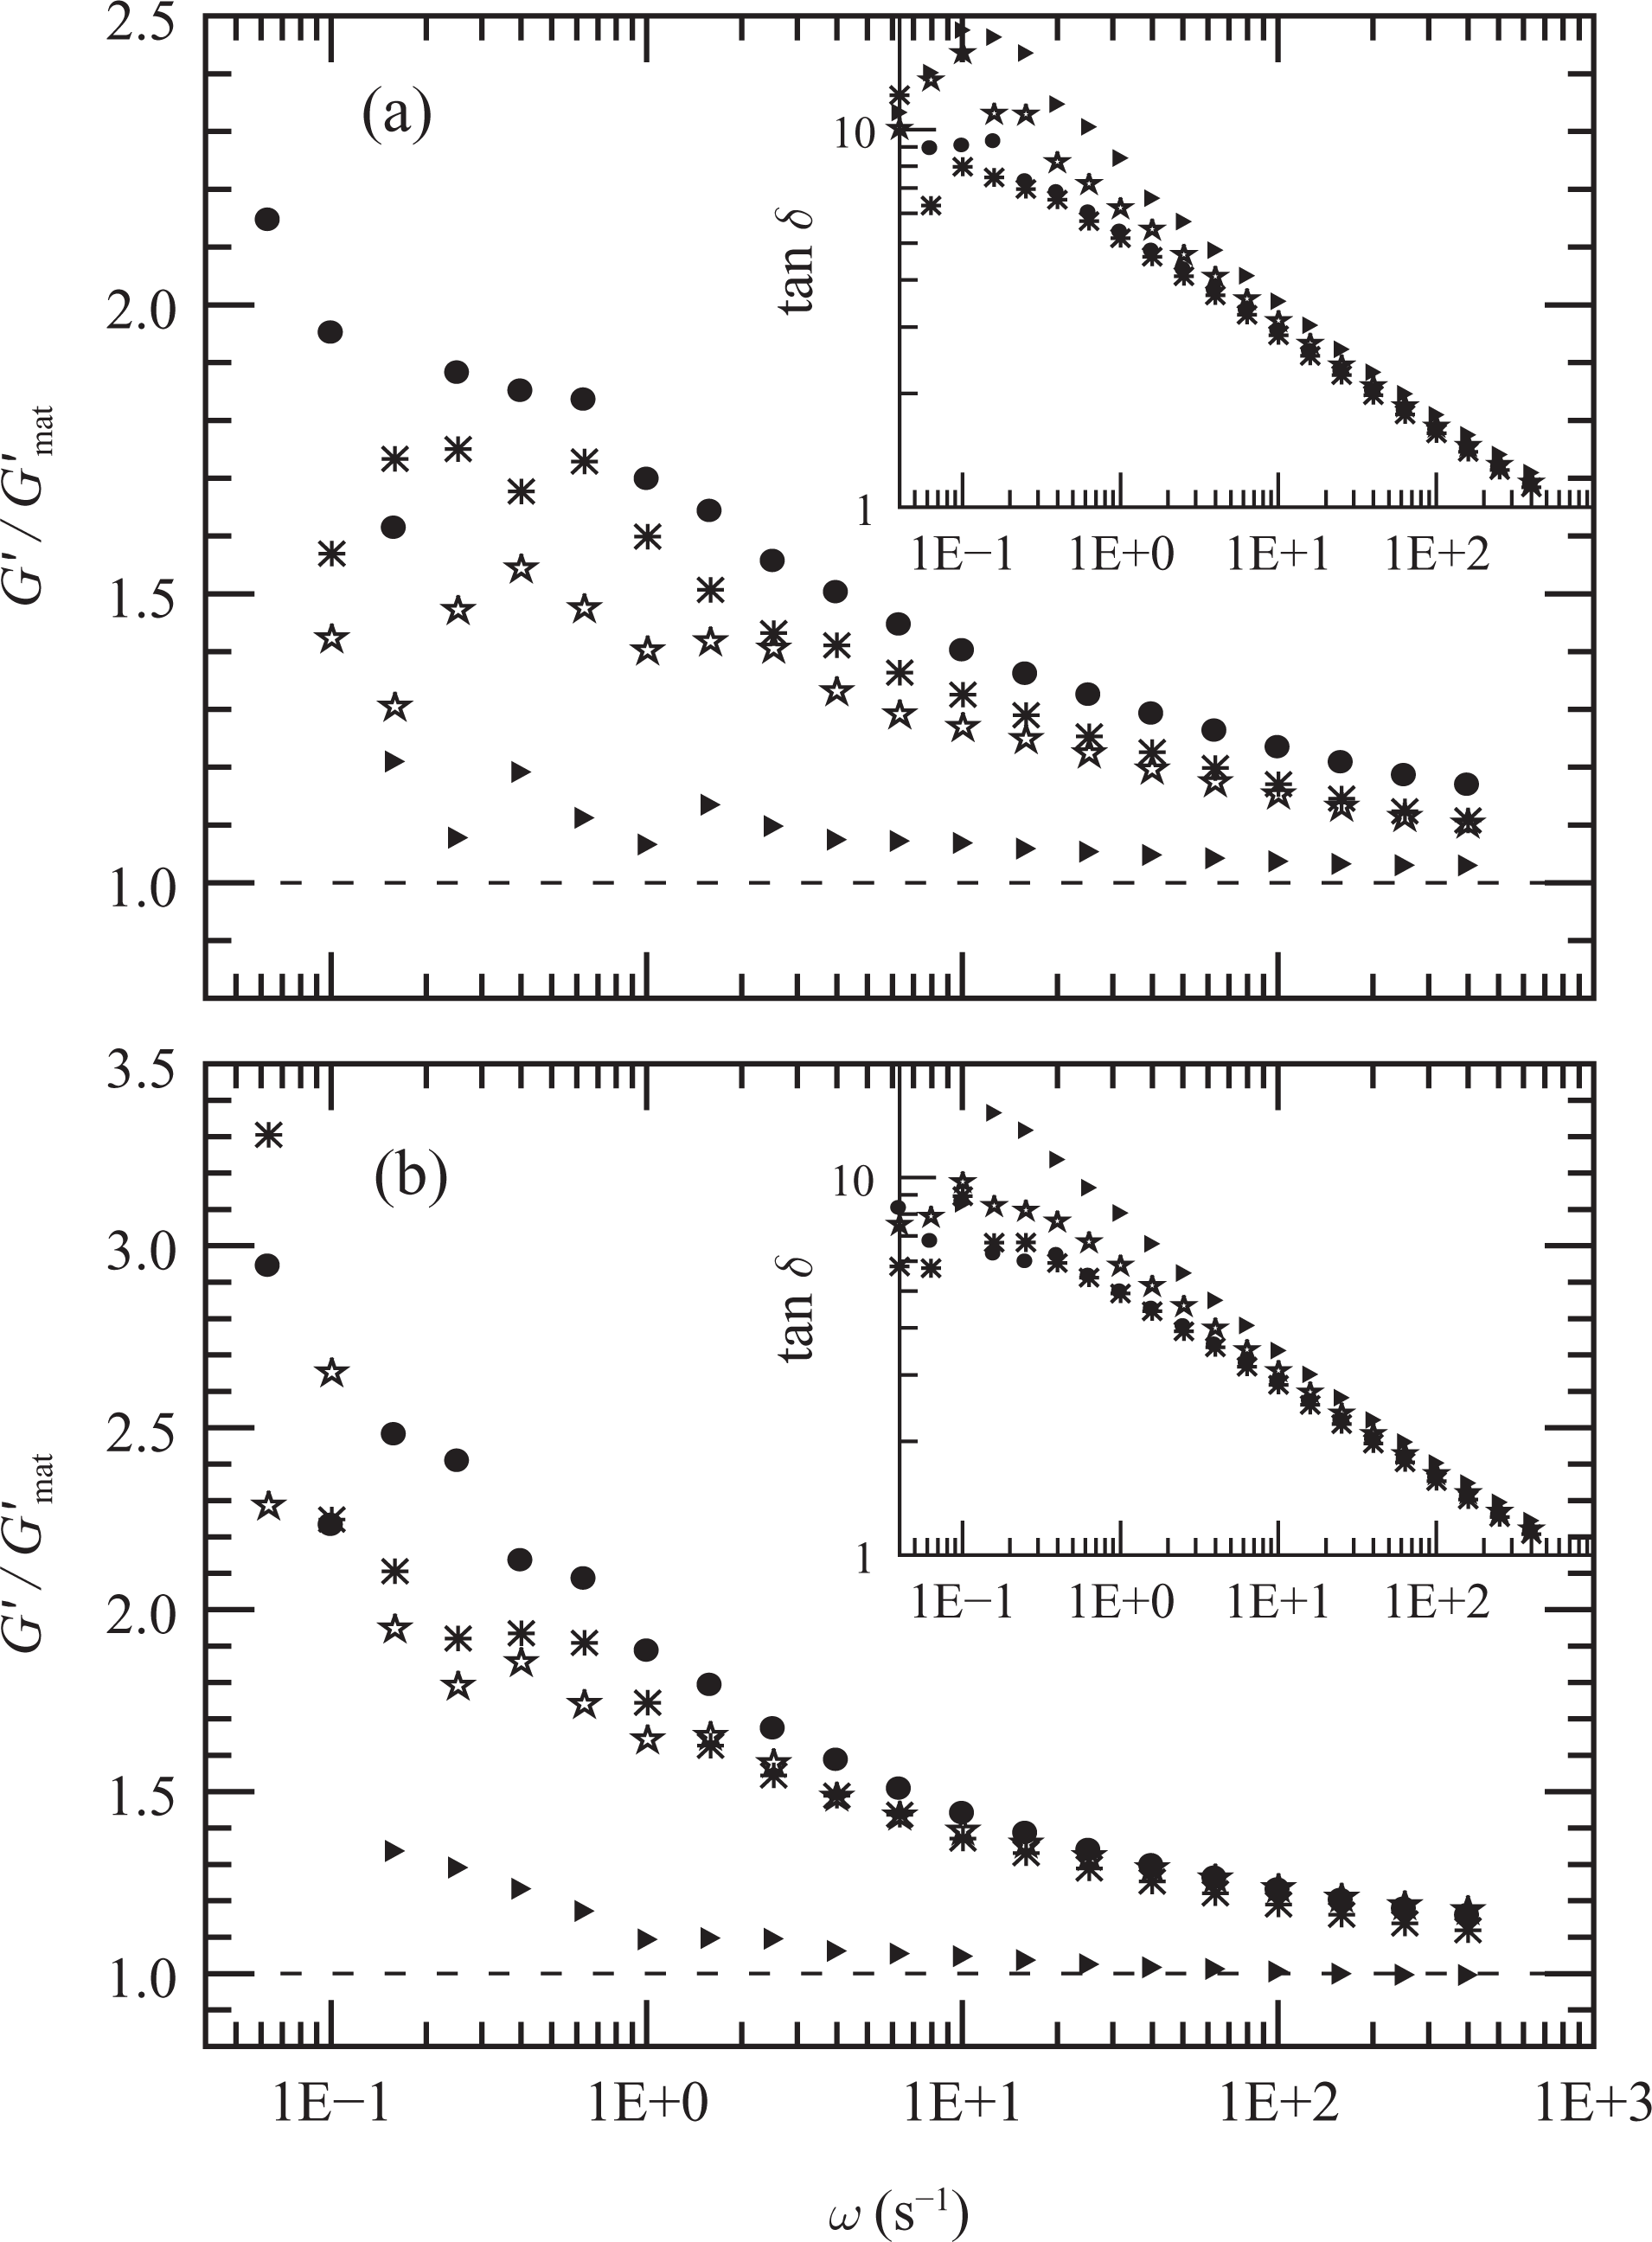
Elastic modulus as a function of frequency of composites PE5 (▵), PEN5-11 (⋆), PEN5(•) and PEN5-31 (*) relative to the elastic modulus of the corresponding PE/PEg matrices. Data from initial (a) and final (b) dynamic frequency sweeps (DFSs) at 150°C. Tan δ data are included in the insets. PEg: polyethylene grafted with maleic anhydride.
Similar behavior is displayed by the composites prepared with different clay concentrations and fixed 2:1 PEg/clay ratio. As shown in Figure 5, both the elastic and viscous moduli determined at 150°C augment while tan δ decreases (mainly at low frequencies) as the clay concentration increases. Moreover, except in the case of PEN2, the annealing process produces an increment of approximately 300% in the elastic modulus of the composites at low frequencies. Furthermore, tan δ, which decreases as the clay concentration increases, reaches a value of order 1 or even smaller for fresh samples of PEN12 and PEN15. The thermal treatment reduces this parameter emphasizing that the annealing process induces a change in the microstructure of the hybrids with an increment in the interaction among the solid particles. The final viscous data, in the form of dynamic viscosity, are also displayed in Figure 6. These data demonstrate the large effect that the presence of clay has on the viscoelastic behavior of the nanocomposites and that the interaction between particles produce a solid-like behavior even at relatively low clay concentrations (∼8 wt%).
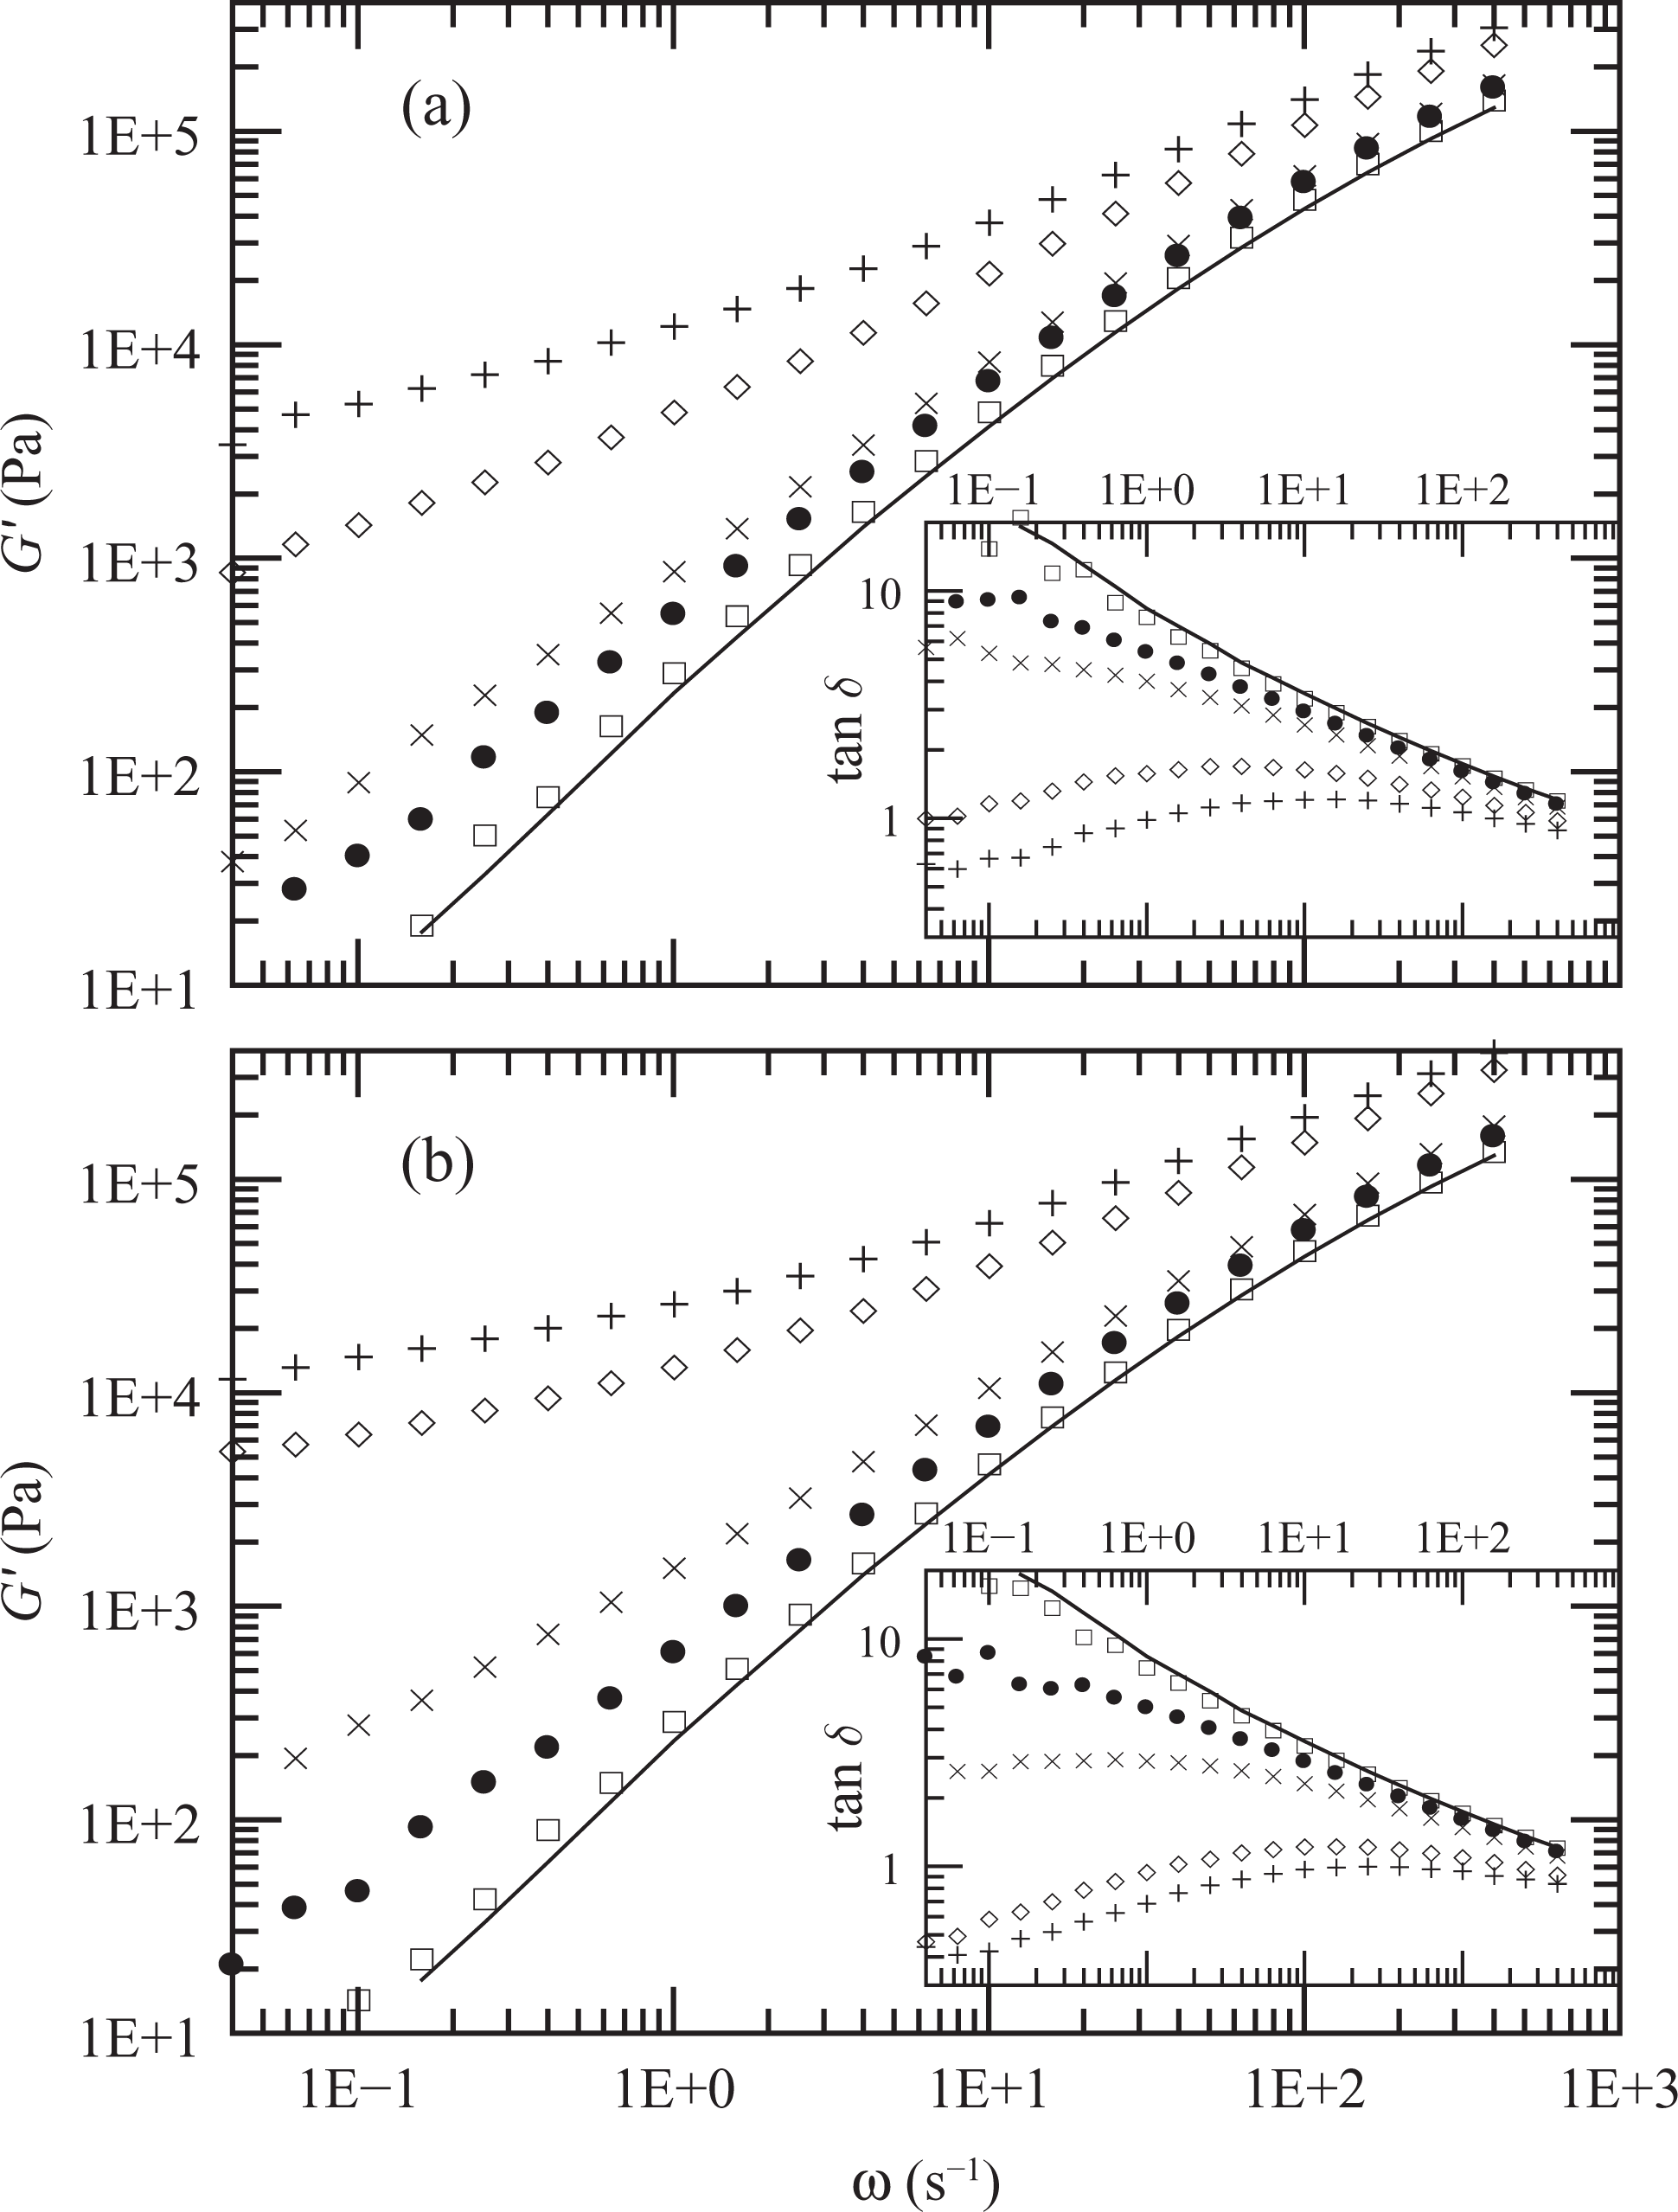
Elastic modulus of PE (full line) and composites PEN2 (☐), PEN5 (•), PEN8 (×), PEN12 (⋄) and PEN15 (+). Data from initial (a) and final (b) dynamic frequency sweeps (DFSs) at 150°C. Tan δ data are included in the insets. PE: polyethylene.
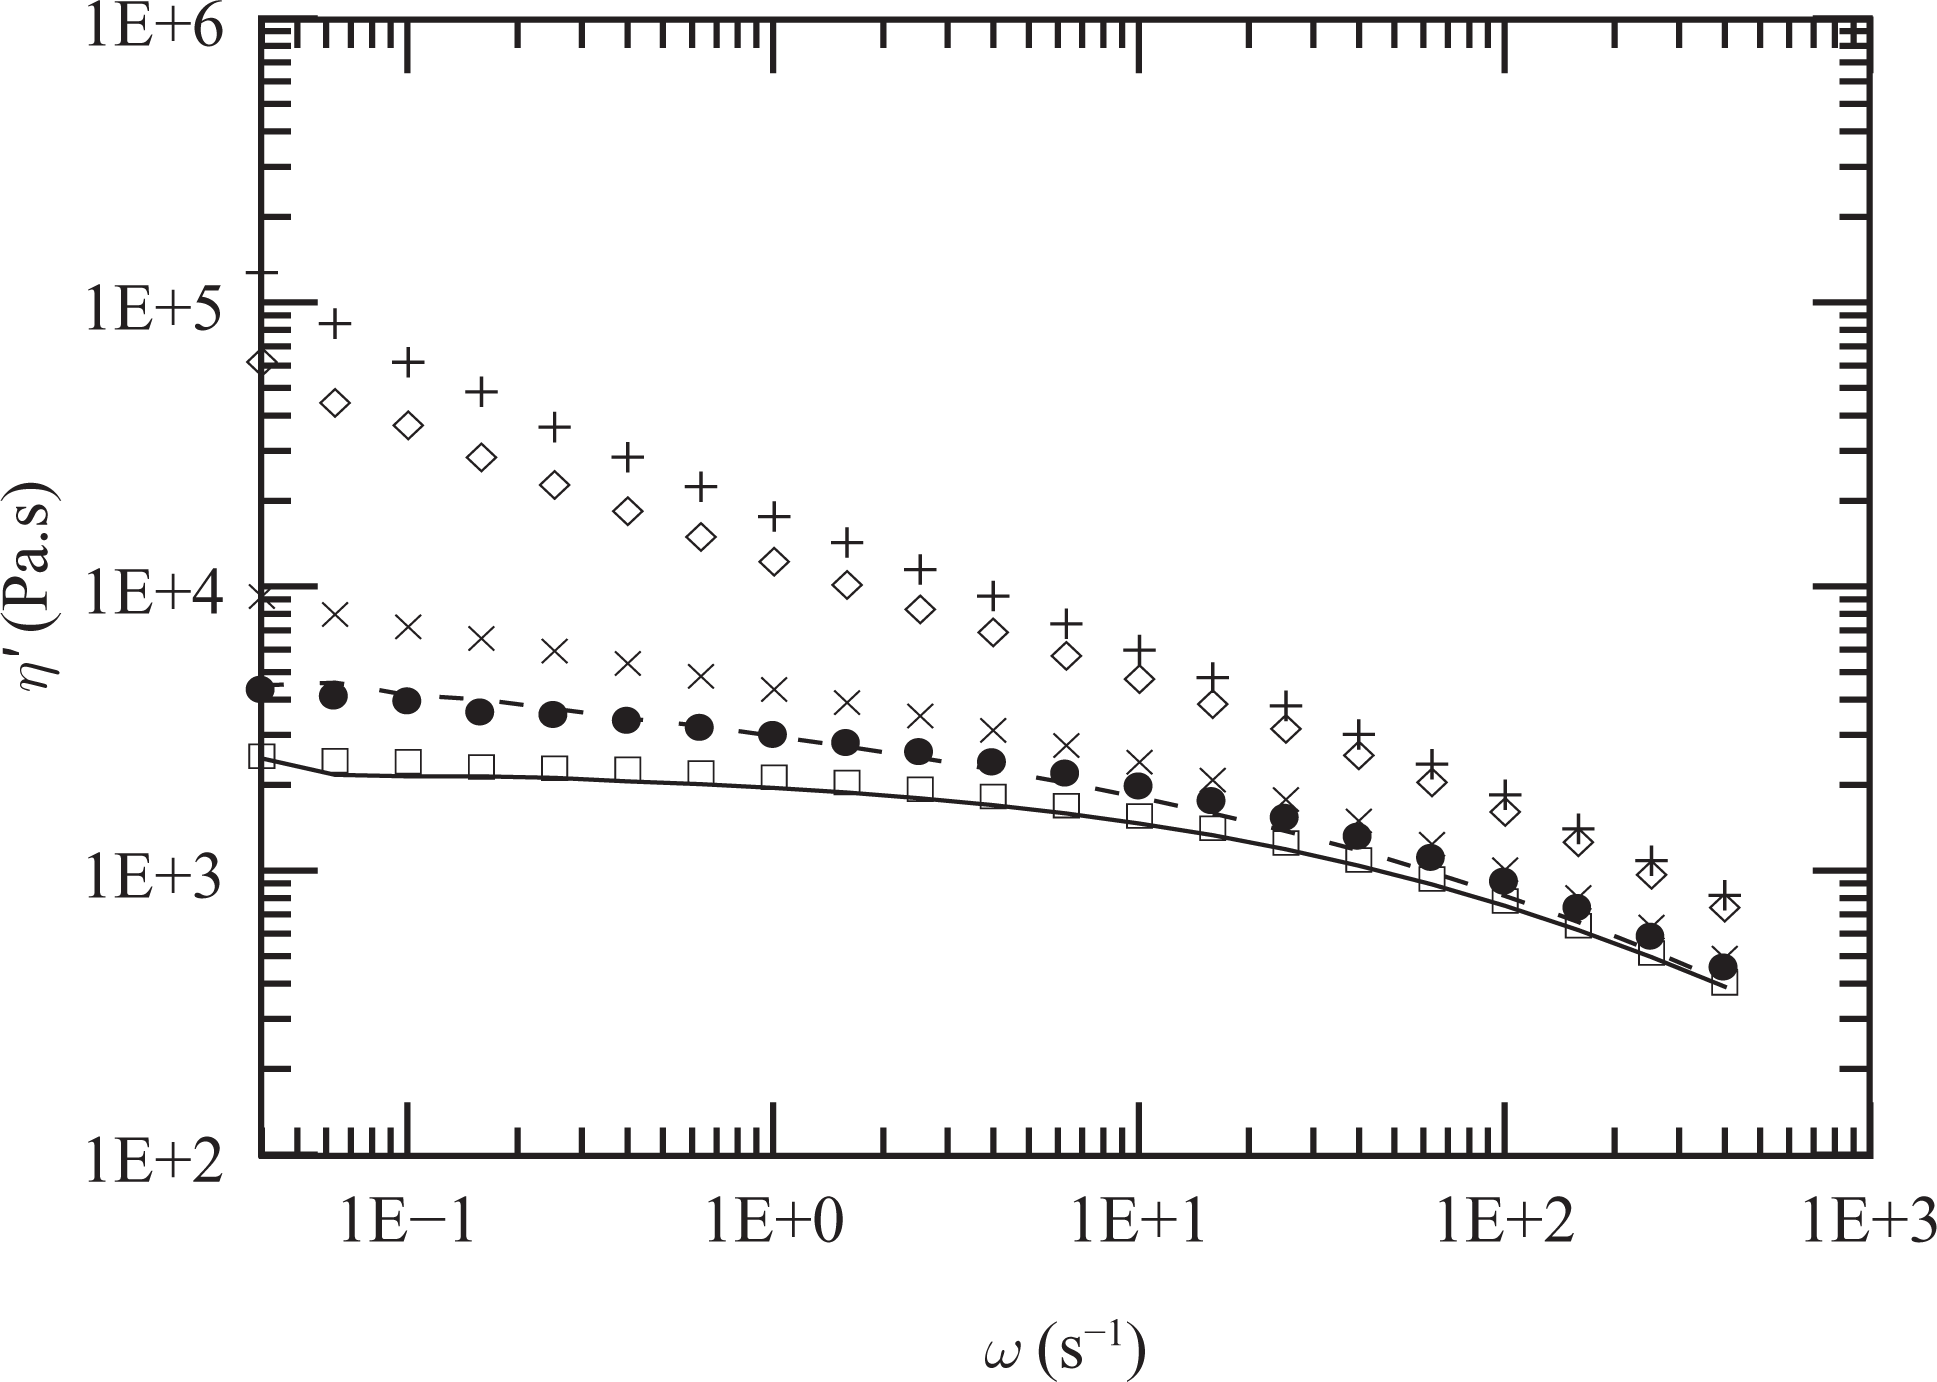
Dynamic viscosity of PE (full line), PEg (dashed line) and annealed composites PEN2 (☐), PEN5 (•), PEN8 (×), PEN12 (⋄) and PEN15 (+) at 150°C. Data of the corresponding matrices are presented in Figure 3. PE: polyethylene; PEg: PE grafted with maleic anhydride.
Figure 7 displays the values of the elastic modulus and tan δ measured at a frequency of 0.04 s−1. This type of plot allows distinguishing the critical clay loading where the series of PNCs change their behavior from liquid like to pseudo solid like. 7 The dramatic change in the storage modulus and tan δ after 8 wt% shows that a percolation network begins at a concentration of approximately 9 wt%. Other authors have estimated the beginning of the percolation structure at even lower MMT concentrations but using much larger concentrations of PEg or PEgs with larger anhydride maleic grafted ratio. 7,18,29 For example, Devendra et al. 18 noticed that the transition to pseudo solid-like behavior exist at a PEg concentration between 50 and 70 wt% when analyzing nanocomposites based on ethylene–octene copolymer, 4 wt% of Nanomer I.44P, and a PEg with 0.89% anhydride maleic grafted. Durmus and coworkers 7 calculated the percolation threshold at clay loading of about 2 wt% when using an LLDPE of large molecular weight (M w >250.000 g/mol), a PEg with 1.6% maleic anhydride graft ratio (∼10 times larger than ours) and an MMT similar to the one used in this study, with a PEg/MMT ratio of about 3:1. Tang et al. 29 observed the transition to pseudo solid-like behavior of 1 and 3 wt% of clay when using 35 wt% of a PEg (PEg/clay ratio larger than 10:1) with 0.85% maleic anhydride grafted, an HDPE and an MMT similar to ours.
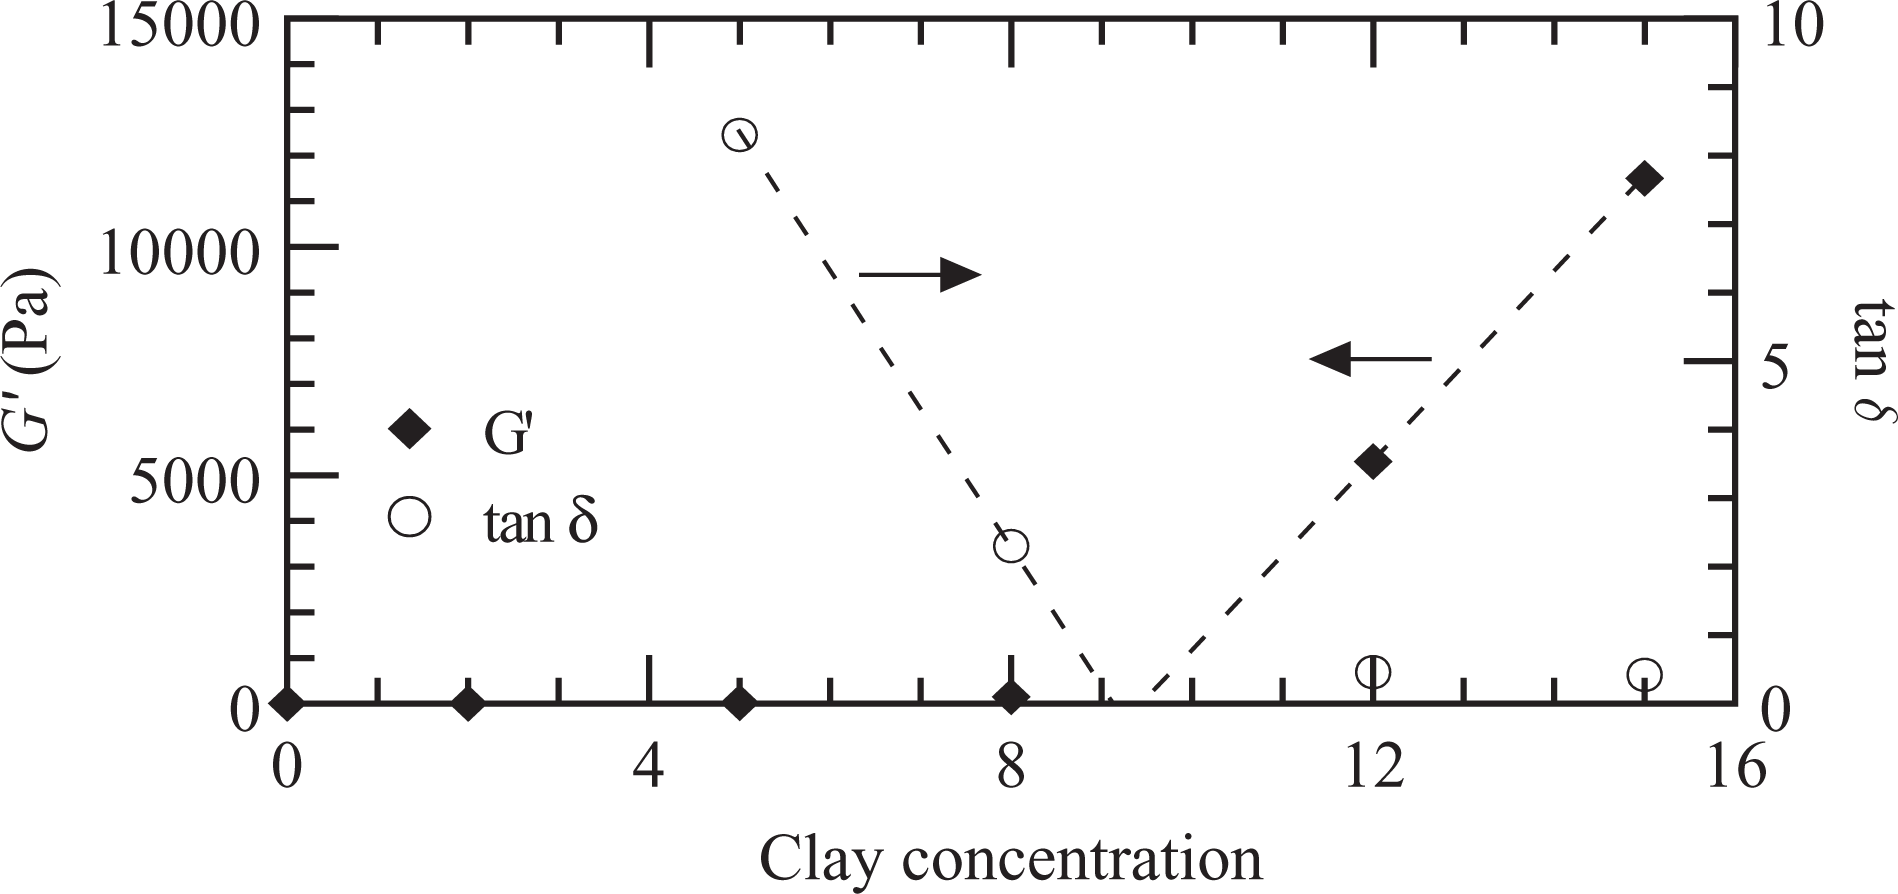
Elastic modulus and tan δ (at ω = 0.04 s−1) at 150°C for the nanocomposites series with PEg/MMT ratio of 2:1. Dashed lines: lineal extrapolations. MMT: montmorillonite; PEg: polyethylene grafted with maleic anhydride.
The materials were also characterized by FTIR to investigate possible changes in the molecular structure of the components during processing and rheological characterization. Figure 8 displays a spectra region of PEg and the series of composites with a 2:1 ratio of PEg/MMT. These spectra have been normalized with the thickness of the films and have been arbitrarily shifted in the y axis. The spectrum of PE, which is not included in the figure, does not show any peaks in the analyzed region, while that of PEg displays the characteristic band of the anhydride group located near 1790 cm−1. The composites, on the other hand, present a broad absorption band centered at 1720 cm−1 that can be ascribed to carbonyl groups of esters and/or amides, and another at 1640 cm−1 that can be associated with the asymmetrical stretching of C=O of the carboxylate anion. The absence of the band at 1790 cm−1 in these spectra and the presence of those associated with carbonyl groups suggest that a reaction in the anhydride groups of PEg and the clay, or its ammonium surfactant, took place during the mixing process. This interaction between the compatibilizer and the MMT may have helped in the exfoliation and generation of true nanocomposites. The figure also displays the spectra of the annealed materials (in dashed lines) which show practically no difference from those of the fresh samples used in the rheological study. This result suggests that the further increment in the dynamic moduli during the annealing process is not related to any additional reactions rather to an improvement in the tactoids distribution and/or further exfoliation of the clay particles.
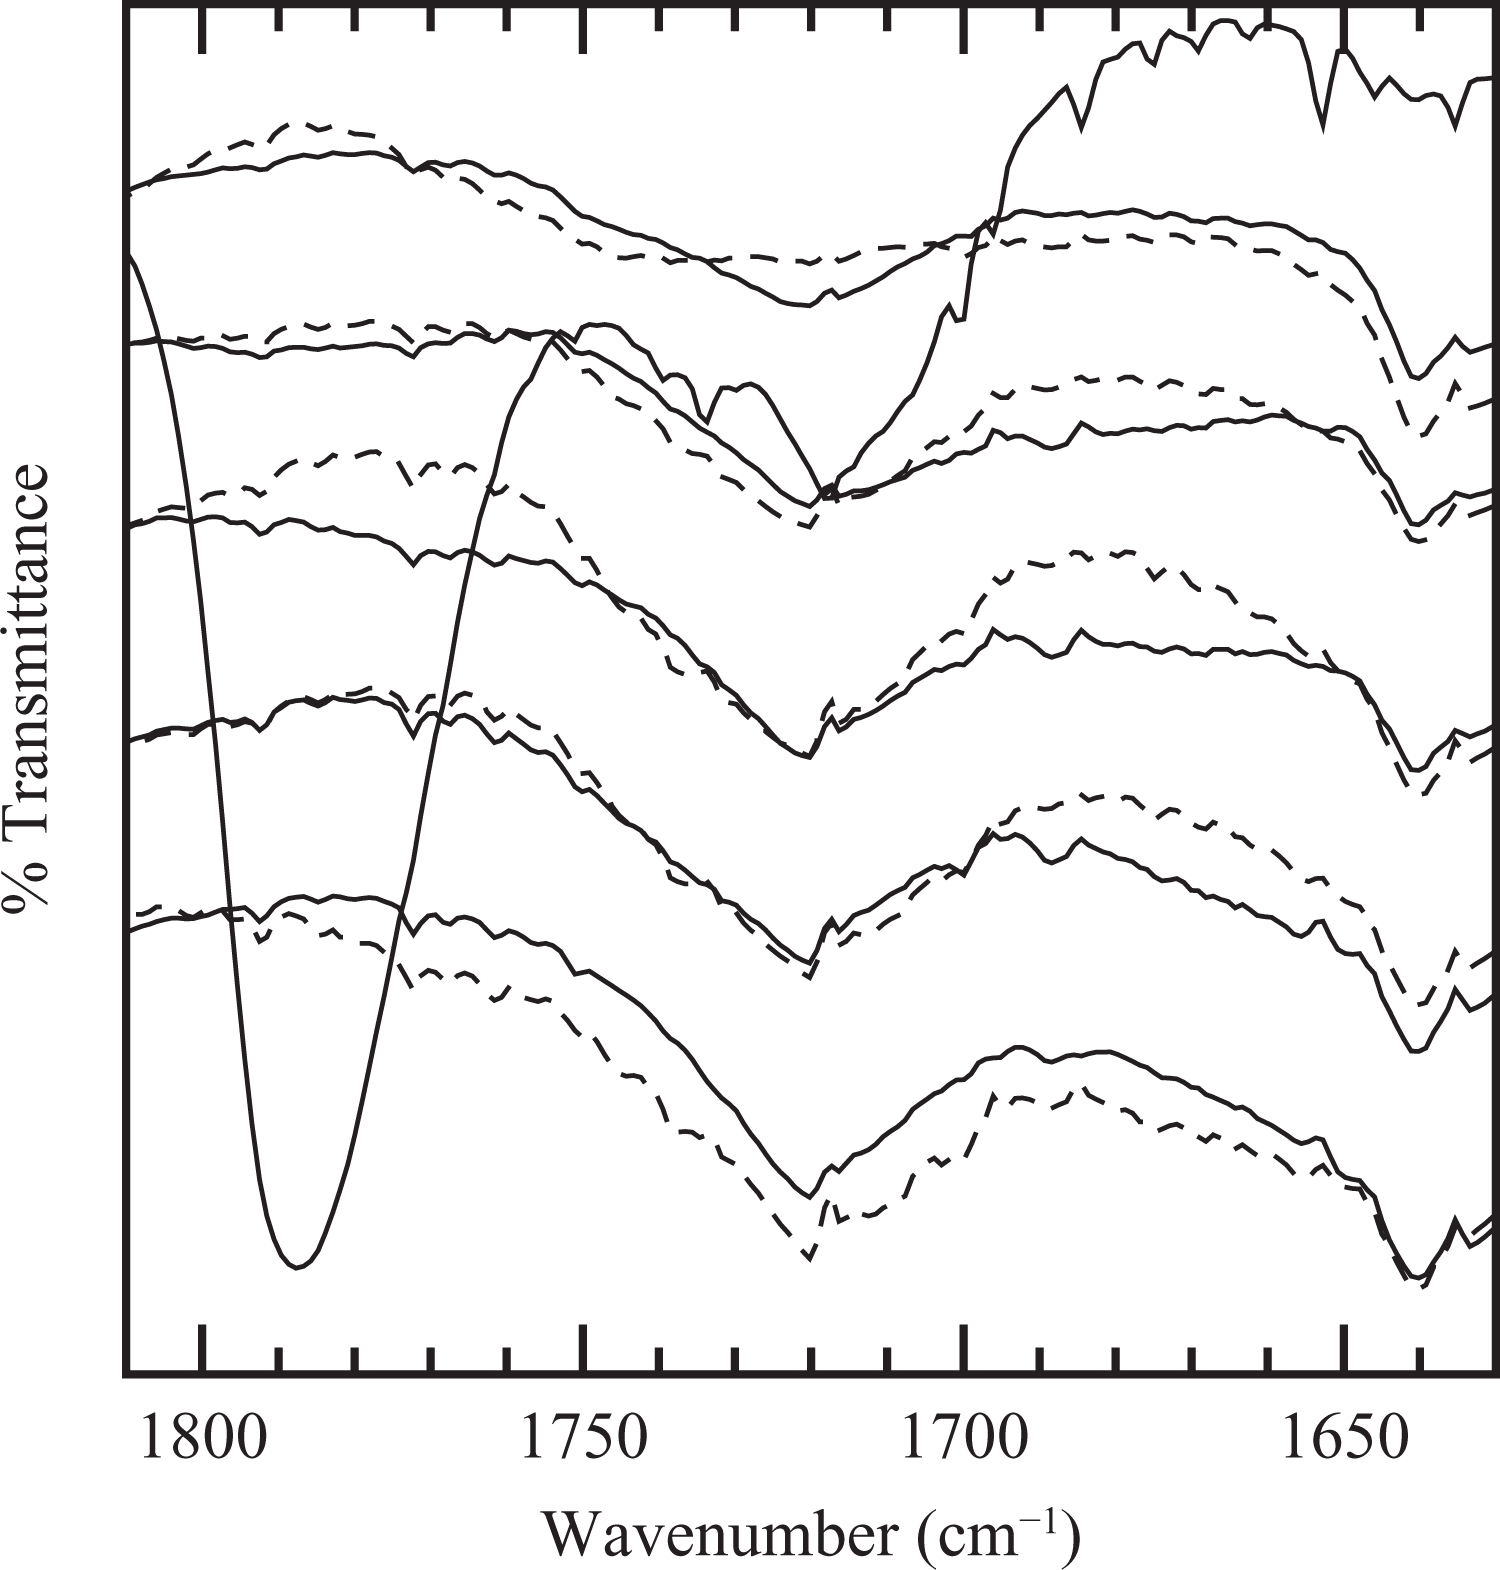
Infrared spectrograms of polyethylene grafted with maleic anhydride (PEg) and nanocomposites with different clay concentrations. Bottom-up: PEN15, PEN12, PEN8, PEN5, PEN2 and PEg. Dashed lines: annealed materials. PEg: PE grafted with maleic anhydride.
The morphology of the composites was also analyzed by SEM. Figure 9 shows the micrographs of the series of PNCs prepared with different clay concentrations and 2:1 PEg/MMT ratio. The chosen images, which were obtained with a magnification of ×6000, are representative of the structure observed in each material. The displayed surfaces correspond to transversal cuts of the films used to analyze the permeability. The cuts were obtained using an ultramicrotome and chemically treated to enhance the contrast between the clay and the polymer. In this treatment, the macromolecules are degraded producing contrast between the clay and polymeric matrices. A good contrast was achieved exposing the surfaces to 10 min of etching at room temperature using a solution of 0.2% (v/v) potassium permanganate in sulfuric acid. The samples were then washed several times with diluted sulfuric acid and distilled water, and finally immersed for 1 h in oxygenated water. 37 Finely divided platy forms with poorly defined shapes and very crumpled layers can be appreciated in the micrographs of all PE/PEg/MMT composites. The original particles of 15–25 μm diameter have been exfoliated in platelets and tactoids of 3 μm maximum length in all cases. As a result of the film processing, these tactoids appear oriented practically parallel to the film surfaces. Figure 10 shows a closer view of the surface of PEN15 (zone indicated in Figure 9(e)) where the exfoliated particles can be clearly distinguished. This figure, which is representative of the morphology observed at all points in the analyzed PEN15 samples, evidences that, at this concentration, the platelets and tactoids conform a percolated structure. This type of structure, although less packed, also appears in PEN8 and PEN12.
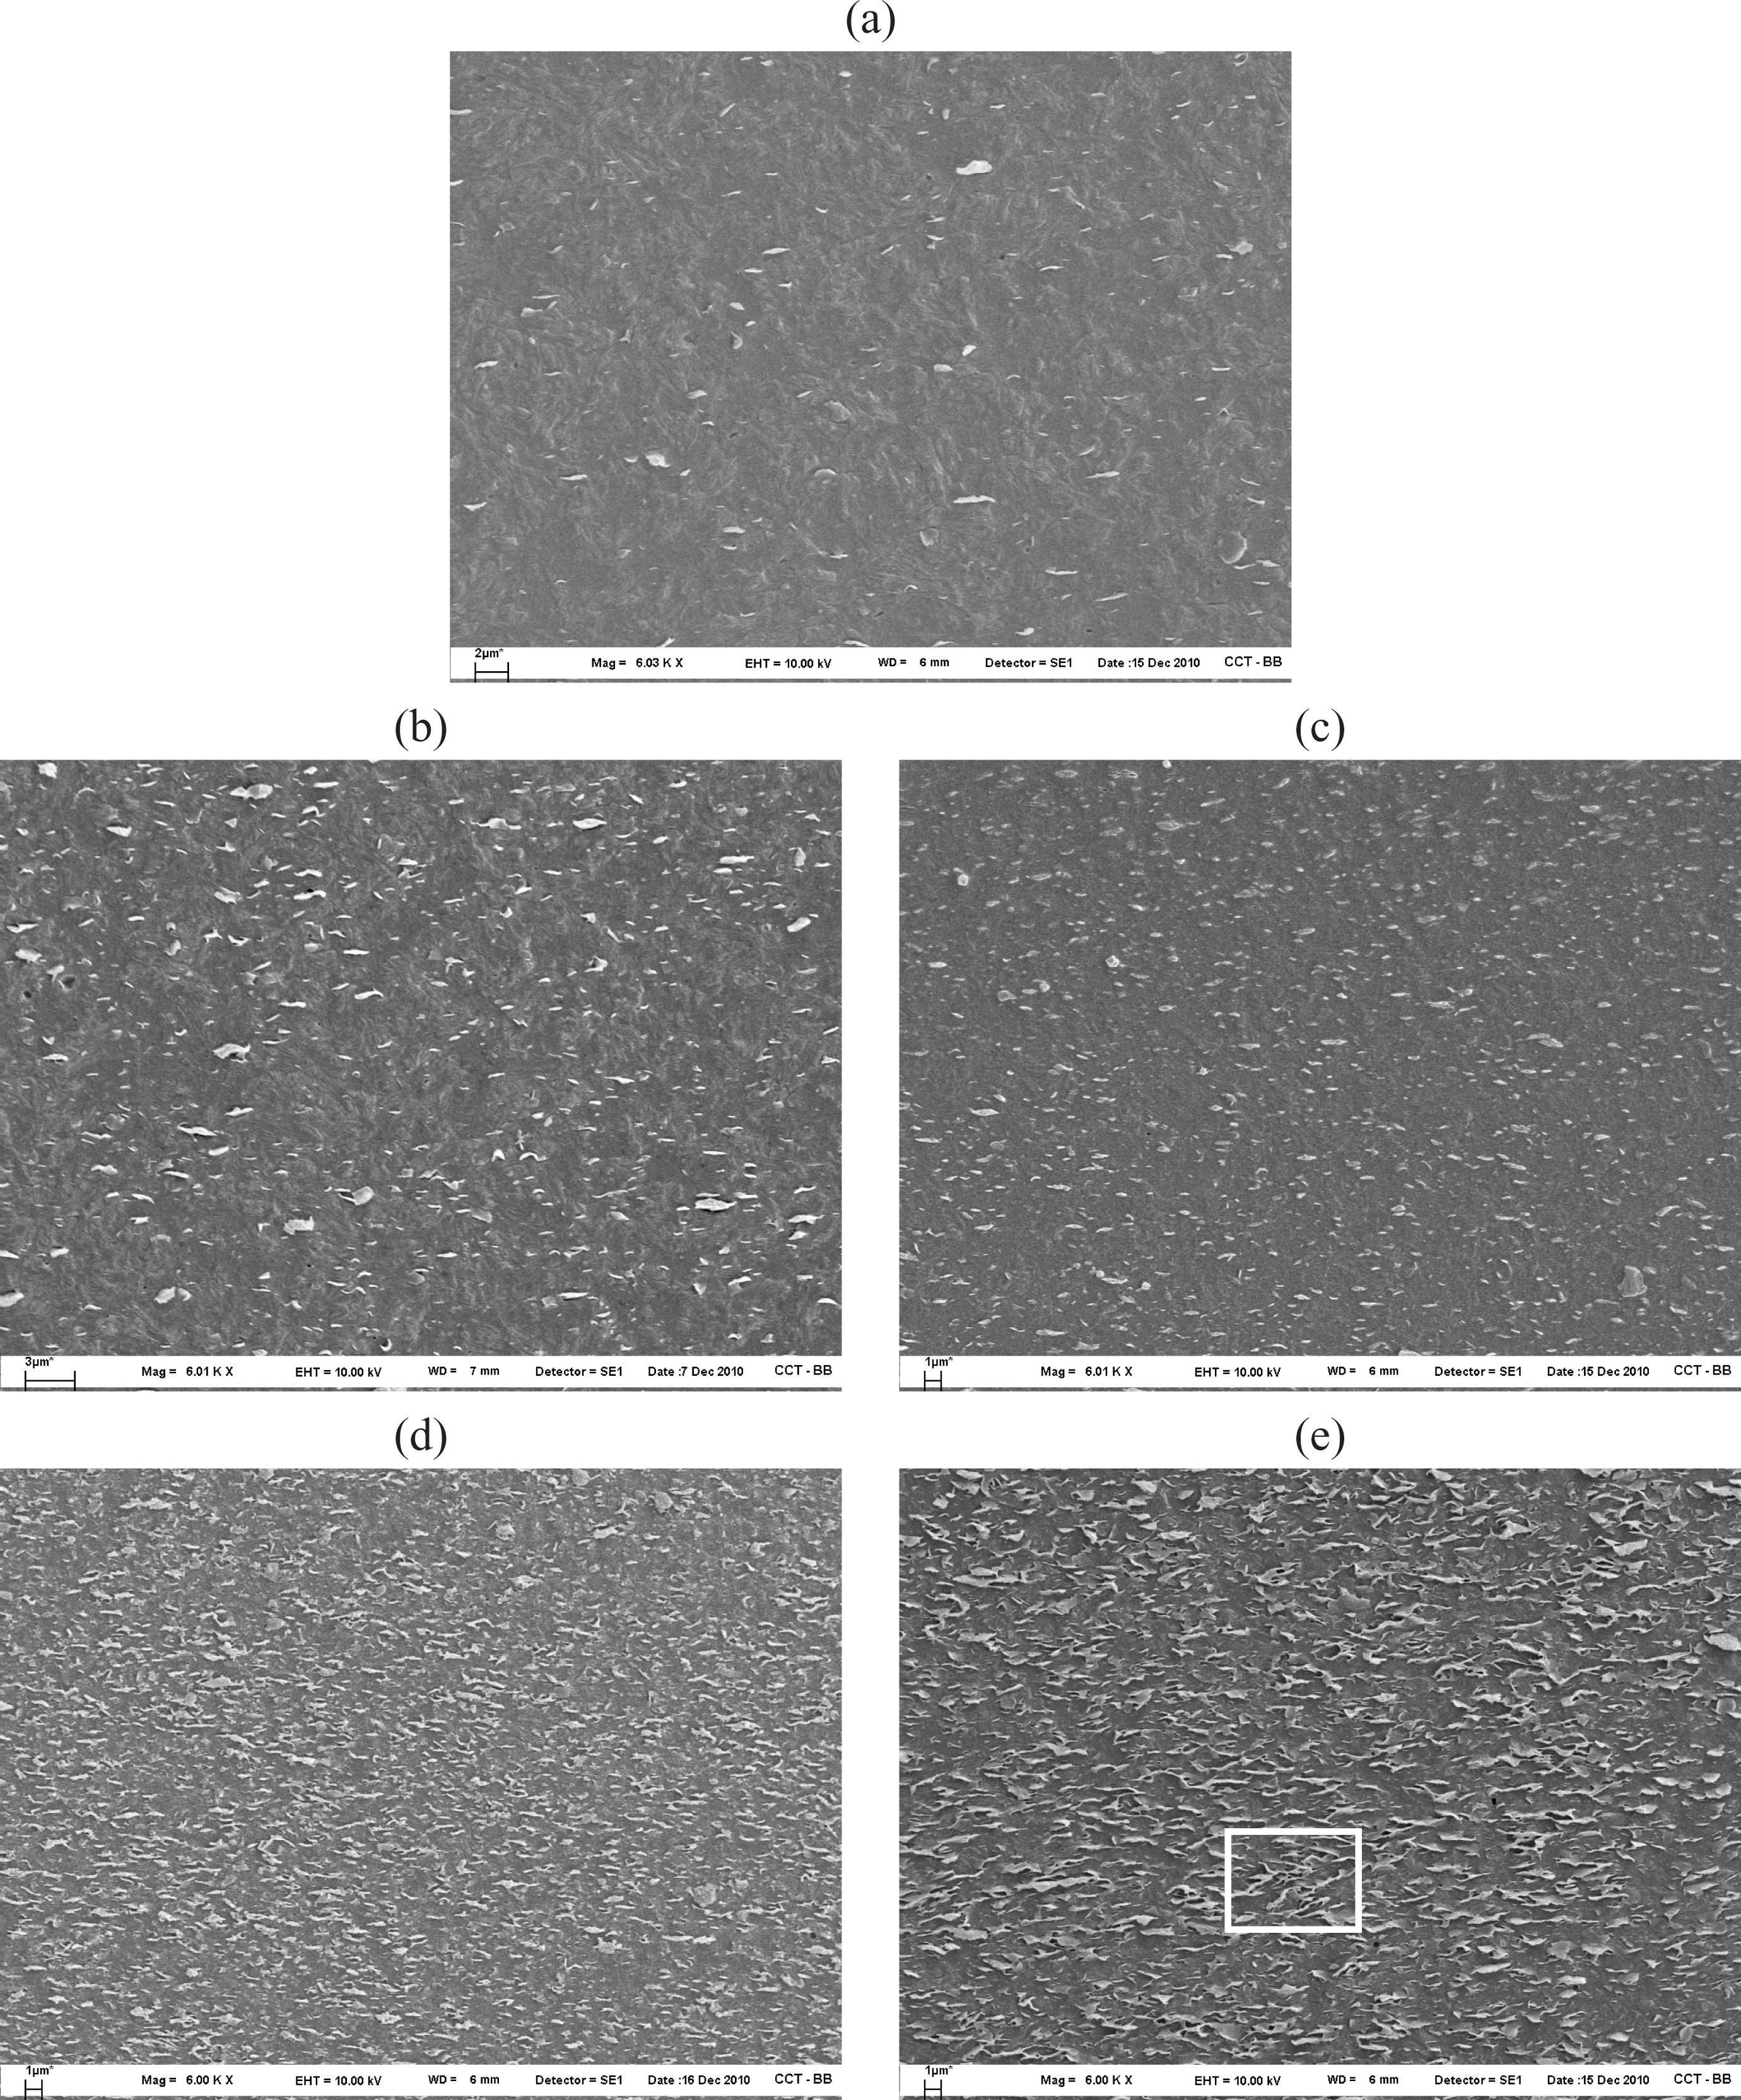
Scanning electron micrographs of PEN2 (a), PEN5 (b), PEN8 (c), PEN12 (d) and PEN15 (e). Etching treatment was done with potassium permanganate and sulfuric acid.
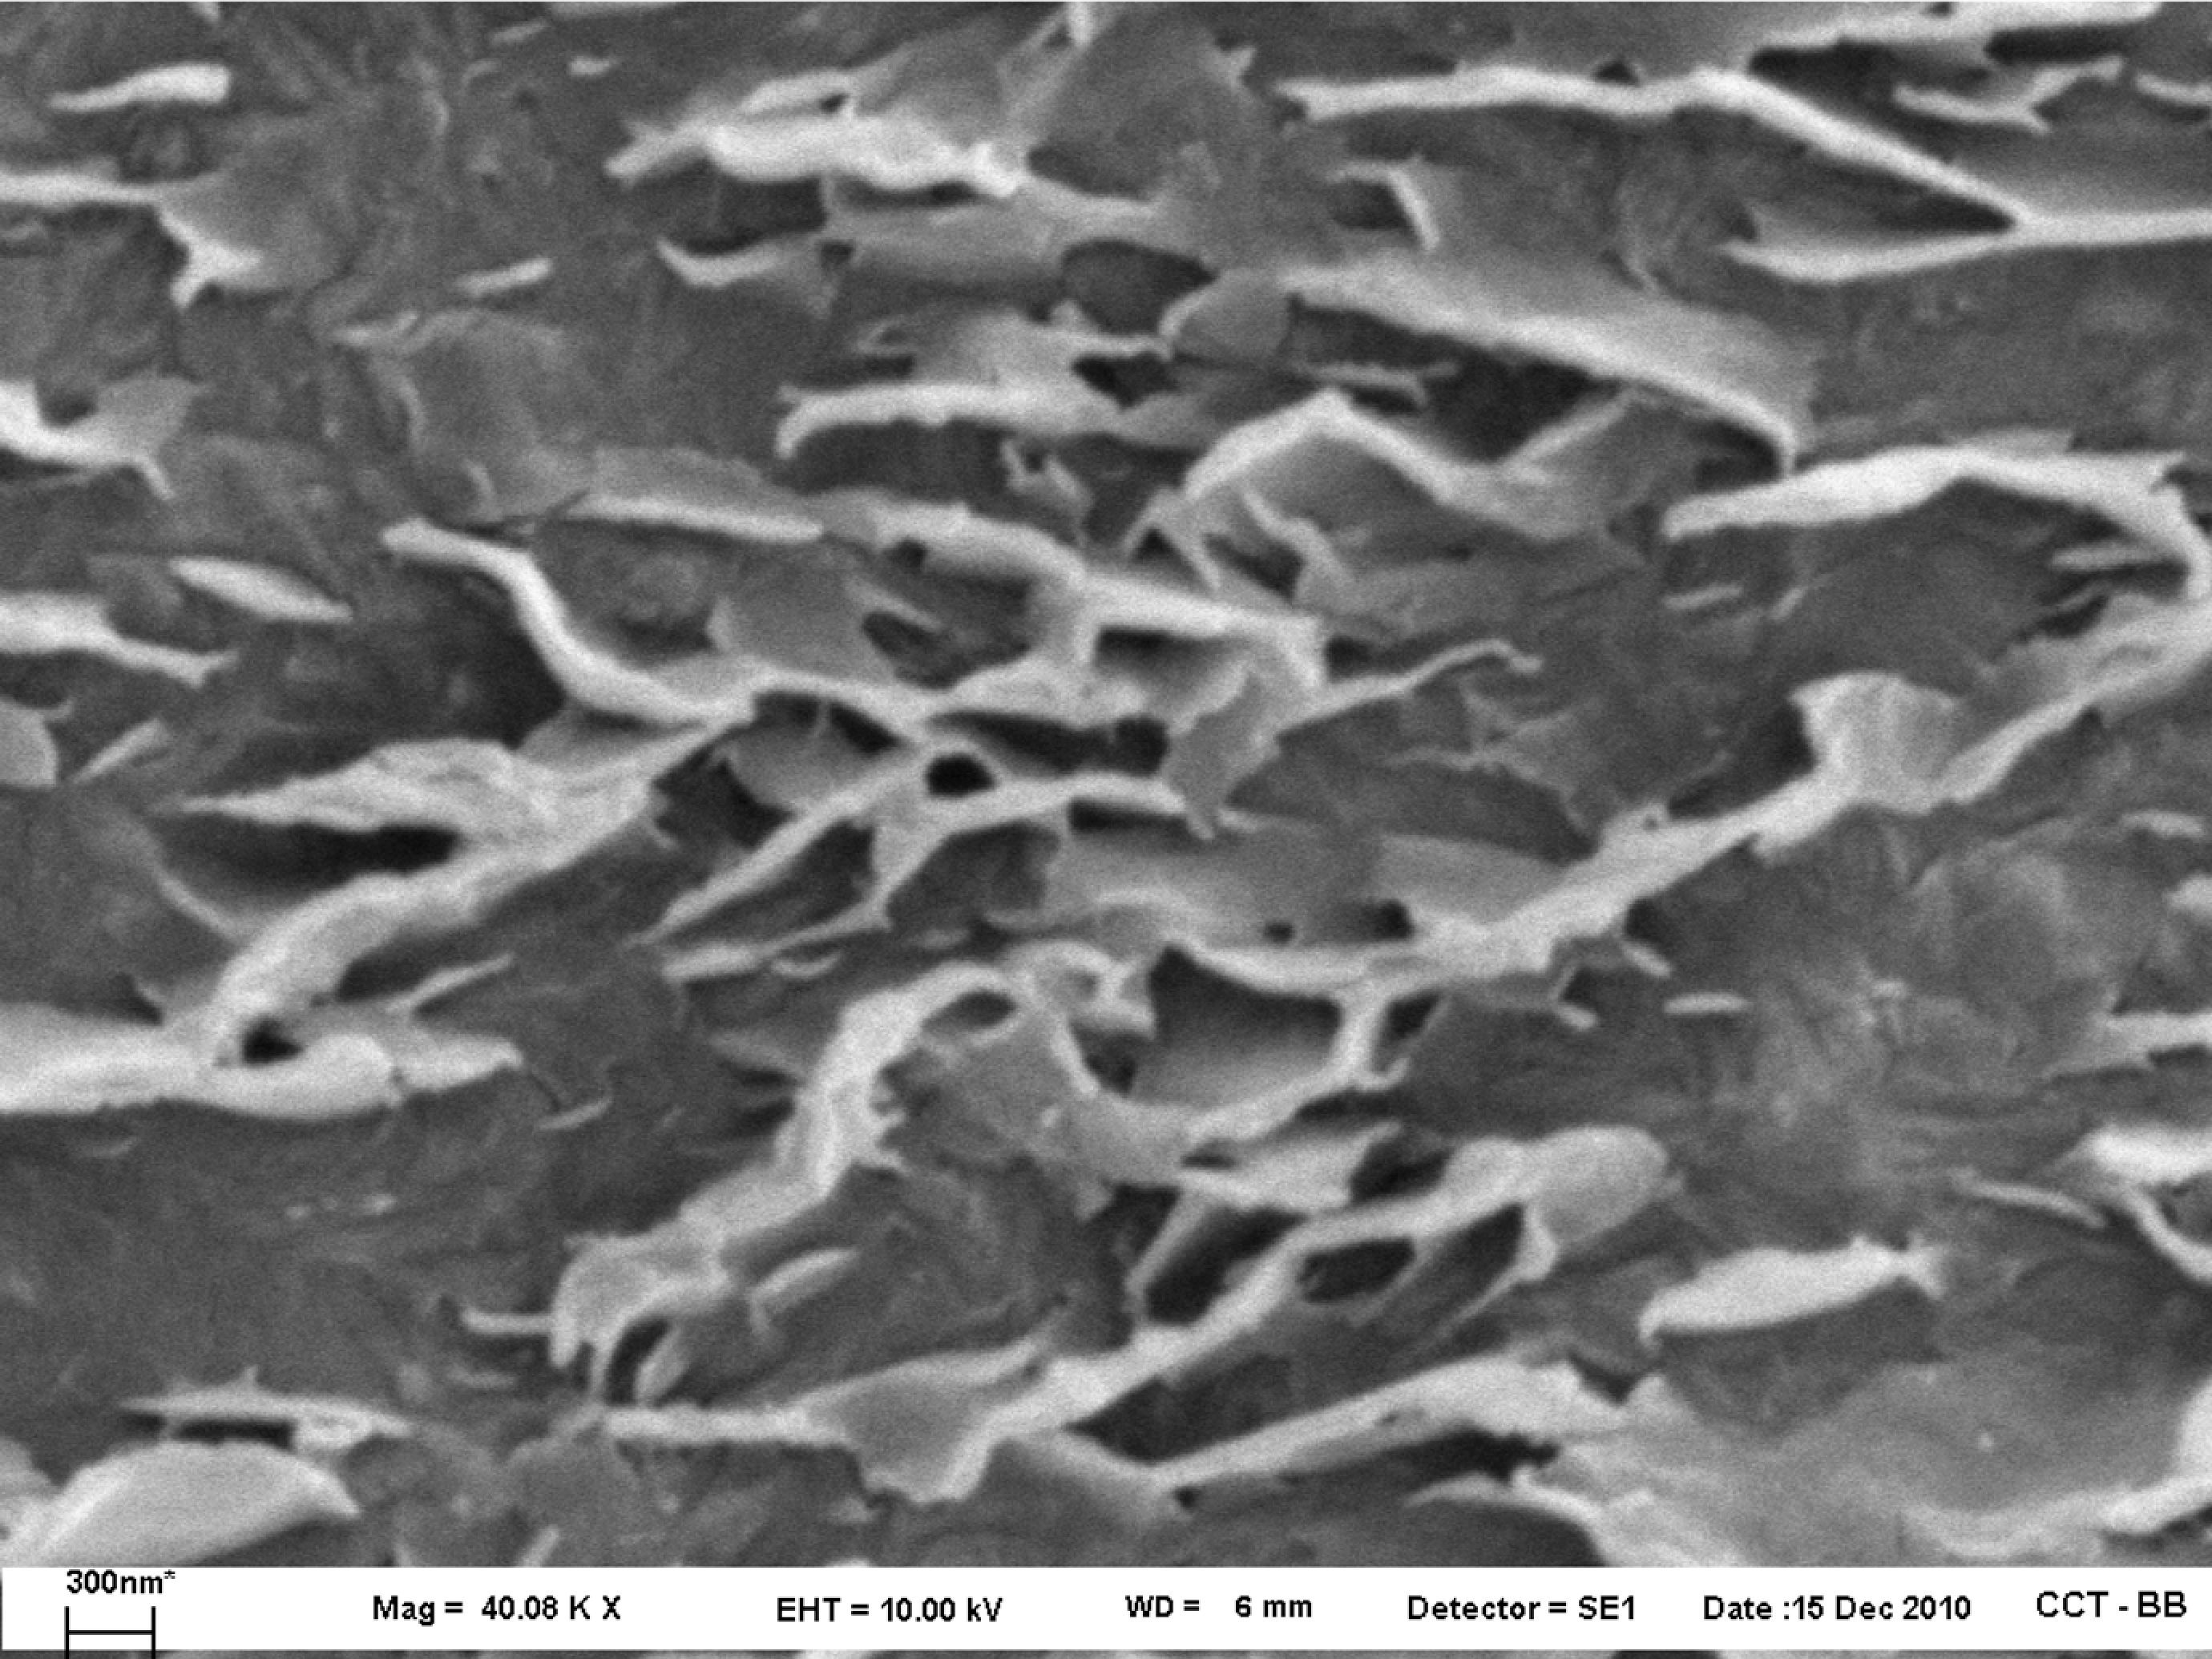
Scanning electron micrograph of PEN15 obtained at ×40,000 magnification (detail of Figure 9(e)).
Similarly, Figure 11 displays the micrographs of the composites based on 5 wt% of MMT (all obtained with a magnification of ×6000). The material with no compatibilizer (PE5) shows a smaller amount of exfoliated tactoids and some large particles unaffected by the mixing process. Among the three images of composites with PEg, the one corresponding to PEN5 shows the largest amount of well-dispersed small particles. Similarly, the image of PEN-11 shows the smallest amount of clay particles, some of which are pretty large. These results agree with those from the rheological characterization in the sense that PEg must be present to improve the exfoliation of clay particles and that the 2:1 ratio of PEg/MMT produces the best degree of delamination.
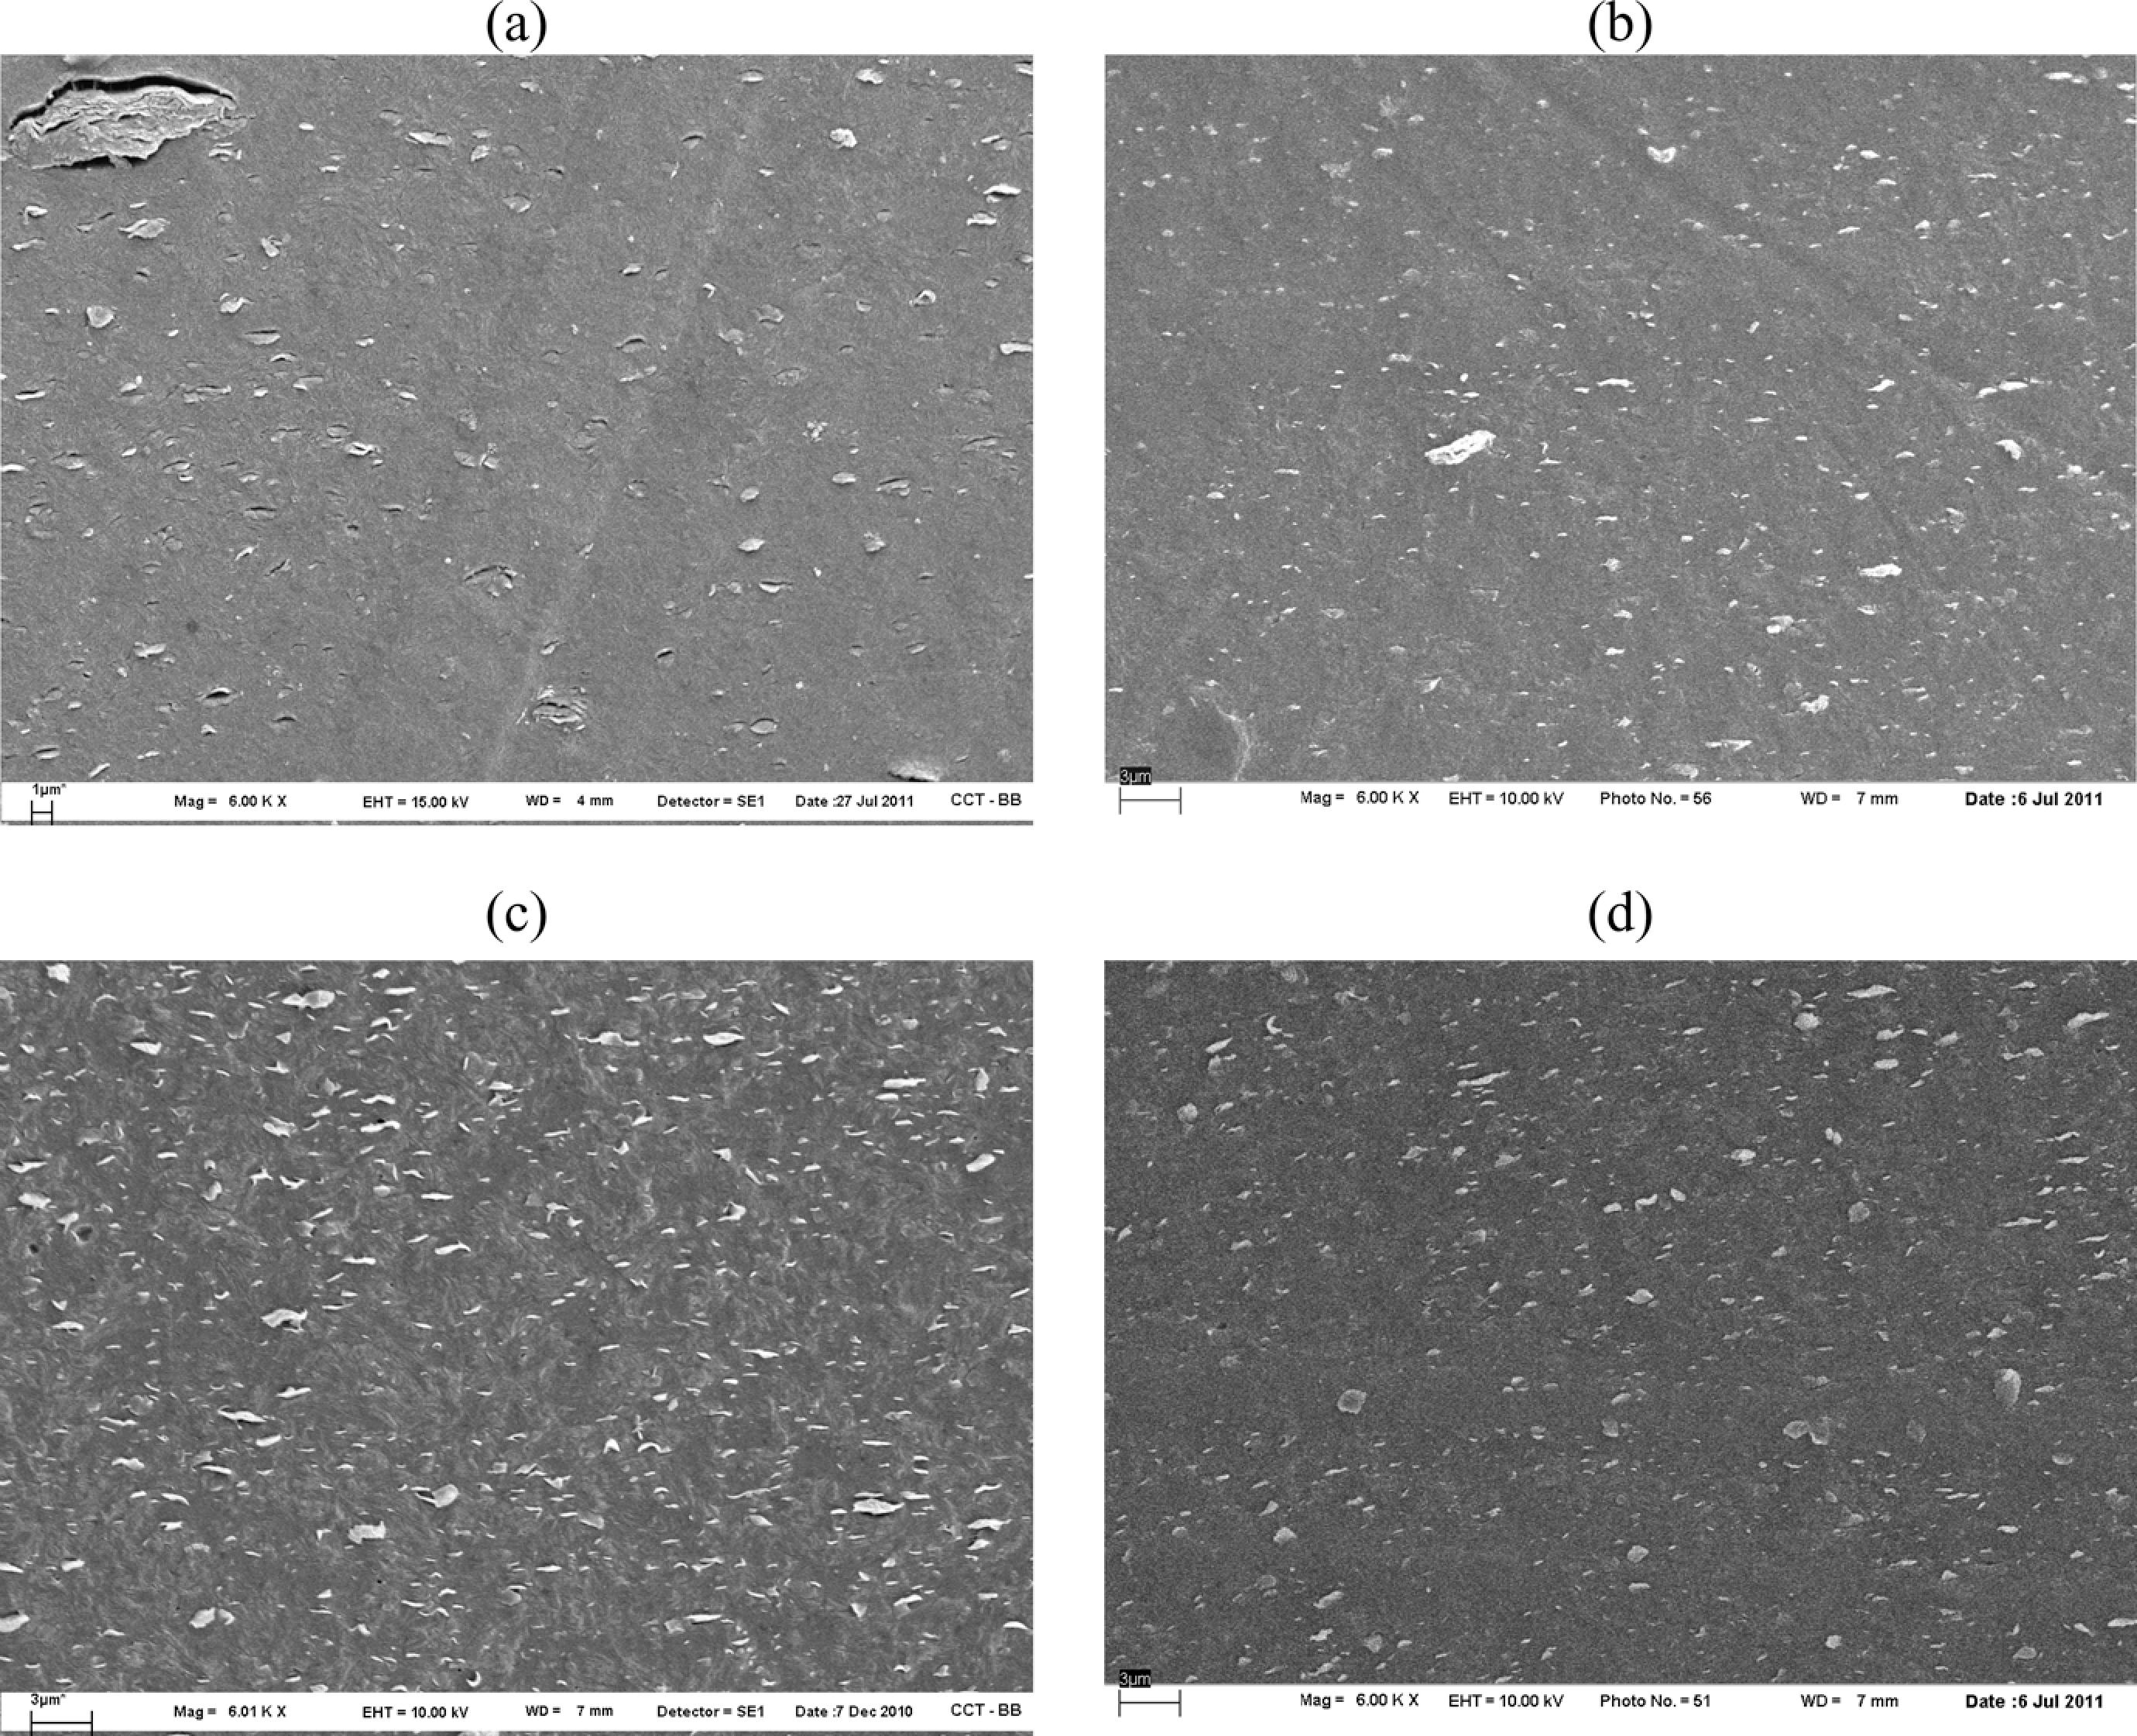
Scanning electron micrographs of PE5 (a), PEN5-11 (b), PEN5 (c) and PEN5-31 (d).
As already mentioned, another property that may be improved by the presence of nanofillers is the gas permeability. Figure 12 displays the results of oxygen permeability corresponding to the series of PENs and their matrices as a function of clay concentration. As expected, the permeability of PE is improved by the presence of silicate layers. Moreover, the data show that the oxygen permeability decreases as the clay concentration increases. The minimum permeability, which is the one presented by PEN15, is approximately 30% smaller than that of PE. Additionally, it can be observed that the permeability of PEg and PE/PEg blends (matrices of PENs) are all similar. Most authors who have studied the PE/PEg/MMT systems agree with these trends. 13,22,34,38 Moreover, calorimetric measurements show that all materials used in this study have comparable temperature and heat of fusion, which indicates similar polymeric microstructure in all of them, regardless of the concentration of clay. Therefore, the decrease in permeability observed in the nanocomposites must be associated just with the presence of the clay particles. Yet, it should be mentioned that the improvement observed in permeability with the addition of clay is not as large as the one observed by other authors. For example, Ryu and Chang 34 and Hotta and Paul 13 detected a reduction of approximately 30 and 40% in oxygen permeability when analyzing PNCs based on LLDPE/PEg/MMT using 5 and 10 wt% of clay concentration, respectively (and PEg/MMT ratios of 2:1 and 1:1). Moreover, Golebiewski et al. 38 and Arunvisut et al. 30 observed a similar decrease in oxygen permeability for LDPE nanocomposites based on 5 and 7 wt% MMT and PEg/MMT ratio of 3:1. Among the authors who analyzed the permeability of HDPE/PEg/MMT composites, Zhong et al. 20 report an increase of more than 300%, Picard et al. 19 observed practically no effect and Lotti et al. 22 claim a reduction of approximately 50%, all using 5 wt% MMT and PEg/MMT ratios between 1:1 and 4:1. In our case, the decrease in permeability of ∼30% is observed when using a much larger concentration of clay (15 wt%). The reason for these contradictory results when using HDPE and the relatively low improvement may be due to the change in volume of the polymer when it solidifies from the melt state (which is smaller in LLDPE and LDPE). The volume contraction during solidification may produce small holes and/or imperfections in the bonding between the polymer matrix and the clay, facilitating the diffusion of the small gas molecules in the films. In fact, at some magnifications of the SEM micrographs (see Figures 9 and 11), it can be observed that part of the surface of the clay tactoids and particles is separated from the polymer and that even very small holes appear in the polymeric matrices. With a similar justification, Zhong et al. 20 explained the increase they observe in permeability with the porosity of the material and a weak bonding between matrix and clay.
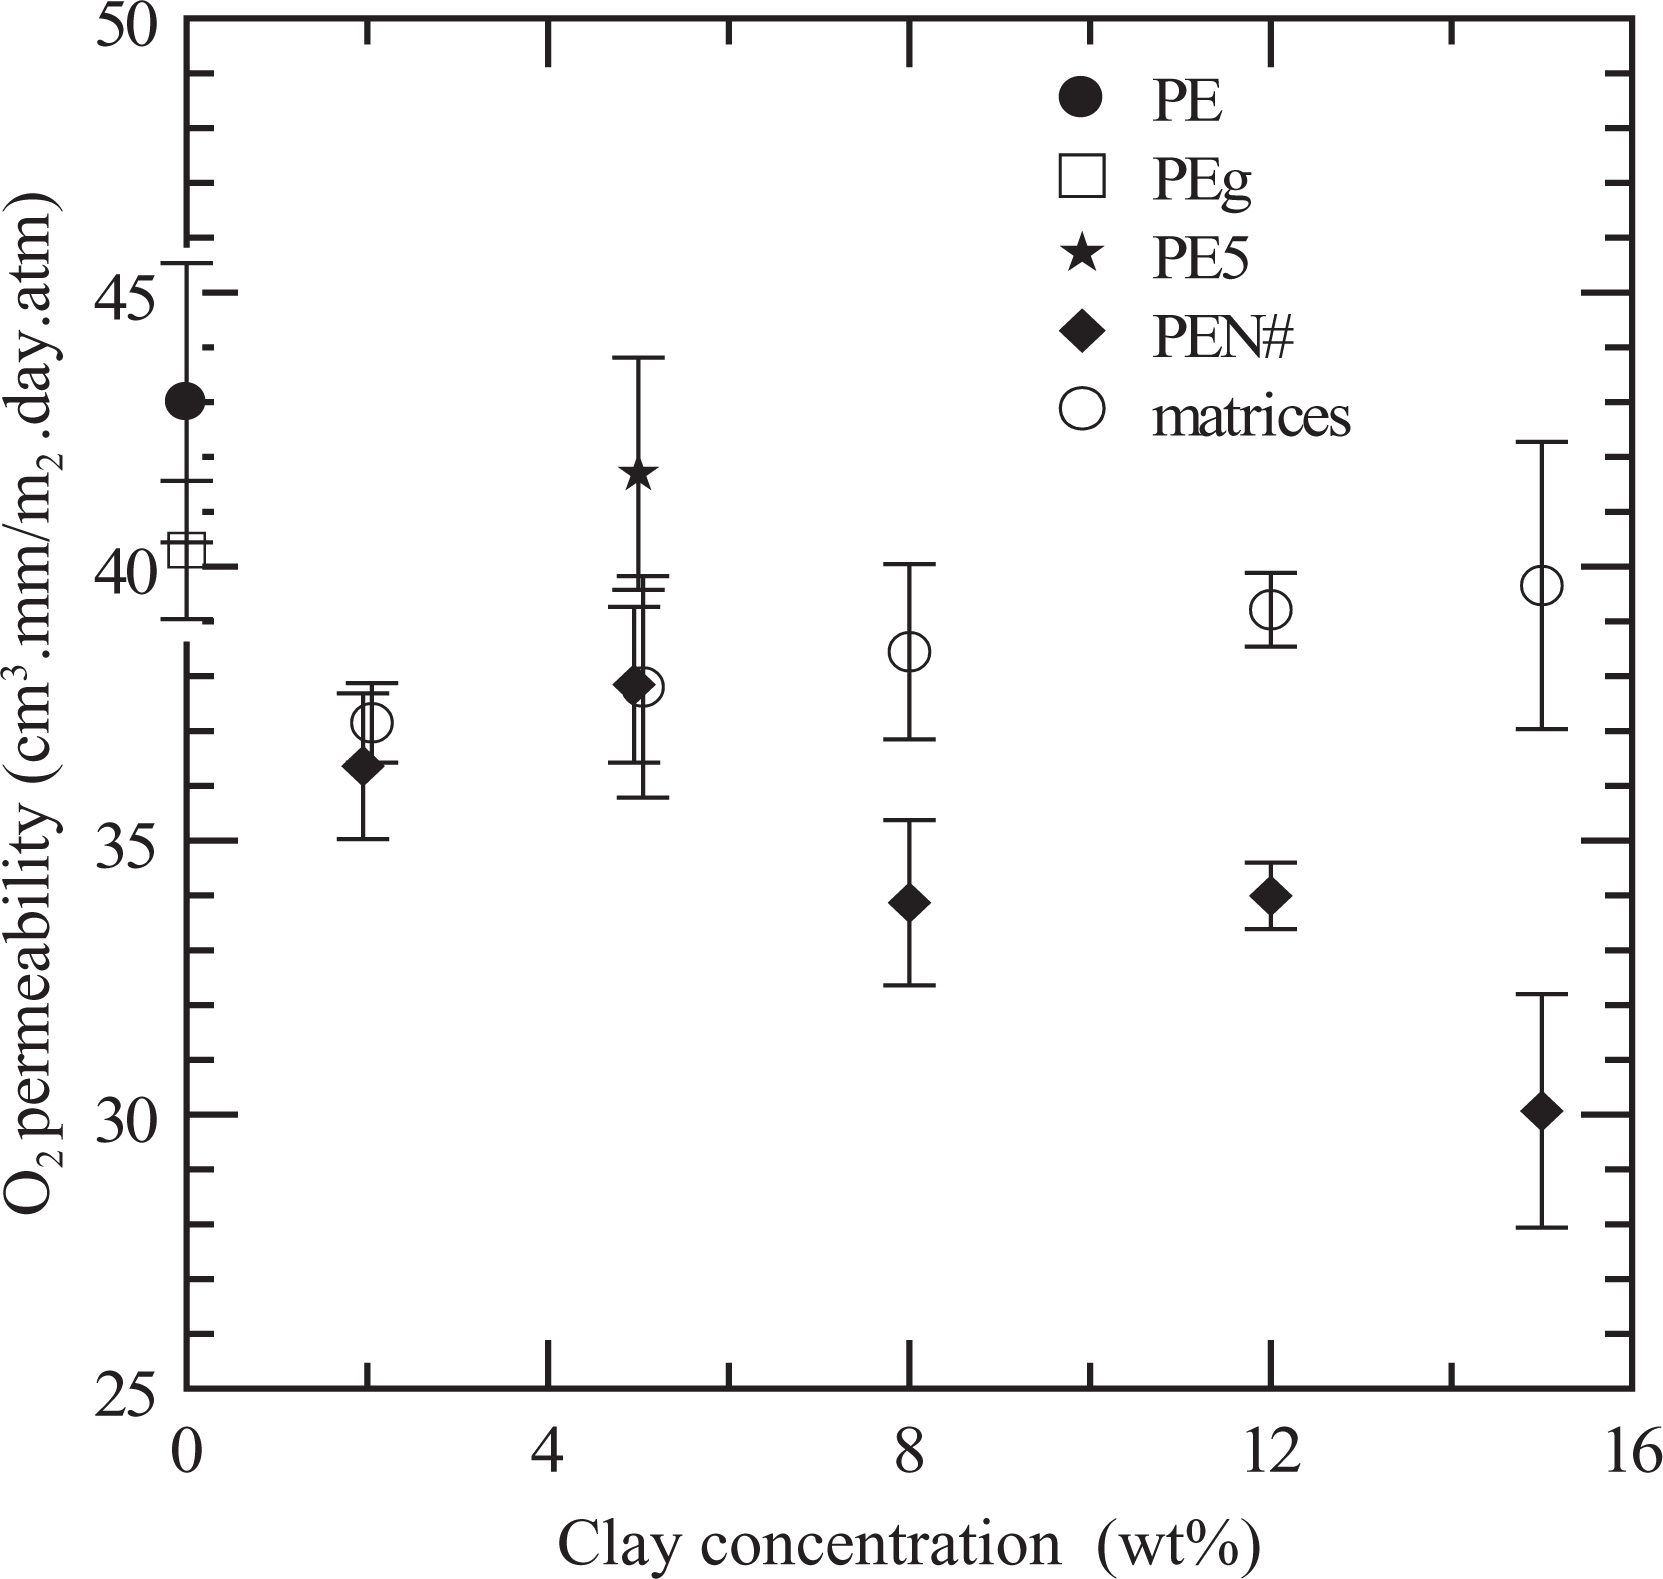
Oxygen permeability of composites and polymer matrices as a function of clay concentration.
Conclusions
We have investigated the lineal viscoelastic behavior of a series of composites based on PE, maleic anhydride–modified PE, and a commercial organophilic MMT. The presence of inorganic material has practically no effect on the dynamic moduli of the composites when no compatibilizer is added (PE5) or the amount of PEg or clay is too small (PEN5-11, PEN2). For a 2:1 ratio of PEg/MMT, the dynamic moduli of the composites increase gradually with concentration, especially at low frequencies. Simultaneously, the strain range of linear viscoelasticity gets smaller. The materials show rheological properties that are affected by annealing in the molten state signaling, further exfoliating or improving the tactoid distributions. For the annealed materials, evidence of pseudo solid-like behavior appears at clay concentrations larger than 8 wt%. The rheological results agree with observations made by SEM, which display finely divided platy forms with poorly defined shapes and very crumpled layers for all the PE/PEg/MMT composites. The original particles of 15–25 μm diameter have been exfoliated in tactoids of 3 μm maximum length in all cases.
The analysis of the infrared spectra of the composites suggests the occurrence of chemical reactions between the anhydride groups of PEg and the clay, or its ammonium surfactant, during the mixing process. This interaction may have helped in the exfoliation of the clay particles.
All PE/PEg blends display similar oxygen permeability, which is slightly smaller than that of PE. The presence of clay particles improves this property, which decreases gradually with the clay concentration and reaches a maximum reduction of ∼30% for PEN15. Calorimetric measurements show that all materials have comparable polymeric microstructure, regardless of the concentration of clay, which suggest that the decrease in permeability observed in the nanocomposites can be associated with the presence of the clay particles. The relatively low decrease in permeability, which suggests a small change in oxygen diffusion with clay concentration, is in agreement with the TGA results that show no noticeable effect on the thermal stability of the polymers in the presence of clay.
Footnotes
Funding
This work was supported by the National Research Council of Argentina (CONICET); the Universidad Nacional del Sur (UNS); and the Agencia Nacional de Promoción Científica y Tecnológica (ANPCyT).