
Abstract
Recycling of polyolefins has become a on-demand route to avoid its environmental threats. Nevertheless, drop of properties after re-extrusion necessitates use of reinforcing agents to compensate for poor mechanical properties. The incorporation of nanoparticles into plastics can boost their mechanical and rheological properties due to the hard nanocrystalline phases. This study aims to promote and identify a polyolefin-based nanocomposite by combination of TiO2 and polyhedral oligomeric silsesquioxane (POSS) at concentration of 1, 3, and 6 wt% in a twin-screw extruder. The nanocomposites were characterized for mechanical and rheological properties. Overall, the results showed that the mechanical properties were improved by adding particles up to 6 wt% loadings. The magnitude of this effect was dependent on the nanofiller weight fraction and particle size. Well-dispersion and, as a result, enhancing the viscosity, modulus, and hardness in the sample containing 3 wt% TiO2 and 3 wt%. POSS was due to the presence of hydroxyl functional groups on its surface. Glass transition temperature and crystallinity of the samples did not show a significant change due to the neutral role of nanoparticle nucleation in the matrix.
Introduction
The first polyolefins are produced based on thermoplastic polymers that melted and then solidified at room temperature as soon as they cooled. There are several reasons, such as relatively simple manufacturing and application methods, not being involved in complex curing mechanisms, having acceptable properties in many applications, and the availability of raw materials led to the widespread use of these coatings in the 1950s market.1–8 Such substances are free from volatile organic compounds (VOCs) which has made them an environmentally friendly material. 9 Different properties of the nanocomposites such as mechanical, thermal, chemical, and rheological properties are mainly controlled by the type of resin that is used. Among all kinds of polymers, polyurethanes, acrylics, silicones, polyesters, and epoxies are the most generally used resins.5,7,10,11
Mainly due to special mechanical properties and wide-spread possible applications, the preparation of nanocomposites has been intensively considered.9,12–16 Nano-sized materials, because of their intrinsic small dimension have some extraordinary properties compared to their bulkier counterparts and can solve many of the disadvantages. Hence, the concept of enhancing the mechanical properties by incorporating small amounts of nanoparticles, without having a noticeable effect on the coating’s melt viscosity, is highly respected.15,17,18 It is worth mentioning that boosting the nanocomposite properties can be achieved by incorporating nanoparticles when the nanoparticles are well-dispersed as the primary particle in the polymer matrix or with the capability of chemical interactions between polymer matrix and nanoparticles.6,19
Polyolefin-based nanocomposites provide opportunities for improving polyolefins (POs) with relatively small amounts of nanofiller concentration. POs are the most plentiful synthetic polymers, having the world's largest tonnage in terms of their production. 20 Its low cost, recyclability, good processability, non-toxicity, and biocompatibility made polyolefins common. POs have a wide variety of applications in car components, durable machinery, consumer goods, and machinery business. However, for specialized/engineering applications, the physico-chemical and mechanical properties of polyolefins need to be enhanced by incorporating new functionalities, adding nano-fillers to the matrix, changing the polymer matrix, and synthesizing a new form of polyolefin such as disentangled ultra-high molecular weight polyethylene. 21
Most of the research focused on polymer nanocomposites based on nanofillers such as metal oxides, CNTs, carbon black (CB), and layered silicates to improve the mechanical, thermal, electrical, and gas barrier properties.22,23 The effects of nanoparticles on the Tg of polymer composites have been extensively studied in previous research.24–27 In some cases, increasing nanoparticles to polymeric matrices can significantly increase Tg of composites.26,28,29 Researchers believe that the adsorption interactions between the polymer and the filler lead to the absorption of polymer chains on the surface of the filler particles, resulting in Tg growth. 30 In other cases, nanoparticles do not affect the dynamics of polymer chains31–33 or even lead to a decrease in the Tg of composites.29–31
Another nanomaterial that has received a lot of attention in recent years is Polyhedral Oligomeric Silsesquioxane (POSS). These compounds are the smallest silica structures that can be soluble in organic compounds such as resins and polymers. Due to the lack of this feature in nanoparticles, it is difficult to disperse them in the polymer matrix. Polyhedral Oligomeric Silsesquioxane compounds are produced by the condensation reaction of organic silane compounds. 34 In general, the use of POSS to improve the properties of linear polymers has been widely reported.35,36 Polyhedral Oligomeric Silsesquioxane can also be grafted to polymer chains by chemical processes involving functional organic groups resulting in creation of chemical bonds.37,38 There are some studies on the thermoplastic matrix associated with POSS,39,40 but the number of reports on the use of POSS on thermoplastic nanocomposites is negligible. The purpose of this study is to produce, apply and characterize the effect of micro- and nano-TiO2 and POSS (pre-dispersion method) in a thermoplastic matrix at concentrations 20 wt% of micro-TiO2, 1, 3, 6 wt% of micro TiO2, and 3 wt% nano-TiO2+3 wt% POSS, evaluating the physical, mechanical, and rheological properties resulting from the addition of these nanoparticles. One of the benefits of adding filler, nano- and micro-, to polymeric matrices is to enhance the property of them. In this regard, nanofillers can improve the properties of polymers in small amounts, most of the time less than 10–15 wt% (weight percent). In this work we observed that the properties of the polyolefin have increased more in the sample CN-6 containing 6% nanofiller than the sample CM-20 containing 20% microfiller.
Experimental
Materials
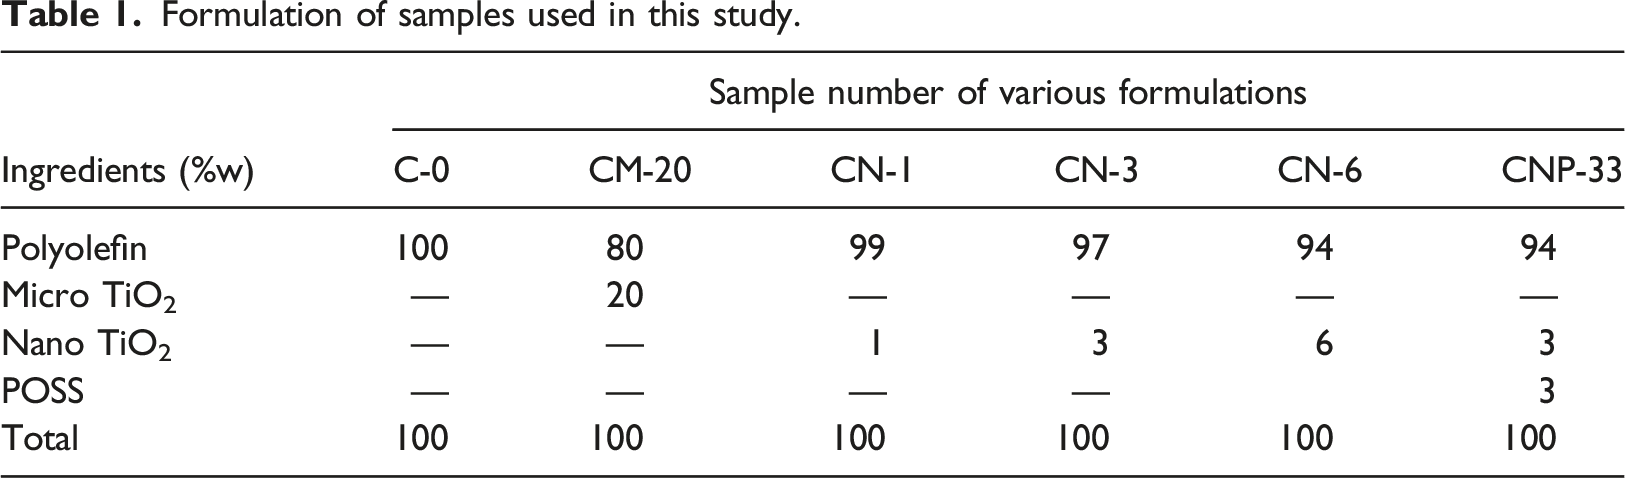
Formulation of samples used in this study.
Sample preparation
Nanocomposites containing various types of particles were prepared through the melt mixing procedure. At first, all particles were kept in a vacuum chamber for 1 h at 100°C. All materials, including the resin, micro, and nano-particle, were weighed and physically mixed. The compounds of the pre-mixed samples were then simultaneously fed into a twin-screw extruder ZSK25 (Coperion, Germany). Due to the shear forces acting on the material during extrusion, particles’ aggregates were split off, leading to a homogeneous filler dispersion in a polymer matrix. The hot melt materials were converted into cold, stiff, and brittle string by transferring them through cooled rollers. In the cooling stage, the final procedure was to break the extrudate into small pellets of around 5–10 mm in diameter using rotating blades mounted at the end of the cooling stage. The same procedure was performed for the sample containing POSS. The only difference was the mixing machine (internal mixer) used for the melt mixing due to the small amount of POSS.
Mechanical properties
Tensile testing was conducted at room temperature with the STM-50 SANTAM instrument according to ASTM-D 638. Tensile strength and Young’s modulus were evaluated with an extensometer at a crosshead speed of 10 mm/min. The values for each composition were determined and reported as averages of three specimens.
Shore D
The hardness of samples was measured using a hardness tester (Zwick 3124, Germany) based on the ASTM D2240 test standard. The samples’ dimension was 4.0 × 4.0 × 0.2 cm3. Five replicate tests were performed for each sample, and the average value was reported.
Dynamic Mechanical Thermal Analysis (DMTA)
DMTA analysis was conducted on all samples in a tensile mode using the Triton model Tritec 2000, under a nitrogen atmosphere. The temperature was raised from −30 to 220°C at a consistent rate of 5°C/min. During measurement, the material's glass transition temperature (Tg) was determined as the temperature position of the loss tangent (tan δ) peak.
Scanning electron microscopy (SEM)/EDAX
Using Vega 3-TESCAN combined with energy dispersive X-ray spectroscopy (EDAX), SEM micrographs of all samples broken in liquid nitrogen were obtained. The samples were placed on a conductive stage and covered with a thin (about 10 nm) of Au for 75 s and analyzed using the secondary electron mode scanning electron microscope at a 20 kV energy beam. Using the Dot-mapping approach, EDAX was taken from the surface of the samples.
Rheological properties
Frequency sweep mode was performed at 230°C on a RADII instrument to evaluate the melt rheology in the linear viscoelastic region. The test was carried out within the 0.1–600 rad/s frequency range. Hot pressing was used to prepare sample disks with a diameter of 25 mm and a thickness of 2 mm at 190°C.
Differential scanning calorimetry (DSC)
The DSC studies showed the crystallization manner of neat and loaded samples utilizing Maia DSC200F3 constructed by NETZSCH Co. A few milligrams of samples were placed in DSC aluminum pans. Thermograms were then reported at a constant rate of 10°C/min from −40°C to 260°C under N2 purge. Three consecutive thermal cycles with the following program were used for samples: heating, cooling, and heating. Melting enthalpies were determined by integrating the endothermic peaks between the Tmelt onset, and Tmelt endset limits, and were used to estimate the degree of crystallinity.
XRD
The X-ray diffraction (XRD) was performed on an X-Pert Pro Panalytical instrument equipped with Ni-filtered CuKα radiation, the wavelength of 0.154, the voltage of 35 kV, and a current of 25 mA. Diffraction patterns were measured over a diffraction angle of 2θ = 5− 70°.
Results and discussion
XRD
The results of the XRD test for pure TiO2, pure POSS, C-0, and CNP-33 samples are shown in Figure 1. The index diffraction peaks of Rutile TiO2 appear at 2θ = 27.58° and θ = 54.4°.41–45 The XRD diagram for pure POSS showed two peaks at 7.66° and 19.57° related to the cage-like and amorphous structures, respectively.46,47 The XRD pattern for the CNP-33 nanocomposite showed that the pure POSS peaks were removed, indicating the appropriate miscibility of POSS with the polymer matrix.
48
Also, due to the small size of TiO2 crystals in the composite, the intensity of TiO2-related peaks in the CNP-33 pattern is lower than in the blank sample.
49
XRD pattern diagram of Pure TiO2, Pure POSS, C-0, and CNP-33 nanocomposites.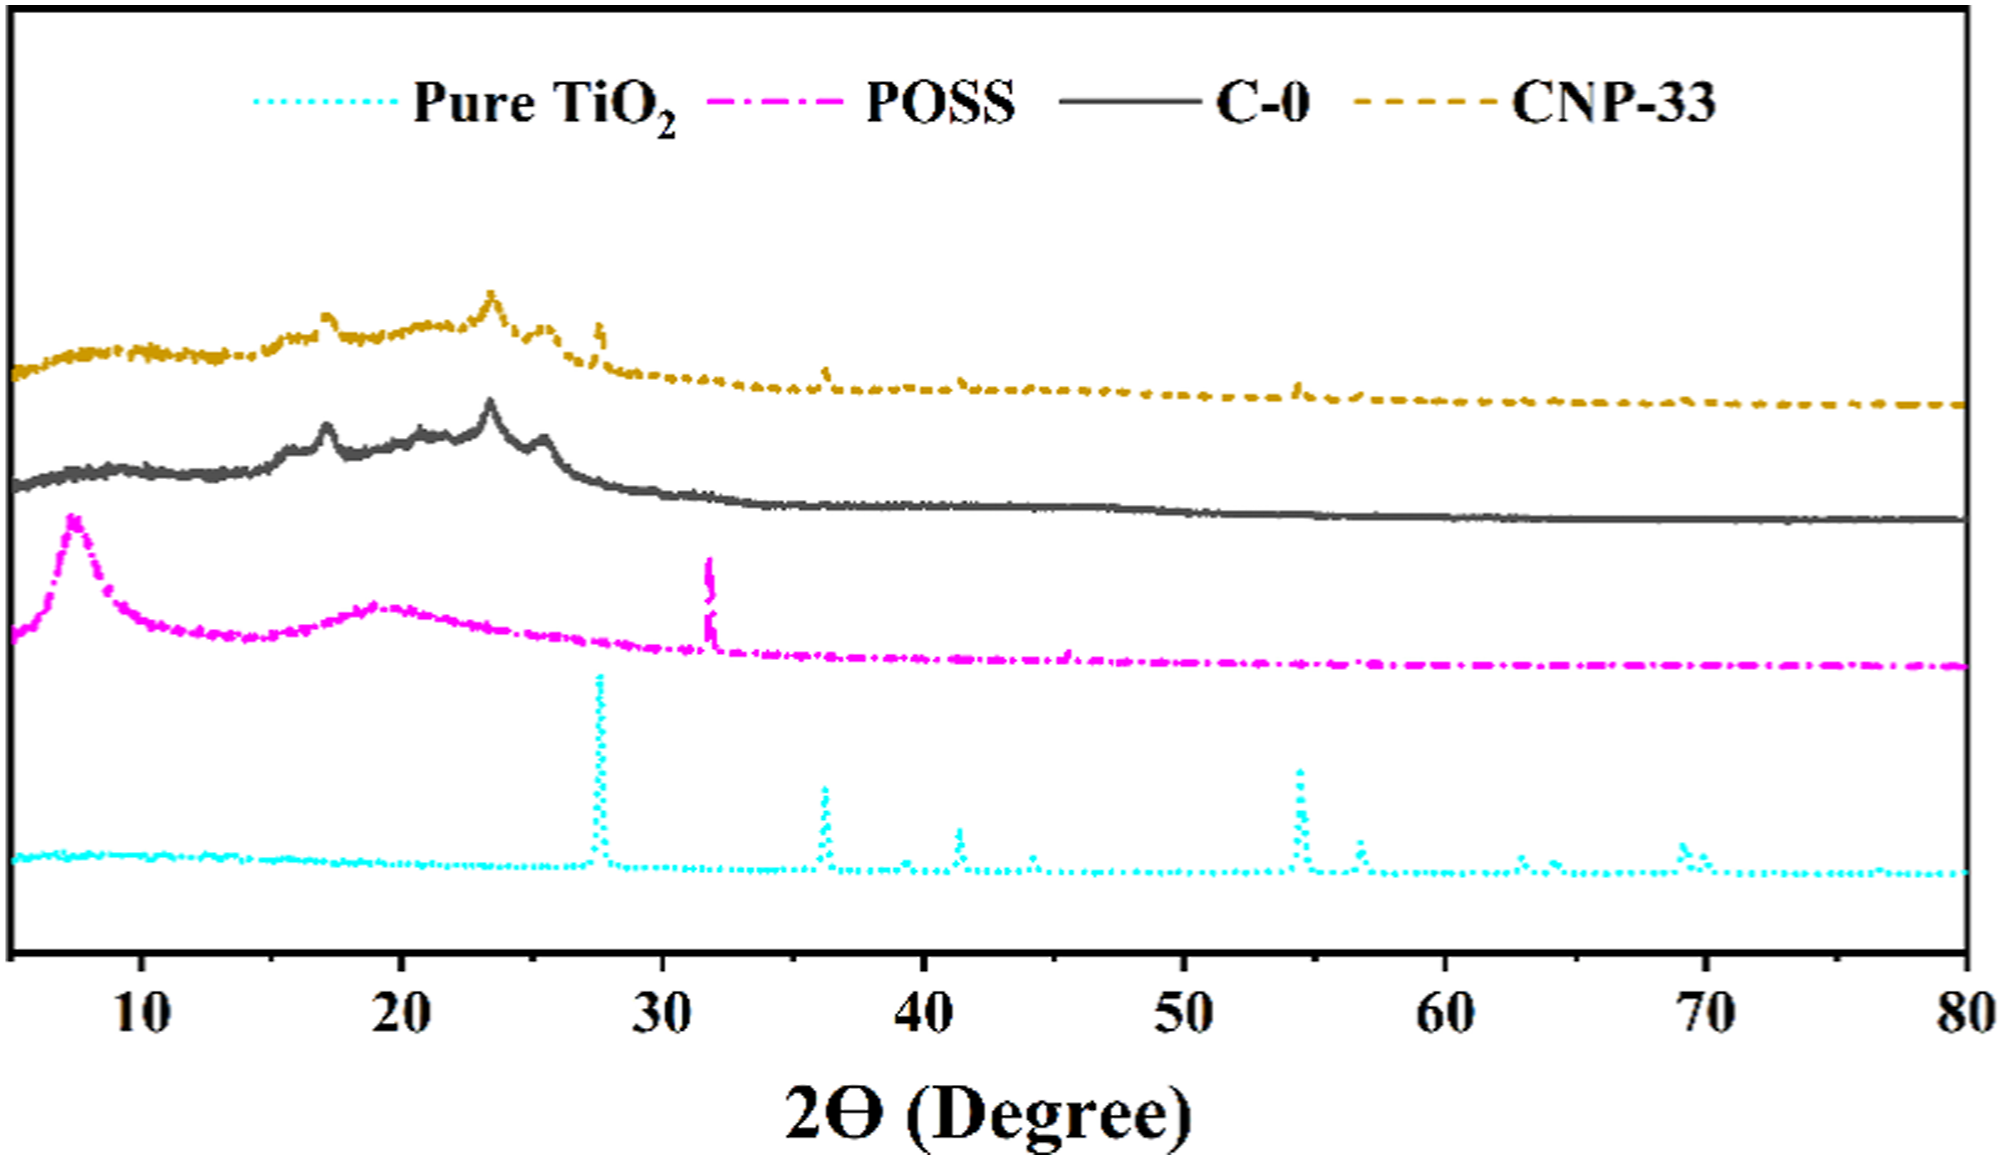
SEM
Figure 2 compares the SEM micrographs of samples with the same magnifications. At 1 wt% loading, TiO2 nanoparticles are separate and easily recognizable, but as their content increased up to 6 wt%, the interparticle distance was reduced, resulting in the formation of aggregates in the polymer matrix due to the strong interaction of nano-TiO2 particles with each other.
50
In the CNP-33 sample, as shown in. SEM images of samples (a) CM-20, (b) CN-1 (c) CN-3 (d) CN-6, (e) CNP-33.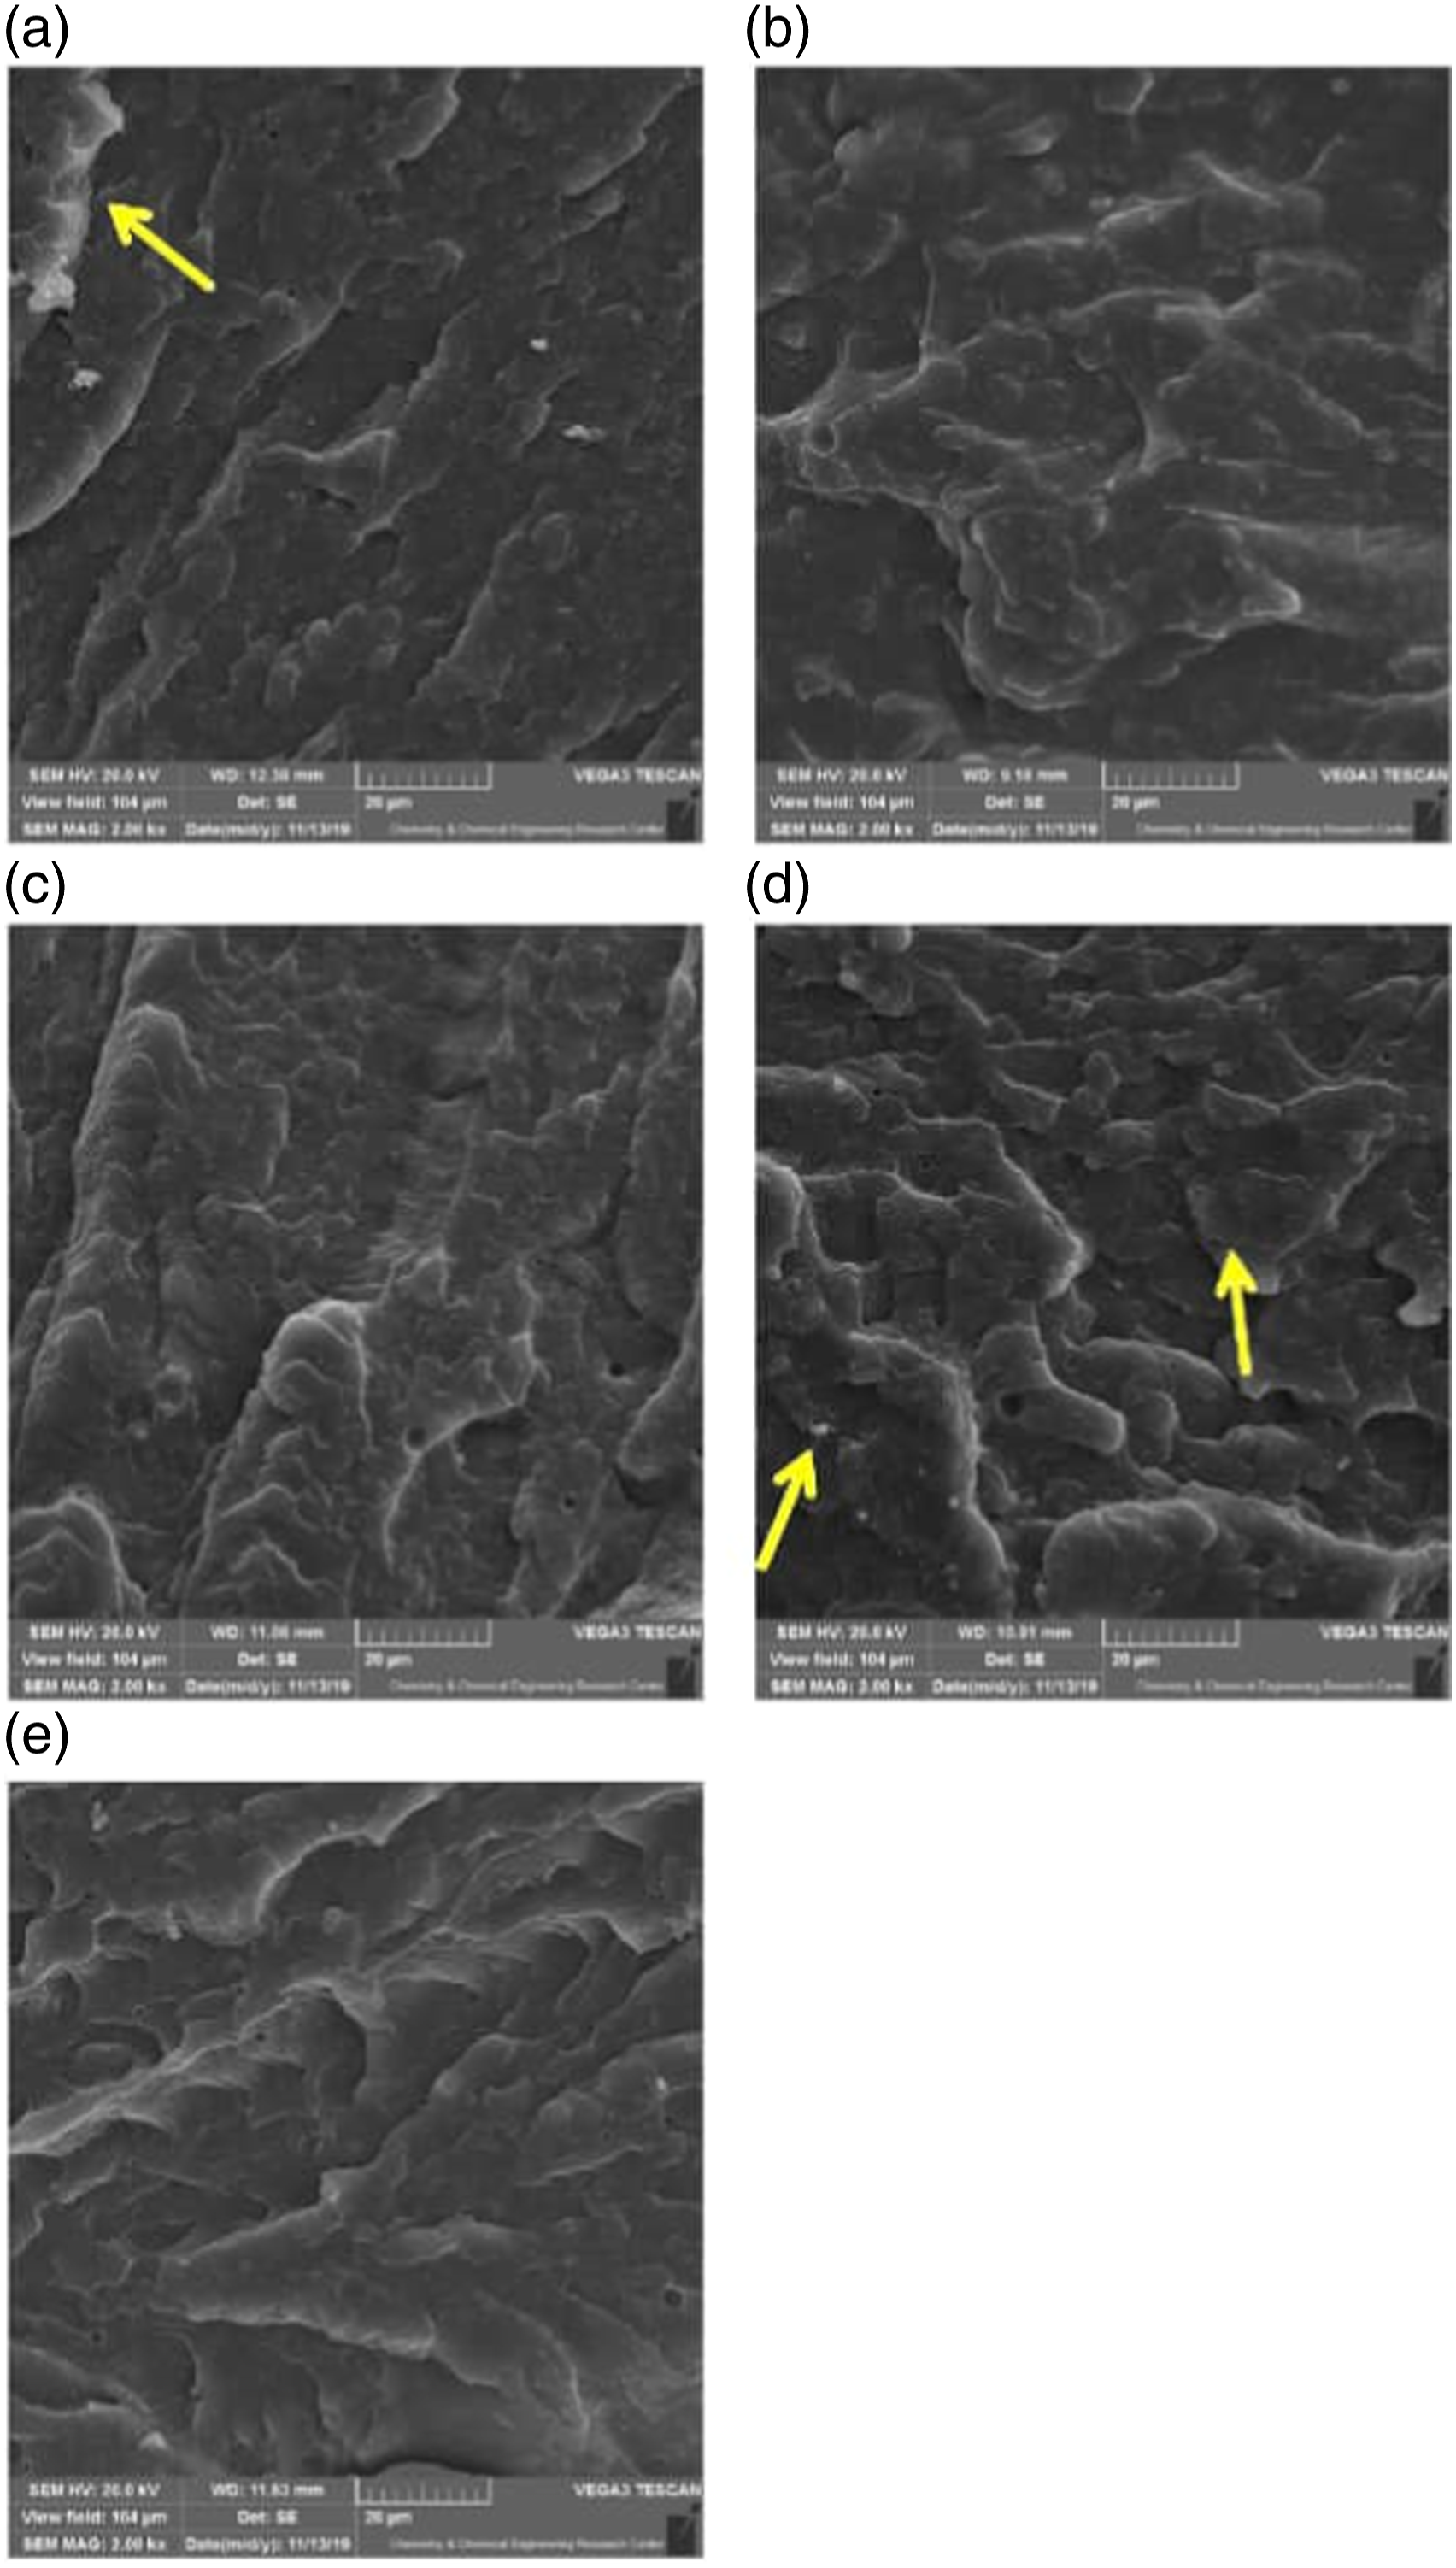
Figure 2(e), the aggregates are much smaller due to the presence of POSS and its organic groups leading to the formation of chemical bonds. 38 The average size of the aggregates (determined by image analysis with ImageJ software) in nanocomposites CM-20, CN-1, CN-3, CN-6, and CNP-33 was estimated to be 2.09, 0.95, 1.20, 1.90, and 1.10 μm, respectively. These values point to the intensified aggregation with increasing filler loading, which can be associated with mutual particle-particle interactions and reduced interparticle distance. Such an effect is typical for applying TiO2 fillers in polyolefin matrices. 51 The CNP-33 sample, because of POSS presence, the average size of aggregate decreased compared to the sample with the same filler percentage (CN-3). Other researchers also noted the disaggregation effect induced by POSS presence. 52
Further analysis of the bulk of the samples was carried out using the EDAX technique, which mapped each part. Figure 3 demonstrates the mapping observations for samples of different particle content. These micrographs showed the proper filler distribution and presence of different particles in prepared composites. The presence and relatively good dispersion of these particles into the polymeric matrix can also explain the improvement of the mechanical properties of the samples. EDAX analyses results samples (a) CN-1 (b) CN-3 (c) CN-6, (d) CNP-33 (elemental mapping images).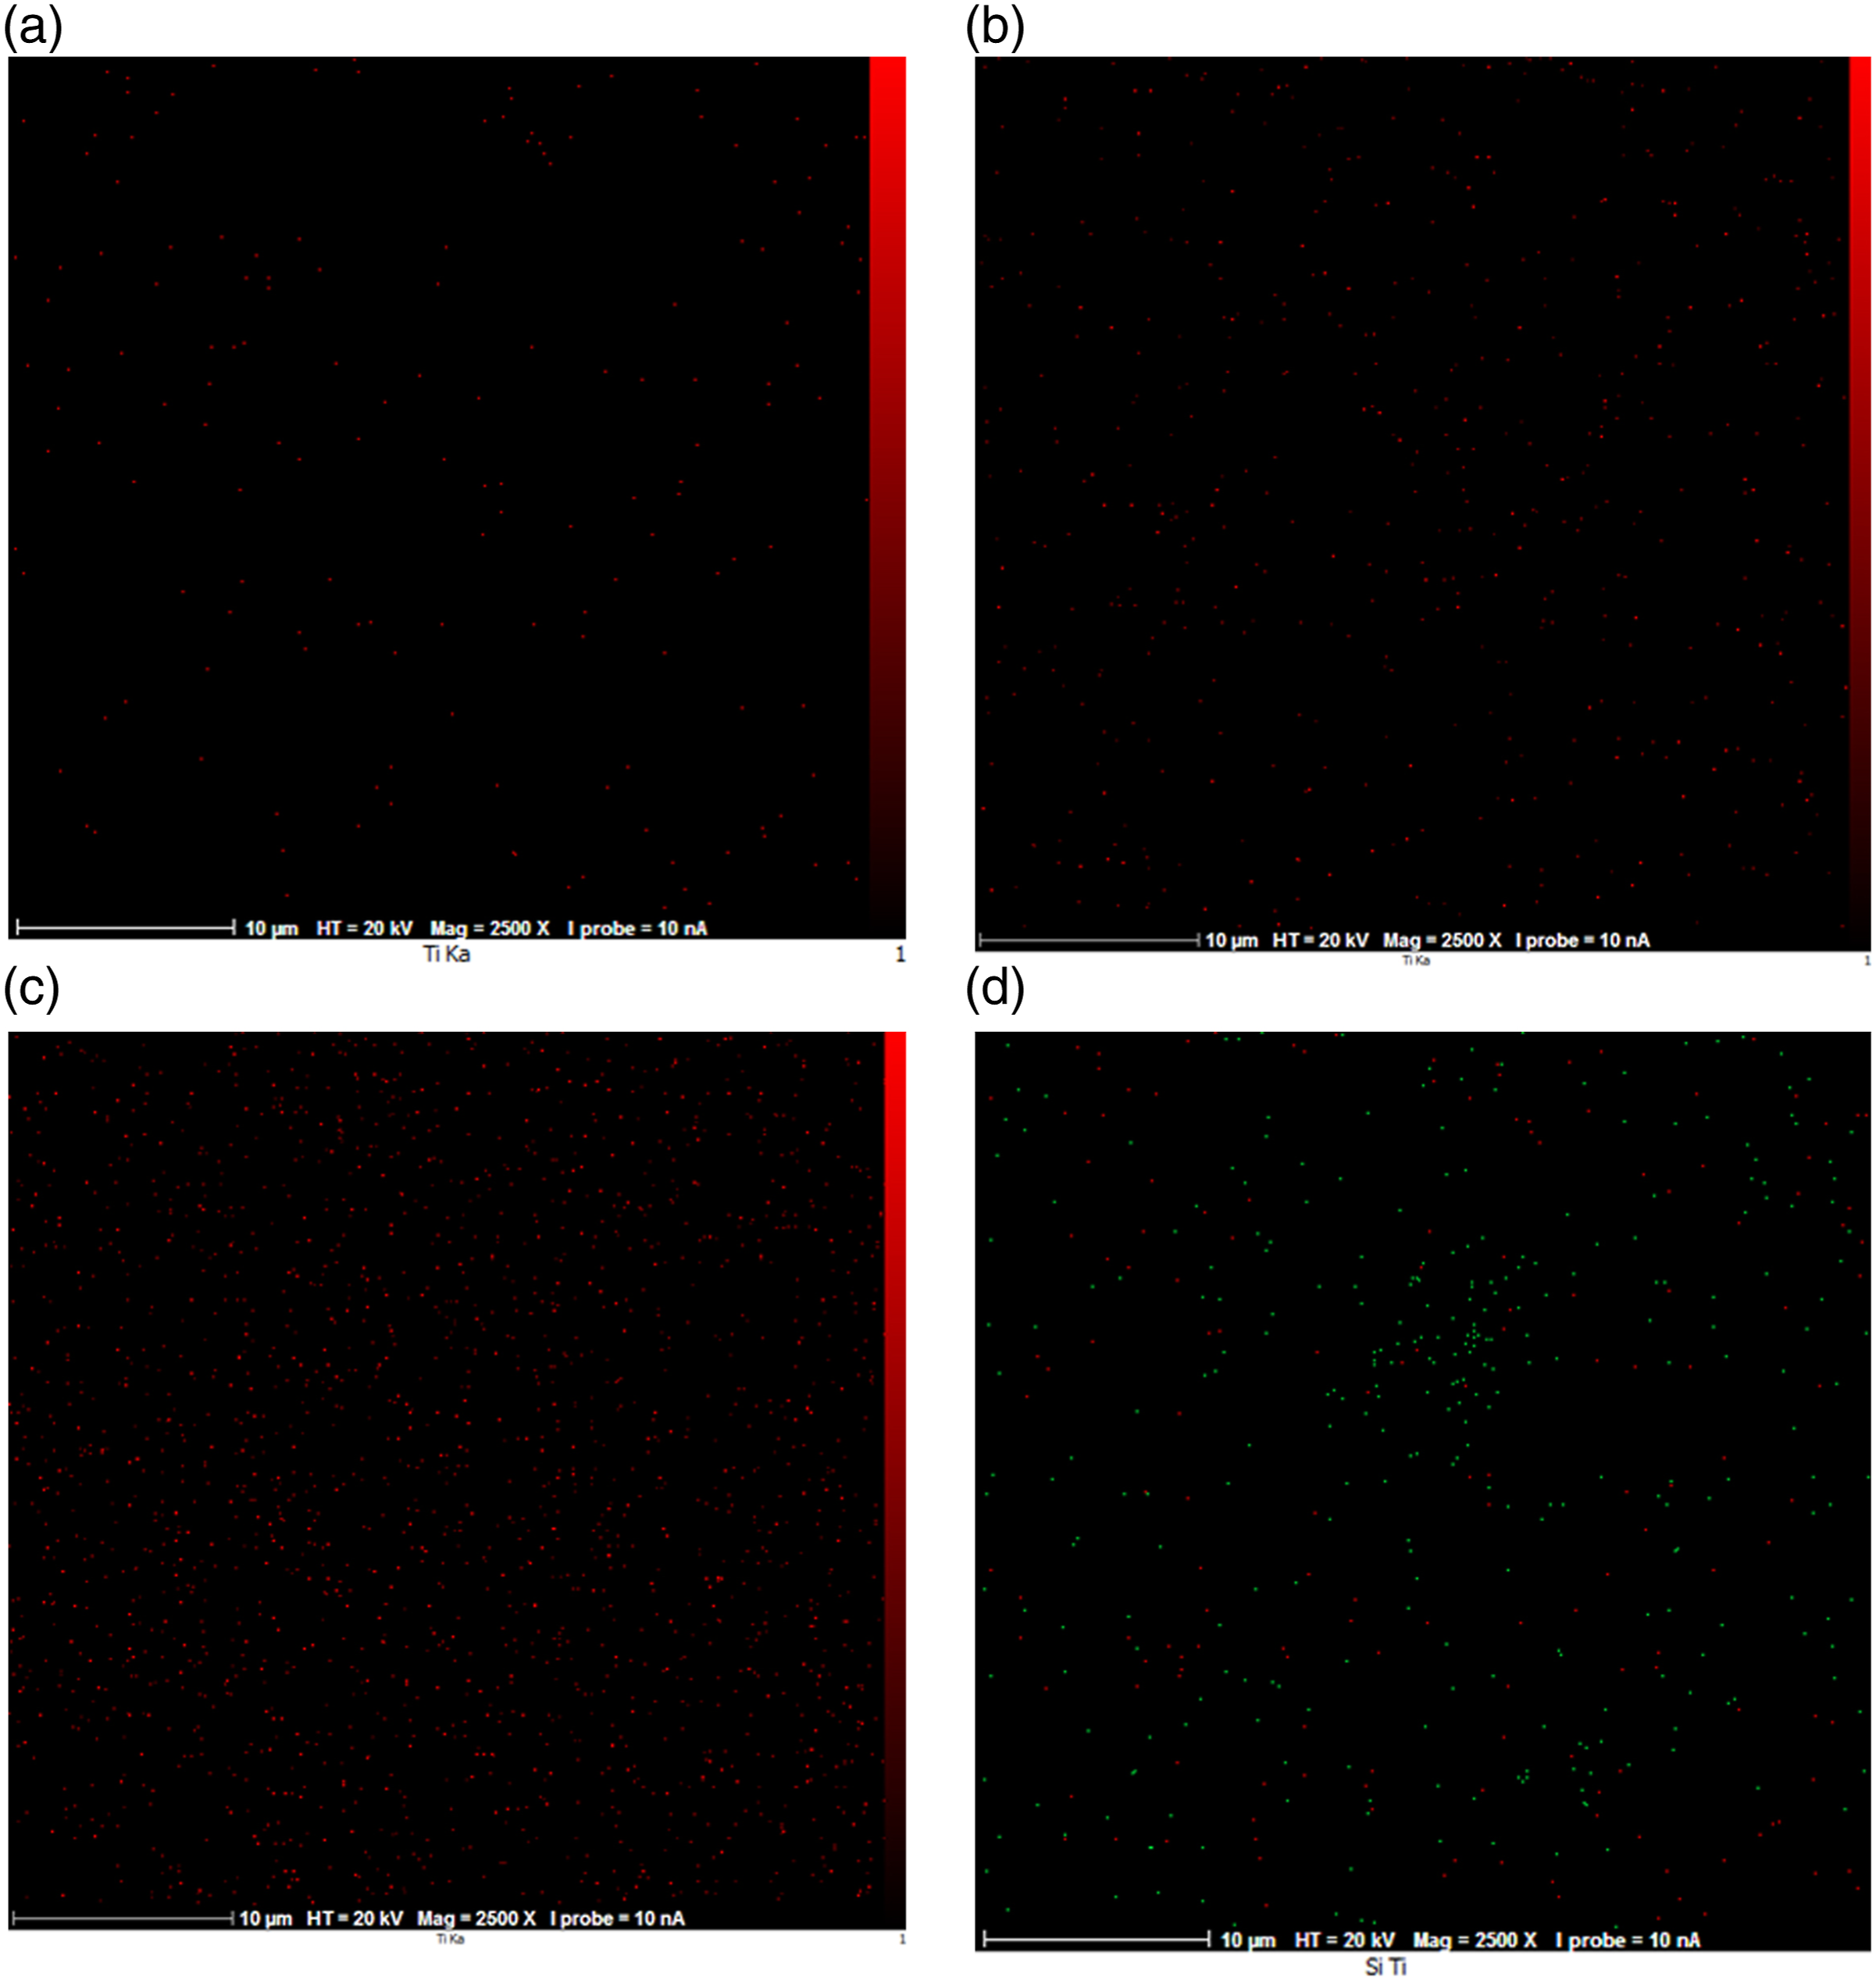
DSC
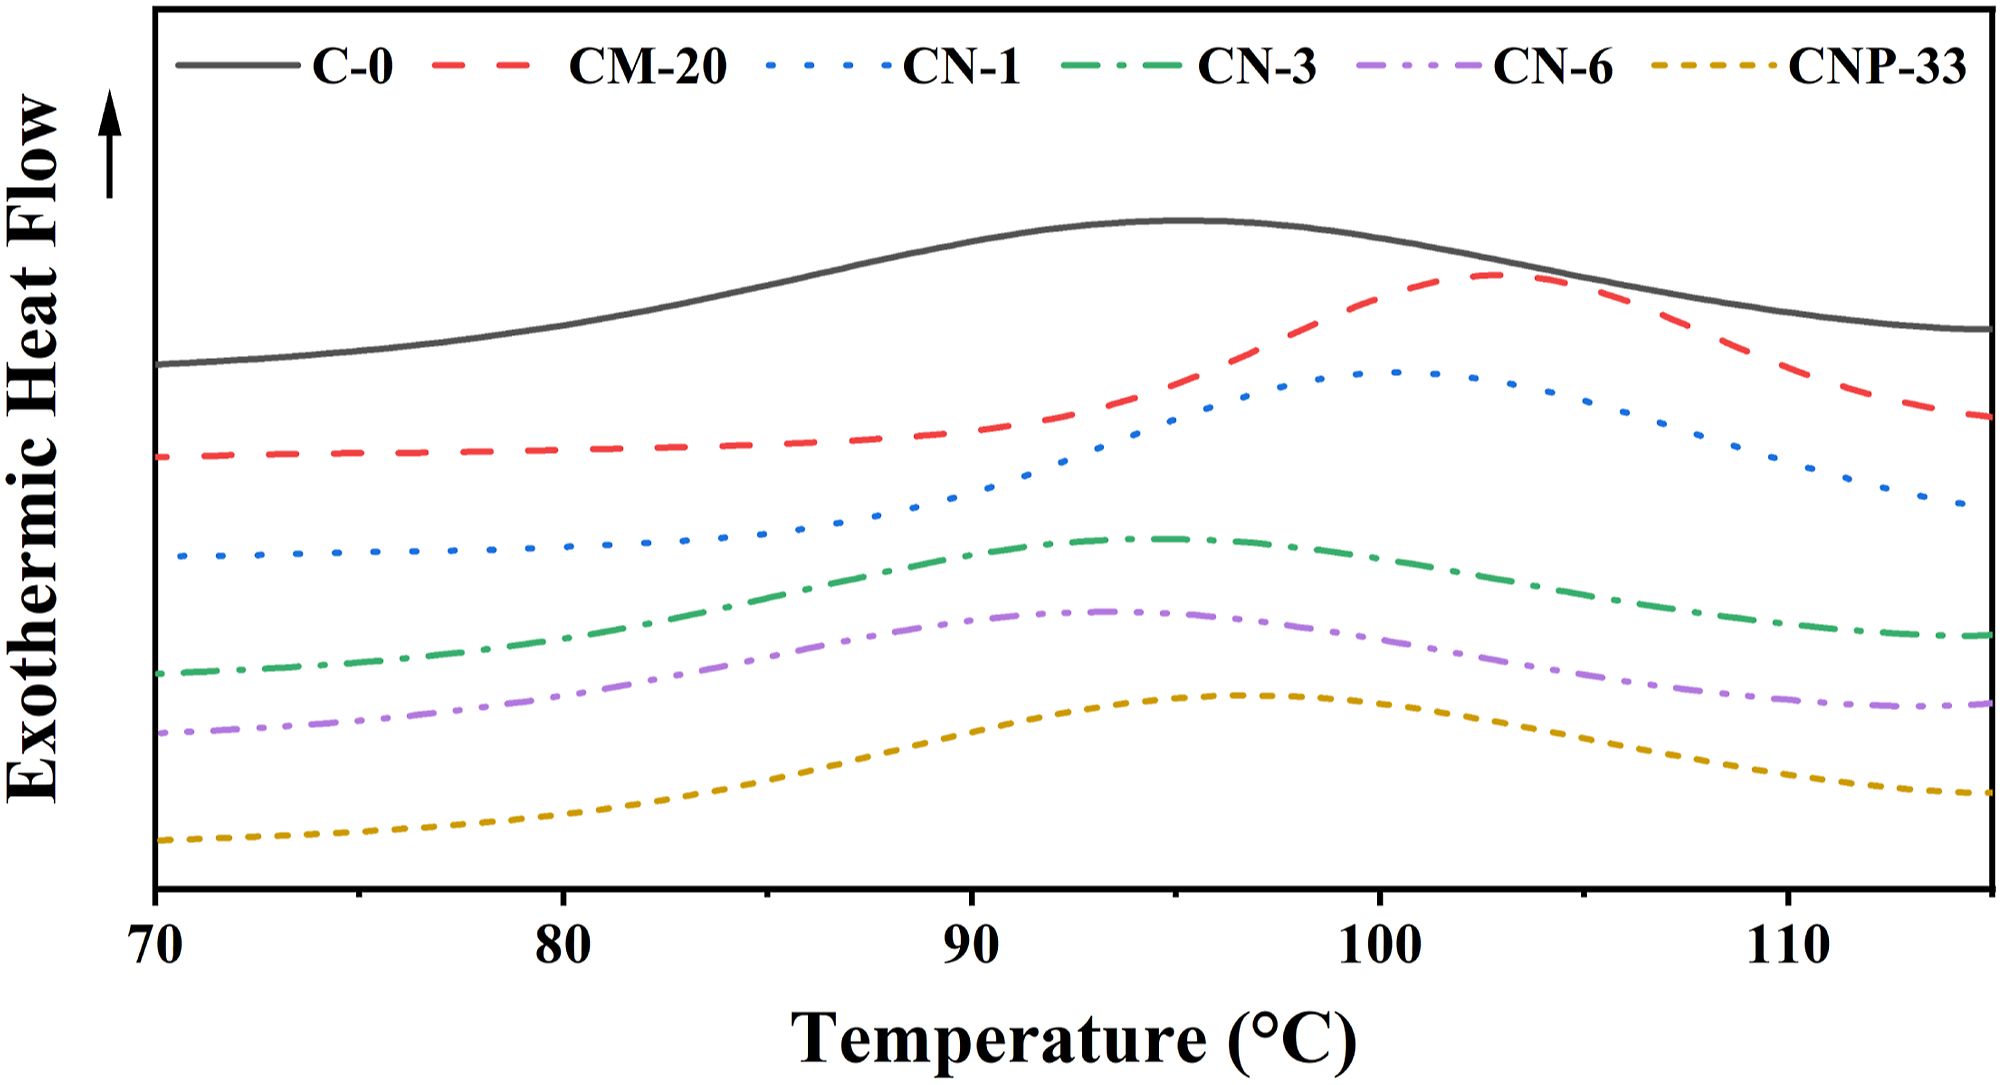
The DSC diagrams for Tm of the prepared composite samples in the second heating after the thermal history was removed are depicted in Figure 4. Also, the DSC cooling diagrams used to determine the Tc of prepared composite samples are shown in Figure 5. The presence of micro/nanoparticles showed a hardly significant effect on Tm, except for the CN-3 sample with 3 wt% nano-TiO2. A 2°C increase is observed compared to the pure sample, which can be neglected. The small peak appearing before the melting zone of the samples is related to the recrystallization of the polymer before melting.
53
As shown in Figure 5. Tc curves in the DSC diagram of composite samples containing different contents of filler. Tm curves in the DSC diagram of samples containing different contents of filler. Tc curves in the DSC diagram of composite samples containing different contents of filler.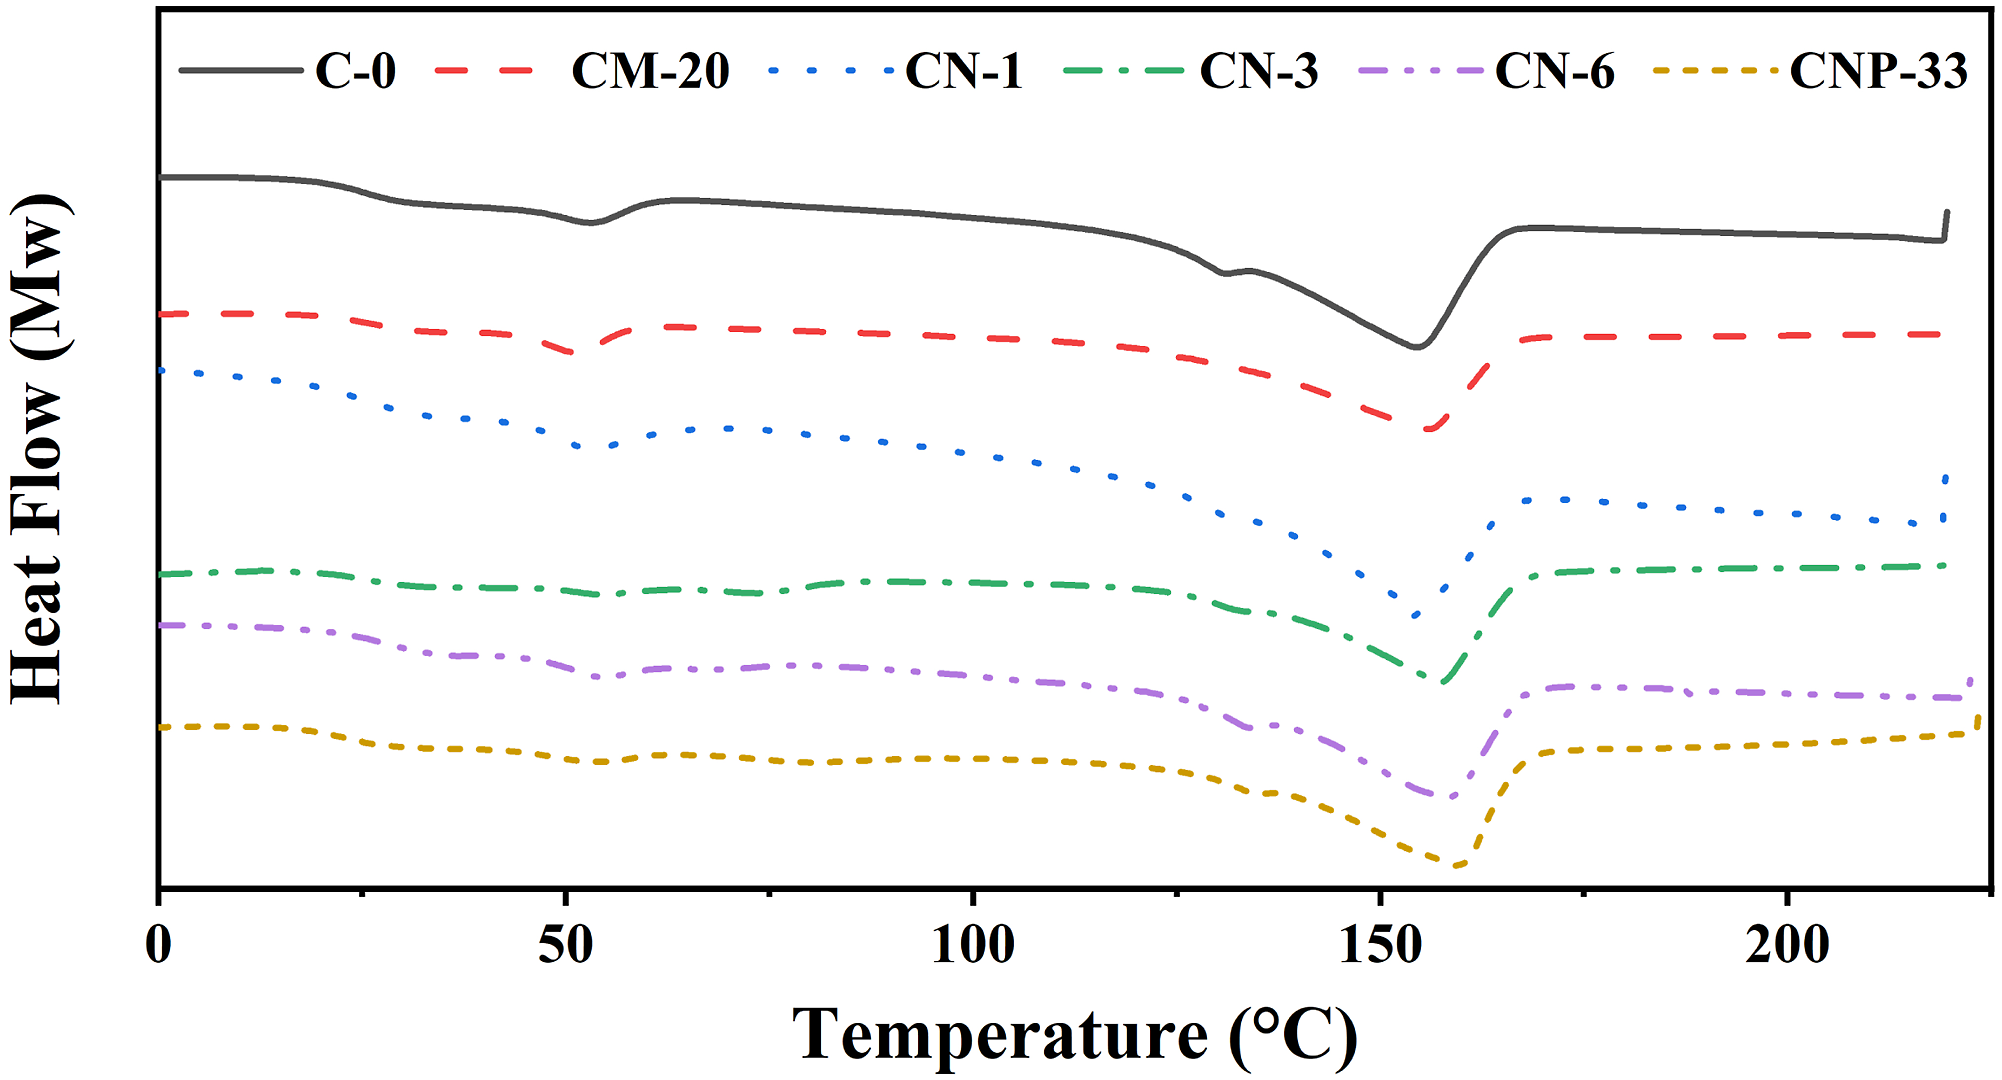
Numerical results of the DSC test.
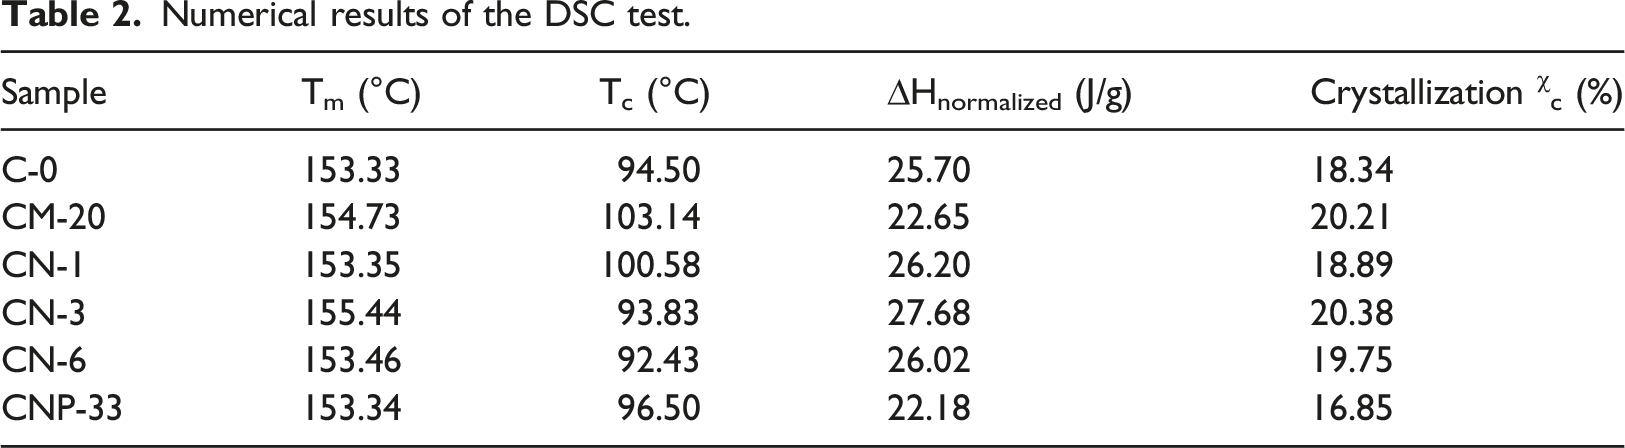
The crystallinity of polymers was calculated by equation (1):
DMTA
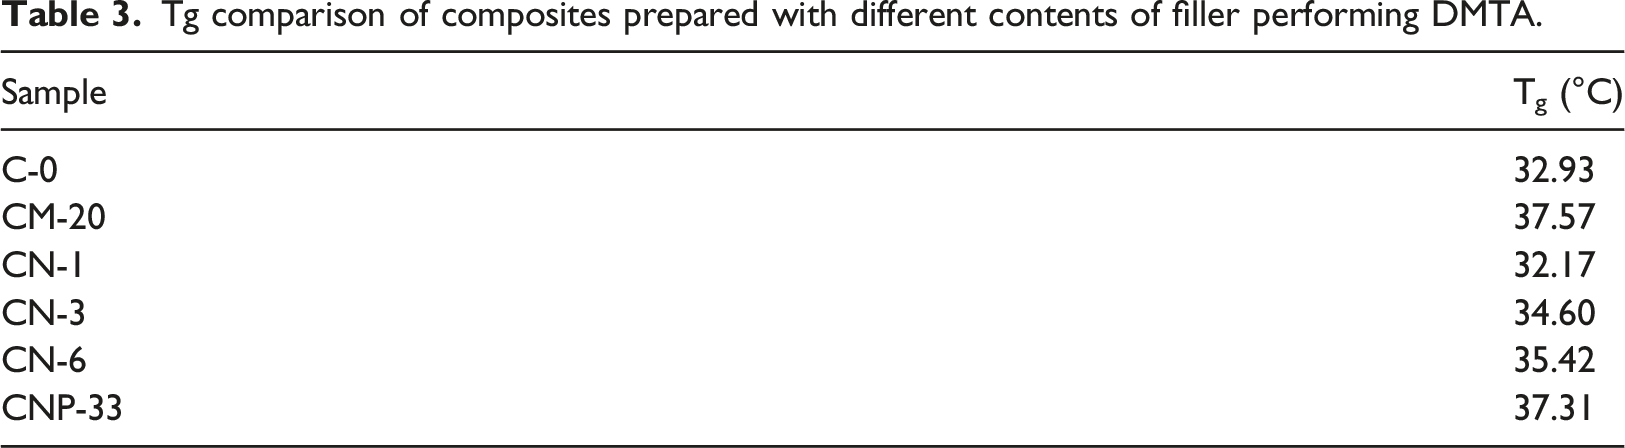
DMTA result is presented in Figure 6. Two characteristics of these diagrams are noteworthy for comparison: (1) the size of the loss modulus and (2) the transition temperatures determined by the temperature of the peaks. Tg curves obtained from DMTA diagrams of various nanocomposites.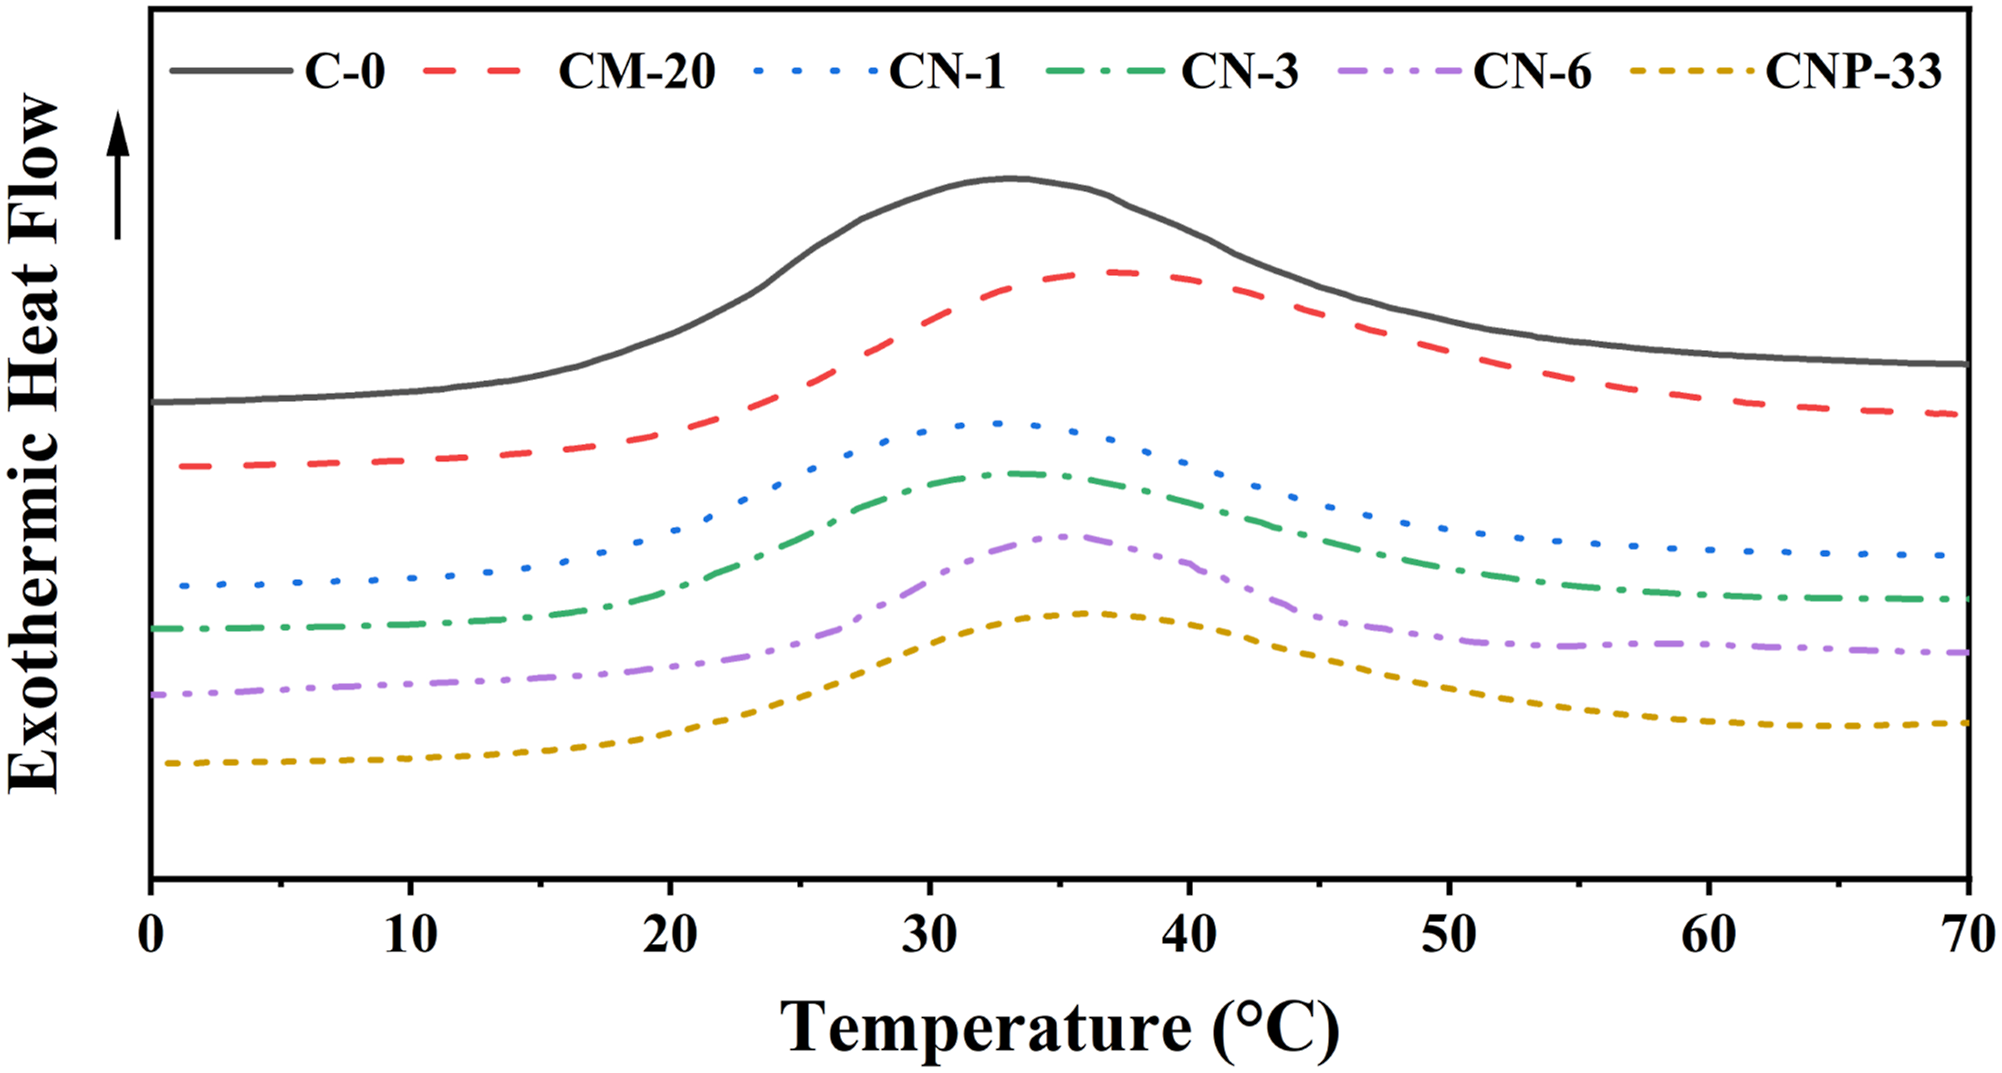
In most composites, Tg determined by the position of the α peak (the partial movements of the main chains) was increased by filler addition, except for the composite containing 1 wt% of nano-TiO2. The reason for this can be the small amount of the nanoparticle that was not enough to keep chains and to hinder their movements. The position of the β peak in the composite containing 1 wt% of nanoparticles was slightly shifted to lower temperatures compared to other samples. This may be due to the presence of a larger volume of low-density secondary layers (with a larger free volume) around the TiO2 nanoparticles, which facilitates the partial movement of the chains and thus reduced the Tg of the composite at this percentage of filler.29,31–33 While passing from 1 wt% to higher filler amounts, Tg has an increasing trend. This is due to the gradual reduction of interparticle distances because of the overlap of low-density intermediate layers (increase in the volume fraction of compact, intermediate layers) and reduction in the mobility of polymer chains in these areas. 56
Increasing the Tg is more pronounced and effective in composites containing nanoparticles due to the larger volume fraction of compacted interlayers. Obviously, the number of nanoparticles is much higher in the equal contents of fillers, and the distances between their particles are much less than microparticles. This phenomenon is more pronounced for composites containing higher values of nanoparticles. Therefore, at higher filler percentages, the mass fraction of the total immobilized polymer chains in the composites containing a higher quantity of nanoparticles was much larger than the composite with lower values of nanoparticles, which leads to a further increase in Tg in nanocomposites.
Tg comparison of composites prepared with different contents of filler performing DMTA.
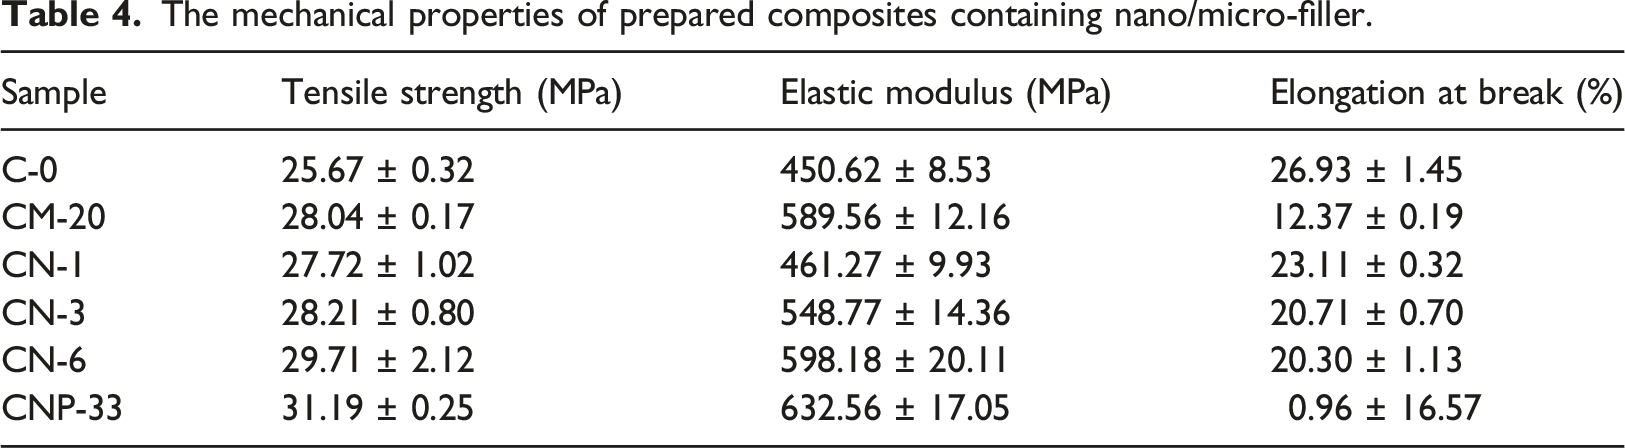
Mechanical properties
The mechanical properties of prepared composites containing nano/micro-filler.
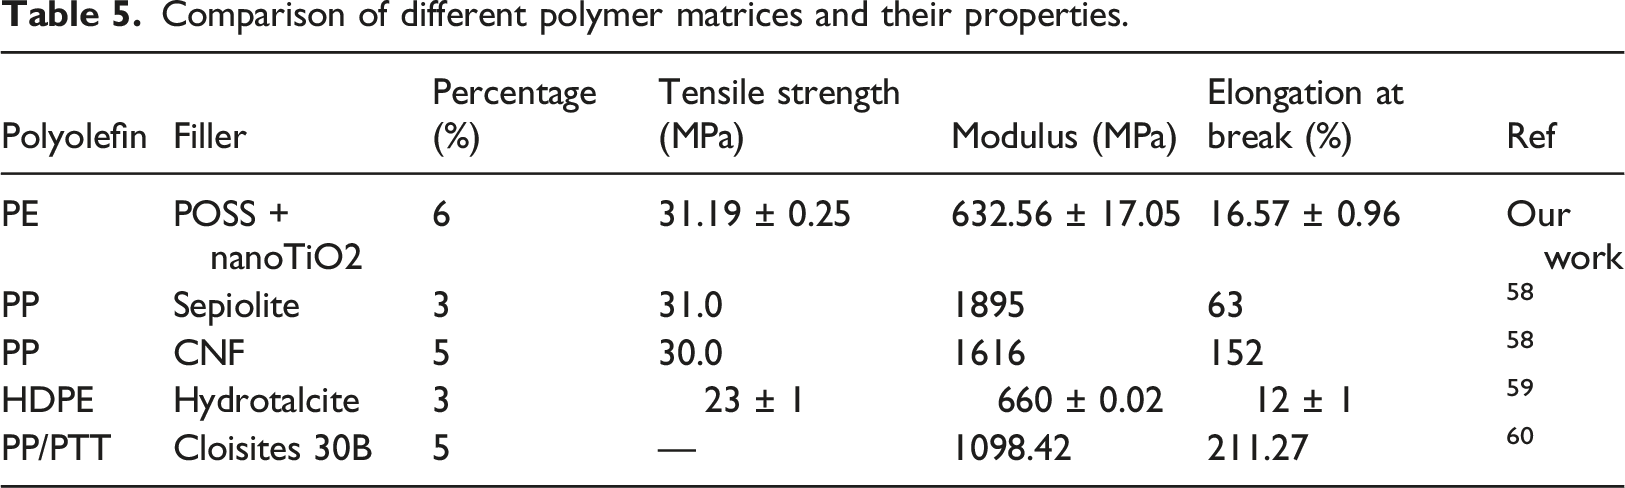
Comparison to the literature
Comparison of different polymer matrices and their properties.
Hardness
Hardness diagrams for different samples are given in Figure 7. The results showed that the hardness of the samples increased with filler loading due to the hardness of nanoparticles compared to the polymeric matrix. Increasing the percentage of particles reduces the mobility and energy loss of the chains, thus increasing the hardness. In the CNP-33 sample, the hardness enhancement was more pronounced due to the excellent dispersion of TiO2 in the presence of POSS due to its reactice groups. Some researchers have confirmed our observations.
57
They showed that the hardness of the discrete alloyed polymers was 60 shore D, which compared to the sample containing 7 v.% of TiO2 nanofillers reached 74 shore D. The main reason for hardness increment as the quantity of filler was increased is the fact that the particles as an object are harder than the matrix. In fact, adding TiO2 particles to the polymer matrix significantly increases the mechanical properties of the nanocomposite, especially the modulus and hardness, provided that the particles have strong interactions with the matrix. Hardness diagram of composite samples in term of n-TiO2.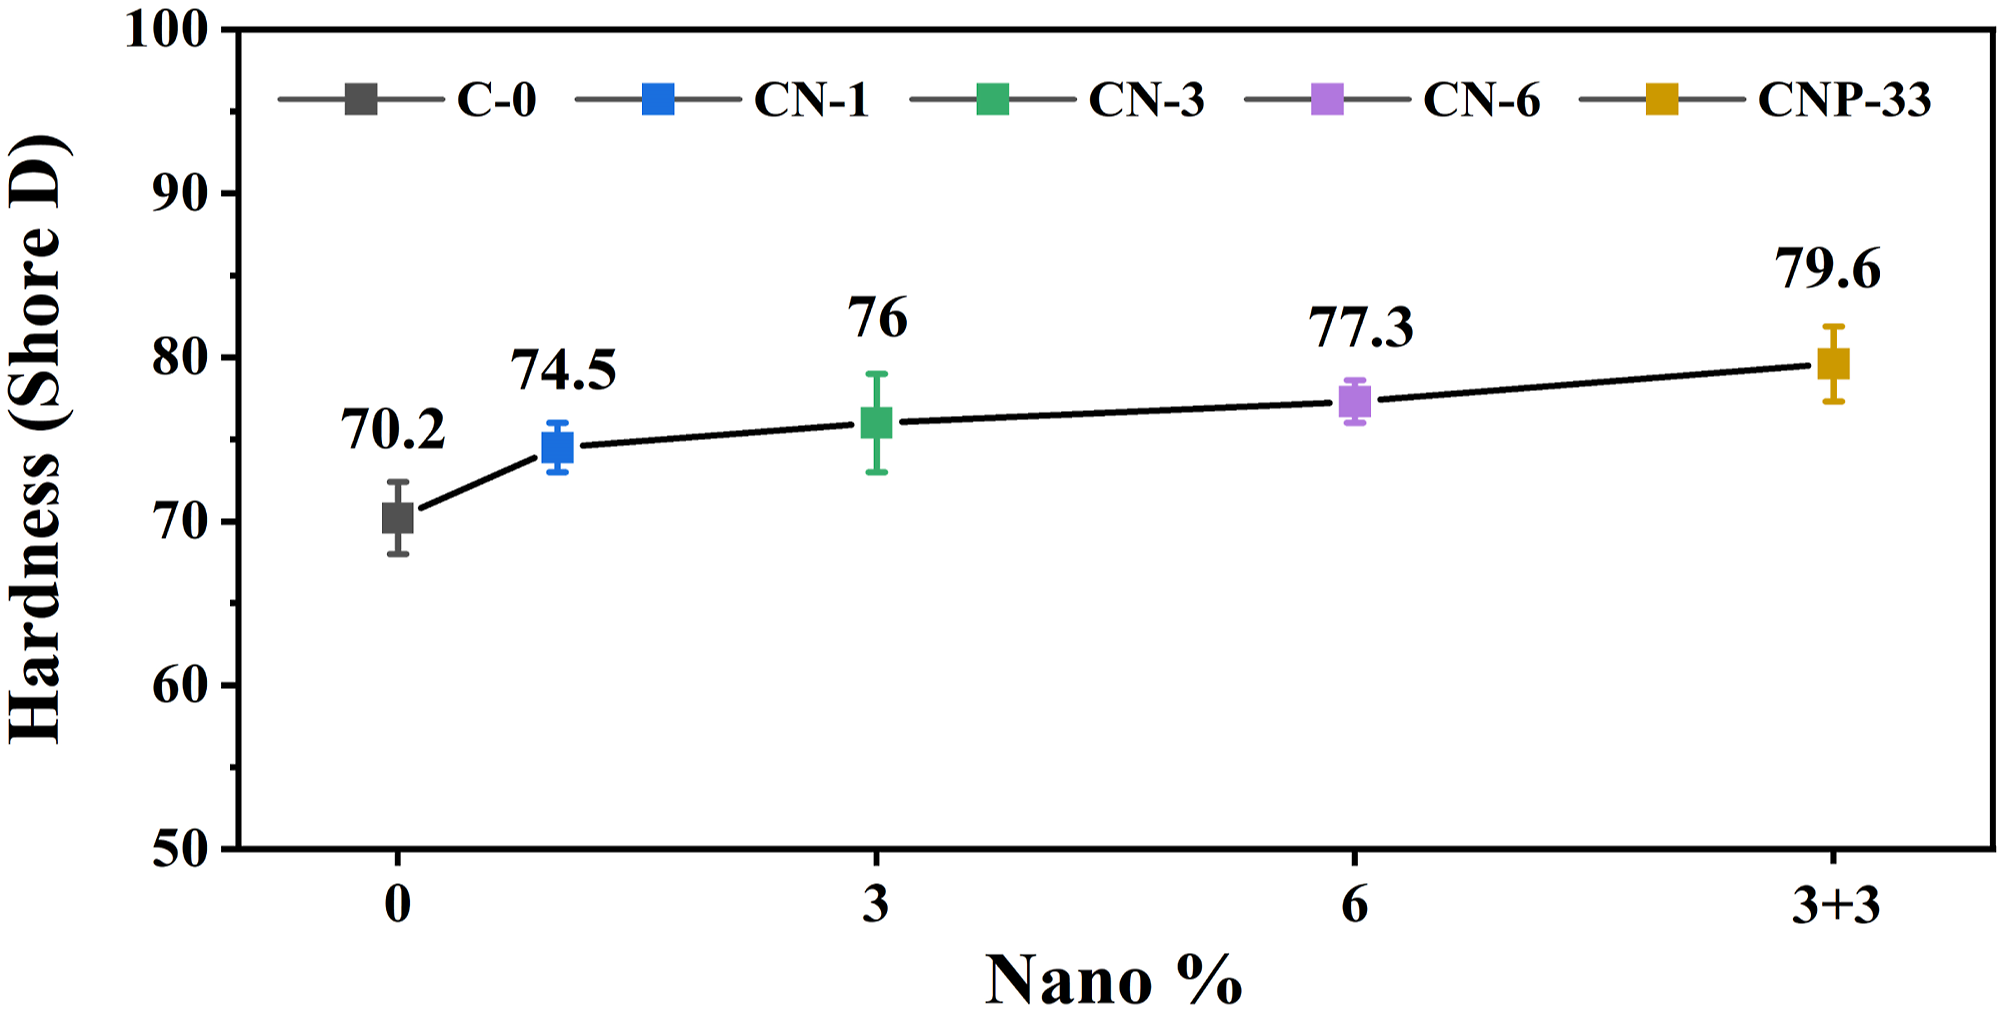
Rheology
Figure 8 shows a strain sweep for the CNP-33 nanocomposite sample. It was observed that the critical strain is ɣc = 5%. Below 5%, the structure is intact, and the materials have solid-like behavior, indicating that the materials are highly structured. Increasing the strain above the critical strain disrupts the network structure.
61
The complex viscosity (ƞ*) of neat polymer and the prepared micro/nanocomposites as a function of frequency (ω) at rad. S-1 is shown in Figure 9. According to the results, in all samples containing filler compared to the neat sample, there was an increase in viscosity, while the most substantial increase was recorded for CNP-33. The structure of TrisilanolPhenyl POSS, owing to hydroxyl functional groups on its surface, has more interaction with the polyolefin matrix than TiO2 nanoparticles. Storage modulus curve in terms of frequency for CNP-33 nanocomposite sample. Complex viscosity of polymer with and without TiO2 and POSS nanofillers.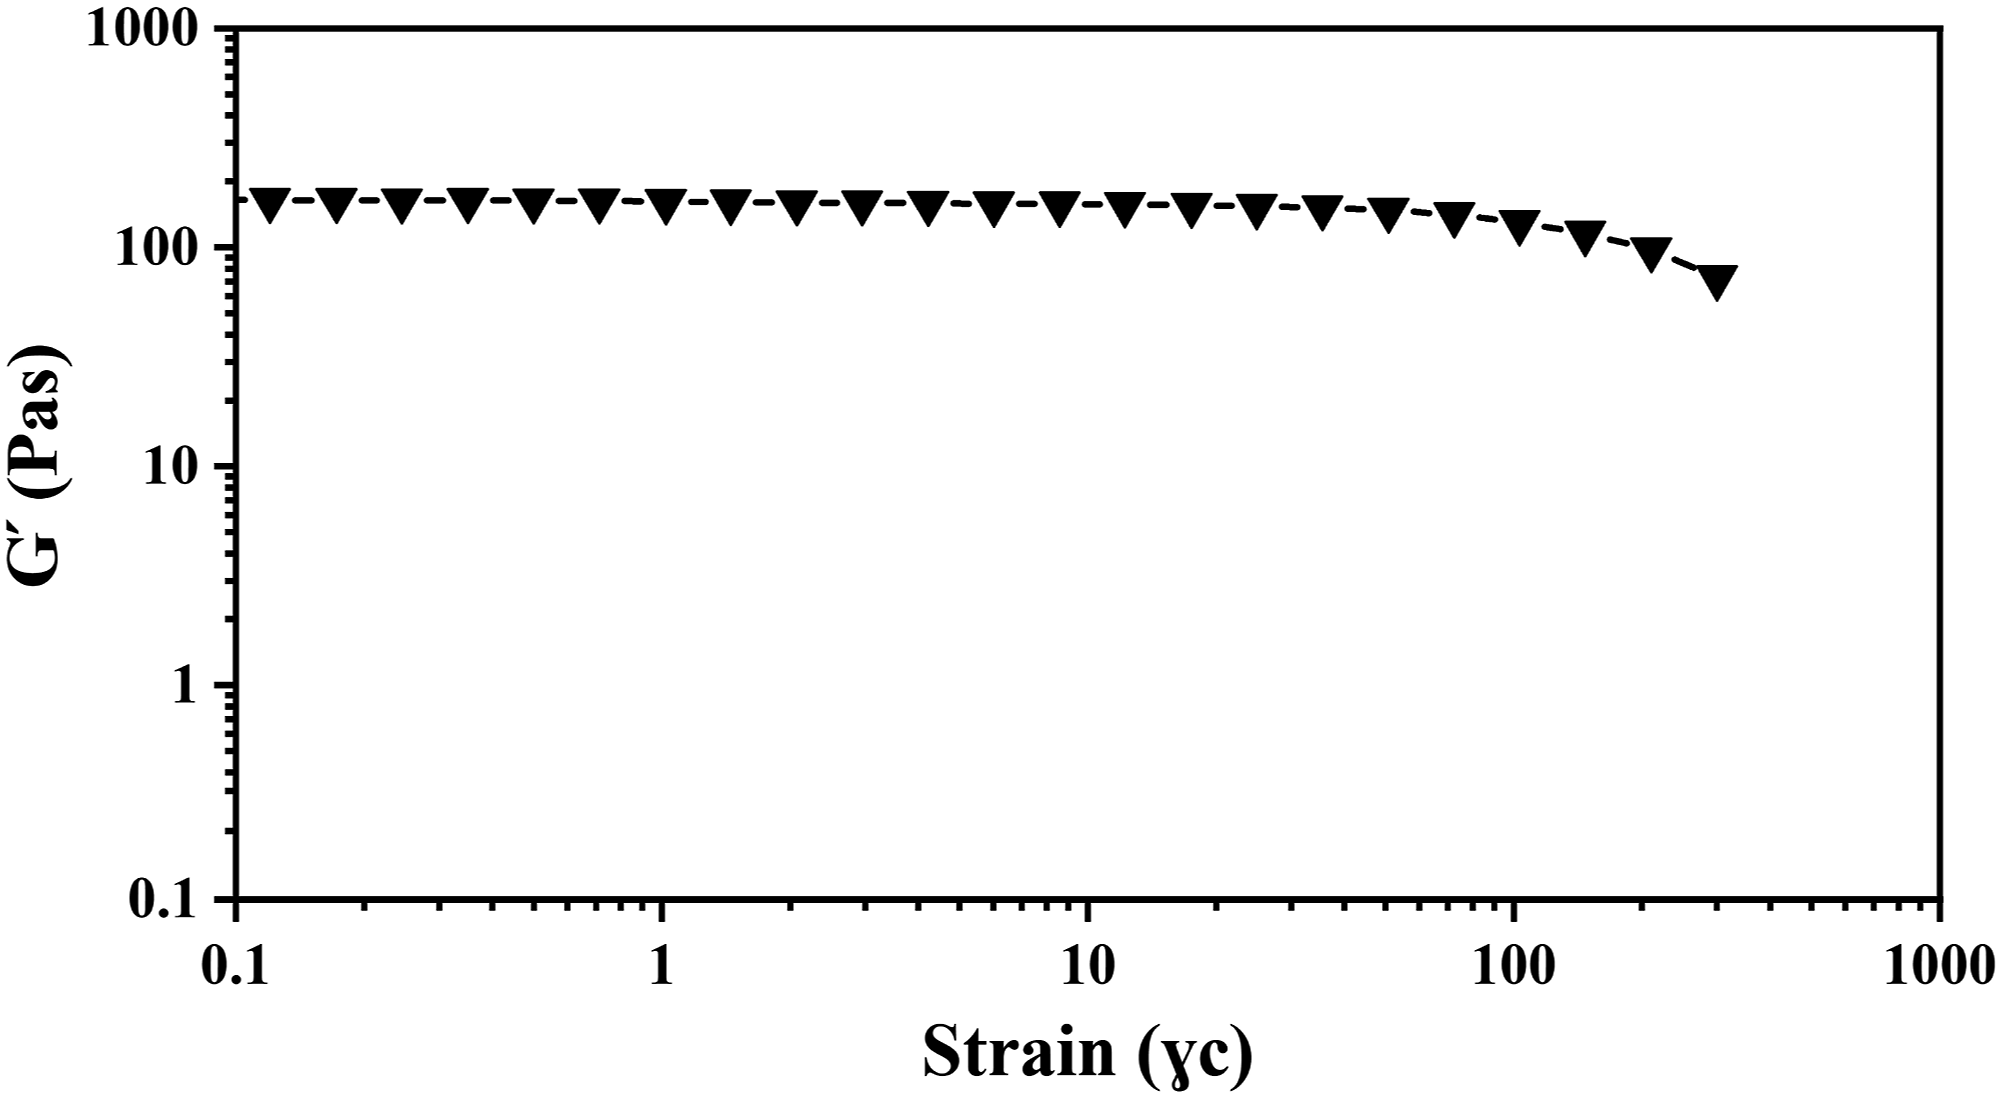
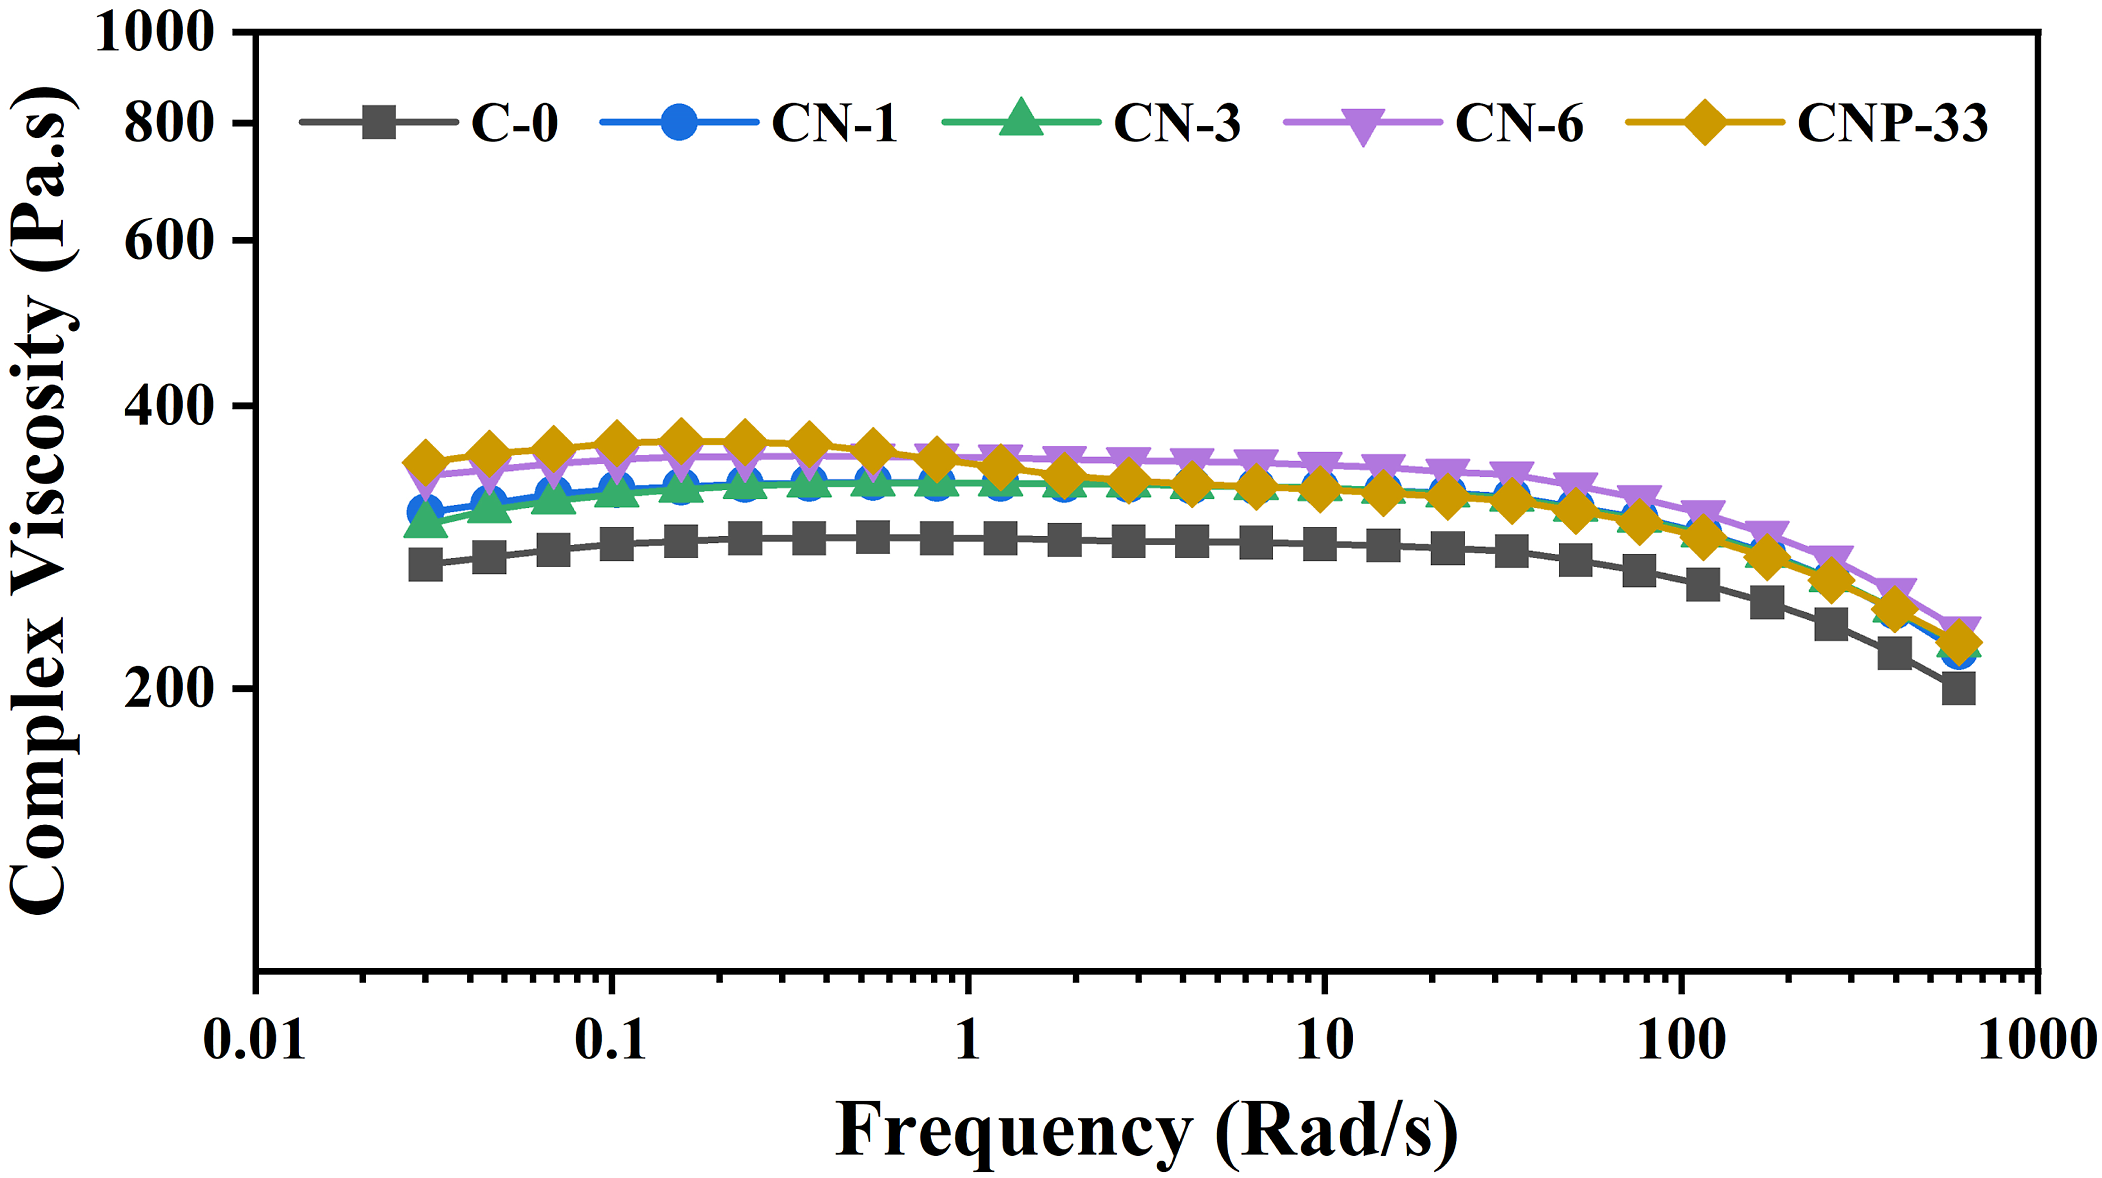
Also, the presence of phenyl groups in the POSS structure reduced the mobility of the chains, and consequently, the relaxation time of the chains and the viscosity were increased. As the frequency increases, an increase in shear-thinning behavior was observed. The simultaneous presence of TiO2 and POSS has a synergistic effect on viscosity, and its enhancement was higher than the sample containing an equal amount of nano TiO2. Figure 8 showed that increasing the level of nanoparticles increased the chains' relaxation time.
In samples containing 1, 3, and 6 wt% of nano-TiO2, an increase in shear-thinning and complex viscosity are also observed. The increase in the nanoparticles' quantity led to the amplification of viscosity, torque, and as a result, the shear-thinning. Also, with increasing the nano component, the probability of nanoparticles slipping on each other increases, and the shear-thinning increases, which is evident in all samples containing nano-TiO2 compared to the neat sample.54,62
The storage modulus of samples in terms of frequency is depicted in Figure 10. At low frequencies, the graph slope gradually decreased with the increase in nanoparticle percentage, and the samples showed an elastic behavior tendency. Also, with increasing amount of nanoparticles, the chains' relaxation time was increased, followed by higher storage modulus values. Increase in the storage modulus of nanocomposites was more sensible than the pure sample. The storage modulus of samples in terms of frequency for Polymer and nanocomposites containing various amounts of n-TiO2.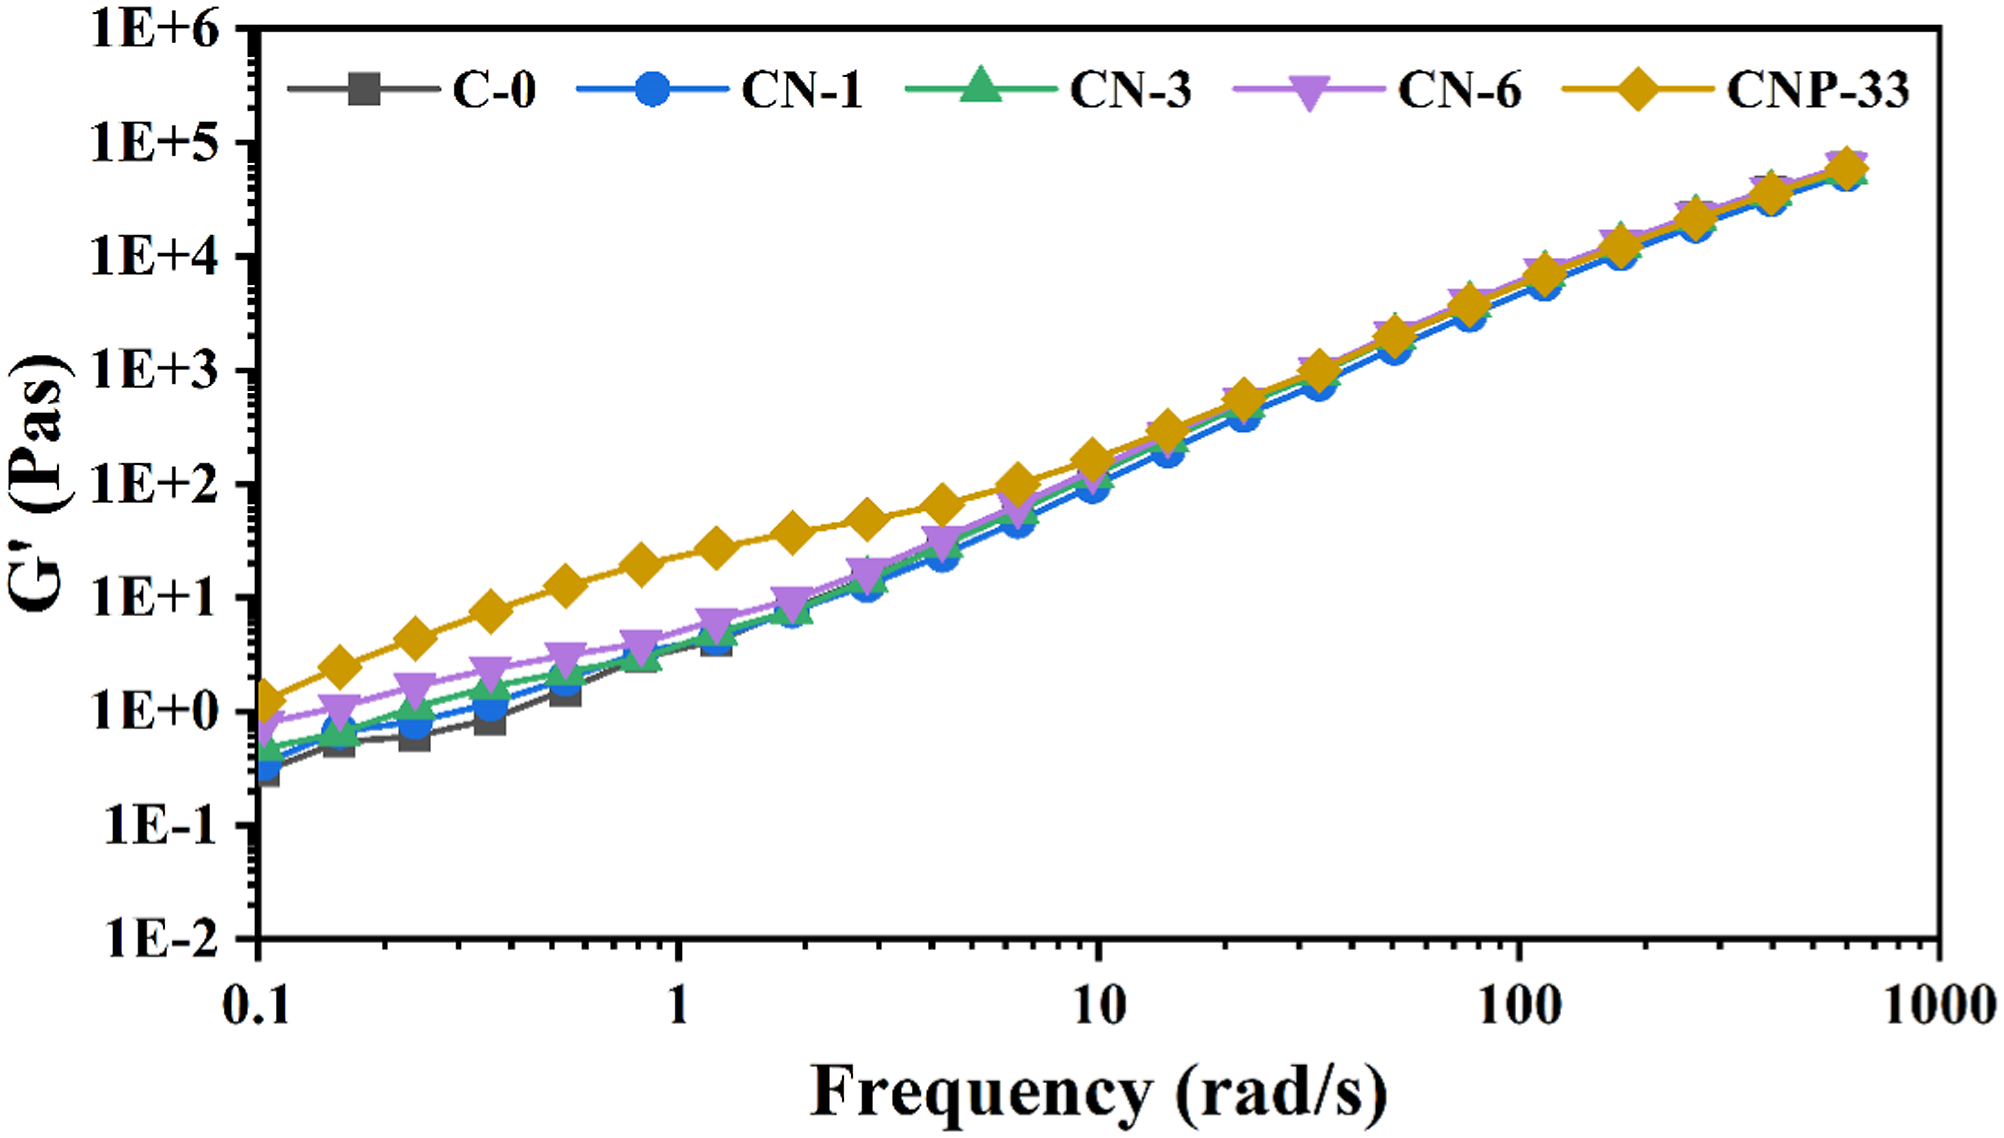
In all samples, with increasing frequency, the upward trend of the storage module was obvious, as the stress exertion time was decreased, and the modulus was raised. The slope of the modulus variations was decreased synchronously with increasing nanoparticles values, indicating that even a pure sample has not had enough time for the chains relaxation; therefore, the rate of the storage module dependence on the frequency was attenuated, and the effect of nanoparticles was evident at all frequencies, interpreting the increase of elastic behavior of the melted polymer.53,62,63
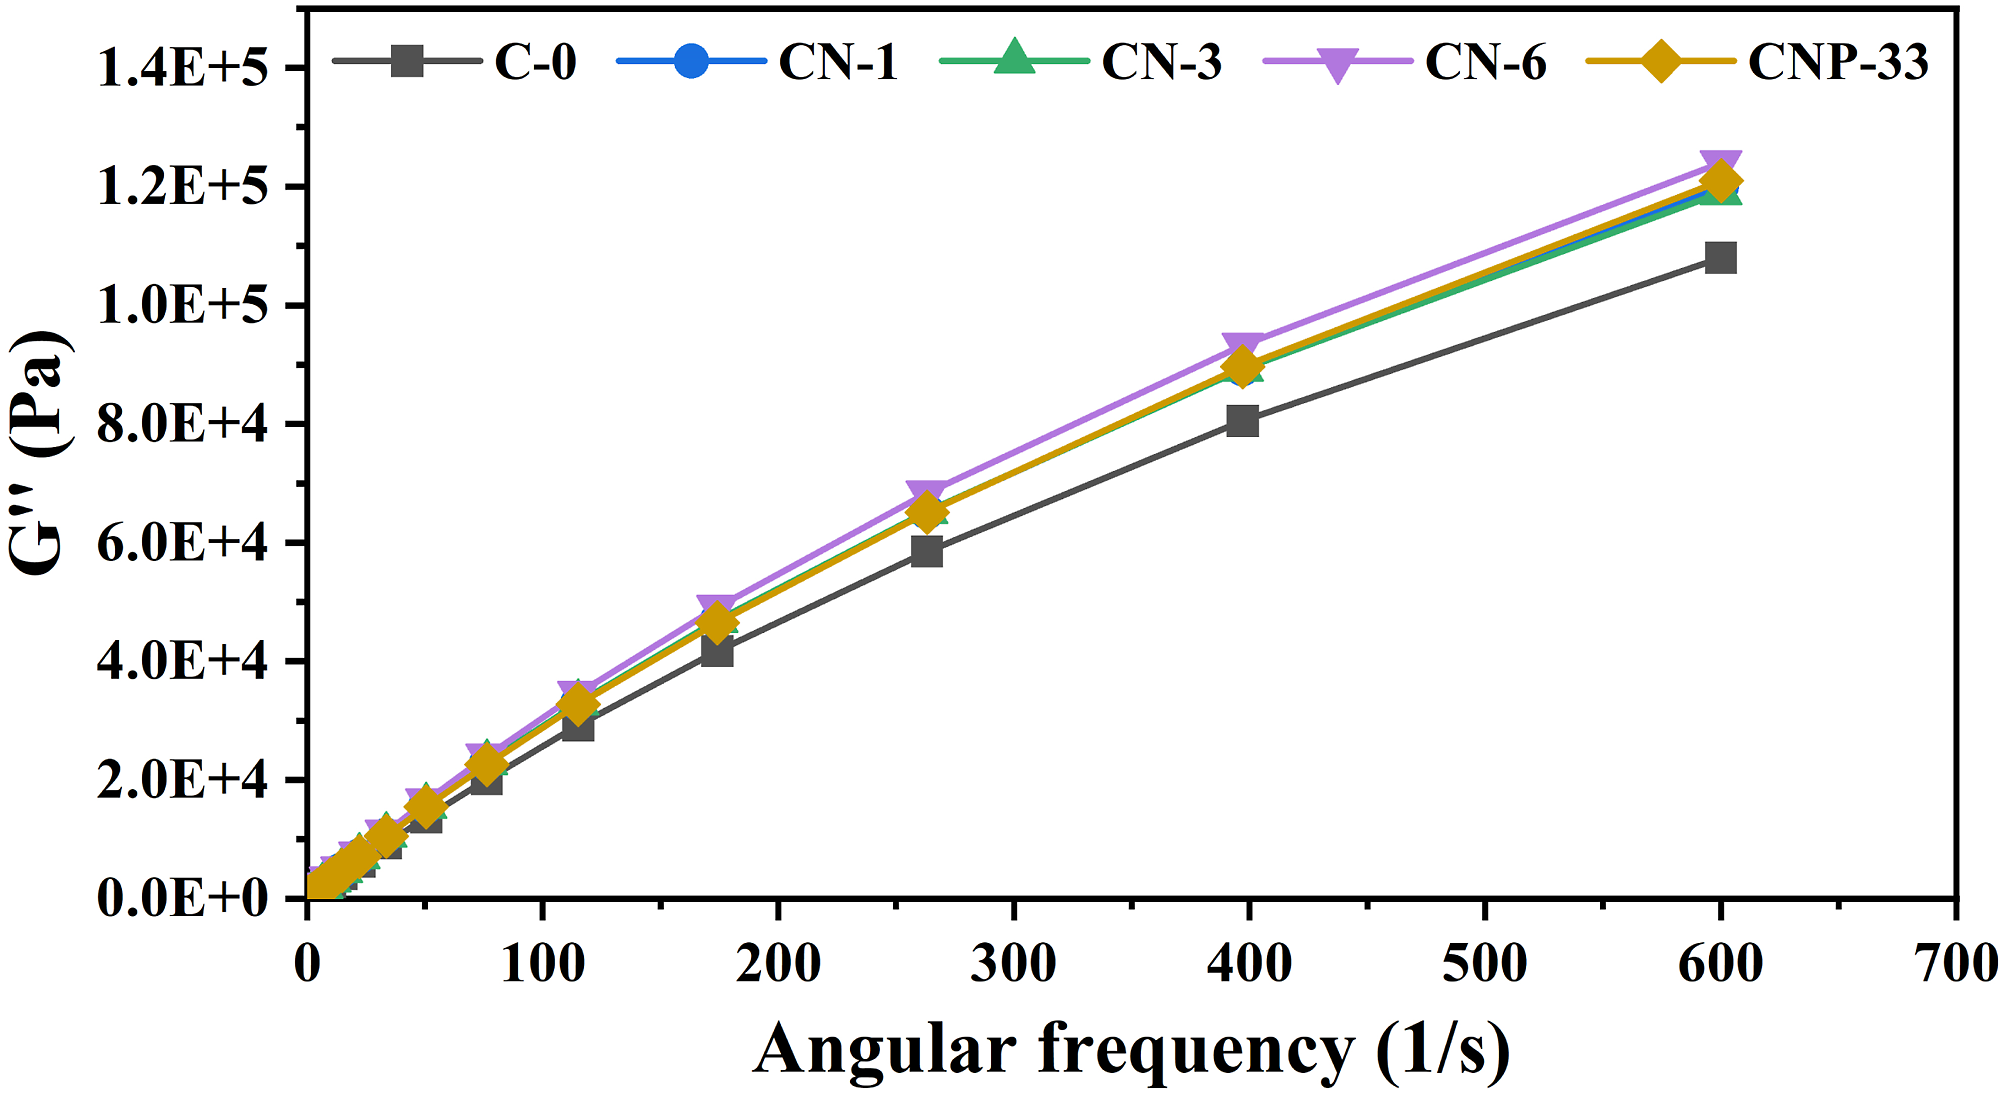
The loss modulus for all nanocomposite samples at all frequencies had a similar trend to that of pure polymer, and the values of the loss modulus for nanocomposites increased slightly compared to the blank polymer sample (Figure 11). The source of the loss modulus is the friction between the chains also the chains and nanoparticles. As the percentage of nano-TiO2 in the composite increases, the interactions increase, and as a result, the mentioned frictions increase, and consequently, the loss modulus has an upward trend. According to Figure 11, the loss modulus of the neat sample is lower than the other samples, and the specimens containing 1 and 3 wt% nano-TiO2 overlapped and had equal values. It should be noted that with a minimal difference, samples containing 6 wt% nano-TiO2 and nanocomposites containing 3 wt% of TiO2 and POSS had a higher loss modulus, respectively.
53
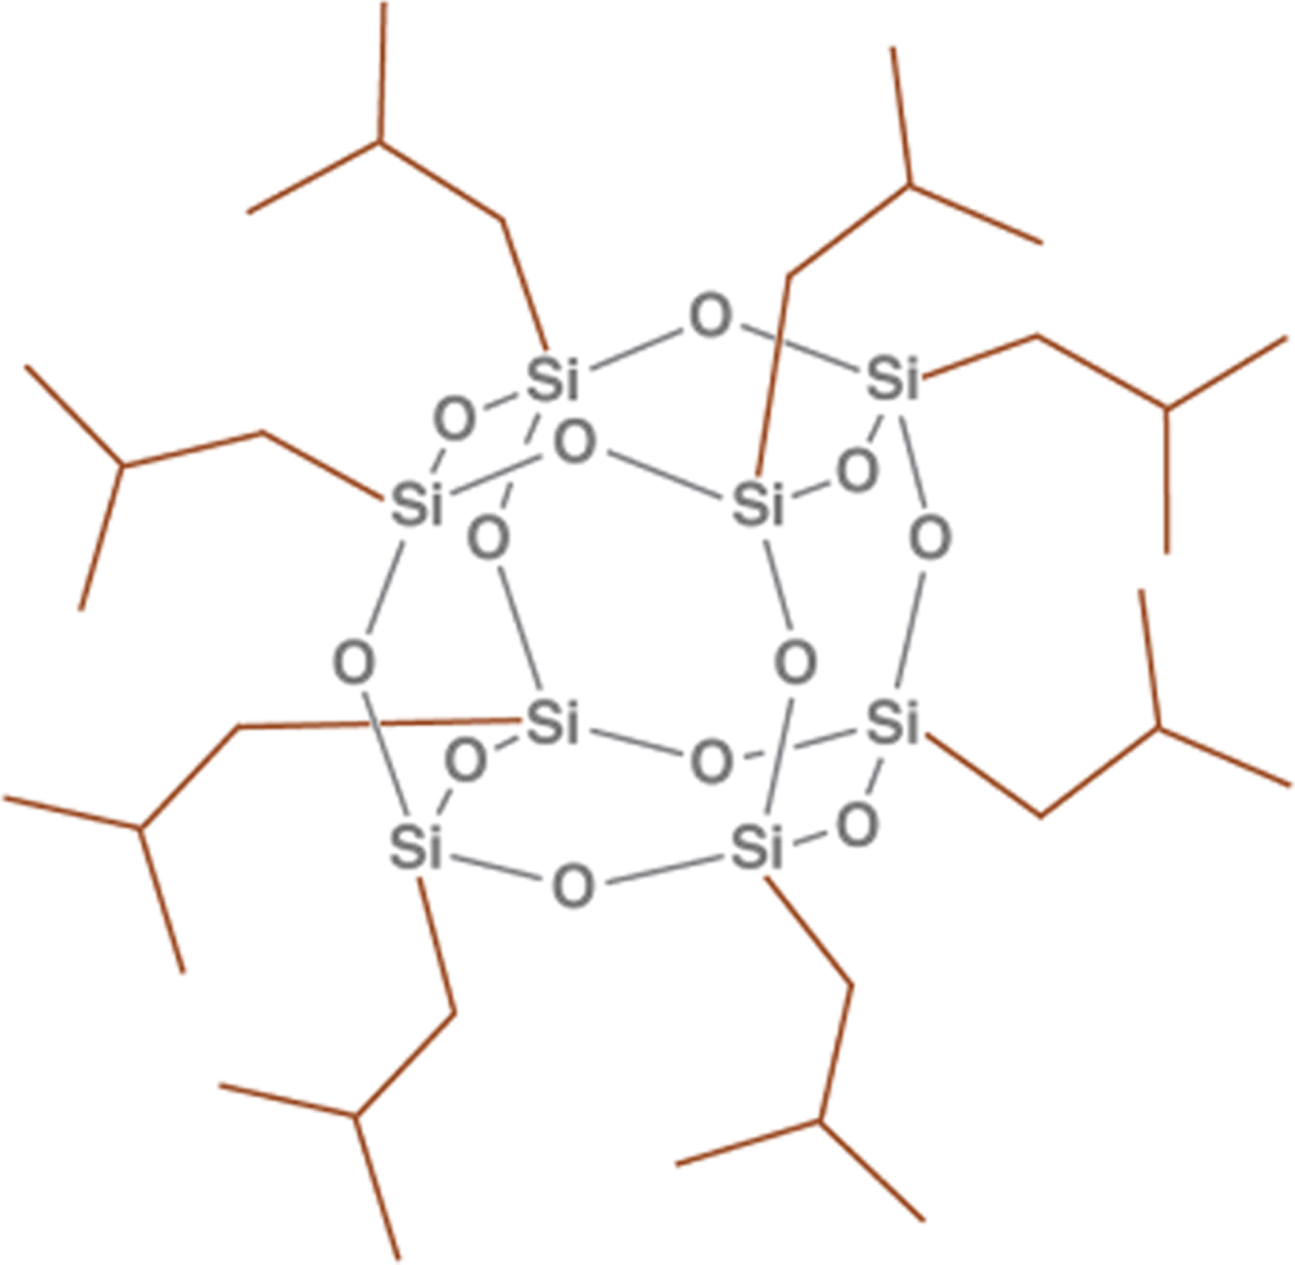
The loss modulus for all nanocomposite samples at low frequencies. Typical of structure of POSS used in this study.
64
Conclusion
This research studied the effect of micro- and nano-TiO2, and POSS on the mechanical properties and rheological behavior of a thermoplastic polyolefin composite. Results showed that the dispersion of particles into the coatings affected different nanocomposites’ different properties. The magnitude of this effect depends on the particle size and weight fraction of the particles. In general, with increasing particle loads up to 6 wt%, tensile strength, elastic modulus, and hardness compared to the sample without any additive were increased up to 17.7%, 28.7%, 11.8% respectively, but elongation at break was decreased up to 10.4%. Results of the DSC test showed that crystallinity changes in the samples were not noticeable by the addition of nanoparticles. SEM/EDAX result showed a well-dispersion of the particles of TiO2 in the matrix in the CNP-33 sample. This could be related to the hydroxyl groups on the POSS surface, which can form proper bounds between matrix and nanoparticle and enhance mechanical properties.
Footnotes
Declaration of conflicting interests
The author(s) declared no potential conflicts of interest with respect to the research, authorship, and/or publication of this article.
Funding
The author(s) received no financial support for the research, authorship, and/or publication of this article.