
Abstract
Wood-plastic composite (WPC) can be fine-cell processed to create a new class of low-weight composite material with improved mechanical properties that could broaden their applications. This study investigated the effects of a chemical blowing agent (CBA) and the drawdown ratio (DDR) on the surface quality, cell morphology, and mechanical properties of extruded foamed WPC profiles. The rectangular foamed WPC profiles were produced from high-density polyethylene and wood flour with different CBA contents and DDR values using a twin-screw extrusion line. The foam density, cell density, and their sizes and shapes were largely depended on the CBA content and the DDR. A foamed WPC profile with a 22% density reduction with cellular structure can be produced using an extrusion profile line.
Introduction
Wood-plastic composites (WPCs) have emerged as a dynamic material in building construction and automotive applications. Yet despite their having better dimensional stability, durability, and mechanical properties than their constituent materials, WPCs potential applications have been limited by their high density, lower toughness, impact strength, and ductility. 1 These limitations, nevertheless, can be, overcome by thermal stretching 2 and the microcellular foaming using blowing agents. 3 By downstream thermal stretching, the polypropylene (PP) with 30 wt% wood flour (WF) composite showed a 30% density reduction that was caused by voids generated at the weak interface of the WF and PP matrix. 2 Moreover, microcellular foam structures can be achieved in WPCs using chemical blowing agents (CBAs) 3–11 or physical blowing agents (PBAs), 12–14 which result in improved ductility, impact strength, and lower weight. Both CBAs (endothermic and exothermic) and PBAs can be used in extrusion foaming. Endothermic CBAs absorb heat and generate carbon dioxide (CO2), whereas exothermic CBAs release heat and generate nitrogen (N2) during their chemical decomposition. In extrusion foaming, endothermic CBAs offer a desirable property because they absorb heat during decomposition, which cools the polymer, increases the viscosity of the melt, stabilizes the cellular structure, and reduces cell coalescence. 3,15,16 By contrast, exothermic CBAs generate a lot of heat when they decompose that may soften the polymer matrix and support cell coalescence during the foaming process. Usually, CBAs are used for high-density foams and PBAs are used for low-density foams. Since the viscoelastic properties of the polymer is affected when WF is added, 17,18 the effects of blowing agents on the foam morphology of the WF-filled plastics are significantly different than pure plastic foam. 3
Microcellular structures in WPC can be produced by first saturating a molten polymer with a gaseous blowing agent before rapidly decreasing the gas solubility in the melt. The high saturation pressure favors a high nucleation rate by a rapid drop in gas solubility. Recently, microcellular foaming of WPCs using injection molding 5 –7 and extrusion 8 –13 and batch 19 processes was successfully demonstrated. The density of foamed WPCs has been greatly reduced, with significant improvement shown in the ductility and impact resistance. Most studies on extrusion-based foaming with CBAs focused on PP and poly(vinyl chloride) (PVC) 3,8,11,12 polymer matrix WPCs. Zhang et al. 8 successfully extruded PP-WF composite foams with a reduced density using a CBA. Mengeloglu and Matuana 11 studied the effects of CBA type (i.e. endothermic versus exothermic) and content on the morphology of extruded rigid PVC-WF foamed composites. They showed that the density reduction of foamed WPCs was not influenced by the CBA content. Although polyethylene (PE) accounted for almost 70% of the plastics used for WPCs, only limited literature is available on the extrusion foaming of WF-filled PE composites. 9,10 The cell morphology of foamed WPCs further depends on the type of blowing agent used. In terms of cell size, diameter, and polydispersity, the exothermic CBA performed better than the endothermic CBA for foamed PP-WF composites. 3,5 On the other hand, the endothermic CBA reduced the surface roughness by nearly 70% compared with nonfoamed composites. Li and Matuana 9 investigated the extruded high-density polyethylene (HDPE)-WF foamed composites by varying the CBAs content, type, and the coupling agent. They showed that the CBA type (endothermic vs. exothermic) and its form (pure or masterbatch) did not affect the density and average cell size achieved, however, the maleated polyethylene (MAPE) coupled formulation showed higher void fraction. Rizvi et al. 10 studied the effects that different commercial endothermic CBAs had on the foam morphology of extruded HDPE-WF composites and found similar foaming behaviors with uniform and reasonably fine-celled structures for all CBAs. Guo et al. 13 investigated the effects of WF size and MAPE coupling on the foam morphology of extruded HDPE-WF composites blowing by supercritical CO2. They showed that small-sized WF (75–125 μm) and MAPP containing WPC demonstrated better cell morphology with a smaller cell size and greater cell uniformity. Zhang et al. 14 reported a marked improvement in the cell morphology of MAPE-coupled HDPE-WF composites produced by a single-screw tandem extrusion system using a CO2 blowing agent. The MAPP coupling strongly affects both the concentration of gas molecules absorbed by the composites and the cell morphology. The critical issue in the extrusion foaming of WPC is the volatile generation during processing which influenced the foam morphology significantly. Therefore, to minimize the foaming effects of the volatiles generated from WF during WPC foam extrusion, the highest processing temperature should be below 180°C. 8,20 Although the scientific literature has focused on foamed WPCs, the continuous foamed WPC profile’s extrusion has not yet received sufficient attention. The processing parameters, foam properties, and material formulations of the foam extrusion of WPC profiles need further analysis. This study investigates the effects of endothermic CBA content and drawdown ratio (DDR) on the processing conditions and properties of HDPE-WF foamed composite profiles that were extruded using a twin-screw extrusion line.
Materials and methods
Materials
Standard softwood pine (Grade-12020) wood fibers from American Wood Fibers were used. The WF particle size distribution for this grade was 75–125 μm. The HDPE polymer used was Novapol HB-W355-A from Nova Chemicals (density: 0.955 g/cm3 and melt flow index (MFI): 3.0 g/10 min at 2.16 kg/190°C). MAPE coupling agent (Calgary, Canada) (Grade-NE-542-013) and lubricant (Grade-TPN-709) from Struktol (Stow, OH, USA) were used. The MAPE was a linear low-density polyethylene (LLDPE)-based coupling agent with an MFI of 13 g/10 min at 2.16 kg/190°C and a density of 0.943 g/cm3. CBA used was Safoam PE-20 (endothermic, 20% active ingredient, gas evolved: 15–25 mL/g, main gas: CO2, other gas: H2O, decomposition temperature: 176°C) from Reedy International (Keyport, NJ, USA).
Composite preparation
The WF was dried at 80°C for 24 h prior to compounding to reduce its moisture content. The HDPE granules were also dried at 65°C for 12 h. The composite formulations were designed as parts per hundred parts of resin (phr) by mass proportion (Table 1). The HDPE, WF, lubricant, and MAPE contents were fixed at 100, 50, 10, and 5 phr, respectively, while the CBA content was varied from 0 to 1.3 phr active ingredient. The HDPE, WF, MAPE, and lubricant were first dry mixed and then compounded using a corotating intermeshing twin-screw extruder (ZSE-27 Leistritz, screw diameter: 27 mm, L/D: 40). During compounding, the barrel temperatures of the extruder were fixed at 160°C for zones 1–5, 150°C for zones 6–9, and at 140°C for the die. The extruded strands that exited the die were passed through a water bath and were subsequently palletized for further use.
Formulations for HDPE-WF composite foams (phr by weight).a
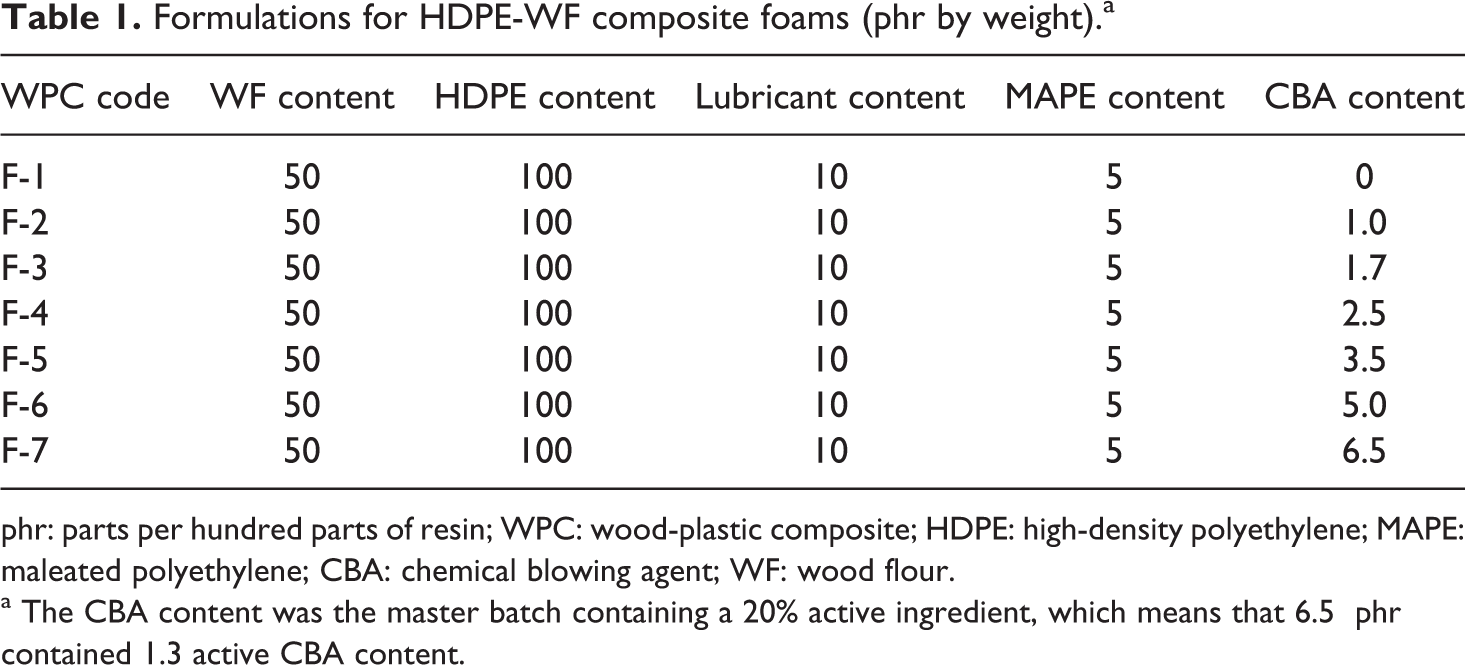
phr: parts per hundred parts of resin; WPC: wood-plastic composite; HDPE: high-density polyethylene; MAPE: maleated polyethylene; CBA: chemical blowing agent; WF: wood flour.
a The CBA content was the master batch containing a 20% active ingredient, which means that 6.5 phr contained 1.3 active CBA content.
The extrusion runs were carried out in a profile extrusion line composed of a twin-screw extruder, rectangular die/die land (25.4 × 6.4 mm2), cooled shaper, guiding shaper, water bath, and puller unit (Figure 1). The guiding shaper was submersed in the water bath and extrudate was passed directly to the water after exiting the cooled shaper. The twin-screw configuration was optimized for foam extrusion (Figure 2). Distributive mixing elements (MB elements) were programmed at zones 5 and 6 for the mixing of gas generated by CBA decomposition. The thermogravimetric analysis of dried WF shows that its weight was almost constant up to 180°C, after that substantial weight reduction was observed 8 ; hence the temperatures at different zones were kept below 180°C to prevent the release of volatiles during extrusion processing. The extruder barrel temperatures were fixed at 160°C for zones 1–4, 176°C for zone 5, 170°C for zones 6–8, and 160°C for zone 9, the die and die land. The barrel temperature at zone 5 was set at 176°C for complete CBA decomposition. The screw speed and feeding rate were 70 r/min and 1 kg/h, respectively, for all composite formulations. The dried wood-plastic (WP) pellets (dried at 80°C for 48 h) and the CBA were dry mixed and fed into the extruder for foam profile extrusion. The extrusion runs were conducted by varying the die temperature from 150 to170°C and adjusting the DDR from 1.0 to 1.4 for different CBA content. The barrel and die temperatures, screw speed and feeding rate were optimized to guarantee a fixed level of extrudate throughput. Hence, the melt pressure, melt temperature, and torque were varied depending on the CBA content and DDR. The extrusion line speed was measured through the linear displacement device attached after the guiding shaper. The DDR was calculated as the ratio of downstream puller linear speed to the extrusion linear speed during the extrusion runs. The puller unit was adjusted to achieve the DDR value whenever the throughput was varied to ensure a consistent foamed WPC profile.
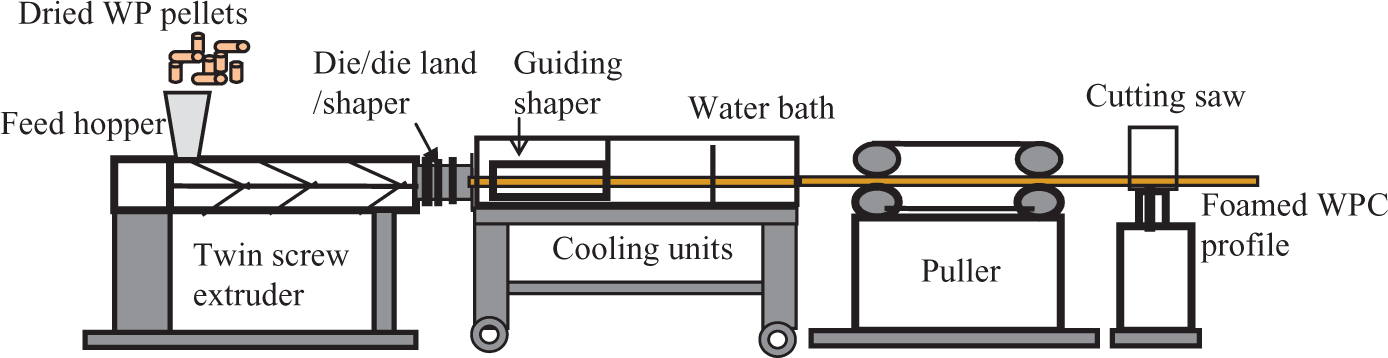
Schematic diagram of wood-plastic composite profile extrusion experimental setup.
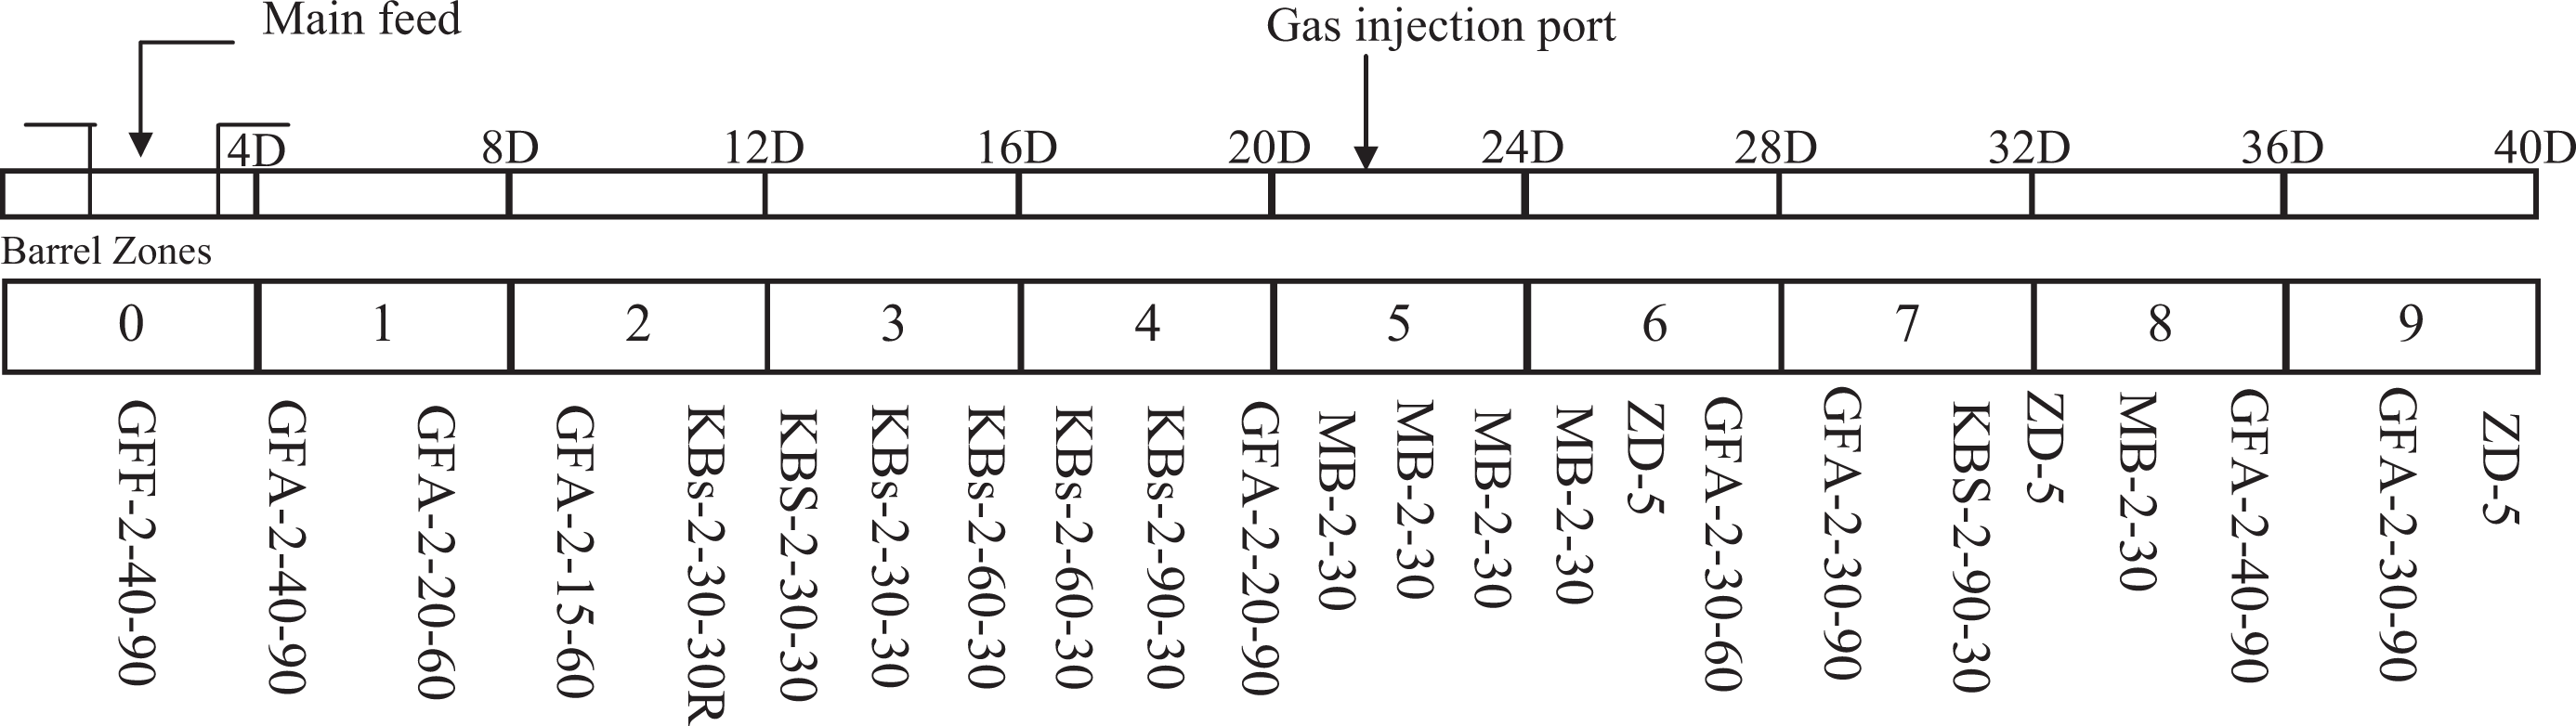
Twin-screw configuration. GFF: feeding; GFA: conveying; KB: kneader blocks; MB: mixing bar elements.
Testing and analysis
The foamed WPC profile samples were randomly collected for each processing condition after stable conditions were obtained. The surface quality, dimensional change, density, void fraction, cell morphology, and flexural properties of the foamed WPCs were measured. The x-sectional area of the foamed profiles was measured using caliper. The bulk foam density was measured according to the ASTM D-792 standard. The total void fraction represents the total volume occupied by the gas within the foamed sample. This can be directly determined from the foamed density and nonfoamed density of a given sample using the following equation (1).
where, φ v is the void fraction and ρ f and ρ m are the foamed density and nonfoamed density of the composites, respectively.
Cell morphology was characterized using a scanning electron microscope (SEM; JEOL JSM-6060). Foamed samples were freeze-fractured in liquid nitrogen, and the fractured surface was sputter-coated. Several images were taken of each sample with the SEM operated at an accelerating voltage of 20 kV and an emission current of 47 μA. The average cell size and cell density were determined from SEM images. The cell density, defined as the number of cells per unit volume with respect to the nonfoamed composite, was determined using the following equation (2)
21
: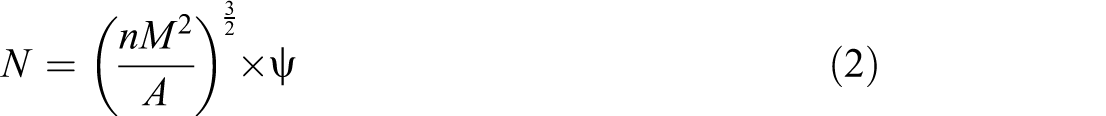
where, N is the cell density (cells/cm3); n is the number of cells; M is the magnification factor; A is the area of the SEM image (cm2), and ψ is the expansion factor of the foamed sample. The size and shape of the partial cells in the foam was counted as the equivalent full cell in the composite. The foamed sample’s skin thickness was measured by drawing up two lines, both parallel to the sample surface using the SEM image. The first line overlapped the actual edge of the sample while other line coincided with the cells nearest to the edge.
The flexural properties were measured by three-point bending tests (LS100 plus, with a 100 kN load cell) at a crosshead speed of 5 mm/min. according to ASTM D790. The flexural test specimen (120 × 25.6 × 6.4 mm3) was cut from the extruded WPC profiles. All measurements were performed under ambient conditions (23 ± 2°C and 50% relative humidity), and five replicates were tested for each composite formulation.
Results and discussion
Surface quality and density of foamed WPC profile
The effect of the DDR and the CBA content on the surface quality, dimensions, and density of the foamed WPC was investigated. Figure 3 shows the optical image of foamed WPC profiles containing 6.5 phr CBA at different DDRs. It was observed that the surface color and x-sectional dimensions of the WPC profile deteriorated with increased DDR. The surface color and dimensions did not alter noticeably up to 1.2 DDR; however, they altered significantly beyond that. It can be seen that the surface color is dark brown at a lower DDR and changes to a light brown color at a higher DDR. Kim et al. 2 also reported the color change in stretched WPC, which is consistent with this result. When the DDR increased beyond 1.2, the profile dimensions gradually reduced and melt fracture occurred at 1.5 DDR. The x-sectional dimension (area) was reduced by 2% and 14%, respectively, with 1.2 and 1.4 DDRs. The surface texture and corners were also observed using SEM images (Figure 4). It can be seen that the roughness of the surface texture and the sharpness of the profile’s corners deteriorated with increased DDR values. The surface was very smooth at a low DDR, while a rough surface with cracks and voids was observed at a high DDR. The profile corners were sharp at a lower DDR but were rounded at a high DDR. This change in surface texture and color were probably due to an alteration in the crystalline morphology of the HDPE matrix with a different DDR and cooling. It is believed that HDPE polymer developed a row-nucleated type of morphology and orientation without lamellar twisting due to the applied stress (DDR) and its relaxation in the flow induced a crystallization process in the machine direction, 15 which has influenced the surface texture and morphology. This shows that an acceptable dimensions and the surface texture of the foamed WPC profiles can be maintained at a DDR of up to 1.2.
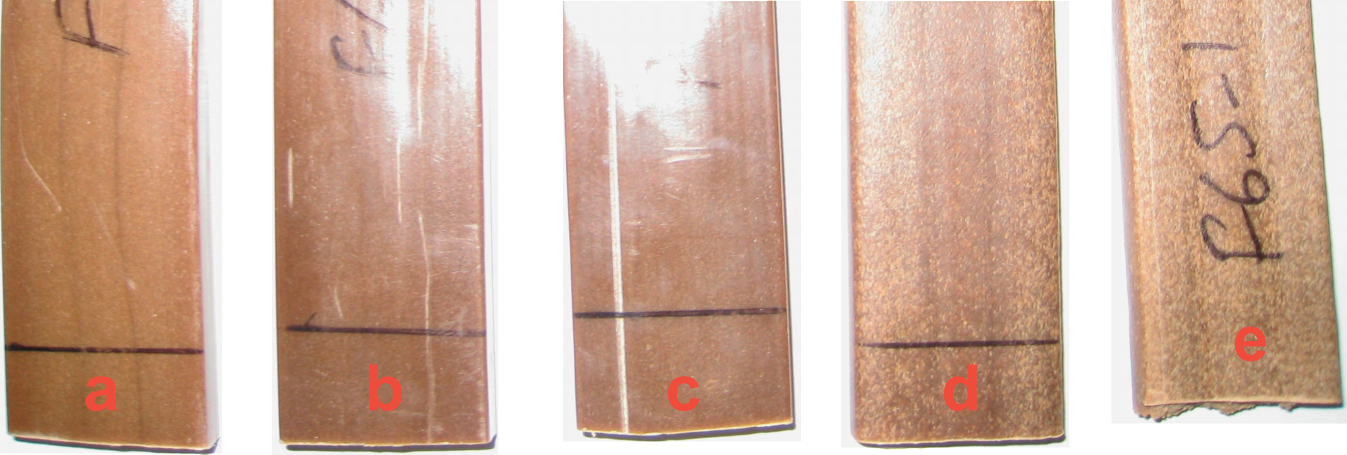
Optical images of foamed WPC profile at (a) 1.0, (b) 1.1, (c) 1.2, (d) 1.3, and (e) 1.4 DDR with 6.5 phr CBA content. WPC: wood-plastic composite; CBA: chemical blowing agent; DDR: drawdown ratio; phr: parts per hundred parts of resin.
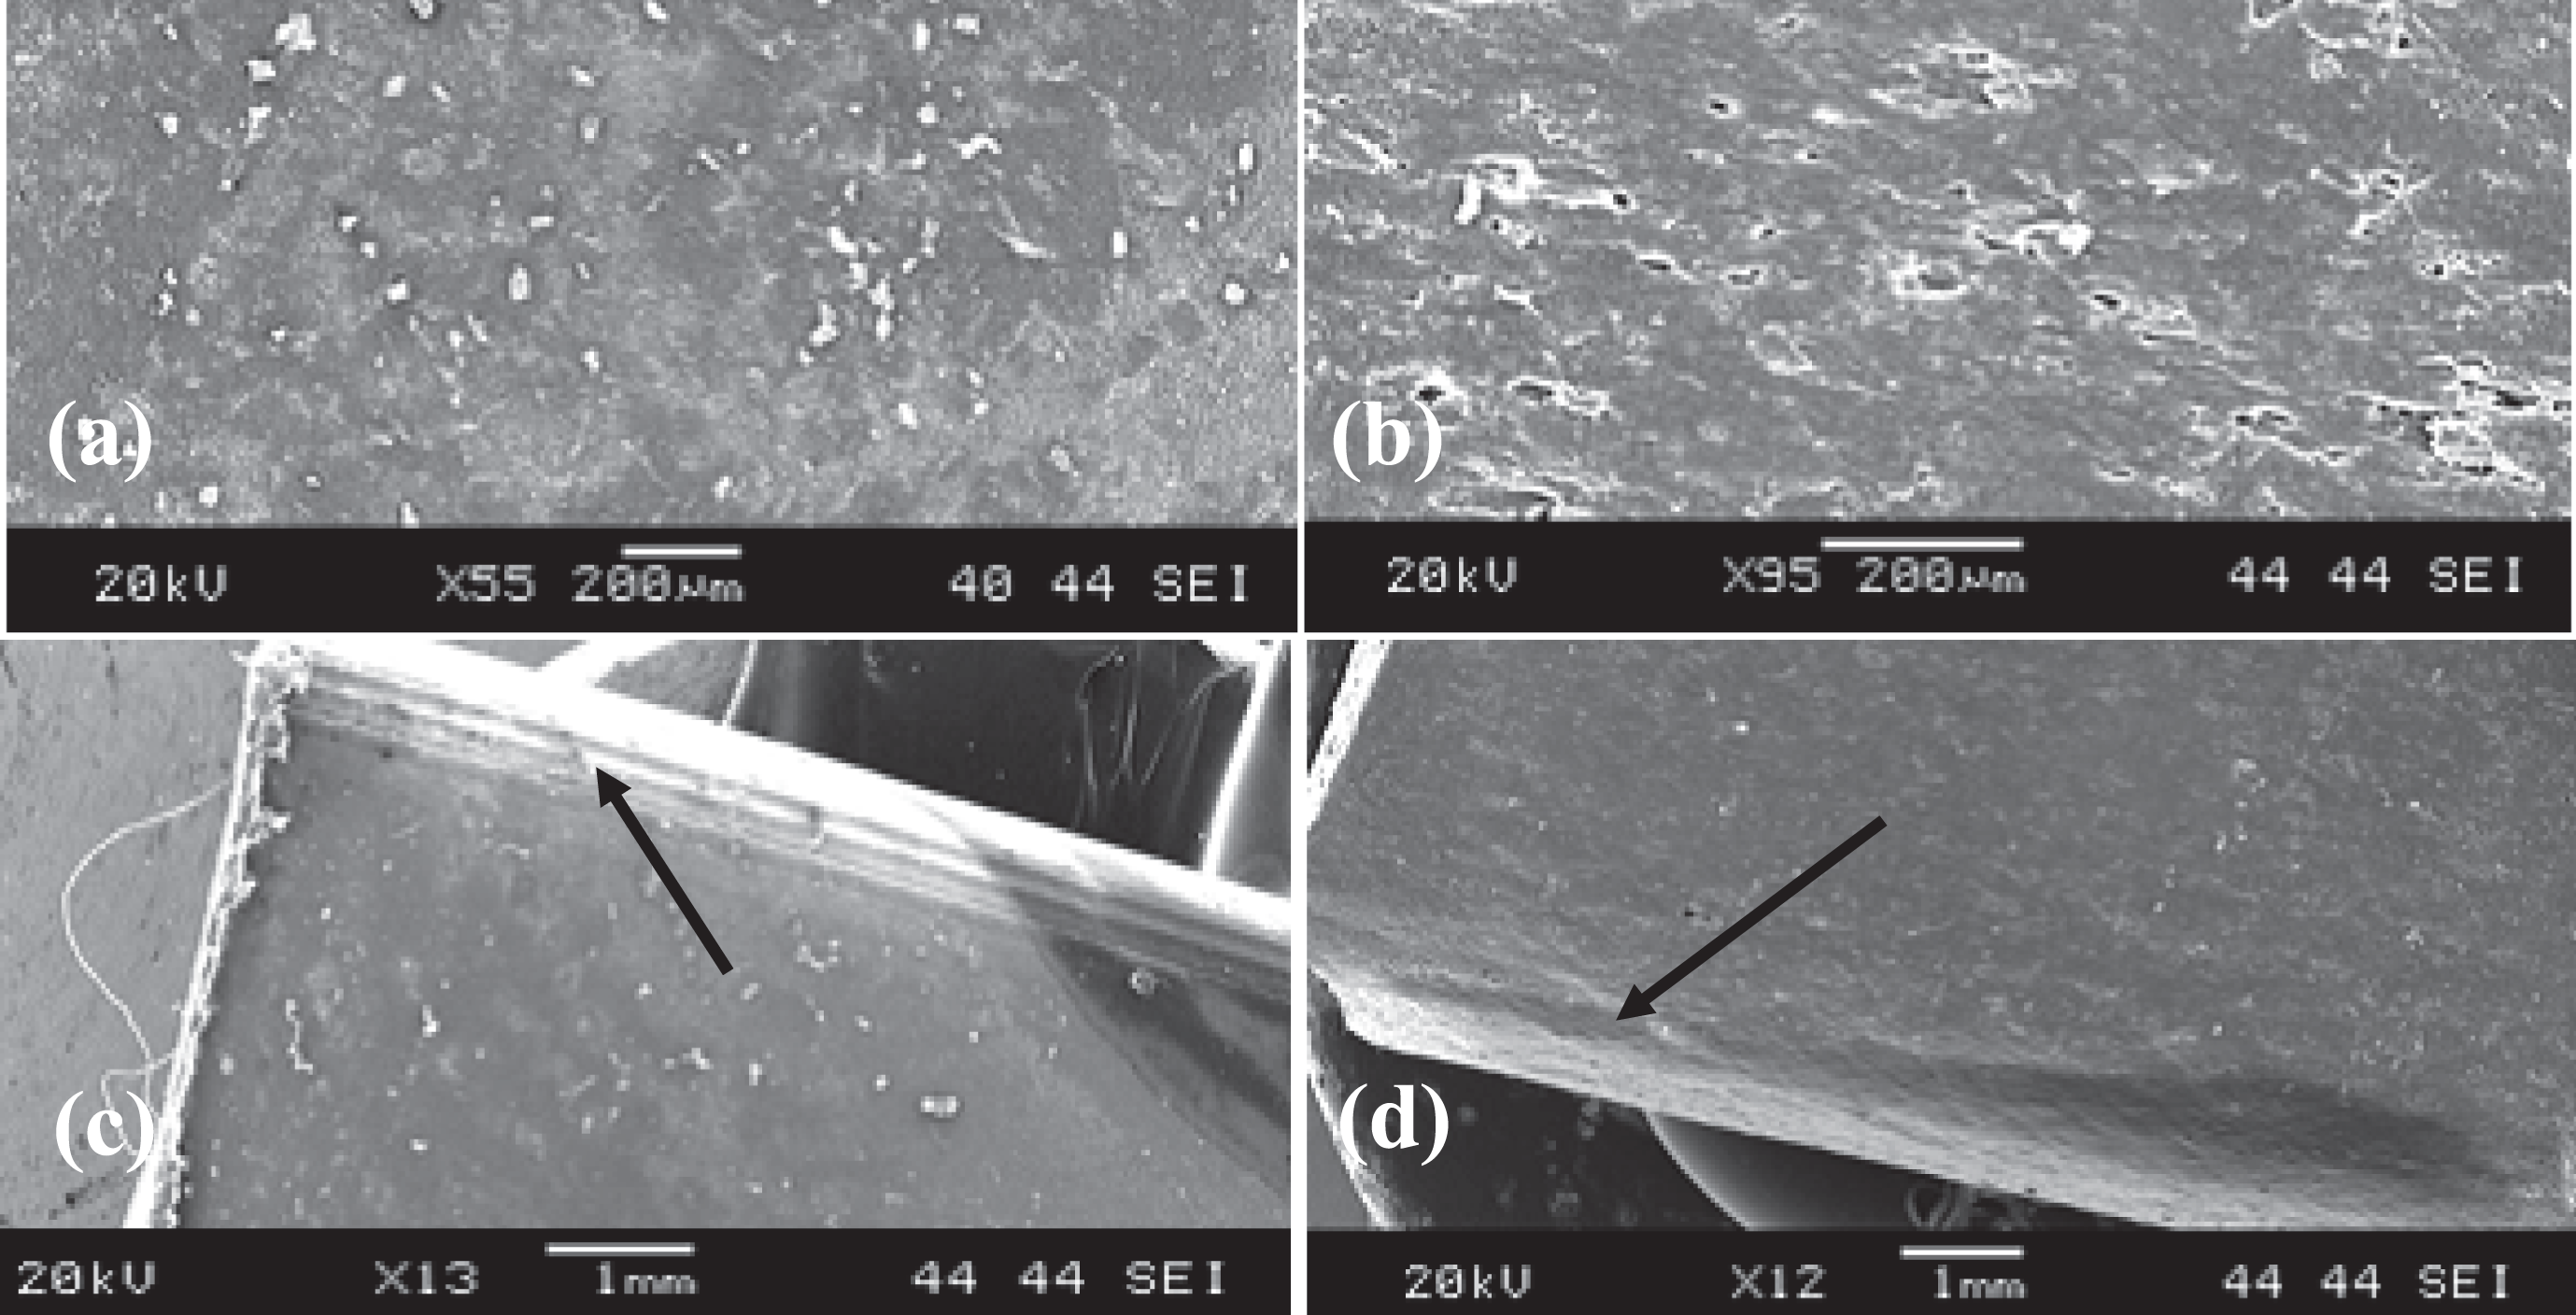
Foamed WPC profile surface texture (a) and (b) as well as corner shape (c) and (d) at 1.0 and 1.3 DDR with 6.5 phr CBA content. WPC: wood-plastic composite; CBA: chemical blowing agent; DDR: drawdown ratio; phr: parts per hundred parts of resin.
In general, the density of the foamed WPC profiles was reduced with increased CBA content and DDR values from 1.5% to 22% (Figure 5). The density reduction was calculated based on the density of the nonfoamed WPC profile (1.05 g/cm3) at 1.0 DDR. At no pulling (1.0 DDR), the density was reduced slightly up to 2.5 phr CBA. Following this, the density was significantly reduced with increased CBA content. The maximum density reduction observed was 22% (∼0.820 g/cm3) at 1.2 DDR with 6.5 phr CBA. As expected in the foaming process, the cells are first nucleated and then continue to grow due to gas diffusion, and the polymer was extended with the reduction in density. The reduction in the density of CBA contents is in agreement with the earlier studies on CBA foamed PP-WF 6 and HDPE-WF 8 foamed WPCs. It was further found that the density was nearly independent of the DDR at a no or low CBA content; however, it reduced gradually with increased DDR at a high CBA content. The density variation was insignificant (within 2.5%) up to 1.7 phr CBA content with the DDR increased from 1.0 to 1.3, whereas it was up to 4.5% to 13% above 2.5 phr CBA content. Past studies showed that the density was nearly independent of the DDR for PVC 16 and the rice-hull-filled PE 22 foamed profiles at a no or low gas content, which agrees with this finding. The density reduction with increased DDR could be possibly due to the formation of more voids from volatiles and water contained in WF at high-temperature extrusion. 20 Also, crystalline orientation, alignment, and lamellae separation by hot stretching could cause the formation of micropores in the HDPE matrix. 23 Density increases at a high DDR with a high CBA content could be the result of the coalescence and collapse of already formed cells. The density was also examined by varying die temperatures from 150 to 170°C. Density was found to be nearly independent in the range of die temperatures at 1.0 DDR with all CBA contents (Figure 6). This clearly showed that although density was significantly reduced with increased DDR at a high CBA content, the deterioration in surface quality and dimensions would, however, restrict the use of a high DDR.
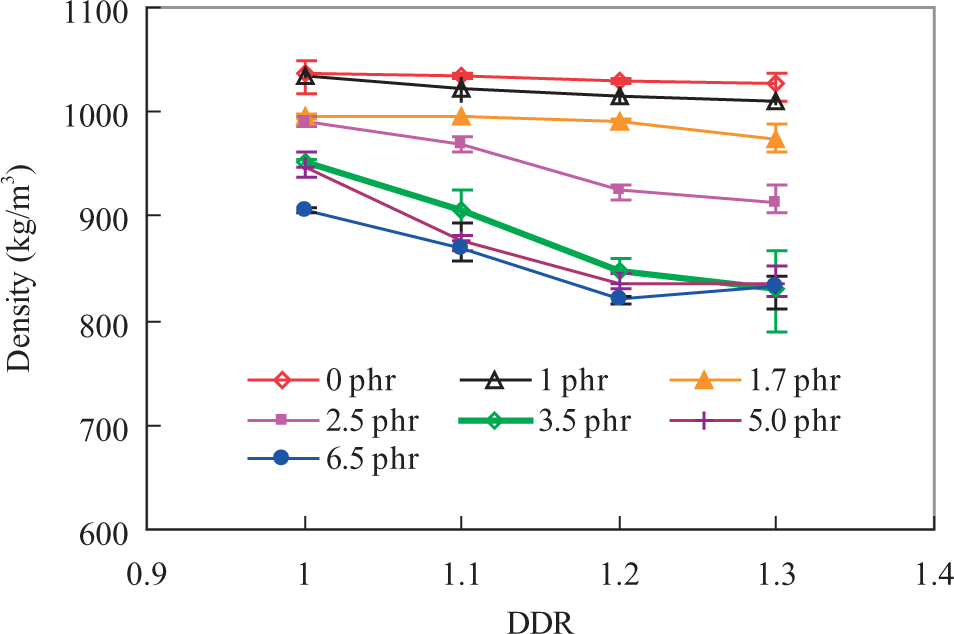
Foam density versus DDR for different CBA contents. CBA: chemical blowing agent; DDR: drawdown ratio.
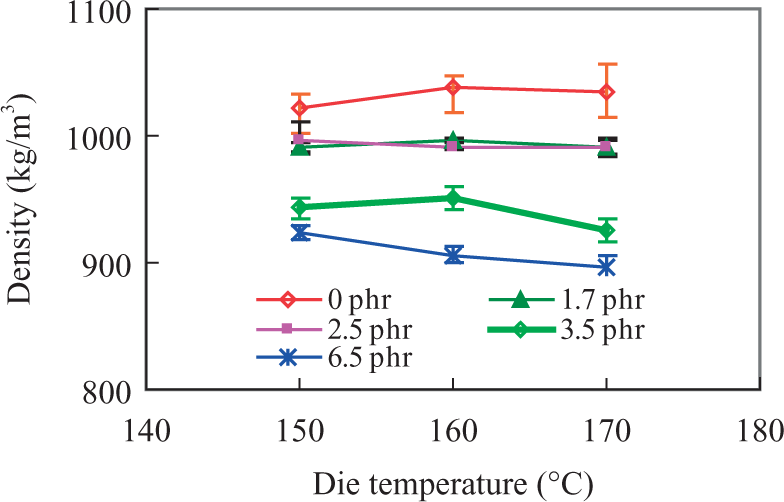
Density versus die temperature with different CBA content at 1.0 DDR. CBA: chemical blowing agent; DDR: drawdown ratio.
Effects on processing parameters
The average torque and die pressure values were monitored during extrusion runs conducted with different CBA content and DDR values. Other processing parameters, such as barrel temperatures, feed rate, screw speed, and cooling condition were kept constant. It was found that the die pressure (Figure 7) and the average torque (not shown) values were altered by increased CBA content and DDR values. Both torque and die pressure values were decreased when the DDR was increased. Die pressure and torque values were generally reduced by the addition of CBA when there was no pull. As expected, the plasticizing effect of gas reduced the melt viscosity of the WP melt, which ultimately decreased the die pressure and torque values. The increased throughput as compared to the feed rate with increased DDR also resulted in decreased die pressure and torque values. Die pressure and torque values were also monitored for different die temperatures from 150 to 170°C. Both die pressure and torque values increased with decreased die temperature for all foamed WPCs (not shown). Due to the high die temperature, the WP melt’s viscosity was reduced and, consequently, the melt flowed smoothly through the die without any increase in pressure and torque values.
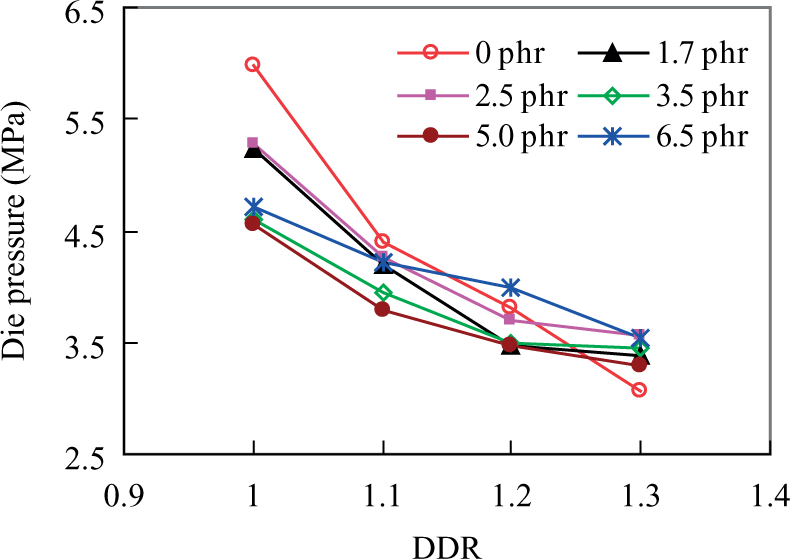
Die pressure versus DDR for foamed WPC profiles with different CBA contents. WPC: wood-plastic composite; CBA: chemical blowing agent; DDR: drawdown ratio.
Flexural properties of foamed WPC profile
To characterize the effects of CBA content and DDR on the mechanical properties of foamed WPC profiles, the flexural properties were measured by three-point bending tests. Specific flexural properties were calculated by taking the ratio of flexural properties to their density. Figure 8 shows the specific flexural strength versus DDR for foamed WPC profiles with different CBA content. Compared with nonfoamed WPC at no pull, the specific flexural strength of foamed WPCs generally increased. In this study, the maximum specific flexural strength was obtained with 3.5 phr CBA at no pull and those values further decreased with increased CBA content. No clear trend was observed for the specific flexural modulus with the CBA content at no pull (Figure 9). Such variation in flexural properties was likely due to the varied density reduction that results from the different homogeneity of WF and CBA in WPC formulations. This result is supported by the trend observed for injection molded MAPP-coupled PP-WF foamed composites with different CBA contents. 3,6 It was demonstrated that specific flexural properties gradually decreased at high WF content (more than 30 wt%) and increased slightly at low WF content (30 wt%) with increased CBA content. In addition, variation in flexural properties was likely due to the varied skin thickness of foamed WPCs (Figure 11). The more skin thickness in foamed profile could delay the crack initiation, which ultimately increased the strength values irrespective of foam morphology. As 5 and 10 phr MAPE and lubricant, respectively, were added to all WPC formulations, their direct effect on the foam properties was not known. However, past studies showed that the MAPE coupling and lubricant improved the extrusion process as well as the foam properties. 8,9 This may warrant further investigation to examine the separate effect of MAPE coupling and the lubricant to the extrusion process and the foam properties.
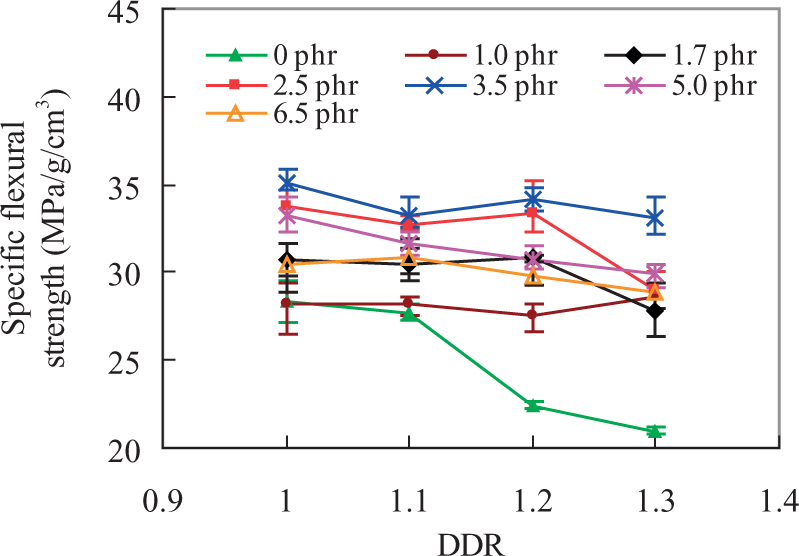
Specific flexural strength versus DDR with different CBA contents. CBA: chemical blowing agent; DDR: drawdown ratio.
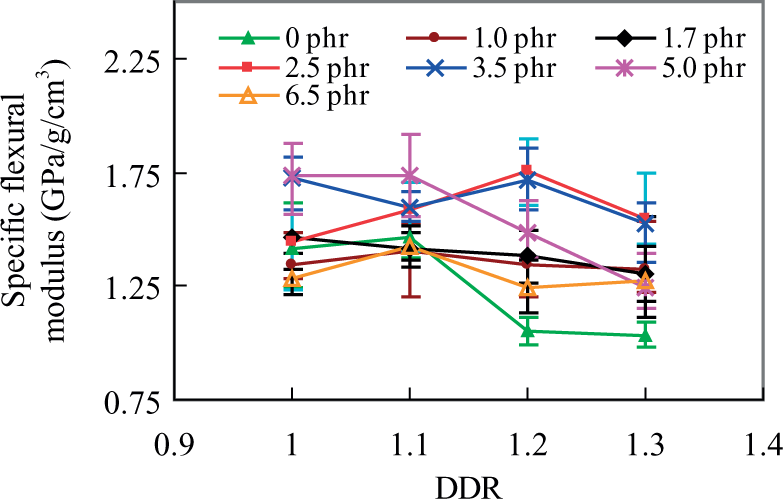
Specific flexural modulus versus DDR with different CBA contents. CBA: chemical blowing agent; DDR: drawdown ratio.
The specific flexural properties of the foamed WPCs were also measured at different DDRs (Figures 8 and 9). The specific flexural strength altered noticeably with increased DDR for all foamed and nonfoamed WPCs. Both specific flexural strength and modulus decreased with increased DDR for nonfoamed WPC. Alternatively, foamed WPCs exhibited a different trend with a different DDR. It was observed that specific flexural properties were slightly reduced or even increased with increased DDR of up to 1.2, depending on the CBA content. Those values generally decreased with a further increase in DDR beyond 1.2, but with some exceptions. The rate of increase or decrease, however, depended on the CBA content. This indicates that there is an optimal DDR value for different CBA content at which optimal flexural properties can be obtained. Optimal flexural properties were generally observed at DDR values of 1.1–1.2. The flexural properties variation could be probably due to the varied density reduction, cell morphology and skin thickness of the foamed WPCs. It is believed that the flexural property of foamed WPCs increased due to a smaller and uniform cellular structure. This belief is supported by the observation of higher cell density and uniform cell distribution at an optimal DDR (Figure 11) which is due to better melt expansion and which ultimately increases the flexural properties of foamed WPCs.
Void fraction, cell morphology of foamed WPC profile
As defined by equation (1), a void fraction was estimated from the density data. The theoretical density of the nonfoamed WPC can be calculated by the rule of mixture. The calculated theoretical density of WPC is 1.05 g/cc based on the density of WF, HDPE, and MAPE/lubricant as 1.40, 0.955, and 0.943 g/cc, respectively. Also the experimentally measured density was 1.04 g/cc for nonfoamed WPC at 1.0 DDR. Hence the void fraction calculated here was based on the theoretical density (1.05 g/cc). Figure 10 shows the void fraction versus the CBA content for WPC’s with different DDRs. The void fraction of foamed WPC’s ranged from 1% to 22%, depending on the CBA content and DDR. The typical dependence of density on the void fraction of foamed WPC can be observed where density decreases with an increase in void fraction. As the estimated void fraction was based on experimental density, the variation that occurs between them with DDR and CBA content was explained above. Due to the added CBA in the foamed WPC, voids formed in direct proportion to the polymer content. It was observed that void fraction increased with increased CBA content of up to 1.2 DDR. Beyond 3.5 phr CBA content, the increase in void fraction is more or less constant. Once the cells are nucleated, they continue to grow as long as there is sufficient gas for diffusion. However, once the nucleated cells are fully grown, cell coalescence and/or collapse may take place with a further increase in the CBA content and DDR. If cells collapse, the average cell sizes decreased along with the void fraction of the resulting foamed samples. 9
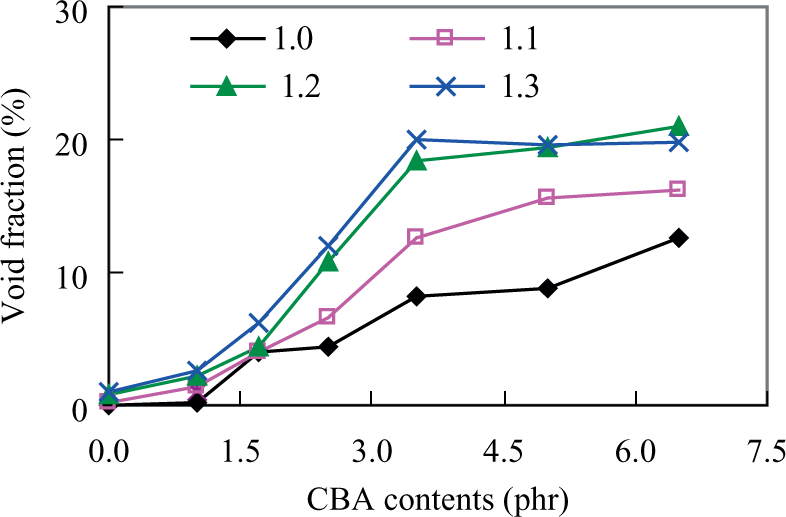
Void fraction versus CBA content for different. DDR. CBA: chemical blowing agent; DDR: drawdown ratio.
SEM images of foamed WPC at 1.2 DDR for CBA contents (a) 0 and (b) 5.0 phr. SEM: scanning electron microscope; WPC: wood-plastic composite; CBA: chemical blowing agent; DDR: drawdown ratio; phr: parts per hundred parts of resin.
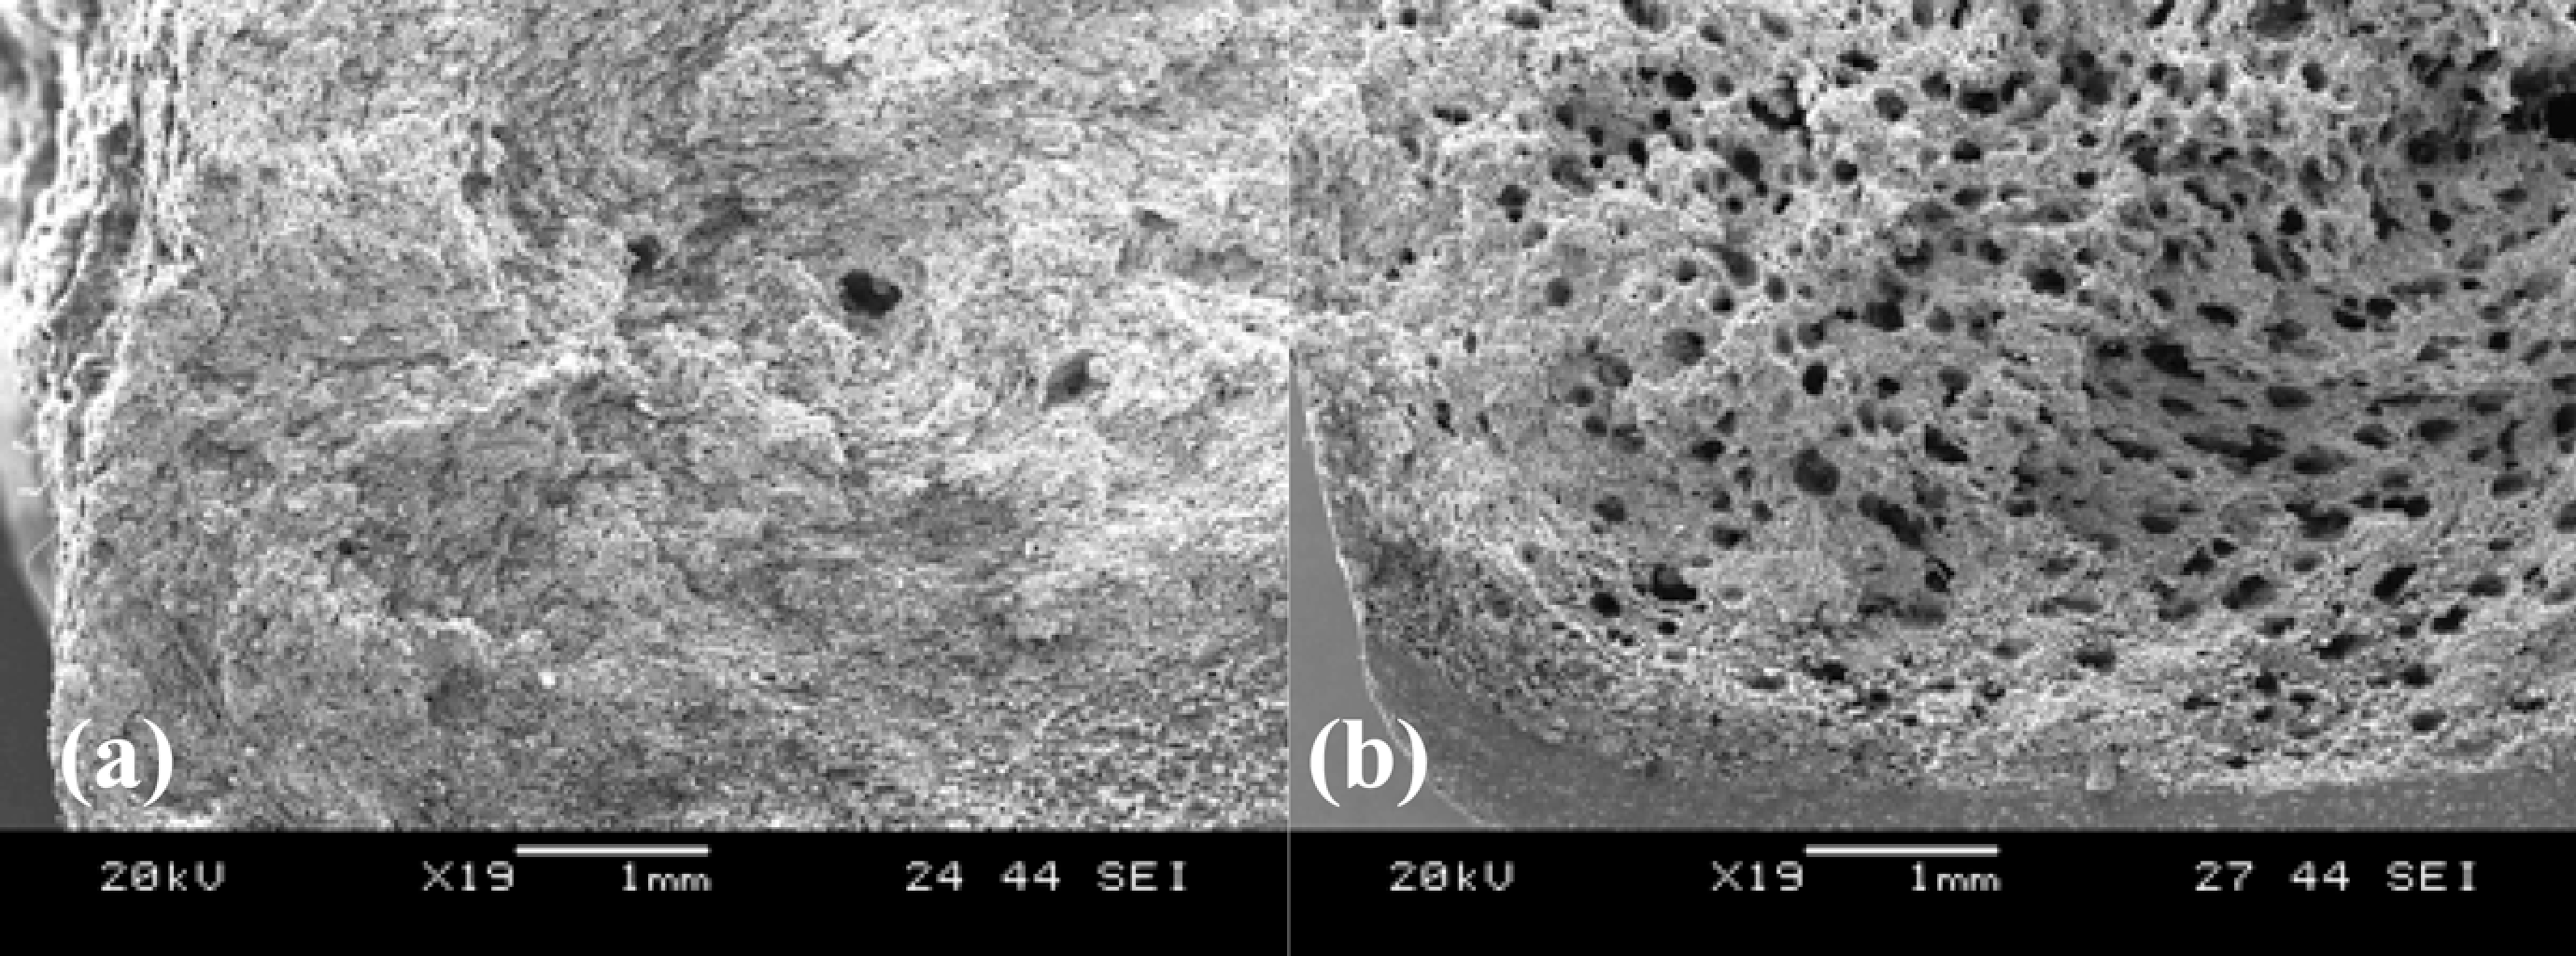
The SEM images of nonfoamed and foamed WPCs are shown in Figure 11. The foamed WPCs had a larger number of cells than the nonfoamed counterparts. The foamed structure had three distinct layers consisting of a core with distributive cells, a solid skin, and a transition zone in between them (Figure 11(b)). Most of the cells were distributed in the core. Fewer cells were in the transition zone. There were no cells in the solid skin. It was observed that the skin thickness varied with the CBA content and DDR (Figure 12). The skin thickness was gradually reduced once the foam core was enlarged by increasing the DDR for all CBA content. The changed relationship of the foamed core to the solid skin is a measure of the foaming status that changes the void fraction and the density. The thicker skin has a higher density and lowers the void fraction.
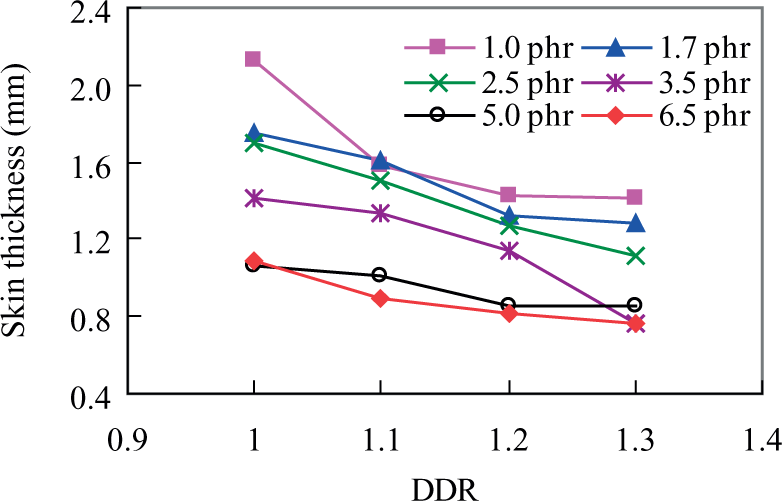
Skin thickness of foamed WPC with different DDRs and CBA contents. WPC: wood-plastic composite; CBA: chemical blowing agent; DDR: drawdown ratio.
Foamed WPCs can be characterized by cell size and cells density. For a given CBA content, cells density is strongly related to the average cell size in the composite, so that the larger the cells, the fewer there are of them. It was found that cells density varied with the CBA content and DDR (Figure 13). With increased CBA content, cells density increased, significantly with up to 5.0 phr CBA content; following this, it did not change noticeably. The cells density with up to 3.5 phr CBA content fell below 105 cells/cm3 at 1.0 DDR. Furthermore, the cells density also varied with the DDR used. Cells density increased with the increase in DDR for all composites. On the other hand, the nonfoamed WPC (0 phr CBA) also showed a number of cells that were the result of microvoid formation due to stretching and release of volatiles presents in WF. The rate of increase or decrease in cell density depended on the CBA content. For example, cell density with 3.5 phr CBA in the WPC increased from 2.6 to 9.9 × 10⁴ cells/cm3 when the DDR was increased from 1.0 to 1.3. Whereas, cell density with 5.0 phr CBA in the WPC increased from 1.0 to 2.1 × 10⁵ cells/cm3 when DDR was increased from 1.0 to 1.2. This pattern indicates that optimal cell density of foamed WPCs at some DDR values exists for different CBA content. When the DDR was increased beyond the optimal value, the cell density remained constant or decreased. Cells density reduction at a high DDR could be caused by the formation of larger cells due to the coalescence or collapse of already formed cells. 3,9
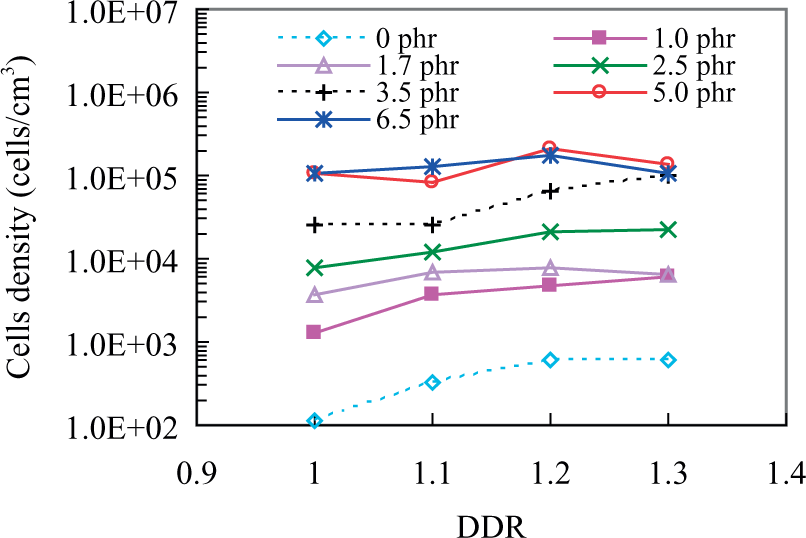
Cell density versus DDR for different CBA contents. CBA: chemical blowing agent; DDR: drawdown ratio.
Figure 14 shows the SEM images of foamed WPCs with 5.0 phr CBA content at different DDR values. Cells are mostly a closed cell structure with irregular and complex shapes. About 80% of the cells have a mean cell diameter of between 30 and 200 μm depending on the DDR used. Smaller cell sizes at a high DDR could result from already formed cells stretching, which can be seen in the SEM images of the transverse fractured surface (not shown). The cell shape changed from fairly spherical to elongate with increased DDR. It was generally observed that cell sizes decreased while cell numbers increased with increased CBA content. Figure 15 shows the cumulative fraction of cell size distribution of foamed WPC with different CBA content. As foamed WPC contained heterogeneous and irregularly shaped cells, the diameter of the cell size represented here was approximate. It was found that the mean cell size distribution curve shifted toward the lower cell sizes at a high CBA content, while the mean cell size distribution curve shifted toward the larger cell sizes at a low CBA content. Similarly, the mean cell size distribution curve shifted toward the larger cell sizes at a low DDR, while the mean cell size distribution curve shifted toward the smaller cell sizes at higher DDR values (not shown). An average cell sizes and their distribution depend on the thermal decomposition behavior of the CBA, nature of the evolved gas, and presence (masterbatch) or absence (pure) of polymer carriers. 9 The decomposition rate of CBA, and their mixing and distribution in the melt depended on the processing methods such as injection molding and extrusion. In case of injection molding, due to the slow decomposition of endothermic CBA with CO2 evolved, initially a small number of bubbles nucleated in the polymer phase. When more gas was generated in the decomposition process, the gas diffused to the existing bubbles rather than nucleating new bubbles, which resulted in the growth of large irregular bubbles 5 ; whereas, the extruded WPC foamed show smaller cell sizes with endothermic CBA. 9 Additionally, the water and gas released from the WF during processing influenced the cell morphology. As water solubility in the hydrophobic polymer matrix was very low, the water molecules formed tended mainly to remain close together instead of dispersing into the polymer matrix. Because of water’s foaming ability at high temperatures, this process led to the formation of large cells. 3 As extrusion is different to injection molding, if gas was injected/or generated in the early zone of extruder, it is possible to dissolve the gas in the polymer matrix depending upon the residence time and pressure as low as the quantity within solubility limit of gas. Hence, influence on average cell size of foamed WPC with CBA decomposition rate could not be generalized.
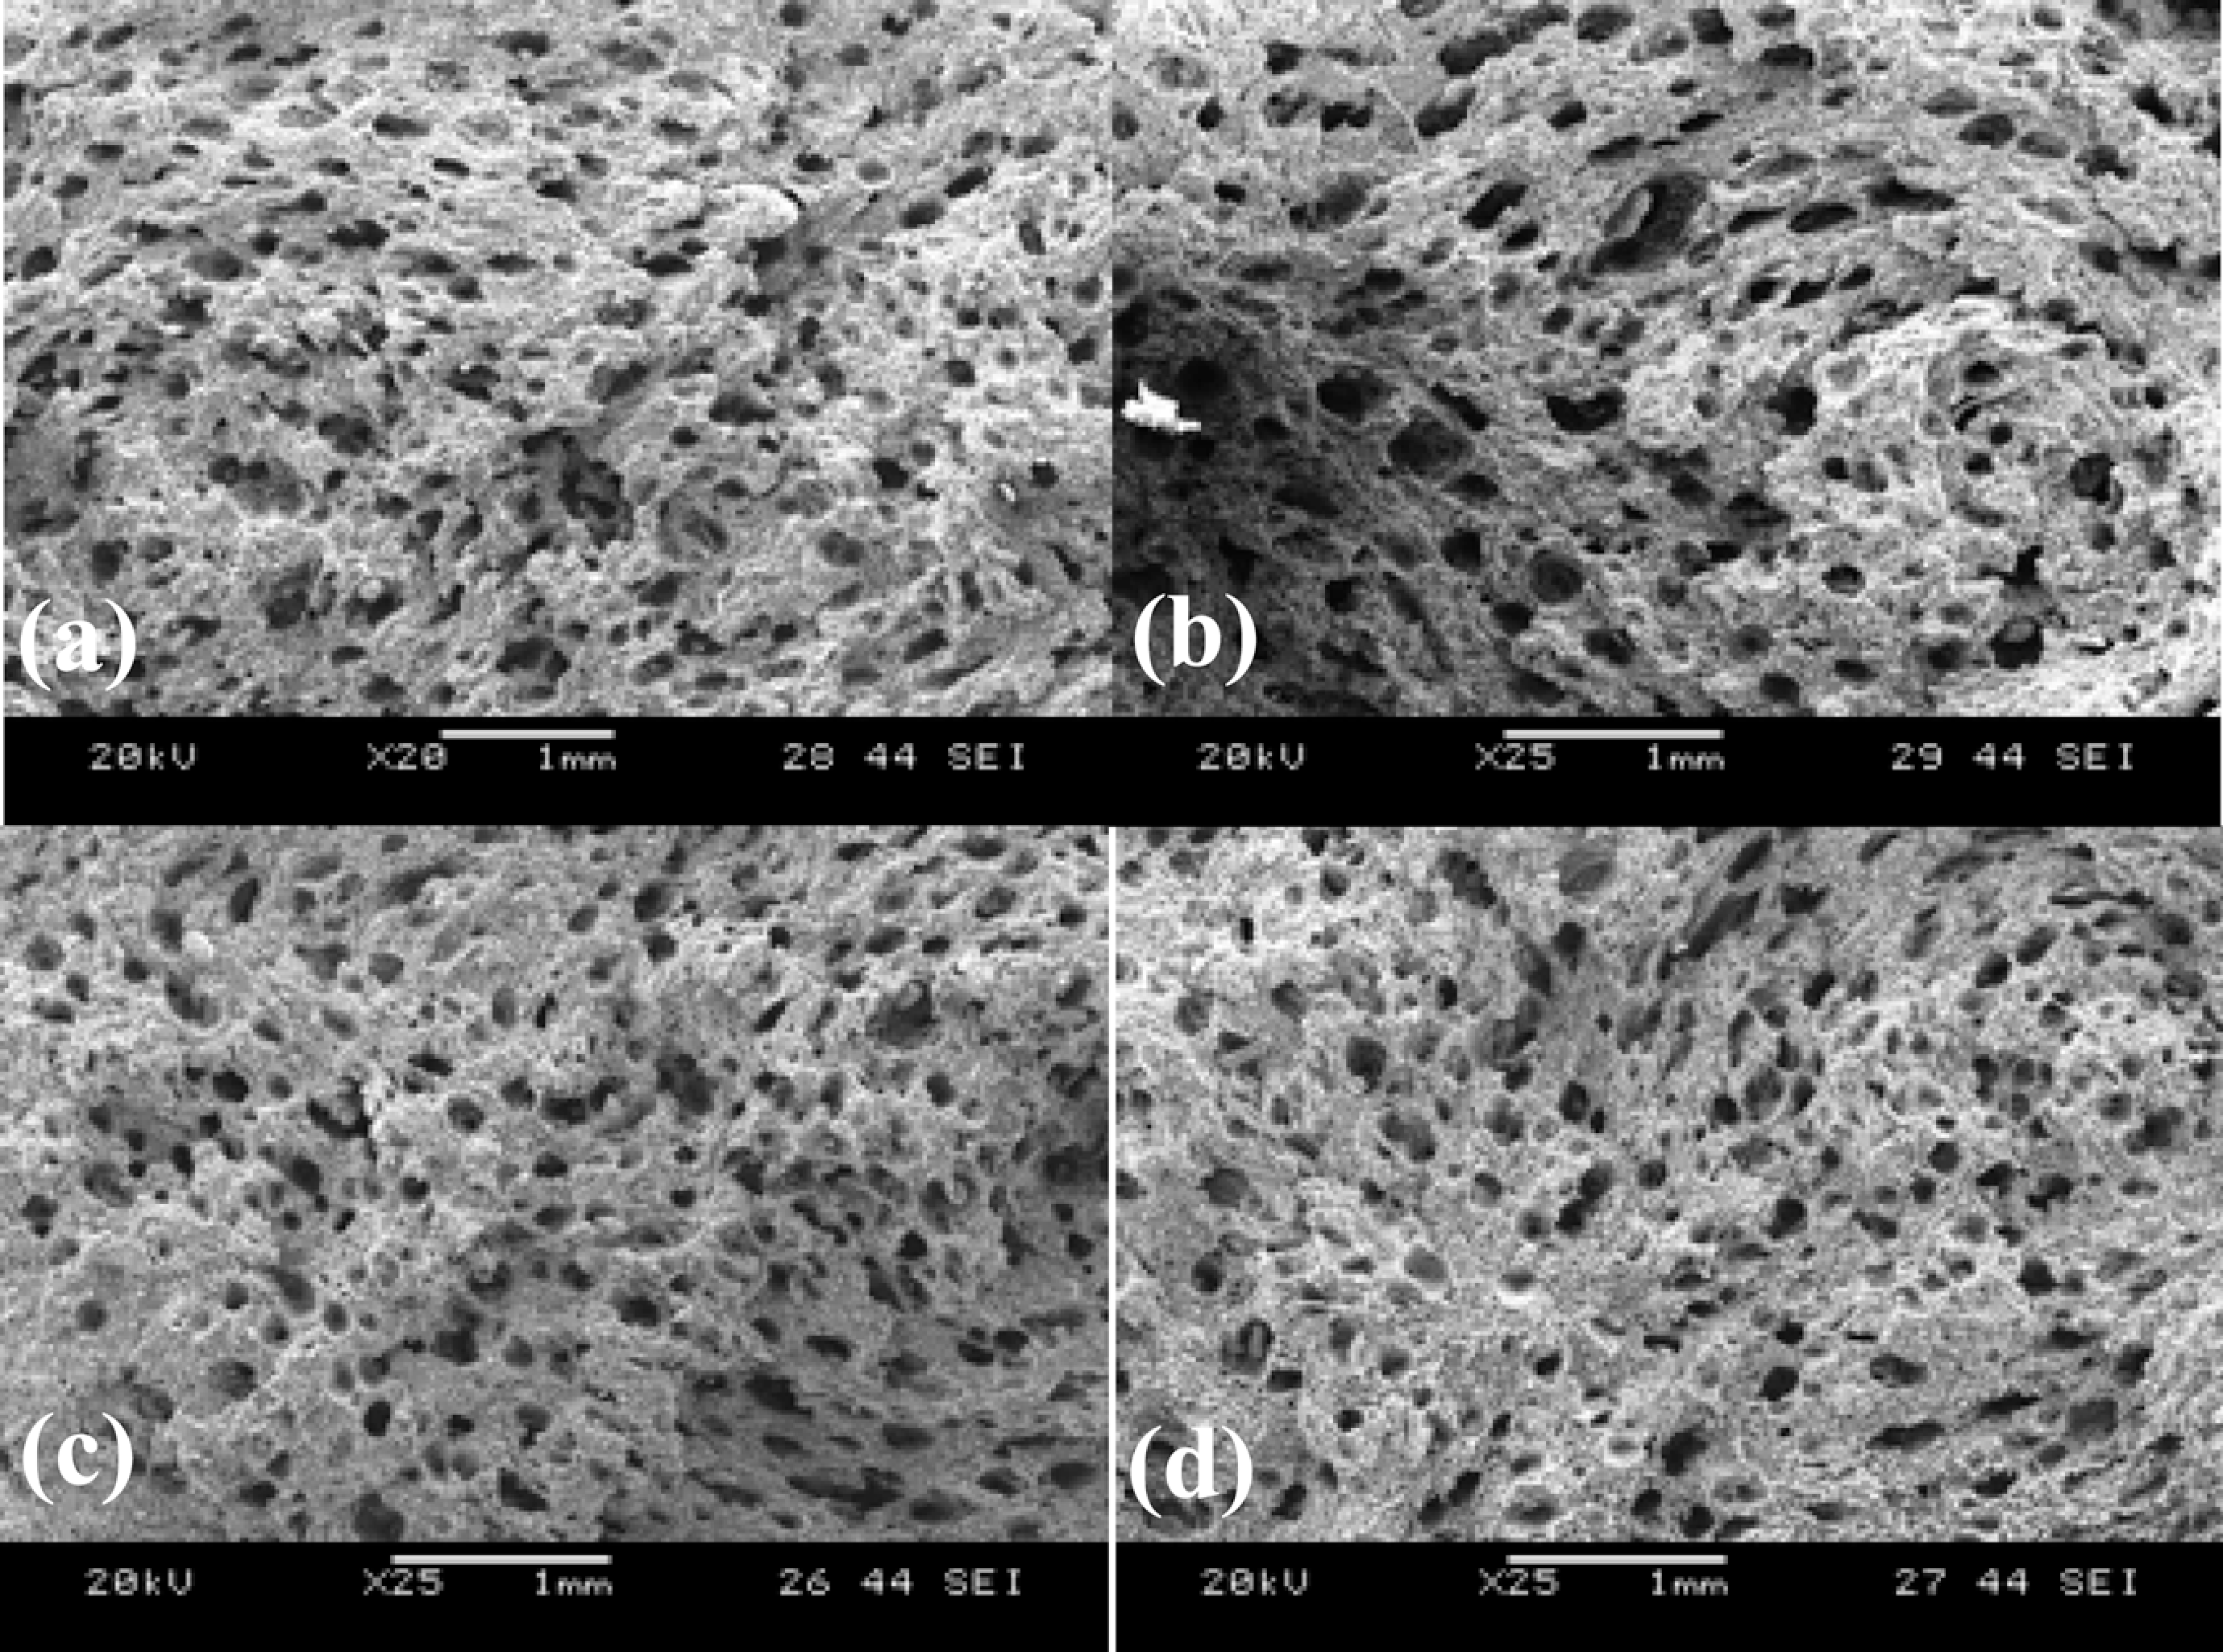
Representative SEM images of fractured foam at a DDR of (a) 1.0, (b) 1.1, (c) 1.2, and (d) 1.3 for 5.0 phr CBA contents. SEM: scanning electron microscope;CBA: chemical blowing agent; DDR: drawdown ratio; phr: parts per hundred parts of resin.
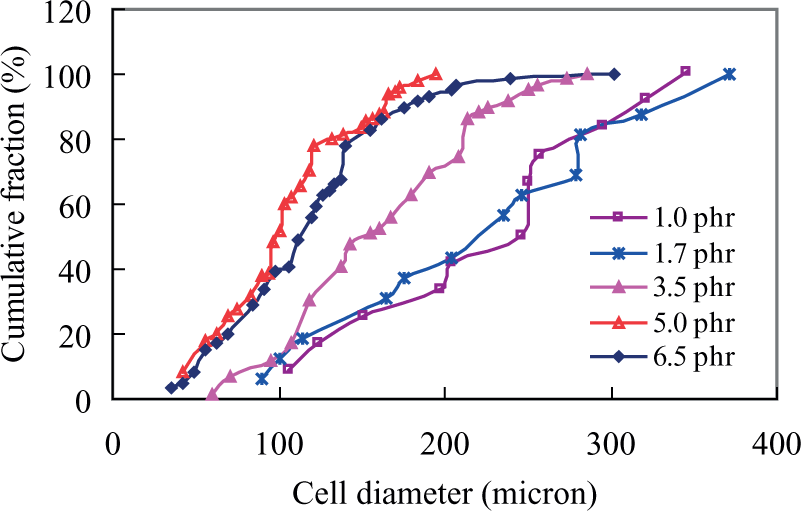
Cell size distribution for WPCs at 1.2 DDR with different CBA contents. WPC: wood-plastic composite; CBA: chemical blowing agent; DDR: drawdown ratio.
Conclusions
Rectangular WPC-foamed profiles were produced from HDPE and WF with different CBA content under varying extrusion conditions using a twin-screw extrusion line. The effects of endothermic CBA content and DDR on the processing, cell morphology, and flexural properties of extruded foamed WPC profiles were investigated. The following conclusions were drawn from this study.
The extruded dimensions, surface texture, and color of the profiles did not change noticeably up to 1.2 DDR; however, these deteriorated significantly above 20% DDR values.
It is possible to reduce the density of WPC’s up to 22% (∼0.820 g/cm3) using 1.3 phr active CBA content and optimal DDR values. Although foamed density was significantly reduced with increased DDR at a high CBA content, the surface quality deterioration restricted the use of high DDR in foam profile extrusion.
Depending on the CBA content, the specific flexural strength and modulus values can be optimized using a DDR of 1.1–1.2. The optimal amount of CBA content for optimal flexural properties needs further investigation.
Cells density, size, and shape were found to largely depend on the CBA content and the DDR used. Cells density increased with increased CBA content. The foamed WPC profile with a relatively uniform and close cell structure, 105–106 cells/cm3 cell density and cell sizes of less than 100 μm can be successfully produced.
An optimal amount of CBA for forming fine cells and the void fraction seemed to be around 1.0% active endothermic CBA content and a DDR of 1.2 using a twin-screw extrusion profile line; however, further investigation is warranted.
Footnotes
Acknowledgements
The materials were supplied by American Wood Fibres, Nova Chemicals, and Reedy International.
Funding
This work was supported by the Ontario Centres of Excellence (OCE), Canada.