
Abstract
In this work, a method developed for the measurement of the transversal permeability of fibrous reinforcement is presented. The permeability of a reinforcement is defined by the Darcy equation and can be obtained once the pressure drop through the reinforcement and the viscosity and average velocity of the fluid are known. The method used in this work is based on a proper modification of a capillary rheometer, obtained by substituting the capillary with a tool, capable of sustaining the reinforcement during reinforcement impregnation and through thickness flow. The developed device was used to measure the pressure built during the flow at different velocities of the rheometer piston. The impregnation tests were performed at different temperatures using a high-viscosity matrix characterized by a Newtonian behaviour. At each temperature, pressure versus velocity plots showed two distinct zones, each characterized by a different slope. The slope observed at low pressures was higher than the slope observed at pressures, suggesting an increase in the permeability with increasing pressure or velocity. The double slope was attributed to the existence of two different impregnation mechanisms, the first one being characteristic of the flow of the matrix around the reinforcement bundles and the second is the characteristic of the flow of the matrix inside each bundle. Dimensionless analysis models and scanning electron micrographs were used to support that the slope of the first portion of the plot is due to inter-bundle flow, whereas the slope of the second portion is due to global flow including both inter- and intra-bundle flow.
Introduction
Transversal permeability of textiles is a key characteristic for composite manufacturing and in particular for the resin infusion processes where the through-thickness impregnation is promoted by resin distribution nets. Permeability has posed a major challenge to researchers and engineers in a wide range of industrial and academic disciplines. These include, but are not limited to, resin transfer moulding, 1–6 pultrusion and autoclave processing, 7 biomedical engineering, 8 ,9 subsurface flow of oil and groundwater, 10 ,11 filter 12 ,13 and fuel cell simulation. 14 ,15
The permeability of a porous medium can be defined as a tensorial quantity, which relates the local velocity vector of the fluid flow with the associated pressure gradient. In a monodimensional flow perpendicular to the plane of a composite material reinforcement, as occurring in compression moulding or vacuum moulding of thermoplastic matrix composites, the permeability K of the medium can be calculated using the Darcy law, 16 strictly valid for Newtonian fluids 17 :

In which η is the Newtonian viscosity of the fluid, ΔP is the pressure drop across fabric thickness and L is the thickness of reinforcement. In composite manufacturing processes involving fibre impregnation, permeability, which has the dimensions of m2, is a characteristic property of the reinforcing fibres for a given reinforcement volume fraction.
Significant efforts were made in the past decade to develop computational tools which can be used, in conjunction with experimental measurements, to determine the permeability of reinforcement preforms used in liquid infusion processing of composite materials. A successful computational modelling approach capable of predicting fabric permeability must include both the actual architecture of the fabric and the basic physics of the flow through it. Prediction of the permeability of porous media has been the subject of intense research for the last three decades. In 1986, Johnson et al. 18 introduced a transport parameter, based on the electrical conduction principles and directly linked to viscous flow, which is capable of leading to permeability from more readily measurable physical properties, such as the porosity and specific surface area. Johnson et al.’s method was tested numerically and experimentally, with positive results in most cases; it was found to give very good permeability estimates for various types of porous media over broad ranges of porosity, though with some exceptions. In 2004, Krawczak et al. 19 performed unidirectional compression tests on impregnated fibre reinforcements to induce in-plane and through-thickness fluid flows. The purpose of the methodology is to measure hydraulic permeabilities using unidirectional compression experiments. This methodology is based on the measurement of the total stress σzz and the effective stress σ0zz during unidirectional compression test. Then the fluid pressure p can be extracted and exploited to back calculate the fibre reinforcement permeability. In 2005, Drapier et al. 20 presented the measurement of the through-thickness permeability in continuous fibre-reinforced composites, more precisely in new multiaxial stitched semi-products, developed by Hexcel, and named Non Crimp New Concept (NC2) multiaxial fabrics. 21 This study presents the measurement of the through-thickness permeability of a selected NC2 semi-product intended for automotive applications. Relying on optical fibre sensors, the transient permeability is assessed and appears to be consistent with the measurements in saturated regime presented in Ref. 22. In 2007, Gillespie et al. introduced an apparatus to measure the saturated permeability of fibrous preforms using both gaseous and liquid flow. This study proposed a transverse permeability measurement system with a variable thickness mould cavity that overcomes the limitations of earlier efforts. The setup creates a uniform one-dimensional flow through the thickness of the reinforcement by integrating a high-permeability layer on the mould surfaces. A wide range of permeability as a function of fibre volume fraction can be measured in one experiment, while applying a known load under a hydraulic testing machine. 23 The measurement of transversal permeability during filling of fibrous composite has been evaluated by several authors. 24 –26 This method consists of evaluating pressure/flow rate couples at a given fibre volume fraction after injecting a test fluid through the fibrous preforms. In these studies, the tests were performed using low-viscosity (0.1 Pa s) Newtonian fluids.
On the other hand, in conventional processing of composite materials, impregnation occurs at different scale levels, that is macro- and micro-impregnation. Macro-impregnation is the result of matrix flow between bundles or yarns and involves elimination of large-scale dry spots. Micro-impregnation is the result of matrix flow inside each bundles, around individual fibres, and affects microporosity and the quality of the fibre–matrix interface. 27 –32
In this article, a continuous method for the measurement of transversal permeability during the impregnation of fibrous reinforcement with a high-viscosity thermoplastic matrix has been studied. The model system used is composed of a unidirectional flax woven fabric and ethylene vinyl acetate (EVA). Rheological analysis performed on the matrix at different temperatures showed that the matrix is characterized by a Newtonian behaviour.
Optical micrographs of composites were used to determine the fibre volume fraction. The permeability of the reinforcement was measured by a plot of the measured pressure as a function of the velocity set during experiments performed with a properly modified capillary rheometer. The resulting structure of the composite was studied by optical microscopy. The volume fraction of fibres was used for the prediction of reinforcement permeability applying proper mathematical models.
Materials and methods
The thermoplastic matrix used is a thermoplastic blend of low EVA and wax with a density 1040 kg/m3 provided by Axel (Italy). The matrix is characterized by a low melting point (in the range 50–80°C) evaluated by a calorimetric analysis (DSC METTLER TOLEDO 877). The fibrous reinforcement used is a unidirectional flax woven fabric 300 HS 45 provided by Fidia (Italy).
An in-plane image of the fabric, showing its architecture, obtained by optical microscopy, is reported in Figure 1. Here the double-scale architecture of the fabric is well evident. The single filaments of fibres are arranged in bundles, which constitute the warp and weft elements of the fabric.
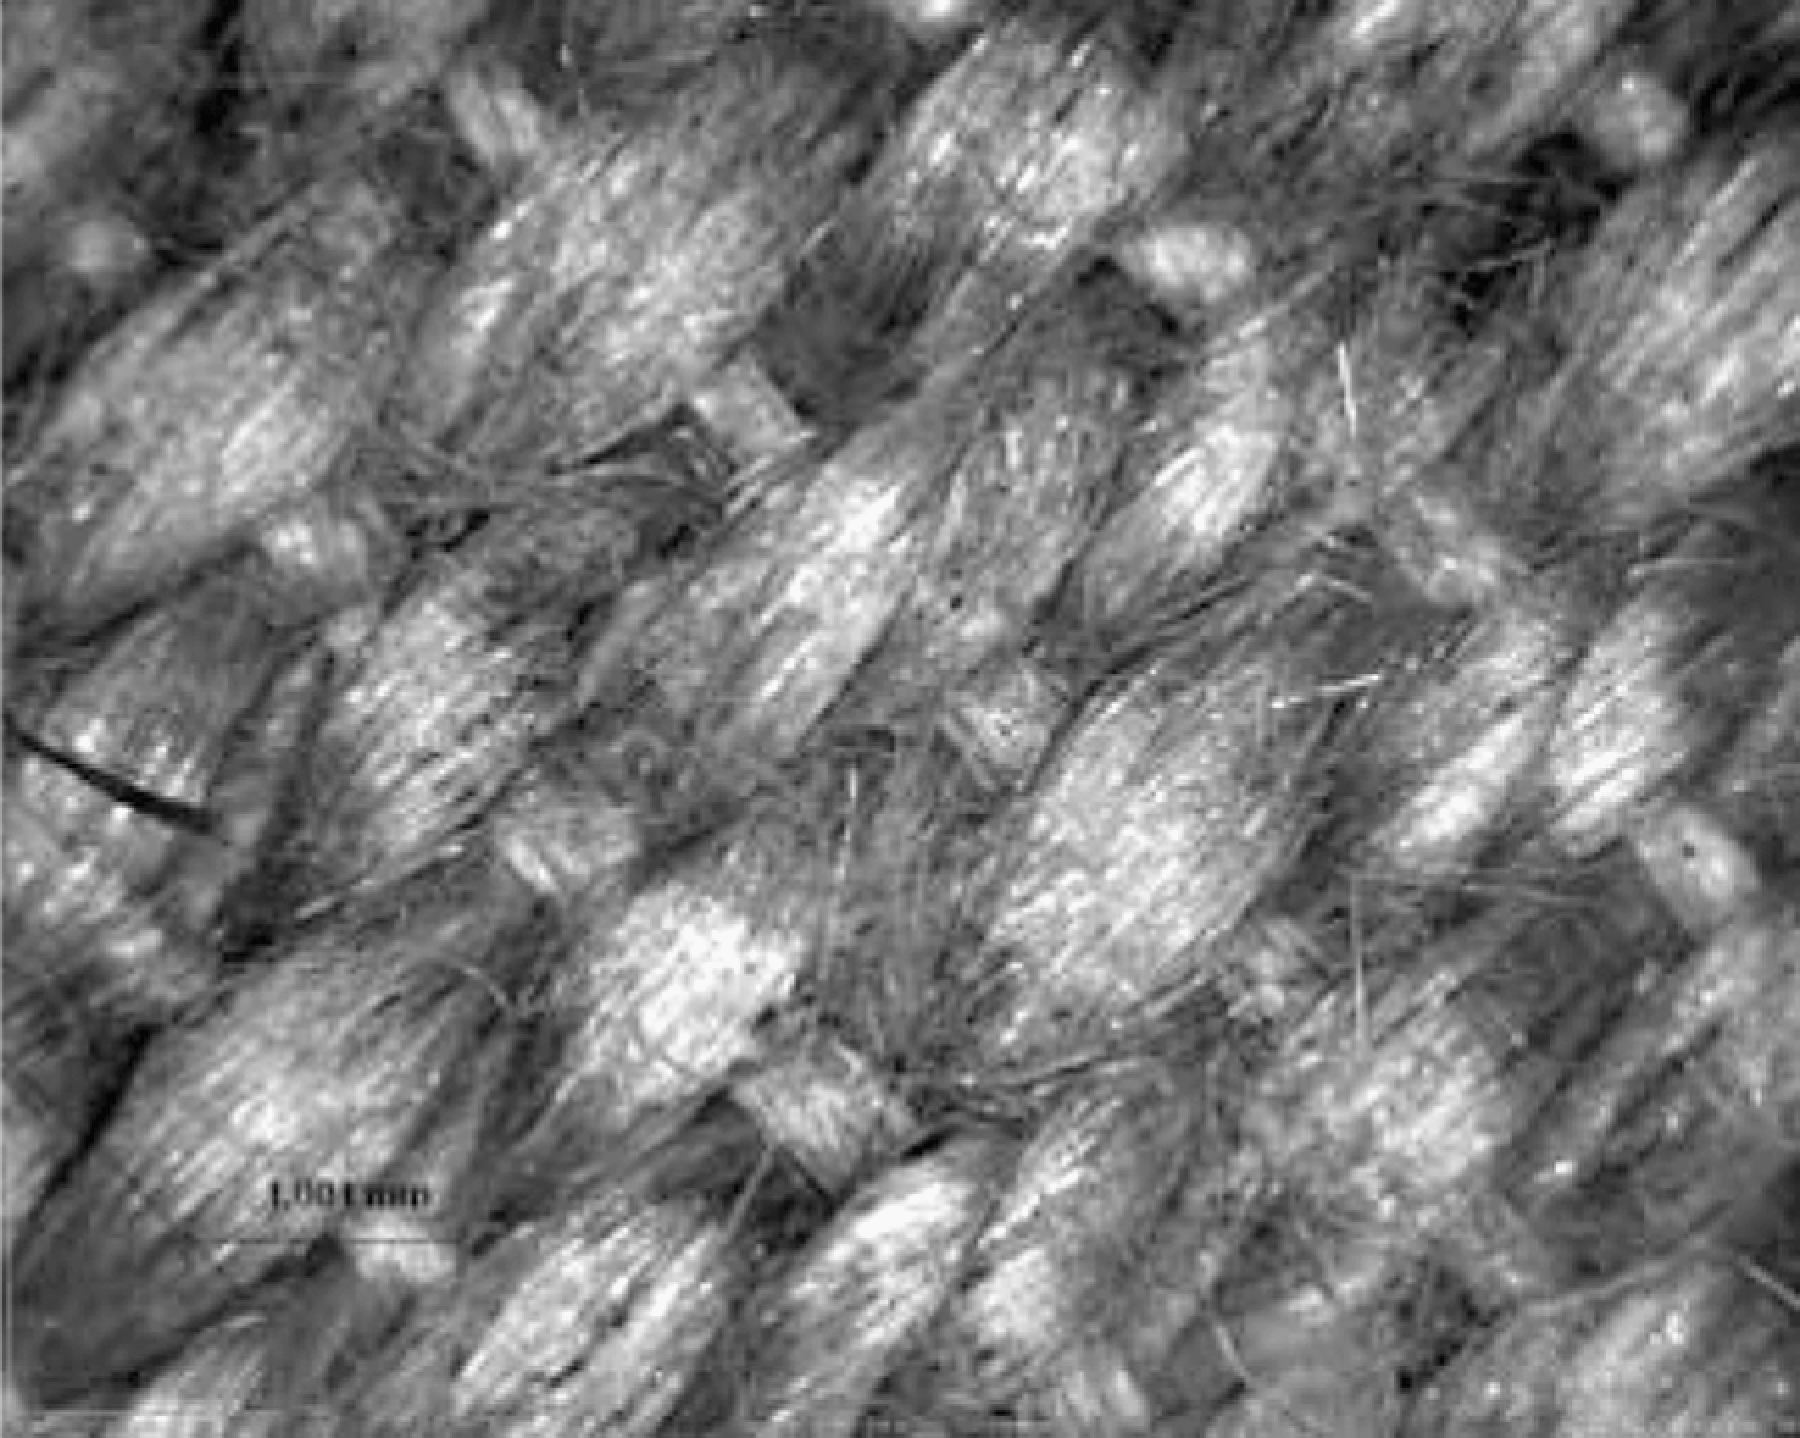
Optical microscopy image of flax fabric.
Matrix viscosity was measured in steady state using a cone and plate rheometer ARES II from TA Instrument, at four different temperature (85, 90, 95, 100°C) in a range of shear rate between 0.1 and 10 s−1.
Scanning electron microscopy ([SEM] EVO 60 ZEISS) was performed on samples consolidated at different temperatures in order to measure the fibre–matrix distribution. A Nikon Model Epiphot 200 was used for optical microscopy analysis in order to evaluate the inter- and intra-bundle volume fractions. Specimens cut from the centre part of composite were polished with SiC paper disks and then with diamond particle solutions before optical analysis. Energy dispersive X-ray spectroscopy (EDS) analysis microprobe (Bruker 127 eV) was used to identify the elemental composition of composite, in order to evaluate the degree of impregnation.
Capillary rheometer experiments
The experimental measurements of impregnation were carried out on samples made of two layers of flax at different temperatures, using a REO-TESTER 1000 GOTTFERT capillary rheometer equipped with a 20-bar pressure transducer. This instrument was modified by substituting the capillary with a tool, holding the reinforcement during impregnation. A sketch of the equipment used for impregnation of woven glass fibre is reported in Figure 2. It is made of a capillary rheometer (g), equipped with pressure transducer (f). The rheometer is modified by substituting the capillary with a tool (e), supporting the reinforcement (c) during impregnation. During the tests, performed at four different temperatures (85, 90, 95, 100°C), a piston (a) moves at a constant speed downward forcing the molten polymer (b) through the fabric (c). The fabric is clamped between the tool (e) and the lower surface of the reservoir by means of a threaded nut (d). A teflon ring (h) is placed between the fabric and the metallic parts to prevent material leakage.
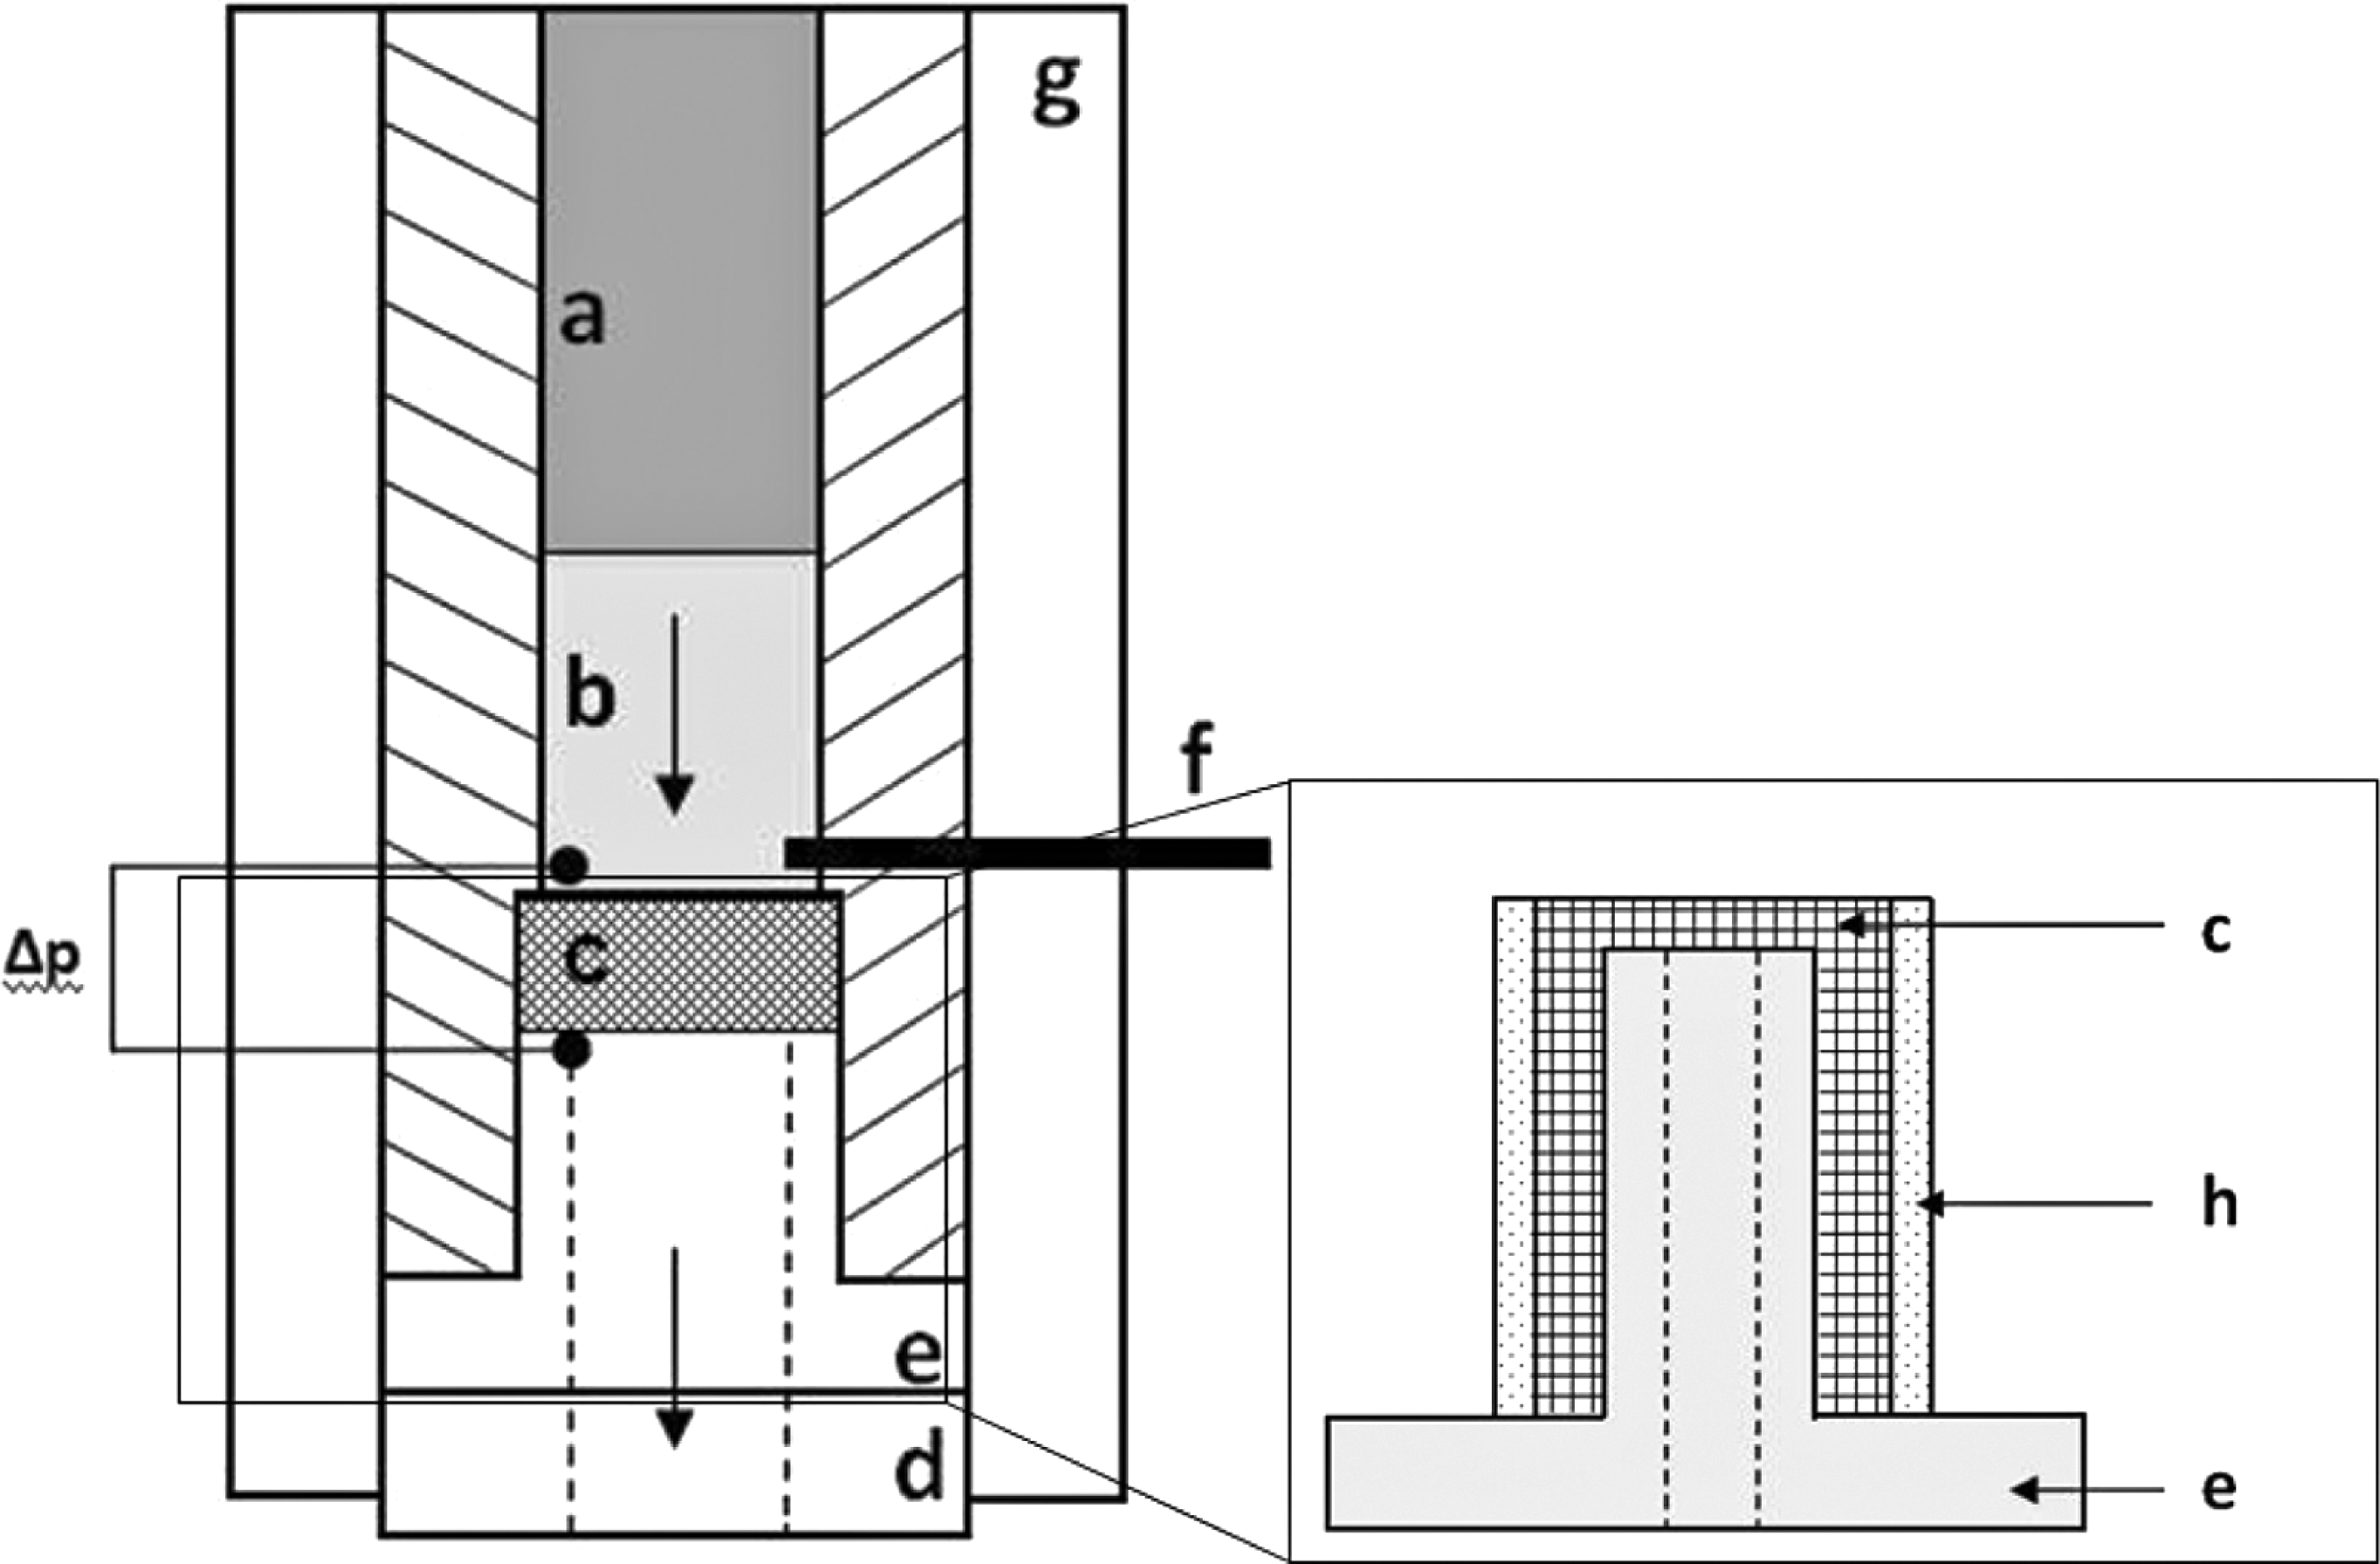
Sketch of the equipment developed for the impregnation of woven glass fibre.
The pressure transducer measures the values of pressure drop (Δp) above the fabric. The average velocity of matrix through the reinforcement was obtained as:

where:
v p is the velocity of piston,
S p is the cross section of the piston or the cylinder,
V M is the average velocity of matrix through the thickness of woven fabric, and
S M is the cross section of the woven fabric impregnated.
A typical plot of V
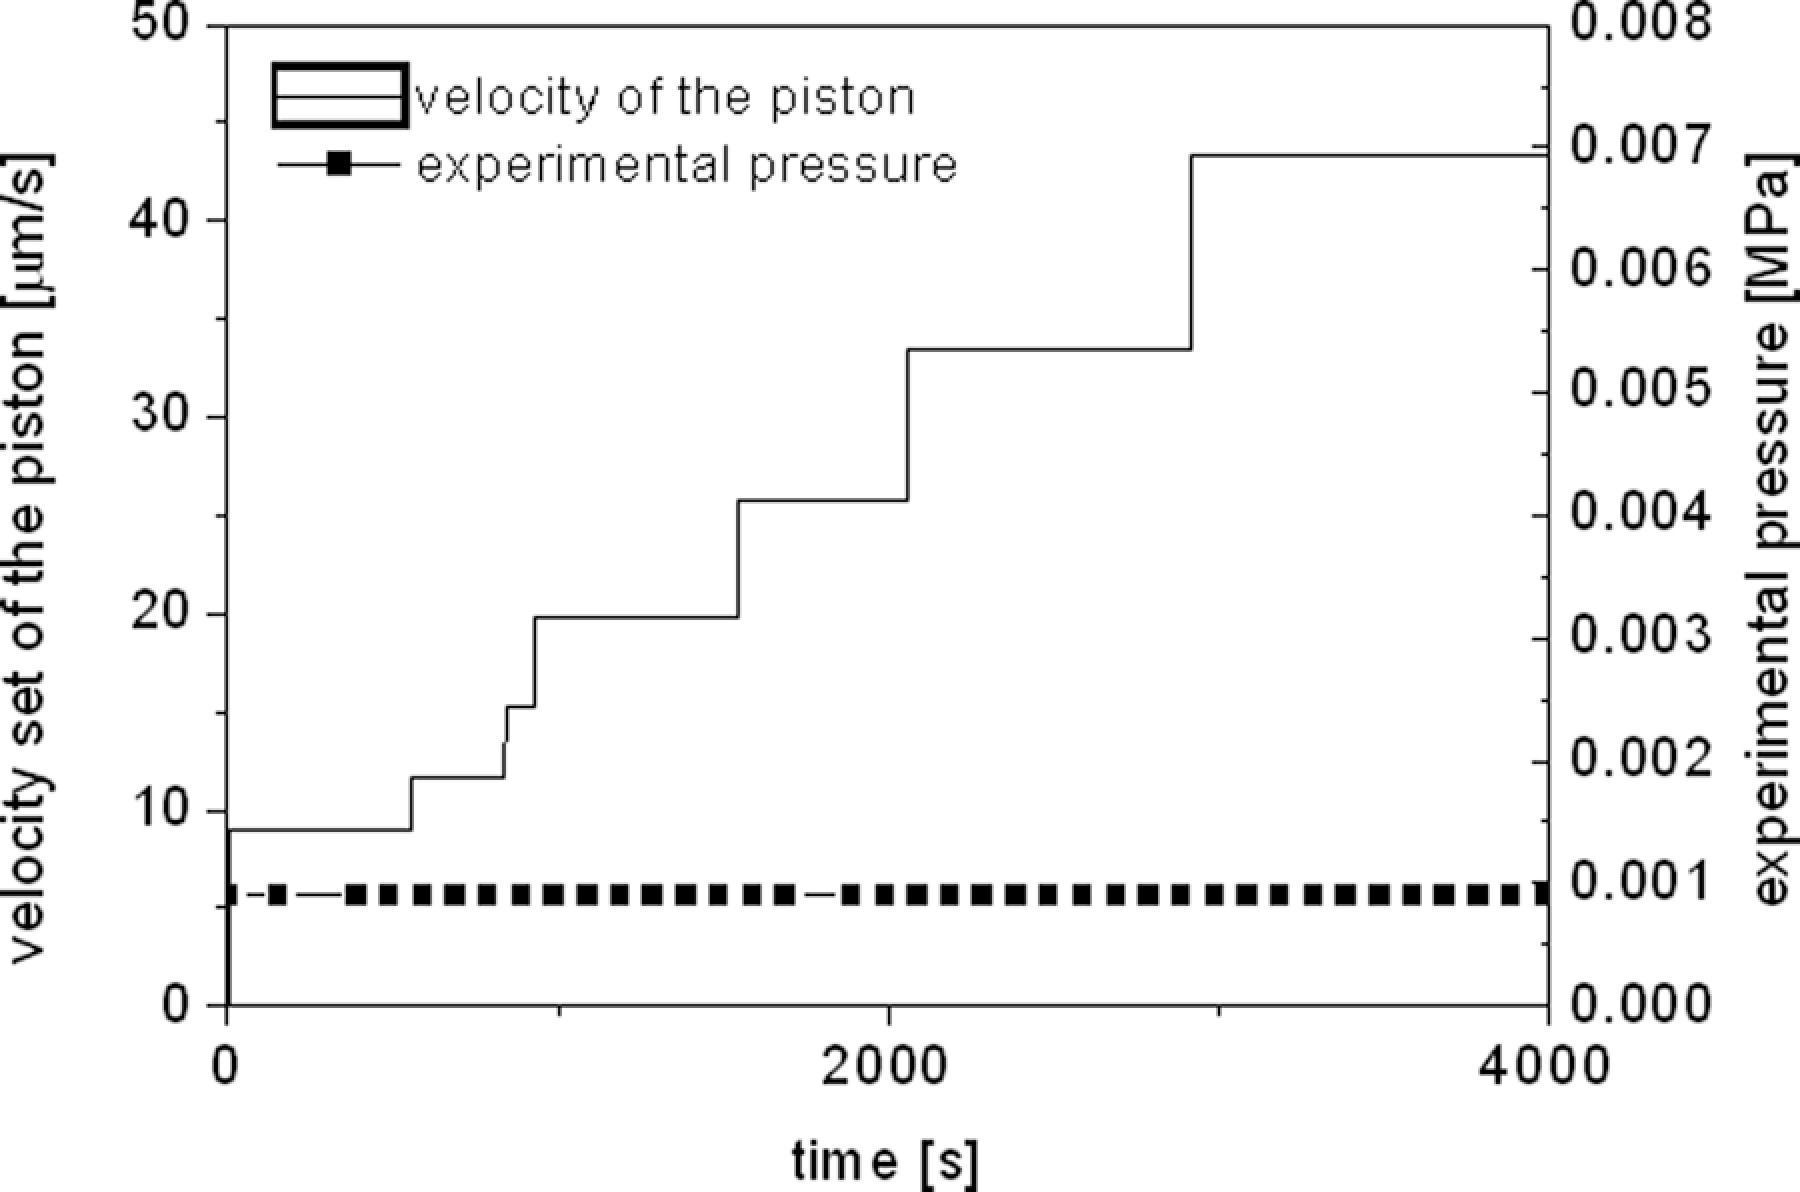
M and pressure build as a function of time is reported in Figure 3. The velocity, imposed as independent variable, was set at different values. In correspondence of each increase in velocity step, the pressure increases in a continuous way, reaching a plateau value after about 50–100 s. The time necessary for the pressure to reach the plateau is the time of transient behaviour of the fluid, necessary to reach again the steady state condition but at higher flow rate. During the transient period, Darcy equation, which is derived in steady state conditions, neglecting all acceleration and or/convection terms in the momentum continuity equation cannot be applied. After the transient interval, the plateau value of pressure corresponds to a steady state behaviour and Darcy equation can again be applied. Therefore, the permeability K of the fabric was calculated, according to Eq. (1), from the slope, B of the pressure–velocity plot: Velocity of the matrix and experimental pressure versus time. Velocity of the piston and experimental pressure versus time in a test without fabric. ΔP
TOOL is the pressure drop through the empty tool; ΔP
TOT is the total pressure drop; ΔP
FABRIC is the pressure drop through the fabric.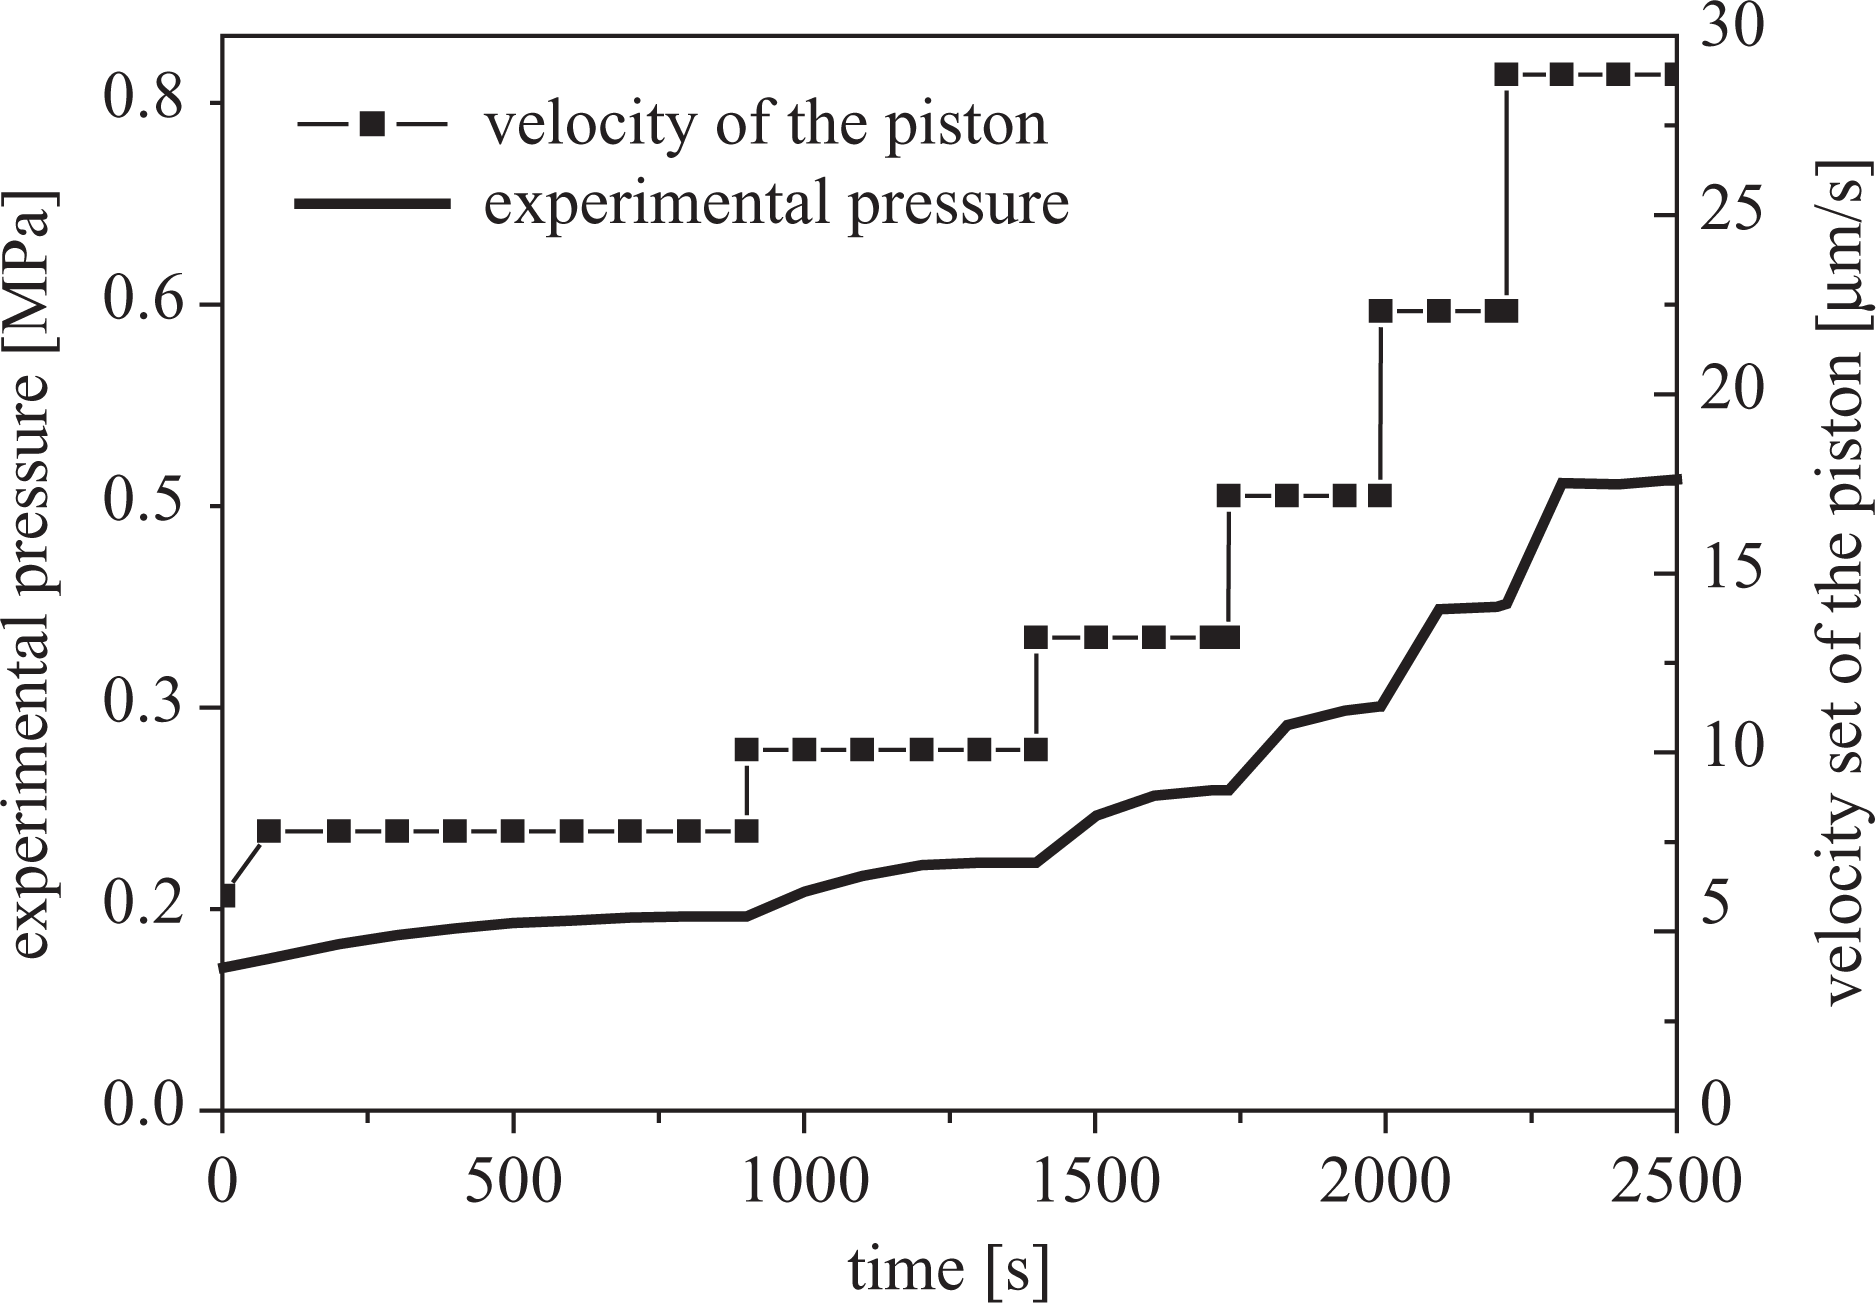
Therefore, the total pressure drop can be used for the determination of the fabric permeability according to Eqs. (1) and (3).


Results and discussion
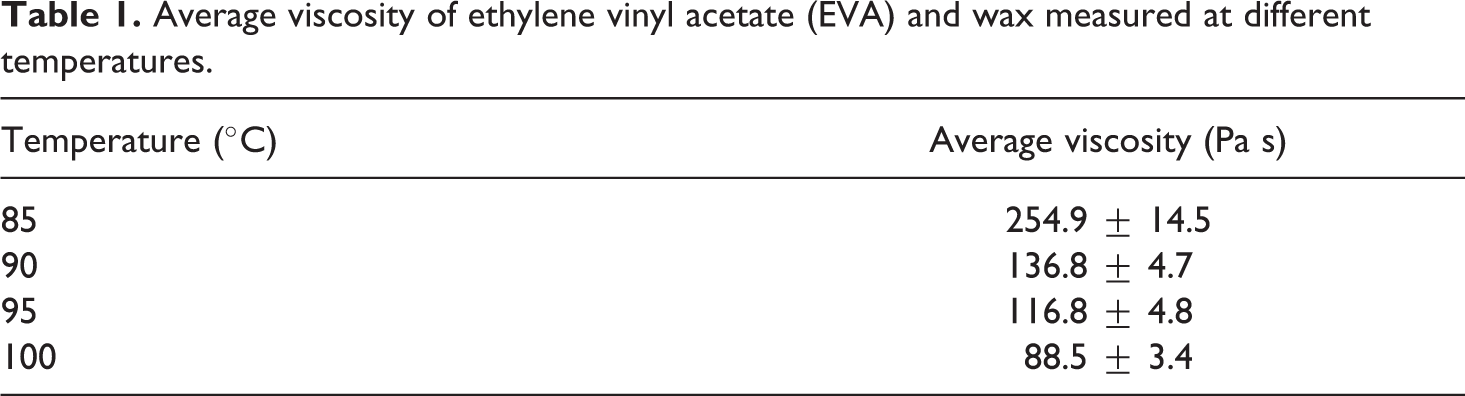
The results of rheological measurements, reported in Figure 5, show the evolution of viscosity as a function of shear rate for the matrix at four different temperatures. At each temperature, the matrix shows a weak shear thinning behaviour, which can be reasonably approximated by a Newtonian behaviour, with the characteristic values of viscosities reported in Table 1. As expected, the viscosity decreases with increasing temperature. The Newtonian behaviour of the matrix is necessary for obtaining a proper definition of the fabric permeability, independent from the rheological properties of the matrix. In facts, for non-Newtonian flows, it has been shown that it is not possible to define a permeability according to Darcy equation. 16 On the other hand, the viscosity of the matrix is much higher than those previously used with similar approaches, 25 being in the range of the viscosities commonly used in thermoplastic matrix composites.

Viscosity versus shear rate at four different temperatures.
Average viscosity of ethylene vinyl acetate (EVA) and wax measured at different temperatures.
The measured pressure as a function of matrix average velocity through the flax fabric is reported in Figure 6. The slope of the curves decreases with increasing temperature, as a consequence of the decrease in the matrix viscosity. On the other hand, according to Darcy law, the plot should yield a linear behaviour in the whole range of pressures. As it can be observed in Figure 6, the plot at each temperature is characterized by two distinct linear behaviour zones. The low-pressure zone is characterized by a higher slope, whereas the zone at high pressures is characterized by a lower slope. According to Eq. (3), this indicates an increase in the permeability.
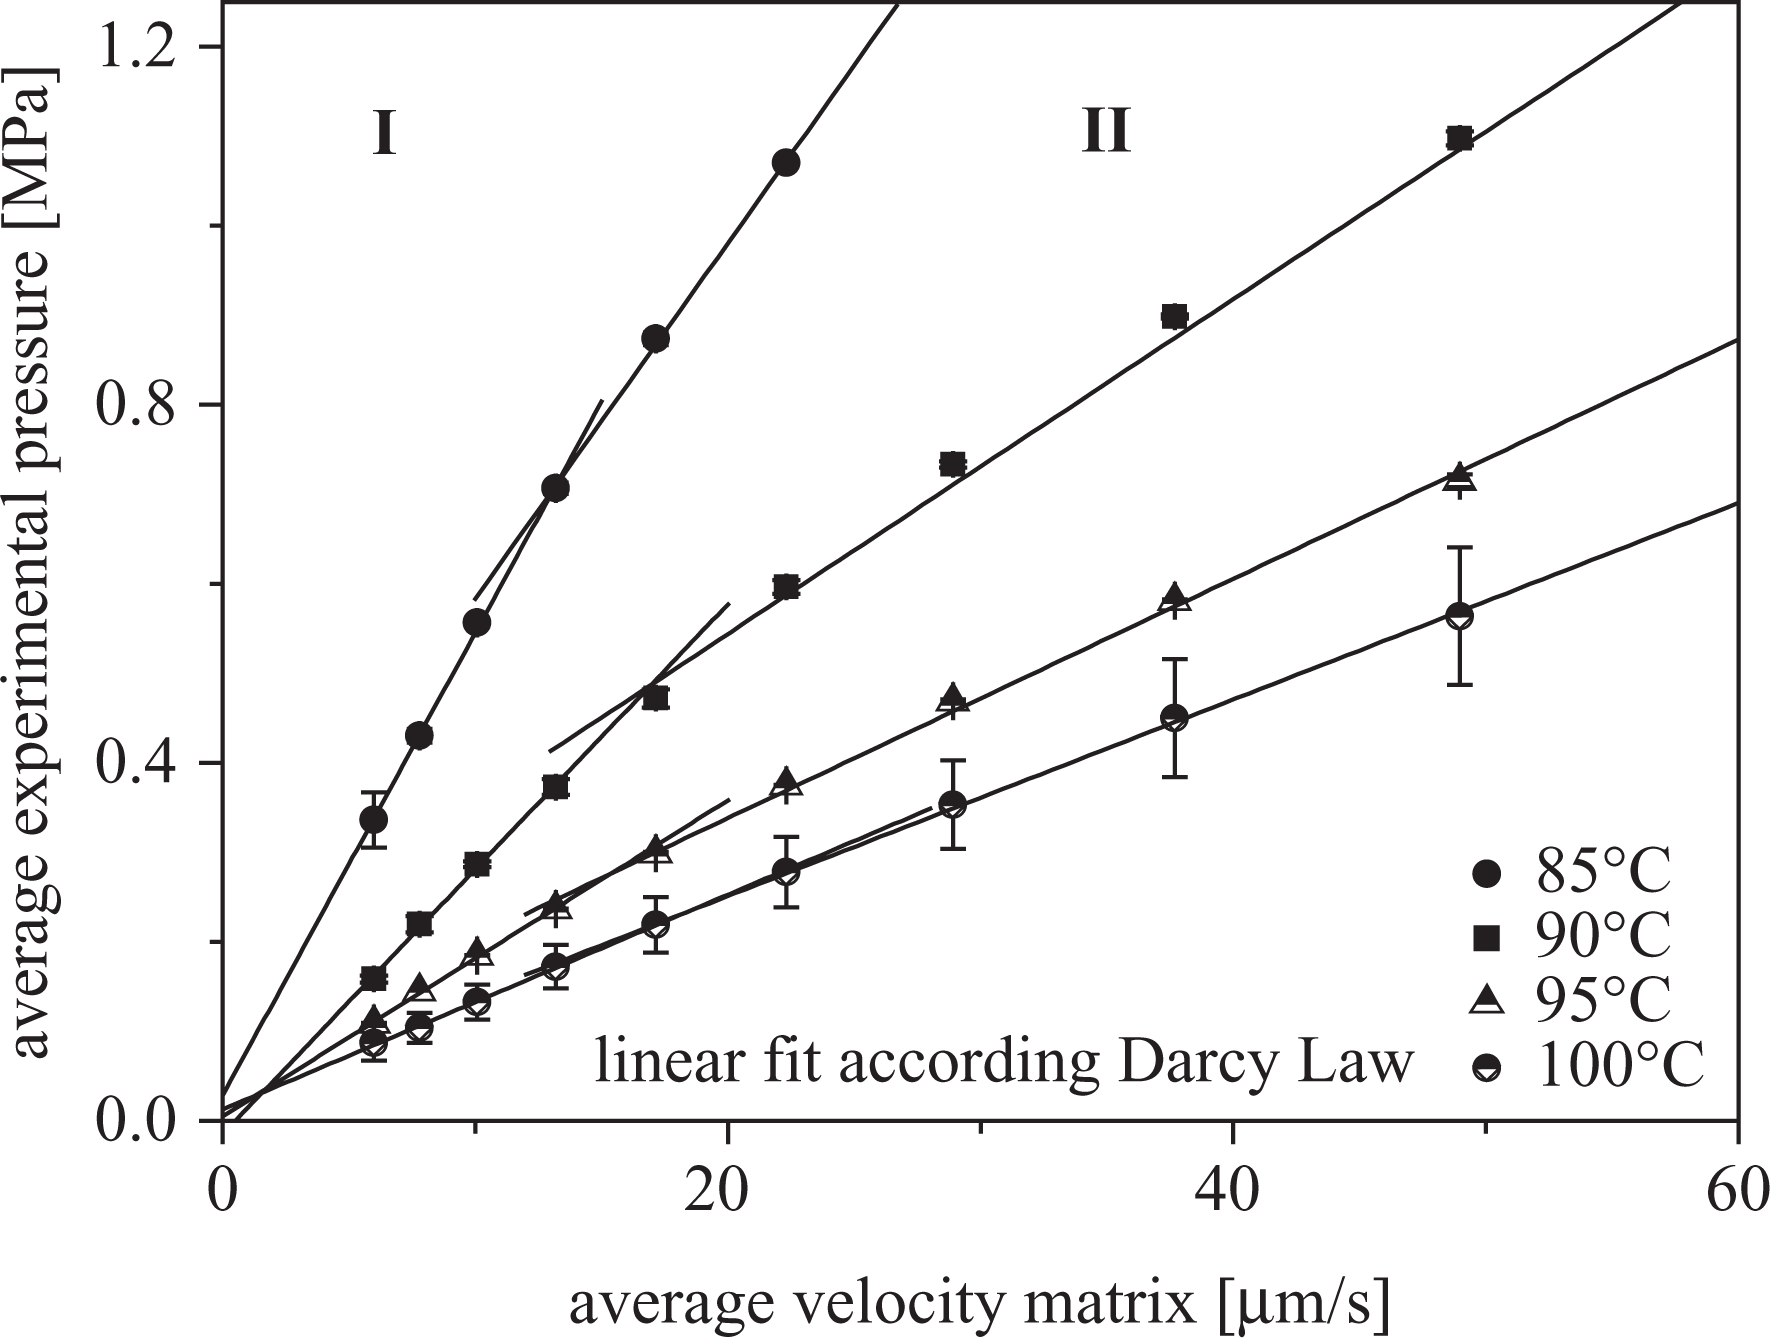
Measured pressure as a function of the average matrix velocity at four different temperatures.
Three different explanations can be proposed:
The behaviour of the matrix is not completely Newtonian. Therefore, an increase in the average velocity yields an increase in the shear rate during impregnation and a decrease in the matrix viscosity. A decrease in the matrix viscosity, for a fixed value of permeability, yields a decrease in the slope of the pressure–velocity plot. 12 In this case, the pressure rise during impregnation should be related to the velocity by Eq. (5) 17 ,33 :

where n is the viscosity index of the matrix. The nonlinear curve fitting according to Eq. (5) of the data at 90°C is reported in Figure 7, and obtained with a coefficient n = 0.64, which is significantly different from the value obtained by fitting of viscosity data according to the power law model, which was evaluated to be close to 1 (n = 0.98).
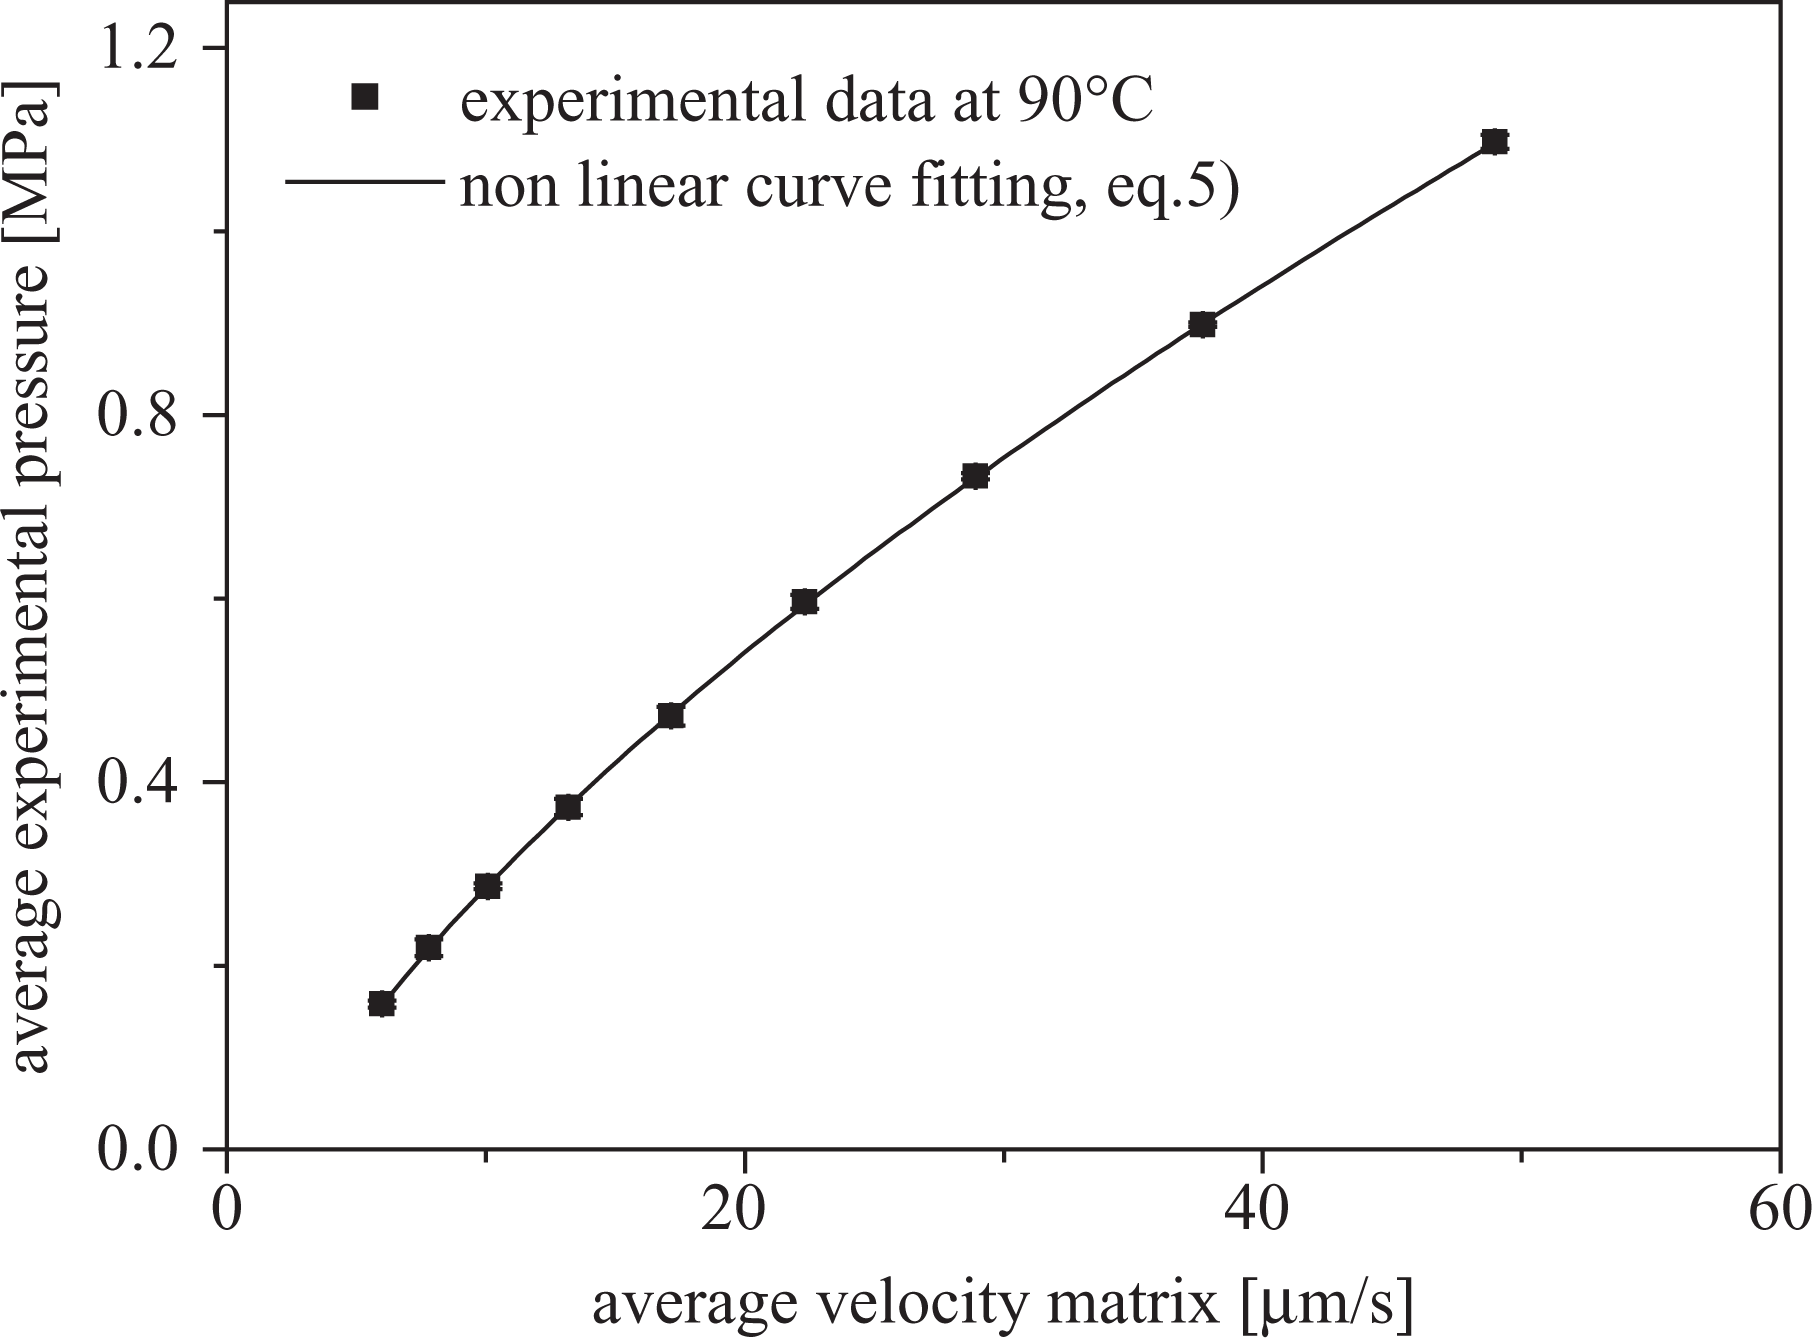
Nonlinear curve fitting of the pressure–velocity data at 90°C according to Eq. (5).
Being the fluid non-wetting, capillary pressure of the fibre bundles need to be overcome to fully wet them. The relevancy of capillary flow compared to viscous flow can be estimated by calculating the capillary number. 34 –36

Where η is the viscosity of the matrix, v is the characteristic velocity and γ is the surface or interfacial tension between fibre and matrix, using a value of η = 100 Pa s (from Figure 5), a velocity of 10 μm/s (Figure 4) and γ = 0.02 N m, a value of Ca = 0.05 was obtained. This value is about 2–3 orders of magnitude higher than the value of Ca = 10−4, which according to the work reported by Ermanni and coworkers, 35 can be considered a threshold value below which the capillary flux becomes relevant. As a further demonstration of the hypothesis that the main contribution to the matrix flow is given by externally applied pressure, the capillary pressure was calculated as 35 :

Where r is the capillary radius, which can be approximated as half of the distance between the fibres. Using a value of r = 2 μm, calculated from a statistical analysis of optical micrographs and taking cos θ = 1, a value of P CAP = 0.02 MPa was calculated. This value is at least one order of magnitude lower than the lower pressure measured during the experiments, which confirms that capillary pressure is negligible compared to the externally applied pressure.
The impregnation of the fabric is actually governed by two different mechanisms, the first one occurring at lower pressures only involves impregnation among bundles, and the second one occurring only at the higher pressures is associated with the impregnation inside bundles. Each of the two mechanisms is characterized by a permeability values.
In order to prove hypothesis (b), a test was performed in the capillary rheometer at 90°C and limiting the pressure drop below 0.47 MPa, which is a value below the slope variation observed in Figure 6. A SEM image of the fabric after impregnation at low pressures is reported in Figure 8a and b. It is evident that the matrix has flown around bundles, a ‘macro-impregnation’ process, while there is no evidence of flow of the matrix inside bundles. A SEM image of the fully impregnated fabric up to 1 MPa pressure is reported in Figure 8c and d, showing that impregnation occurred inside the bundles, a ‘micro-impregnation’ process.
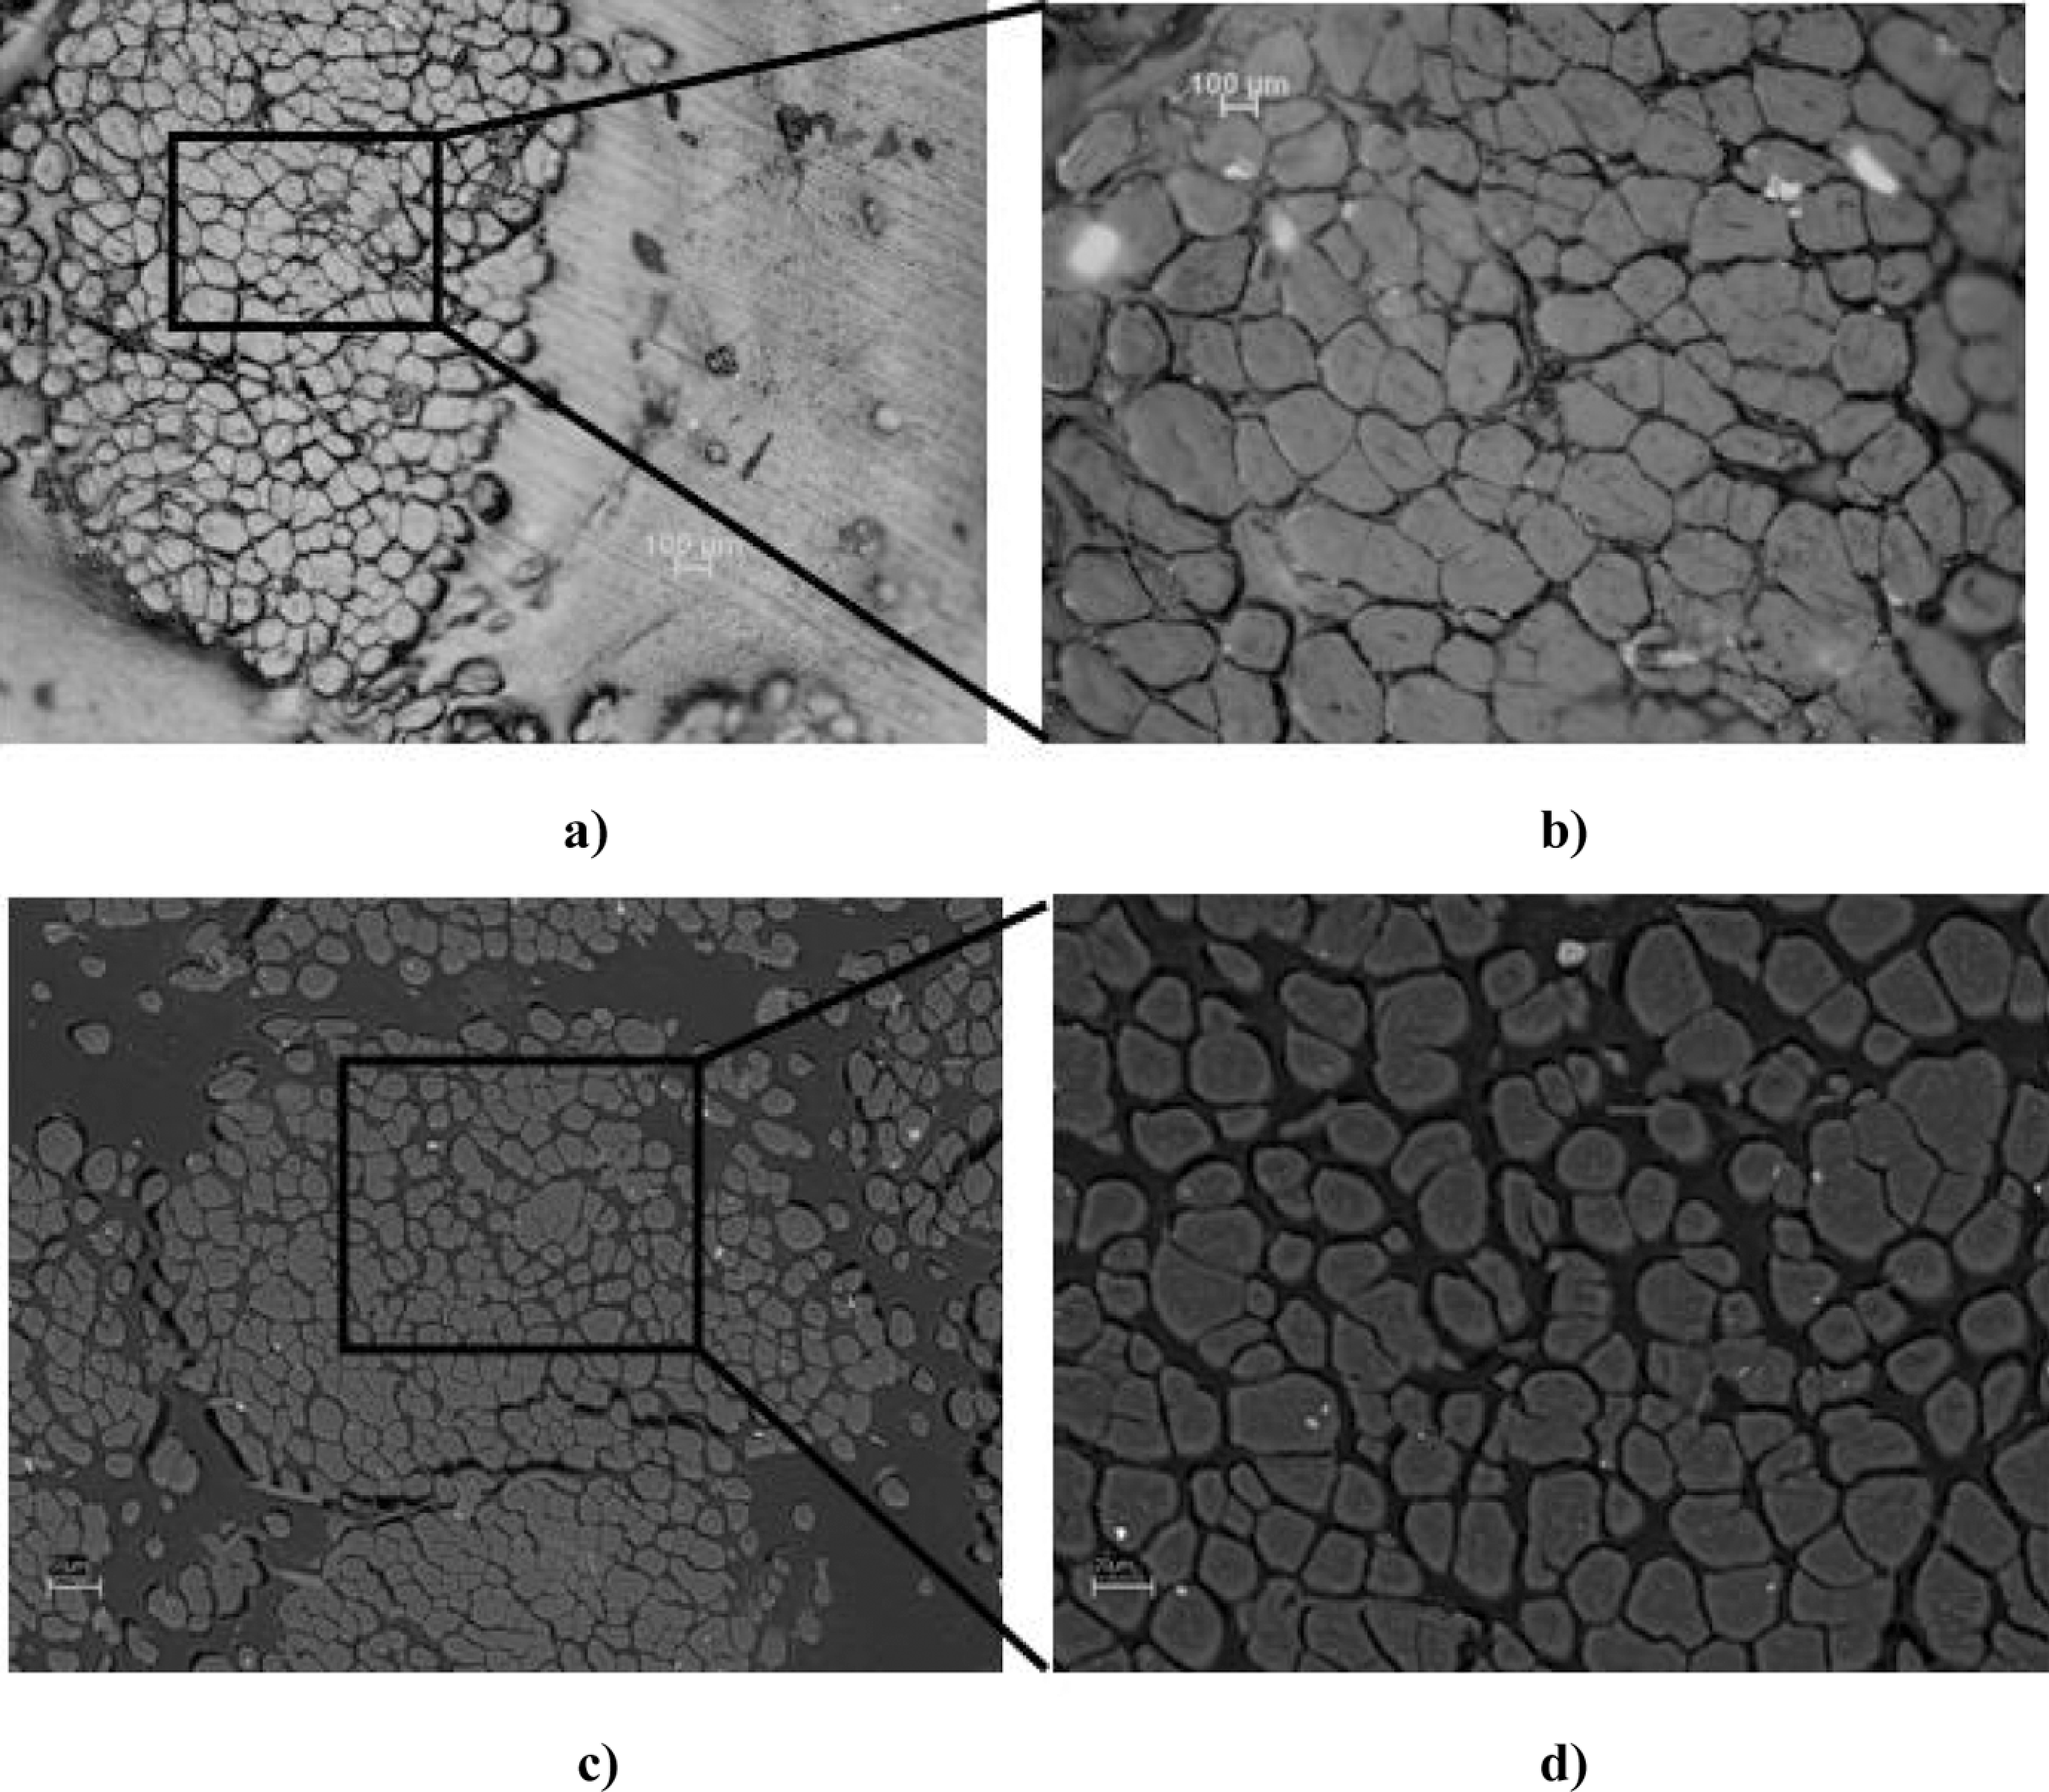
(a and b) Scanning electron microscope (SEM) micrographs of polished cross section of the fabric after impregnation at 90°C and below 0.47 MPa of pressure. (c and d) SEM micrographs of polished cross section of the unidirectional composite ethylene vinyl acetate (EVA)/flax, after impregnation up to 1 MPa pressure.
According to the results shown in Figures 6 through 8c, d, macro-impregnation takes place at the lower pressures, whereas only a threshold value of pressure is achieved, both the macro- and micro-impregnation processes become active. Therefore, the low-pressure slope observed in Figure 6 can be associated with permeability at macro-scale or macro-impregnation permeability, whereas the high-pressure slope reflects the global permeability, which takes into account the two mechanisms of impregnation.
In order to further support this micro/macro-scale impregnation process, EDS analysis was performed on the sample of the fabric impregnated at low pressure. The microanalysis revealed that the carbon amount on the fibre was about 68%, whereas the carbon amount on the matrix was 95%. The carbon amount in the intra-bundle voids shown in Figure 8d is the same, 68%, either on the flax fibre or the intra-bundle porosity, indicating that the EDS microprobe cannot detect any matrix among the fibres.
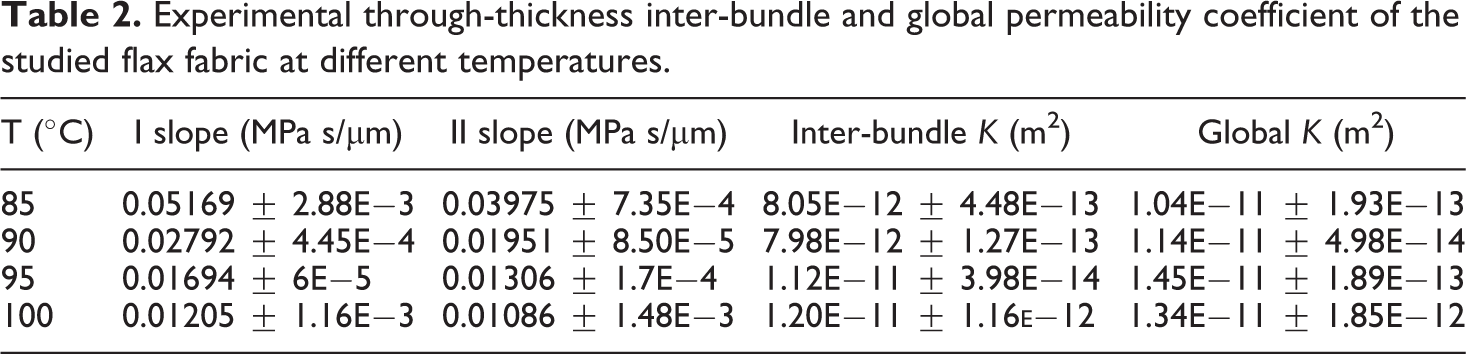
The values of inter-bundle permeability and global permeability determined from the data shown in Figure 6 according to Eq. (3), using the viscosity values of Table 1 and a thickness of fabric equal to 1.63E−3[m] which are reported in Table 2.
Experimental through-thickness inter-bundle and global permeability coefficient of the studied flax fabric at different temperatures.
Transversal permeability as a function of temperature in the low velocity and high velocity ranges was reported in Figure 9.
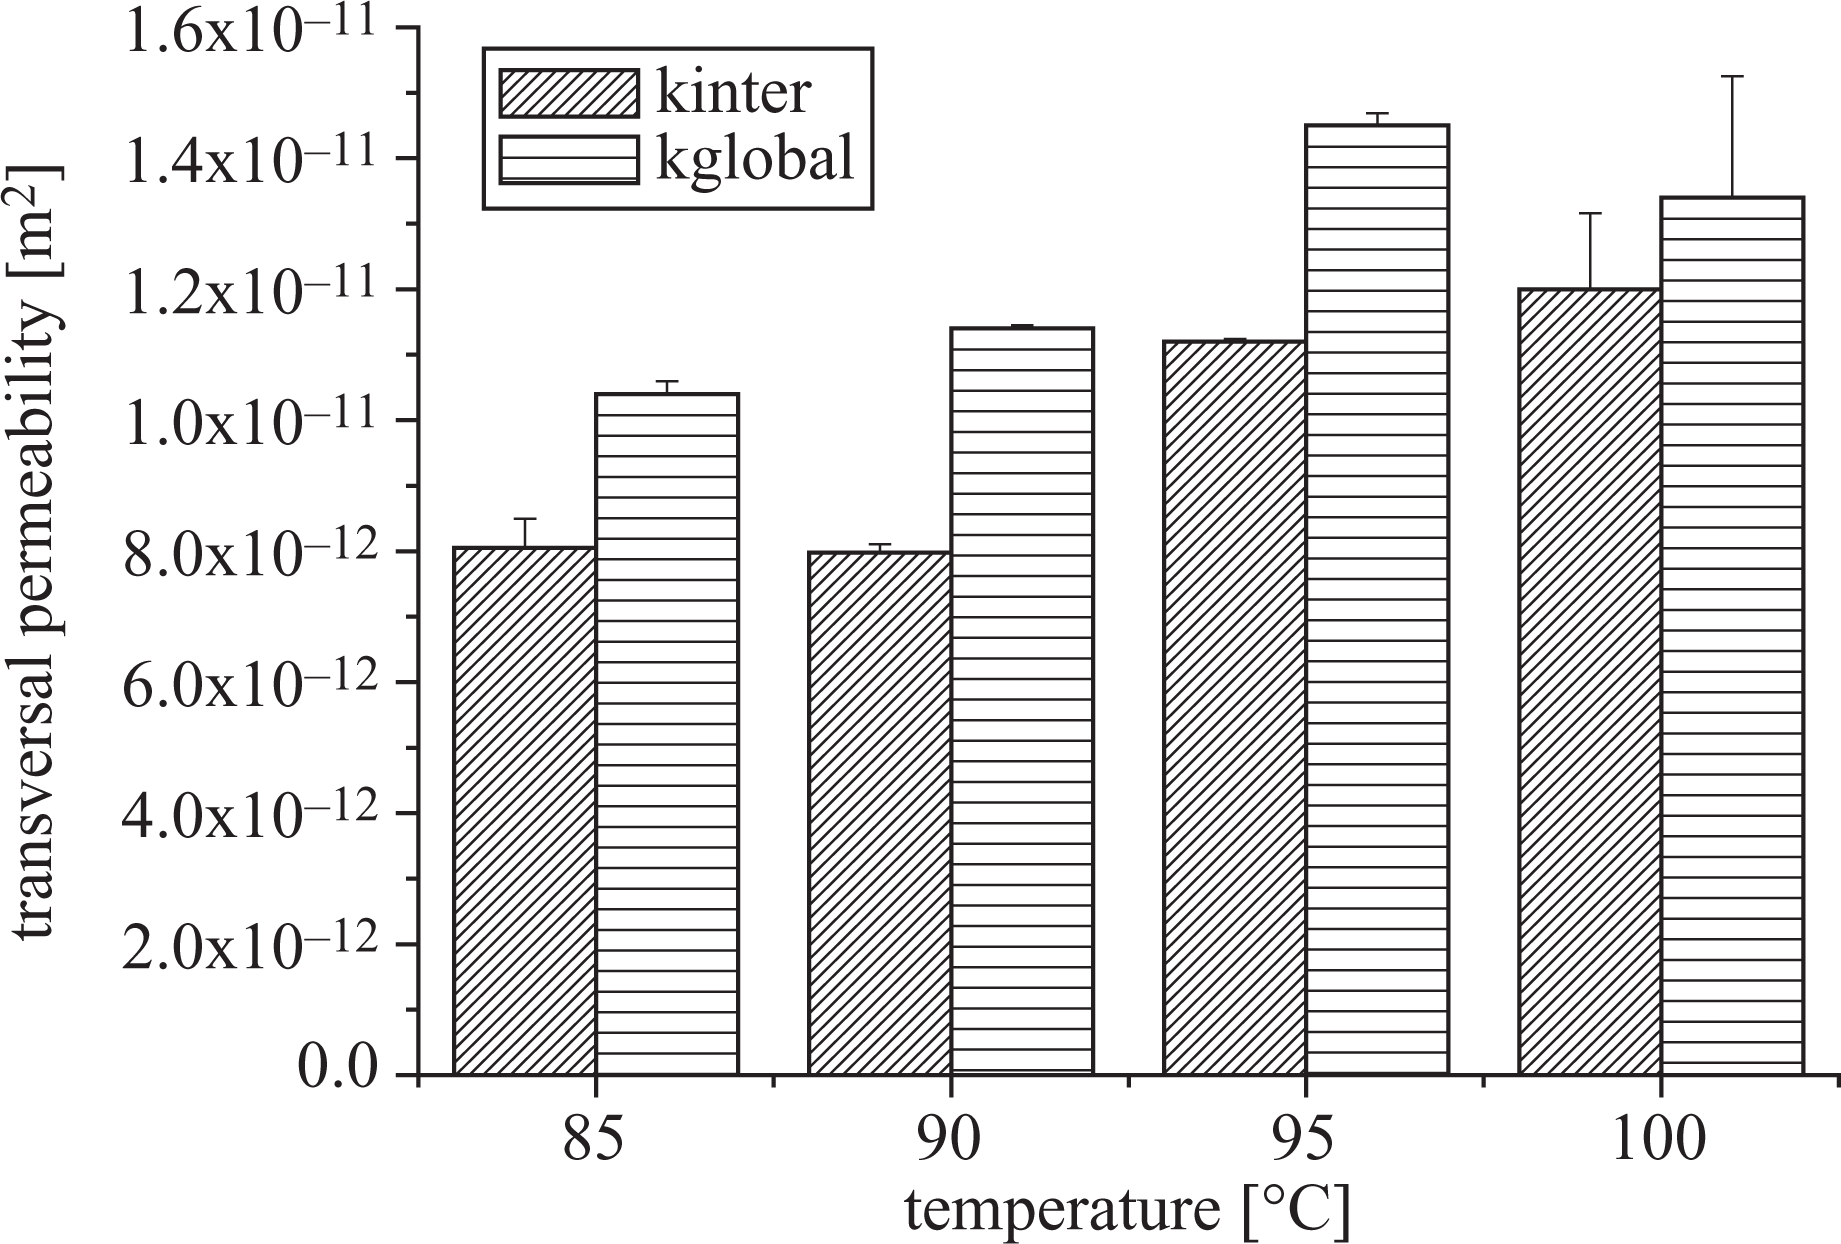
Permeability as a function of temperature in the low velocity and high velocity ranges.
As expected, both the inter-bundle and global permeabilities are not dependent on the test temperature, permeability being a characteristic property of the fabric, independent on the rheological properties of the matrix.
The global K changes are reasonable, considering for instance that Lundstrom et al. 37 presented 15% repeatability. The authors state that this limited repeatability is attributable to the fabric handling. The average experimental global permeability (Table 2) is equal to 1.24E−11 ± 1.86E−12 (m2). As a conclusion, the experimental global permeability of flax woven fabric 300 HS 45 result is the order of 10−11 (m2) (Table 2).
At each temperature, the permeability obtained in the first zone, associated with the inter-bundle impregnation, is lower than that obtained in the second zone, attributed to the sum of inter- and intra-bundle impregnation processes. Papathanasiou 38 numerically solved the Stokes equation in two dimensions using the boundary element method in square arrays of permeable multifilament yarns, where each yarn was composed of circles representing the cross sections of the constituent filaments. The effective permeability of the medium was reported as a function of the weave and yarn porosities. Similar studies were conducted for square and hexagonal arrangement of filaments in yarns, where the yarns had circular cross-section, 39 and for yarns with elliptical cross-section. 40 Papathanasiou 41 reported a correlation for the effective permeability of two-dimensional hexagonal arrangements of filament bundles as a function of the weave and yarn permeabilities, as follows:

where K global is the effective permeability of fabric, K inter is the inter-bundle permeability, K intra is the intra-bundle permeability and α and n are constants related to the geometric structure of the fabric.
The relationship is constructed based on dimensional arguments and from consideration of the behaviour at high and low K inter/K intra ratio asymptotes. Fitting the numerical simulation data, Papathanasiou 41 determined that α = 2.3 and n = 0.59 when filaments are arranged in a squared array and α = 2.67 and n = 0.89 when filaments are arranged in a hexagonal array.
In order to use Eq. (8), the experimental values of K inter reported in Table 2 can be used. The value of K intra can be predicted by the Carman–Kozeny equation, 42 which correlates the intra-bundle permeability to the fibre bundle volume fraction (V fINTRA), the characteristic fibre diameter (d) and a lumped parameter called the Kozeny constant (C):

In order to obtain a correlation between experimental permeability data and model prediction, the intra-bundle volume fraction was defined as reported in Eq. (10):

Where A fibres is the actual area occupied by the fibres and a and b are the average length of the two semi-axes of the bundle. In order to evaluate the intra-bundle volume fraction, the total area occupied by the fibres was calculated measuring the weight (M) of a known length (L) in a bundle:

where ρ is the material density. From optical microscopy and knowledge of the A TOT, the intra-bundle volume fraction was calculated according to Eq. (10). The values of the geometric parameters calculated for the four tests and the intra-bundle volume fraction are reported in Table 3.
Values of the geometric parameters calculated for the four tests and the intra-bundle volume fraction.
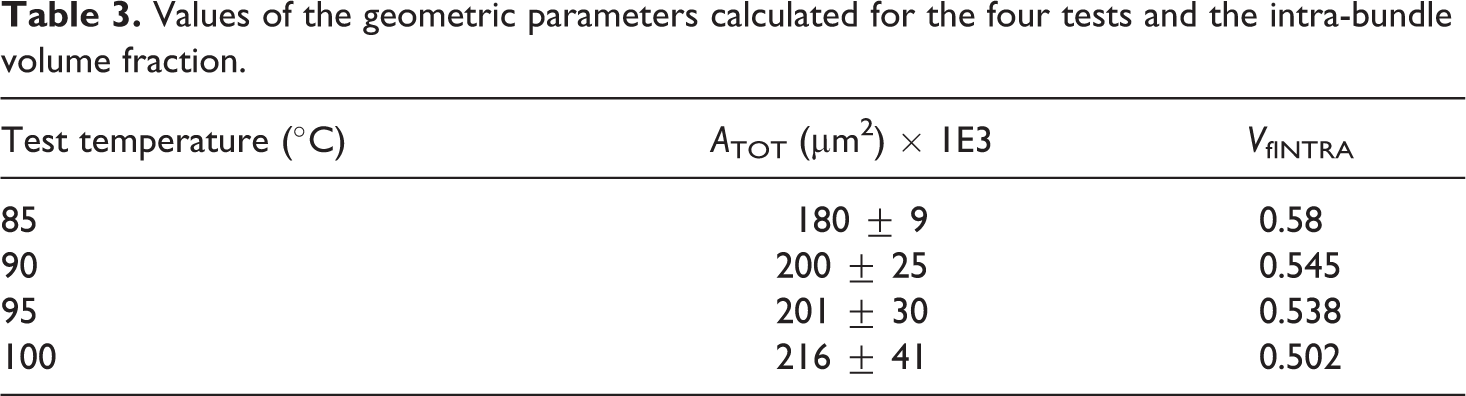
As expected, the intra-bundle volume fraction decreases with increase in test temperature, due to the fact that decreasing the viscosity of the matrix involves an higher intra-bundle permeation, which results in an increase in the size of impregnated bundle (A TOT).
Table 4 shows the values of intra-bundle permeability calculated according to Carman–Kozeny model, using a value of constant C = 50 43 and the parameters reported in Table 3. Substituting the values of experimental inter-bundle permeability (Table 2) and predicted intra-bundle permeability (Table 4) into Papathanasiou model, a global permeability was obtained. The values of global permeability predicted by Papathanasiou model for an hexagonal array are also reported in Table 4. The application of Eq. (8) to the permeability obtained in our study leads to α = 3.2 and n = 0.93 close to the values reported in previous work. 44
Model predictions for intra-bundle and global transversal permeability.
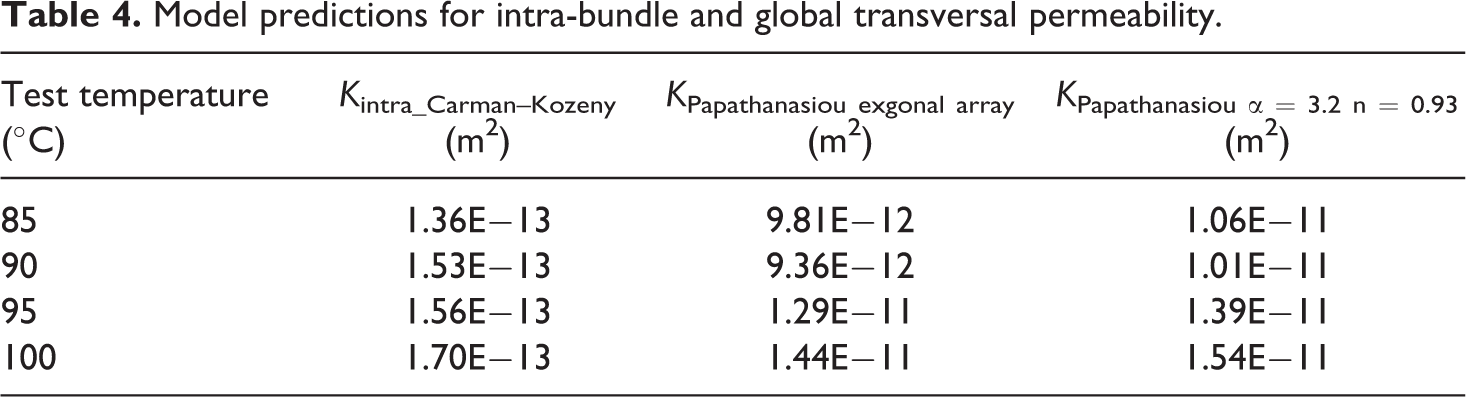
As expected Carman–Kozeny model prediction for intra-bundle permeability is much lower than inter-bundle experimental permeability reported in Table 2. The values of global permeability predicted by Papathanasiou are of the same order of magnitude of those reported in Table 2.
Conclusions
In this work, a new methodology for the measurement of fibrous reinforcement transversal permeability has been described. The presented setup makes use of a properly modified capillary rheometer, and allows the determination of the reinforcement permeability by a direct approach, which does not require any hypothesis but allows for the measurement of the physical parameters appearing in the Darcy equation. The results obtained in this work, derived for a Newtonian matrix, show that the pressure–velocity curves are characterized by different regimes. Initially, a higher slope of the pressure versus velocity curve is indicative of a lower permeability of the reinforcement. Reinforcement samples impregnated in the low-pressure zone showed the presence of polymeric fluid in the spaces between the bundles, but there was no flow of the matrix inside each bundle. This phenomenon, which is referred to as ‘macro-impregnation’ is characterized by a relatively high value of permeability that allows for impregnation even at low values of the applied pressure.
On the other hand, at higher pressures, the slope of the pressure versus velocity curve decreases, which indicates an increase in the overall permeability of the reinforcement. In fact, when impregnated in the high-pressure zone, the reinforcement shows significant flow of the matrix inside each bundle. This phenomenon, which is referred to as micro-impregnation, is characterized by a lower value of permeability, requiring higher pressures. The overall permeability, in the high-pressure zone, is given by a proper combination of macro- and micro-scale permeabilities.
In facts, the slope in the low-pressure zone was used for evaluating the macro-scale permeability. As expected, this property is independent of the test temperature, being dependent only on the reinforcement architecture.
The micro-scale permeability was evaluated by means of the Carmen-Kozeny equation, using the geometric properties of the reinforcement, measured by SEM and optical microscopy.
The experimental macro-scale and predicted micro-scale permeabilities were combined by following the approach proposed by Papathanasiou, and the global permeability was therefore calculated. The estimated value of the global permeability is in very good agreement with the experimental value determined in the high-pressure zone.
Such results indicate the sensitivity of the developed measurement techniques. Future works will be directed towards flow analysis of non-Newtonian matrices in dry reinforcements.
Footnotes
Funding
This research received no specific grant from any funding agency in the public, commercial, or not-for-profit sectors.