
Abstract
Criticisms against tax incentives typically come from either the regional inequality perspective that compares a locality with others in terms of the amount of revenues foregone or the opportunity cost perspective that compares a locality with itself in an alternate reality where it foregoes less or none. How foregone/hypothetical revenues affect collected/actual revenues and related fiscal outcomes is less understood. This article examines the association between the amount of abated taxes and school district revenues and expenditures in 2019 for the nine U.S. states that have sufficient tax abatement data for such analyses. Findings show that districts experiencing greater incentive cost burden have fewer overall revenues per pupil, depend more on local sources besides property tax, spend less on teaching salaries, and are more likely to be underfunded. Some of these effects vary by district wealth, suggesting the need to fine-tune the incentive award levels according to local conditions.
In 2018, teachers and other school employees of the East Baton Rouge Parish School District in Louisiana voted 445 to 6 in support of a 1-day walkout to protest against a $6 million property tax exemption awarded to ExxonMobil as “incentive” for a project that had already been completed. Within hours of the vote, the bid was withdrawn. 1 Two years later and 760 miles northward, the superintendent of the Kansas City Public Schools in Missouri called attention to the city's inequitable incentive practices with a detailed analysis of tax abatement vis-à-vis demographics presented on a page dedicated to this very issue on the district's official website. 2
These incidents highlight the growing contention between economic development coalitions and education equity coalitions over subsidized development as well as heightened public awareness of the damage inflicted by wasteful subsidies—“wasteful” meaning amounts greater than needed to induce development activity (cost-inefficient) and/or awards that do not generate sufficient benefits in a reasonable timeframe to warrant their costs to the public (cost-ineffective). The disagreement is on both the scope of incentives and distribution of its net impacts. Supporters argue that the benefits outweigh the costs, and that everyone stands to be better off from the new investment and job growth induced by incentives. Opponents argue that the costs outweigh the benefits and that incentives drain public resources disproportionately from disadvantaged communities. Tax incentives result in less revenues available for funding public services like education, at least in the short term. Unless there are mechanisms to hold school budgets harmless (in which case public resources would need to be redirected from elsewhere, like other public services and social programs), school districts would have to forego revenues to tax abatements, which for many compounds the persistent problem of chronic underinvestment (Alliance to Reclaim Our Schools, 2018). At the crux of the tension is power and information asymmetry: school boards and allied community groups are often excluded from the incentive award process driven by “growth machines” (i.e., people who profit from growth) and rendered virtually powerless by state policy to shape the decisions therein that could profoundly affect them and those whose interests they represent.
The quest for more K-12 revenue led concerned parties to the trail of foregone taxes. As a report by the National Education Association (2003) asserted, “An equitable and adequate funding system for public education can hardly flourish…when revenues earmarked for modernizing school buildings are instead diverted to corporate property tax abatements and other subsidies” (p. vii). While this narrative was taking hold on the political left, scrutiny was growing on the political right. It turned out to be business leaders who set off the sequence of events that led to the bilateral ceasefire in the incentive war between Kansas and Missouri. 3 And now, libertarian thinktanks are forging ahead to create an interstate compact that would stop the race to the bottom. Rays of light illuminating the issue have converged from different origins on the political spectrum to the focal point that is transparency and accountability because the inefficient and ineffective use of resources is to the detriment of the society as a whole—corporations included.
Within the state, both entrepreneurial and redistributive agencies should have a stake in securing adequate investment in public education since it both equalizes opportunity and sustains growth. When it comes to education, funding is the fundamental problem that underlies many others, such as stagnant wages, outdated facilities, and limited program offerings or support services. Underprovision of this merit good can have enormous indirect and intangible negative consequences. While the share of state sources in K-12 funding has increased over the past decades, local property tax remains the largest single source of revenue for schools in most states. The relationship between tax abatements and school finances is complicated due to the multitudinous factors in the calculus, but if tax abatements do in fact contribute to underfunding in public schools, then they are also not conducive to long-term economic development.
This article tests the null hypothesis that no such relationship exists—that there is no correlation between the size of tax incentive awards and school district fiscal conditions. Previous research has been constrained by a lack of tax abatement data at the jurisdiction level. It was not until late 2015 when a new standard known as Statement No. 77 was added to the list of Generally Accepted Accounting Principles (GAAP) by the Governmental Accounting Standards Board (GASB) 4 that an accounting mechanism for local tax expenditures was instituted for the first time. Starting in fiscal year 2017, some of the local governments that follow GAAP began reporting a dollar figure representing just their own share of the taxes abated but for all agreements to which they are subjected. The data generated so far from school districts are particularly salient as they mostly lose revenue (and often the most of all affected entities) to agreements entered by other governments.
The GASB, however, only sets the standards; it is up to the accounting firms and state auditors to ensure compliance. Inquiries made to some of these people revealed such a wide range of practices for tax abatement reporting that it is no wonder Statement No. 77 data are geographically fragmented and uneven. Even for states that have rigorous oversight over local tax abatement reporting, collecting these data for research is time-consuming due to the lack of structure in the disclosure notes. Making the most of what is available, I opt for a cross-sectional analysis using the 2019 data from nine states. The obvious choice for the main explanatory variable might be per-pupil tax abatements, but places with more taxes also have more revenue to abate. Instead, I use the ratio of abated taxes to revenues collected as a proxy for cost burden, thereby removing magnitudes altogether. Results from linear regression models show that tax abatements are negatively associated with school finances.
Further analyses of policies and program audits, as well as interviews with experts and stakeholders, corroborate and enrich these quantitative findings. This qualitative component showed the overall negative impact of tax abatements on public schools, the inequitable distribution of net benefits, and the relative powerlessness of school boards in the award process. Because state funding cushions and absorbs some of the damage, the exact fiscal impact may be difficult to pin down or masked in the short run. Nevertheless, the findings suggest an immediate need for more stringent regulation in abating property taxes for economic development—be it applied to the magnitude, duration, scope, eligibility, expectation, evaluation protocols, or provisions for recapturing tax benefits in cases of underperformance and violation of agreement terms.
Literature Review
While there exists a cornucopia of research on tax incentives, only a handful of studies deal specifically with their fiscal impact on schools. Data availability and access are likely the main constraints. Another challenge apparently lies in isolating the effect of tax abatements from other factors. This section will first address the data aspect and then review the findings of the few studies there are to date.
Measurement and Data for Solving “Wicked” Problems
Debates on the optimal use of tax abatements exemplify what is known as a “wicked” problem in economic development because at stake is a complicated, multifaceted issue rooted in an apparent fundamental conflict of interests. Both sides of the debate invoke opportunity costs and counterfactuals to back up their respective stances, but there are no easy answers to questions of cost such as, “What is the least amount of incentive necessary to induce a particular development?” or “Would the incentive payments from governments to companies be better spent on something else?” Both the decisions to award incentives and the procedures to evaluate them can be highly political. For the elected official, investing in business attraction produces, if any, immediate and visible benefits and defers the costs, whereas investing in social services produces fewer tangible results and takes longer than an office term to pay off, if it ever does. In the absence of coordination, governments get caught up in competitions that result in suboptimal outcomes (Thomas, 2011). When considering deals and offers, the agencies in charge of the negotiations often operate in the dark about the willingness to pay and willingness to accept on the part of both the applicants and competing jurisdictions. The phrase “race to the bottom” captures well this unhelpful intergovernmental competition for financial capital when each wants to outbid the other, even though both might be better off if neither offered incentives (Zheng & Warner, 2010). To complicate matters, the costs and benefits of incentives are often distributed inequitably among overlapping jurisdictions. For instance, if a city relies mostly on income taxes and sales taxes for revenue, the governing body may be less cautious when abating property taxes (Wassmer, 2014). Municipal governments often grant the largest tax abatements, even though (or rather because) they are less dependent on property taxes and more able to shift to alternative revenue sources (Wen et al., 2020). Furthermore, with the privatization of economic development functions already commonplace and evidently on its way to being an all-encompassing practice, the contention is growing in frequency and intensity between stakeholders that stand to benefit from tax breaks and those that critically depend on taxes to operate.
Community development literature suggests that wicked problems such as this require multiparty collective efforts to avoid a sort of prisoner's dilemma scenario. Deliberations need to start early for setting a common agenda, and they need to continue so everyone has equal access to key information and stays on the same page. The first prerequisite for accountability (beyond willingness to communicate) is data transparency. Only with adequate common data can divergent stakeholders come up with a set of shared measurements, calculations, and benchmarks that is indispensable for collaborative governance (Kania & Kramer, 2013; Walzer et al., 2016; Wood, 2016).
Neither captured in revenue and expenditure statements nor subject to disclosure requirements (unless so specified in state statutes), local tax expenditures were a hidden cost prior to the existence of Statement No. 77 (Propheter, 2017). While all but four state governments (Missouri, North Dakota, Utah, and Virginia) issue tax expenditure reports on a regular basis, Montgomery County, Maryland, is the only local jurisdiction known to do so. If left to voluntary reporting, not only might jurisdictions hesitate to disclose tax abatements, but they also might have a hard time doing so even if willing, especially if they are not the ones administering the awards. As for outside researchers, even if it were possible to track down the amount of each award from the agencies involved, piece together the impact from fiscal studies and tax records, and then apportion that total to each affected locality by its share in the tax revenue, it would be a laborious process and virtually impossible on a large scale.
Statement No. 77 is revolutionary in the sense that it made the costs of tax incentives accessible (Billings, 2018). It is particularly significant for school districts, most of which forego revenues because of multiple incentive agreements entered into by municipalities, counties, their economic or industrial development agencies, corporations, authorities, and/or the state. Essentially, this accounting rule breaks down the cost of each tax abatement program by jurisdiction and reassembles the cost of multiple programs for each jurisdiction.
Despite the impressive progress toward greater transparency that Statement No. 77 signifies, limits and challenges abound. First, the high administrative costs for the state in overseeing local compliance, standardization, and quality resulted in large variations in the rigor and usefulness of the data among states, regions, districts, and even accounting firms (Fischer & Holmes, 2018; Wen & LeRoy, 2022). Second, not all reporting entities use GASB's accounting standards (e.g., Indiana and some parts of Kansas). Third, some school districts do not produce their own independent financial statements—their finances instead “blended” and “commingled” with those of their parent governments. Fourth, even though many districts that are “discretely presented” (i.e., not blended) component units produce their own financial statements, they may not always report their portion of the foregone taxes since the figure might be included in the parent government's disclosures (though there is all too frequently no way to know without explicit disclosures by the parent governments). Finally, the wording and formulation of the statement/rule itself creates confusion about the breadth and depth of disclosures. Uneven reporting notwithstanding, substantial figures have been revealed in a few states, like South Carolina, New York, and Texas, since the rule's widespread adoption in 2017.
The Impact of Tax Abatements on School Finances
Even with these new data, impact assessment is difficult because tax can cause so many things to change (tax rate, property value, revenue yield, payments in lieu of taxes, revenue distribution among localities, state aid, and fundraising, to name a few). Depending on the local conditions and policy responses, the same incentives can have vastly different effects. It is safe to say, however, that incentives are a consequential investment for many jurisdictions, especially if they last a long time, and research has shown that these investments tend not to be profitable (Lynch, 2004). Wassmer (1992) found that property tax abatements are costly for whichever jurisdiction that winds up paying for them. Kang et al. (2015) found that tax abatements contribute to property value growth, but that the fiscal benefits pale in comparison to the costs. Landers (2006) found that enterprise zones raise the property value within them, but that the more of them there are, the less revenue benefits each generates.
The cost of tax abatement also tends to burden resource-poor localities to a greater extent. Some studies have shown that distressed localities are more motivated to offer incentives due to the greater urgency for such a stimulus, despite the often already-dismal fiscal conditions (Felix & Hines, 2013; Reese & Sands, 2006). Pursuing these immediate fixes could result in a downward spiral into a trap of chronic deficit for the desperate local governments. When it comes to tax abatements, Reese (2006) demonstrated that past behaviors predict future behaviors, and that the inertia allows fiscal stress to accumulate and compound over time. When incentives do succeed in enlarging the local tax base, the rise in land values and housing prices may result in gentrification (Layser, 2019), which in turn exacerbates racial segregation (Wyly & Hammel, 2004) and, by extension, educational revenue disparity (Weathers & Sosina, 2019). Finally, tax abatements can introduce uncertainties into governmental and school budget planning that are particularly devastating for impoverished communities (Lavertu & St. Clair, 2018).
Depending on a school district's funding structure, tax abatements can put a strain on school budgets (Jensen & Malesky, 2018). Weber (2003) found that the use of tax increment financing (TIF) in Cook County, Illinois hampers revenue growth for school districts and increases their dependence on state aid. Using panel data, Kenyon et al. (2020) found that in Franklin County, Ohio, the increase in taxable value resulting from tax abatements in the county is matched by a decrease in the tax rate. Wendling (1981) found that Michigan's Public Act 198 exemptions hurt school districts that are just off the state aid formula. Nguyen-Hoang (2014) showed that the intensity of TIF abatements is associated with lower educational expenditures, and that this effect appears stronger for poorer districts.
These studies revealed some potentially concerning impacts incentives have on public schools as well as certain methodological challenges in analyzing them. Wendling (1981) cited two specific ones: (1) determining the percentage of firms that made decisions based on tax incentives, which was later estimated by Bartik (2018) to be between 2% and 25%, and by Jensen (2018) to be 20%, though only for Texas; and (2) measuring financial “impairment.” For instance, per-pupil spending by itself does not say anything about funding adequacy (Baker et al., 2022). In a parallel fashion, tax abatement figures are not only meaningless without reference points, but they are also entangled with district finances in nonlinear associative and causal relationships. All this analytical difficulty is further compounded by offsetting factors, like compensating payments/intergovernmental transfers and the timing of their disbursal or the extent to which school districts can and do raise tax levies.
What we know from existing literature is that only few states have laws to hold school districts harmless; others provide only partial offset, and promised compensations are not always delivered. 5 We know that tax caps are ubiquitous, and poorer communities are less likely to vote in favor of overriding them or other compensatory solutions that would increase their tax burden. We know that taxes are not a huge cost item for many businesses, and so it is unlikely that incentives would be the deciding factor in (re)location or expansion. We know that entrepreneurial regimes helmed by pro-growth coalitions prioritize business climate over public welfare even though the two are related. We know that, despite states stepping in to equalize K-12 funding, property tax still has a significant bearing on school spending (Hoxby, 1998). And finally, we know that state aid cannot be counted on in times of economic distress (Dye & Reschovsky, 2008).
This repository of knowledge justifies the hypothesis that tax abatements may undermine school finances. The next section elaborates on model specifications.
Data and Methods
This article takes a deductive approach to test the following hypotheses using linear regression models:
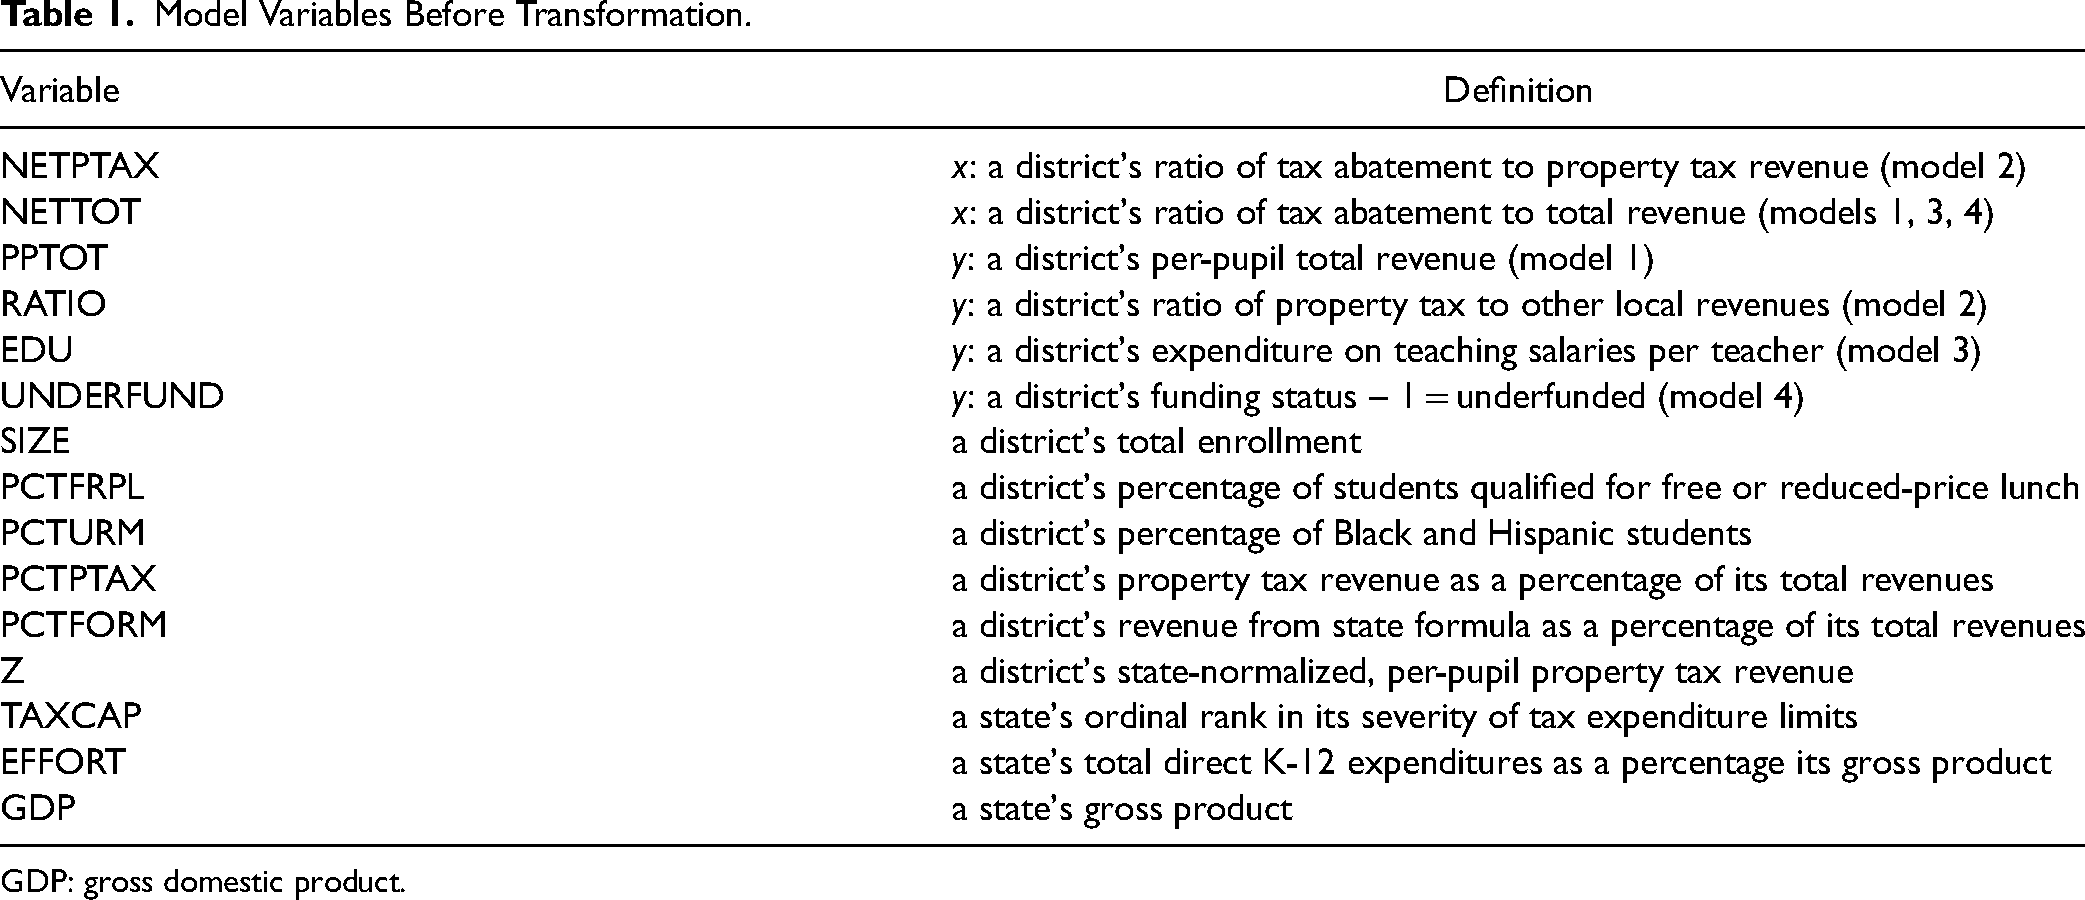
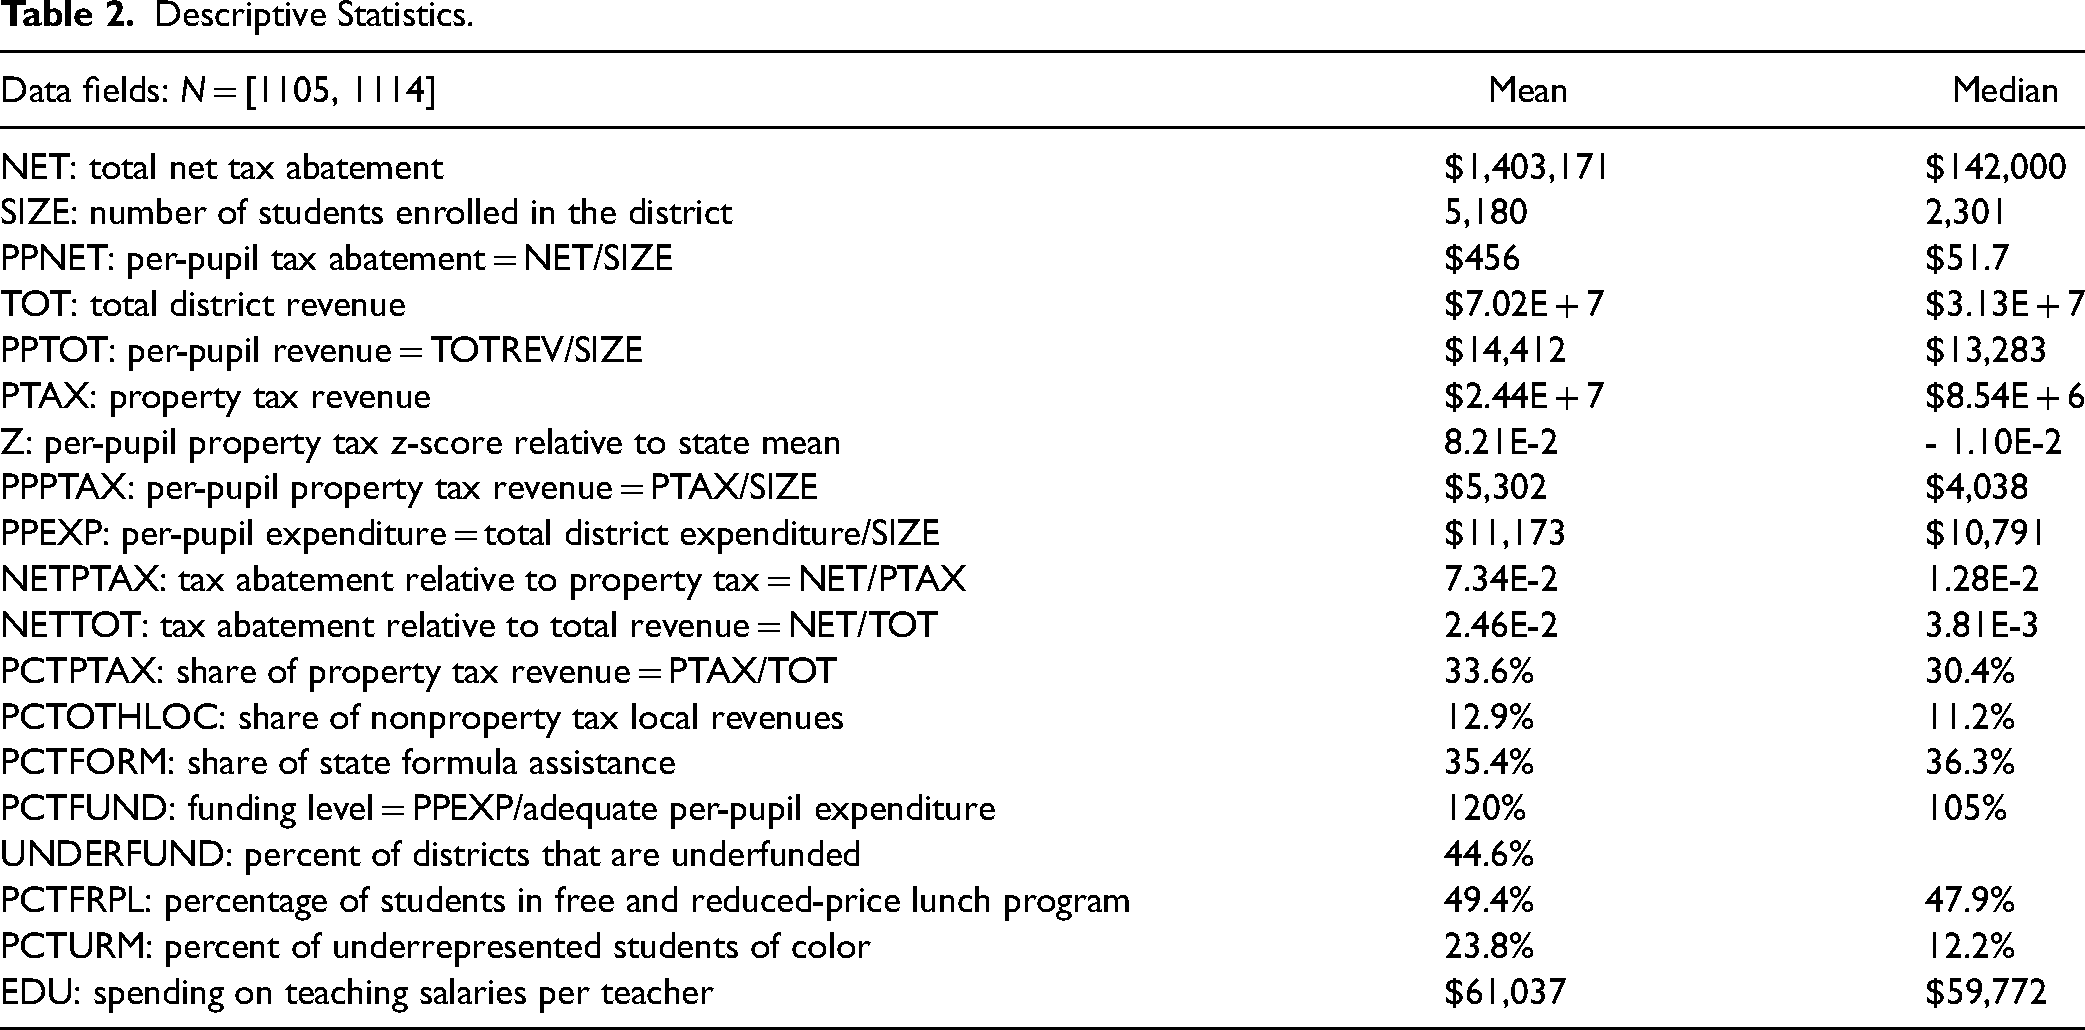
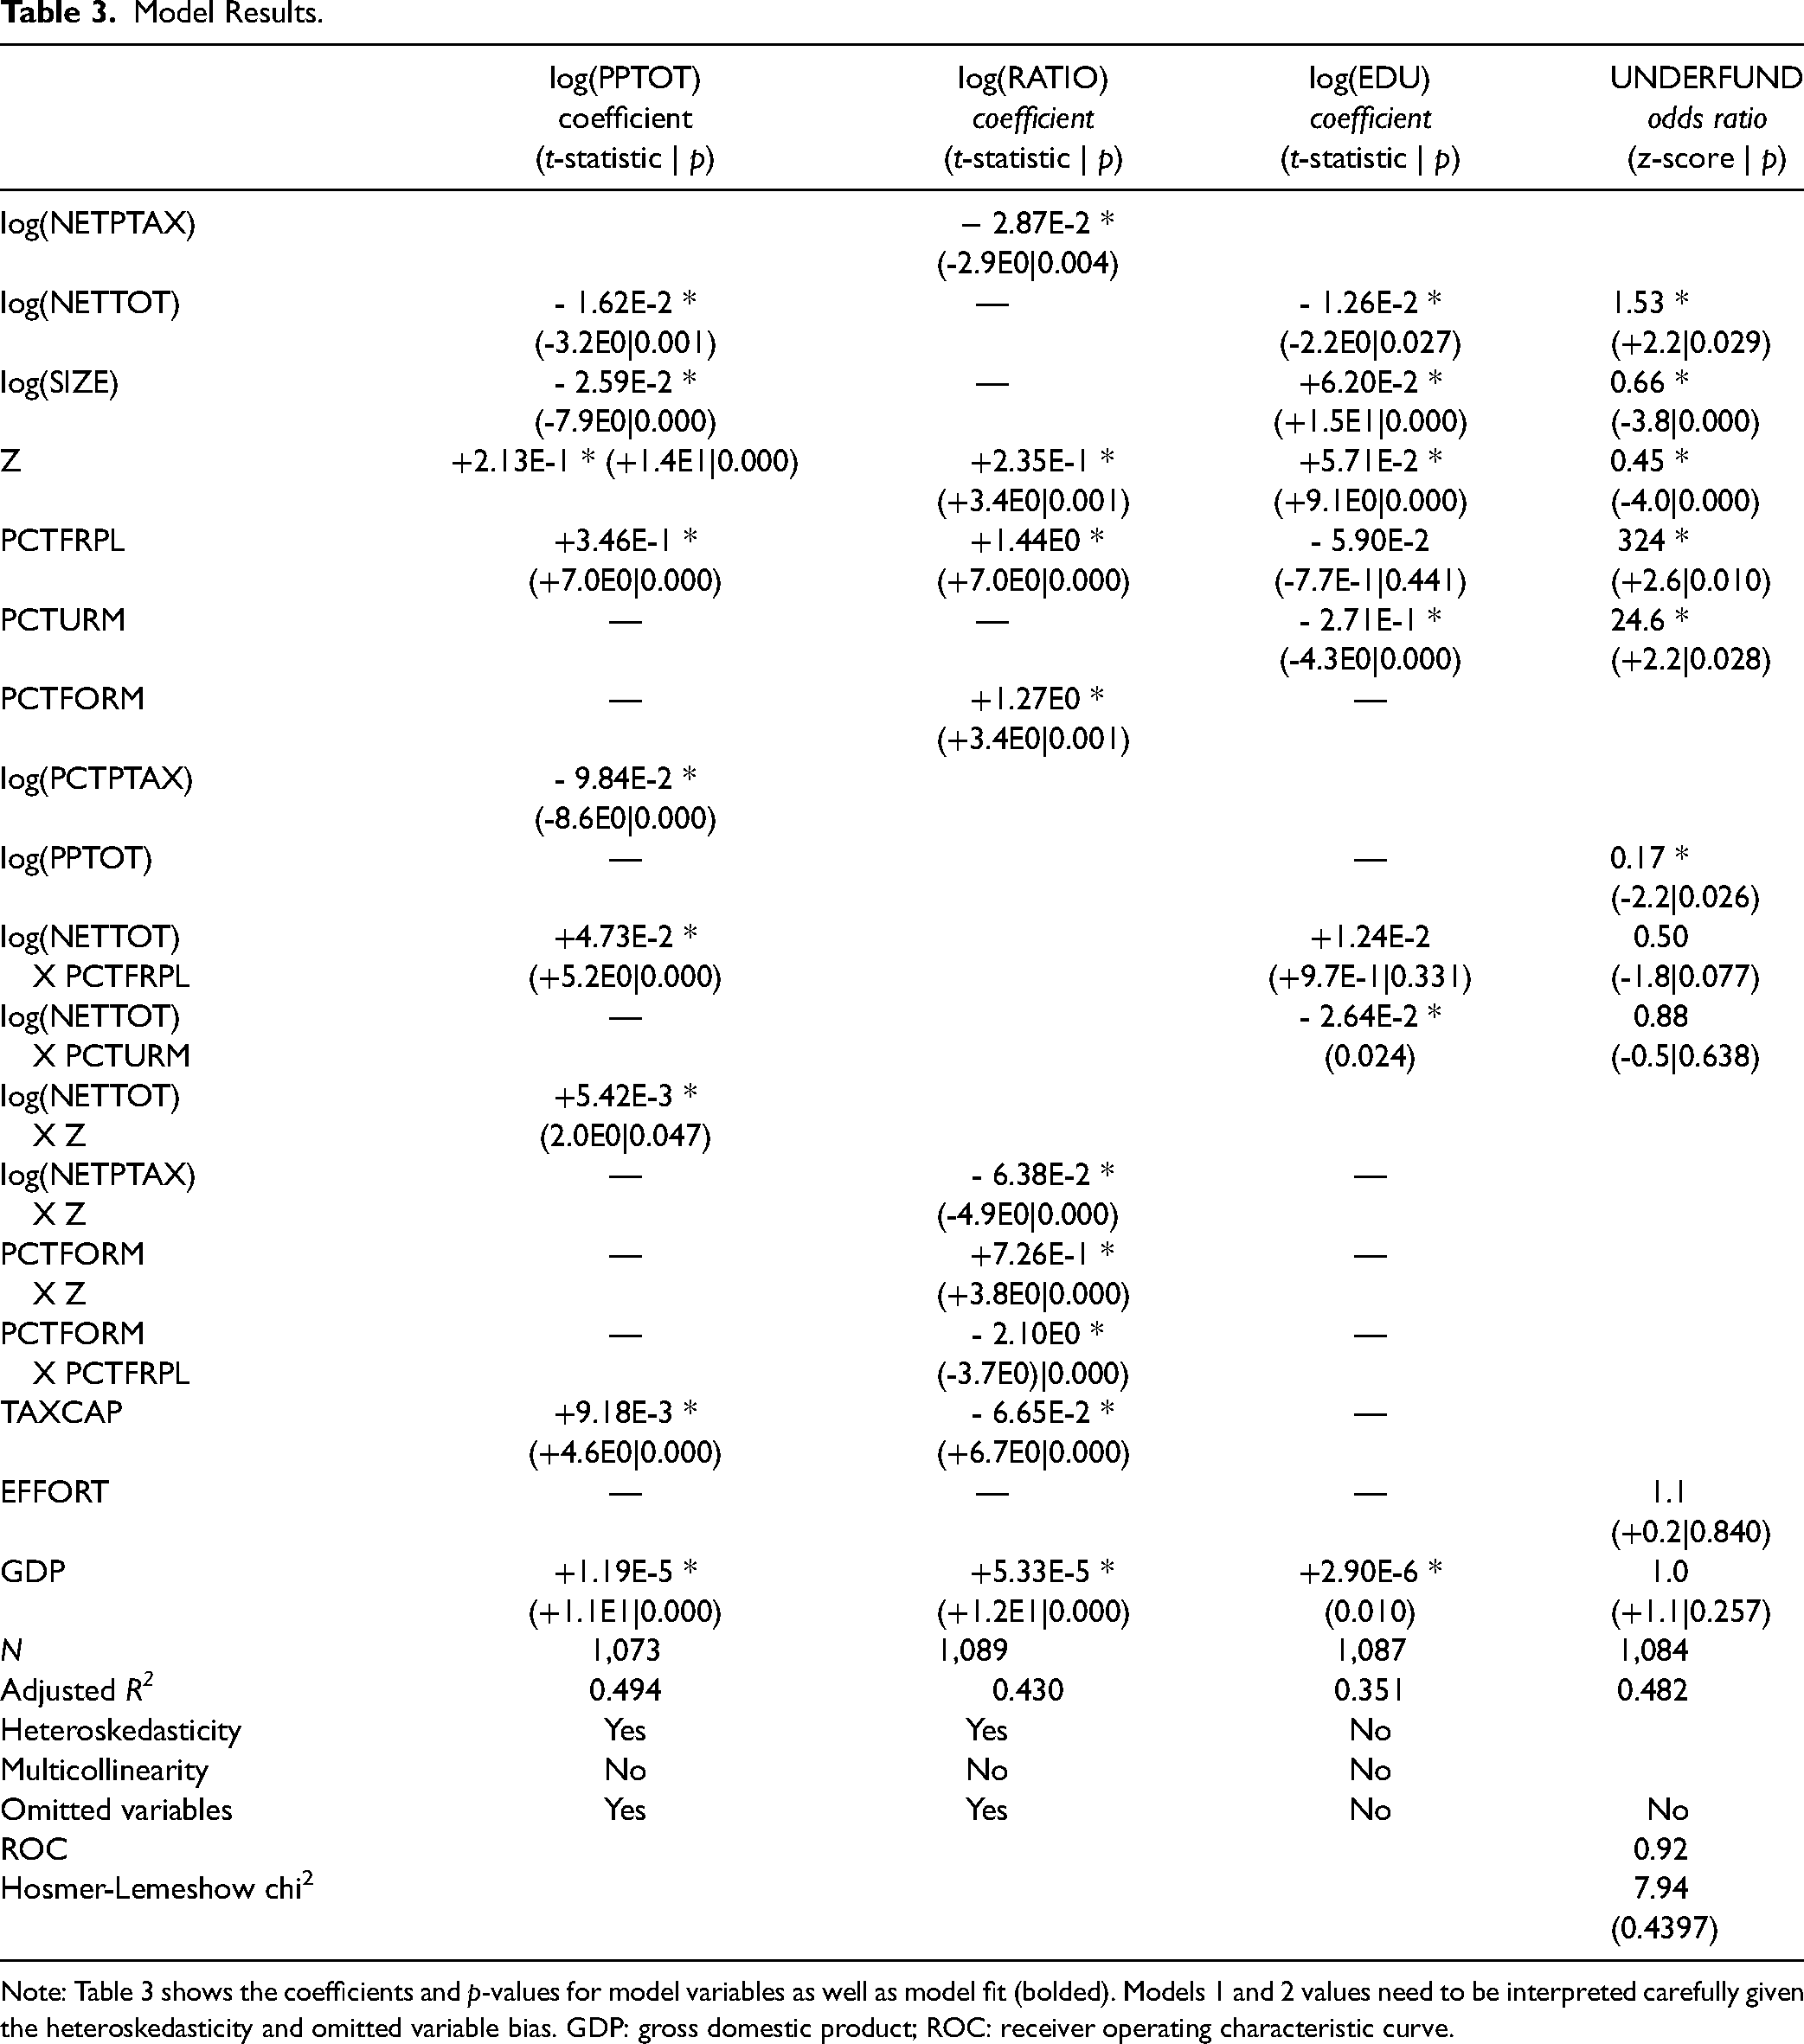
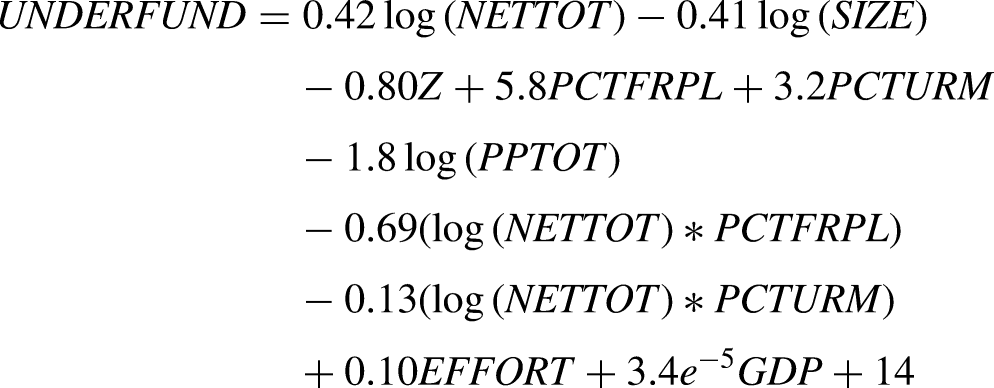
H1: Districts that forego more taxes relative to total revenues have less revenues per pupil. H2: Districts that forego more taxes relative to property tax revenues rely more on other local sources. H3: Districts that forego more taxes relative to total revenues spend less on teaching salaries. H4: Districts that forego more taxes relative to total revenues are more likely to be underfunded.
Tax abatement data were extracted from the notes section of 10,370 school district financial statements for the fiscal year 2019. While about half of these files can be downloaded in batches from the Federal Audit Clearinghouse, the Electronic Municipal Market Access, and state repositories of local government audits, there is little standardization or structure in the reporting formats to allow for large-scale machine reading and scraping. And as only 3 years of data were available at the time of collection and much of the collection requires manual efforts, longitudinal analysis was not suitable given the project's timeframe. In addition, because school districts in many states do not report finances independently, use GAAP accounting, or comply with Statement No.77, a national study was also out of the question. To make the most of this fragmented data set, I selected nine states that had robust and reliable tax abatement disclosures based on the number or percentage of reporting localities (i.e., having sufficient data points), the consistency in reporting format (suggesting that state agencies likely issued guidelines for local governments and their auditors), and/or triangulation with other sources (e.g., the Texas Comptroller publishes biennial reports on all incentivized projects). The final data set consists of 1,114 observations representing local public-school districts that reported foregone revenue figures greater than zero in fiscal year 2019 in Georgia, Iowa, Louisiana, Michigan, Missouri, Ohio, Oregon, South Carolina, and Texas. Because the data in these states are dependable, we can assume that those that omitted the Statement No. 77 notes did not have tax abatements or lost only a negligible amount to any active tax abatements.
Indicators include district size or enrollment, percentage of students qualified for free and reduced-price lunch, percentage of students from underrepresented groups (Black and Hispanic in this case), per-pupil revenues by source, per-pupil expenditures by function, and funding gap.
Five additional variables were constructed from these data: (1) relative tax abatement, defined as the ratio of taxes abated to revenues collected, as a proxy for impact; (2) funding level, defined as the ratio of the actual per-pupil spending to minimum adequate per-pupil spending, and a value less than 1 indicating underfunding; (3) teaching salary, defined as expenditures on teaching salaries divided by the number of teaching employees; (4) local revenue mix, defined as the ratio of property tax revenue to other local sources; and (5) property tax base, computed as normalized per-pupil property tax revenue over all districts in a state or the z-score.
Three relevant state-level variables are (1) the restrictiveness of the tax and expenditure limits or tax caps that states impose on school districts because these constrain the districts’ ability to raise revenue, measured as a state's relative rank out of the nine—with one being the strictest—based on the size of the limit, exclusions allowed, and override provisions (see Wen et al., 2020); (2) fiscal effort, measured as the ratio of direct educational expenditures to the gross state product (low effort indicates low priority on education, not low funding); and (3) gross state product.
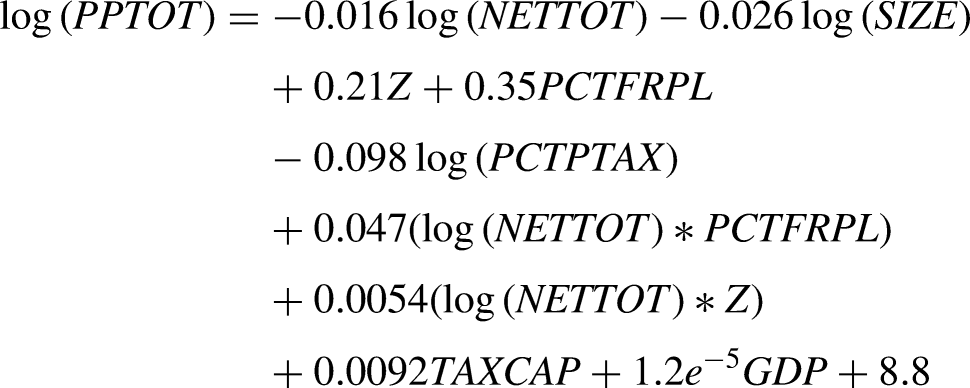
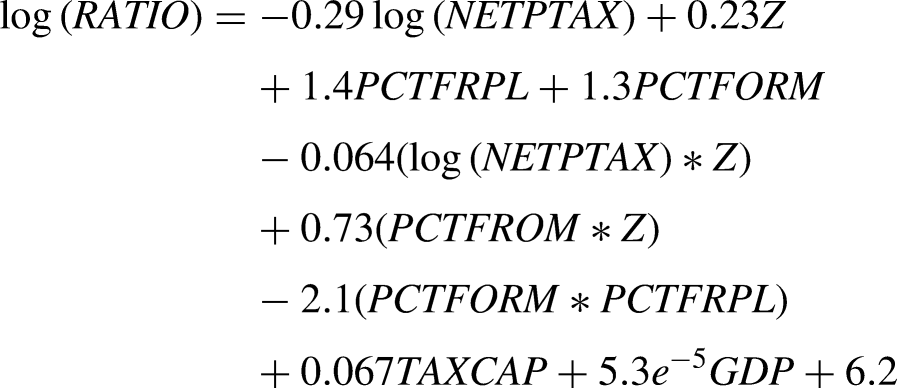
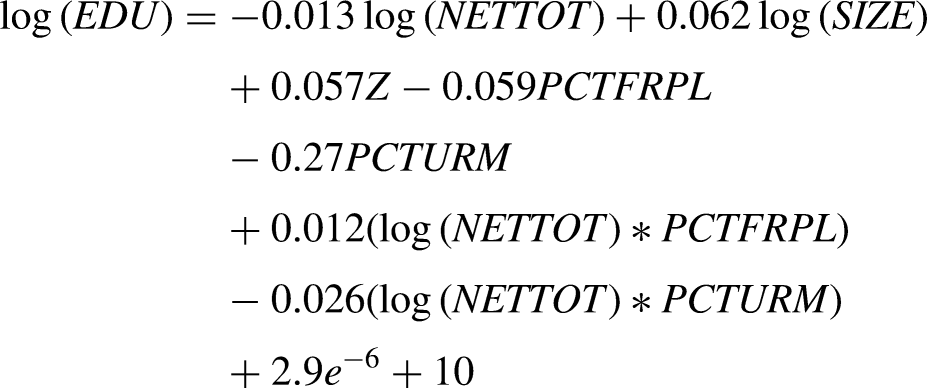
Linear models were used to regress property tax revenue, funding level, and teaching salary on tax abatement relative to total revenues (models 1, 3, and 4; see Figure 1), and local revenue mix on tax abatement relative to property tax revenues (model 2; see Figure 1). Variables for which data are highly skewed were log-transformed. The variables used in the models and their definitions or calculations are shown in Table 1. Interactions with district wealth are included in all the models.
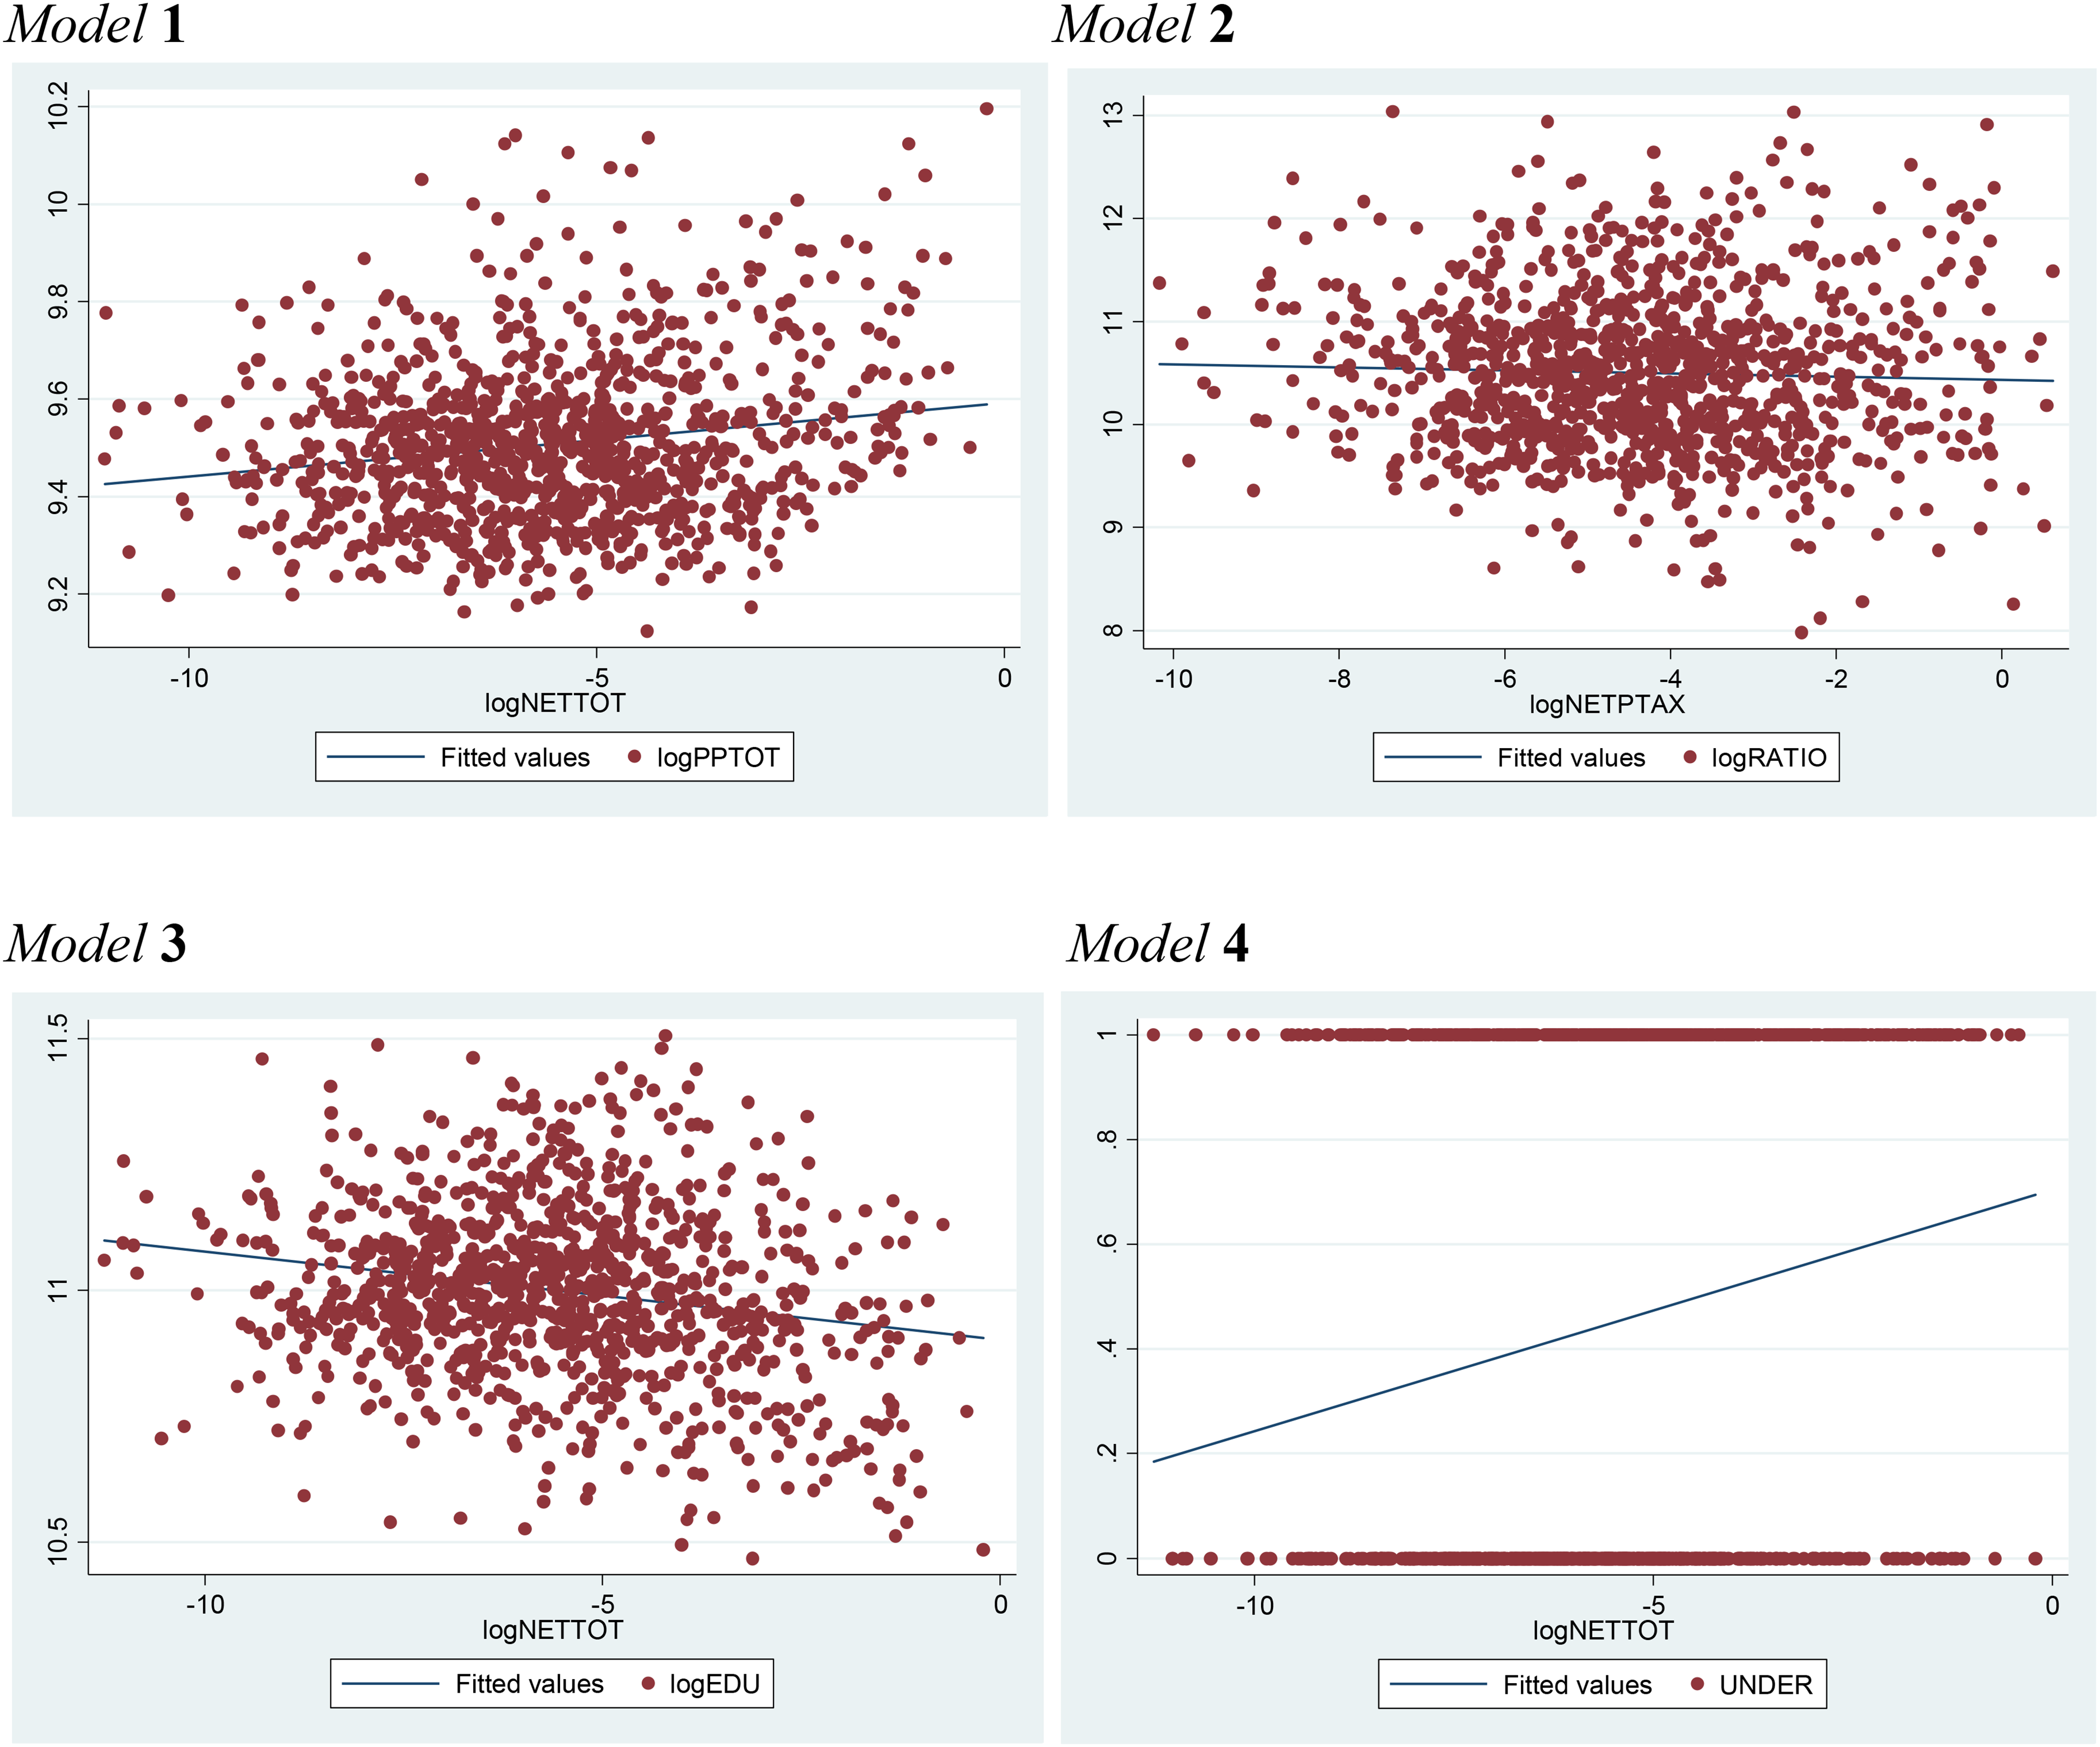
Scatter plots.
Model Variables Before Transformation.
GDP: gross domestic product.
The quantitative findings in this article are supplemented policy analyses of incentive programs as well as ten 60-minute interviews with experts and stakeholders in Ohio and New York to learn the role of politics and power dynamics in tax abatement outcomes. The transcripts or notes are analyzed in accordance with the paradigm of grounded theory (see Corbin & Strauss, 1990).
Findings
Statistical Results
Table 2 shows the means and medians of the variables used in the models or in the construction of model variables. Large differences indicate greater asymmetry. Missing data and extreme outliers are excluded. Models are specified as y = A * D + B * S
Descriptive Statistics.
Model Results.
Note: Table 3 shows the coefficients and p-values for model variables as well as model fit (bolded). Models 1 and 2 values need to be interpreted carefully given the heteroskedasticity and omitted variable bias. GDP: gross domestic product; ROC: receiver operating characteristic curve.
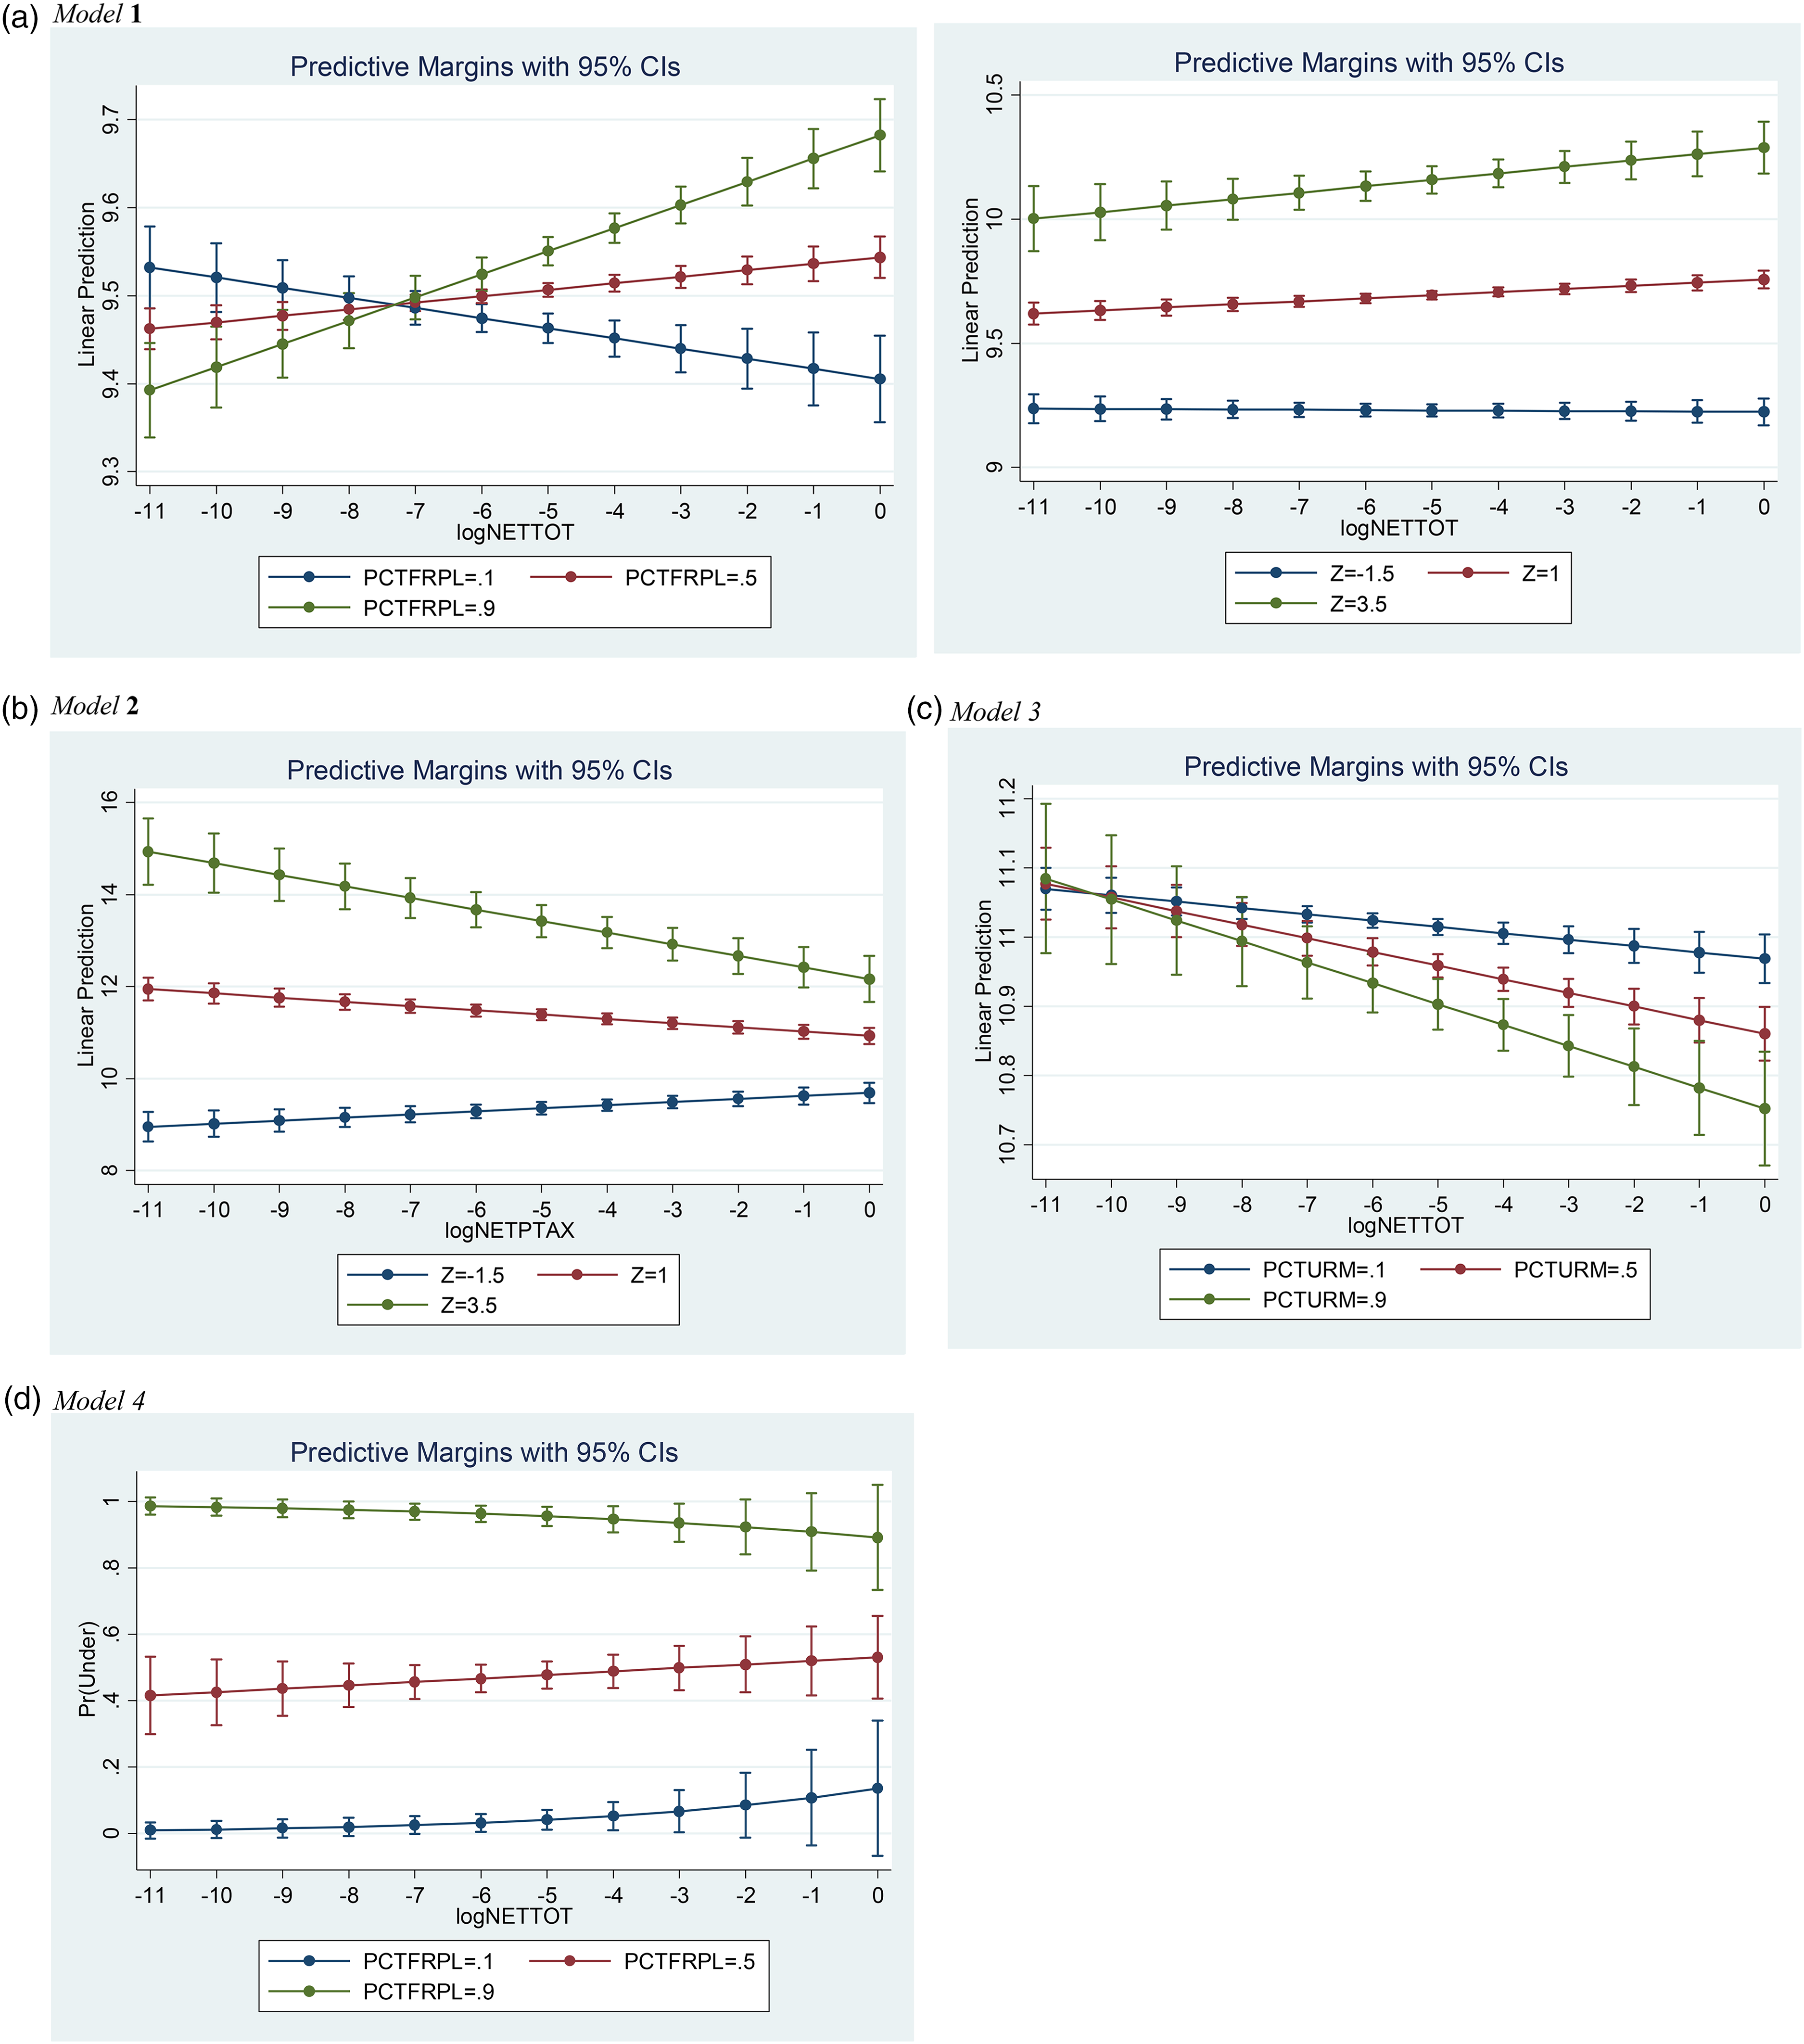
(a) Model 1 Interactions (significant explanatory variables only). (b) Model 2 Interactions (significant explanatory variables only). (c) Model 3 Interactions (significant explanatory variables only). (d) Model 4 Interactions (significant explanatory variables only).
Qualitative Analysis
Local authority to grant tax abatements is enabled by state legislation. A review of statutes shows a range of formal authority granted to school districts. For example, in Ohio, TIF and enterprise zones where abatements are greater than 75% or last longer than 10 years require a 45-day advance notice for, and the approval of, school boards, unless school revenues are fully reimbursed (TIFs only). School districts can negotiate revenue-sharing agreements for payments in lieu of taxes (PILOTs) from Community Reinvestment Areas and waive their right to approve or reject incentive proposals for a certain number of years. In Missouri, the establishment of redevelopment areas requires a 30-day advance notice to affected school districts and the appointment of two school board representatives to serve on the redevelopment (award-granting) committee. Its Chapter 100 program does not require school board representation, but the economic development agency is required to prepare a presentation and produce a cost-benefit analysis so that district officials can weigh in. Both Missouri and Ohio, as well as Michigan and several other states not included in the sample, offer some form of revenue compensation for schools. Finally, there are states like South Carolina that do not give school boards any formal authority, advance notification of proposals, or compensation other than adjustments from state equalization.
The interviews with experts and stakeholders in New York (which uses a bond-lease system to exempt taxes) and Ohio (which uses place-targeted tax abatements) revealed that where school boards have limited formal powers, the informal relationship between board members and members of city councils or industrial development agencies is particularly important for communications regarding award decisions and compensation measures. This collaborative relationship works better for smaller communities, much like Ostrom (1990) suggested for resource management. At the other end, some school board members face such intense political pressure from the city government to support proposed deals that they relinquish their veto power. Because of all these contextual factors, there is a large range of experiences, outcomes, and interjurisdictional dynamics from mutual symbiosis to quiet resistance to open confrontation as exemplified by the examples cited at the start of the paper.
Conclusion
The lack of definitive answers to the what-if questions poses a significant conceptual and practical challenge to the accounting for tax abatements. For example, if two localities end up with enough revenues to adequately fund their public services after abating different amounts, then this difference hardly matters. Moreover, tax abatements trigger changes in state aid that further confound the calculations. The amounts are also not independent of a place's fiscal condition like tax base, taxing capacity, revenue yield, and other noneconomic development tax abatements or exemptions. Finally, it is all relative—the same amount of taxes, foregone or levied, can have very different repercussions for different districts, which also depend on performance of the incentivized/subsidized projects.
The results of this article show that tax abatements are, overall, negatively associated with school finances, as found by Weber (2003) and Nguyen-Hoang (2014), suggesting that tax abatements are like phantom limbs: the revenues are hypothetical; the pain is real—especially since tax capacity is already limited by existing tax caps. Model 4, in particular, confirms the findings in Wendling's (1981) analysis that districts in the middle band of the wealth spectrum end up with the worst of both worlds (see Figure 2(d)). Models 1 and 2 suggest that resource-poor districts’ high dependence on state funding makes them less vulnerable to property tax abatements but likely more vulnerable to state fiscal distress (see Figure 2(a) and (b)). Model 3 shows a connection between tax abatements and spending constraints that appears stronger for students of color (see Figure 2(c)). No matter which came first, reducing one could reduce the other.
Because taxes constitute only a small percentage of the typical company's expenses, the likelihood of tax incentives tipping the scale is small, which means that somewhere in the ubiquity of tax abatement use exists a certain degree of inefficiency and waste. Cost-inefficient incentives, in particular, serve more to boost corporate profits than to generate broad-based economic benefits, while cost-ineffective incentives result in opportunity cost. The smaller the share of but-for projects among all subsidized projects, the longer the investment will take to generate new revenues sufficient to offset the cost. While existing studies suggested that a locality would be better off by eliminating its suboptimal tax incentives, this article adds that school districts abating less taxes are better off than the ones abating more.
This article's main limitation is the lack of longitudinal dimension, which is needed to determine the impact or causation rather than association. Because of time and resource constraints, this study had to settle for cross-sectional analyses and only a handful of interviews. It also must focus only on the gross fiscal cost since computing the benefits is something else altogether. Moreover, Models 1 and 2 suffer from specification errors (Table 3). Panel data analysis is needed down the road for reducing endogeneity and untangling the effects of fiscal conditions that might circumscribe tax abatements. An external limiting factor is that Statement No. 77 does not capture all tax-based subsidies, especially those that do not involve a direct rebate. The wording leaves too much room for localities to arbitrarily exclude certain types of tax abatements that do not strictly meet the technical definition, thus leaving out a sizeable chunk of the real revenue impact. Furthermore, a nationwide sample is not possible due to the high administrative cost of obtaining information about tax abatements, which makes reporting difficult for small, understaffed districts; the choice to adopt alternative accounting standards that have no requirements for reporting tax abatements; and the lack of independent reporting for some districts.
All these limitations notwithstanding, Statement No. 77 enables multistate studies such as this one, which would not have been feasible before its existence. The information deficit hampered theoretical development regarding the impact of tax abatements on public education and the role of school districts in the decision process. The lack of academic research on such an important issue, I argue, reflects the disconnect between economic development and community planning.
This article introduces this hitherto underexplored data source and in so doing, hopefully lays a foundation for future studies in this area. Indeed, it raised more questions than it perhaps answered: How do tax abatements impact public finances over time? Are fiscal outcomes affected by tax abatements in surrounding jurisdictions or tax abatements not captured by Statement No. 77? What other factors beyond those in existing data sets could be at play? These are worth exploring with more advanced spatial and temporal analytical techniques as well as governmental surveys. Multiple years of tax abatement data, however, would require either a large team of data gatherers, sophisticated algorithms for reading the disclosures, or adoption of uniform machine-readable reporting language by local governments. 6 Either Statement No. 77 expands to incorporate all forms of tax breaks, or other tax abatement data sources are needed to complement it (Wen & LeRoy, 2021). Geographical analysis could help illuminate neighboring spillover effects. Stakeholder and network analysis could generate additional variables on interjurisdictional power dynamics that might play a role (see, e.g., Warner & Zhang, 2022).
Finally, advocacy must continue to achieve better accounting and reporting of local tax expenditures, which would greatly facilitate all the above proposals. What little data we have is already generating movements for change and dismantling unfounded narratives that incentives are the way to go. They very well could be in some instances, but we cannot take the word of people who stand to gain from them (economic development officials, real estate developers, site location consultants, corporate public relations managers), and we cannot know for sure without rigorous analysis (see, e.g., Wassmer et al., 2016). Rigorous analysis is not possible without reliable data.
It is therefore critical for local governments to make the full tax abatement data public, as well as to be judicious about the use of tax abatements to fuel growth, especially when this growth does not translate to sustainable development. Unnecessary social damage can be mitigated by making school boards, parents, and teachers active participants in the award process, shielding part or all educational revenues from diversions, limiting the scope and duration of incentive contracts, designating independent agencies or committees to conduct regular program audits or evaluations, keeping the public informed about project performance, and allowing communities to decide their budgetary priorities and take control of their fiscal decisions.
Footnotes
Acknowledgments
The author would like to thank Professor Mildred Warner of Cornell University, Professor Jason Reece of The Ohio State University, Dr. John Schmitt of Economic Policy Institute, and the editors and reviewers at Economic Development Quarterly for their valuable input on this article; the interviewees who shared their stories and insights with me; Mr. Connor Rigney and Mr. Connor Ford for their assistance with the literature review; and colleagues at Good Jobs First for the tax abatement data.
Declaration of Conflicting Interests
The author(s) declared no potential conflicts of interest with respect to the research, authorship, and/or publication of this article.
Funding
The author(s) received no financial support for the research, authorship, and/or publication of this article.