
Abstract
Neuroticism, extraversion, and conscientiousness are the most notable personality predictors of subjective well-being (SWB) in phenotypic and behavior genetic studies. We aim to quasi-replicate and extend previous findings. Using data from the German twin family panel TwinLife, we analyzed Big Five personality traits and life satisfaction of 3,080 twin pairs from three birth cohorts (born 2003/04, 1997/98, and 1990–93). Prior research has repeatedly provided evidence that genetic variance in personality traits largely explained genetic variance in SWB. Our results replicated this pattern with no significant unique genetic variance in life satisfaction. However, we found significant age cohort differences (e.g., only in ages 17–23 did genetic variance in openness partly explain genetic variance in life satisfaction). Furthermore, we tested personality–SWB associations using polygenic scores (PGSs) for Big Five personality traits and SWB. PGSs were calculated for
Plain Language Summary
Genetic factors responsible for personality are likewise associated with subjective well-being. This is an extension of previous twin studies and molecular genetic studies to better understand if known association patterns replicate based on longitudinal data and across different age cohorts.
Introduction
Subjective well-being (SWB) has been linked to a number of core personality traits in previous research with neuroticism, extraversion, and conscientiousness as the most robust correlates. This pattern has been replicated across multiple large-sample studies and multiple psychometric instruments (Anglim et al., 2020). Moreover, personality–SWB associations seem to have a genetic foundation, as inferred from genetically informative studies, such as twin studies (Hahn et al., 2013; Pelt et al., 2024; Røysamb et al., 2018; Weiss et al., 2008) and molecular genetic studies (Baselmans, Jansen, et al., 2019; Weiss et al., 2016). Open questions arise in terms of possible age differences in SWB heritability (Bartels, 2015) and the extent to which quantitative genetic and molecular genetic evidence on this association align. Additionally, most previous studies have relied on single measurements of personality and SWB, which raises the question whether or not their results would replicate when investigating stable traits or set-points across longer time frames. Answering these key questions can shed light on possible context specificity over age or time of genetic (and environmental) influences on personality-mediated differences in SWB (e.g., genetic innovations following Kendler et al., 2008).
We ran two studies to investigate the phenotypic and genetic links between core personality traits and SWB aspects within and across different age groups. In a first study, our aim was to (a) quasi-replicate previous findings on the phenotypic and genetic links between personality traits and life satisfaction based on twin studies and (b) extend former studies by examining the genetic and environmental links between six-year stable personality traits and life satisfaction set-points based on a German twin family study. We additionally investigated age cohort differences in these associations. In the second study, we used genotype data from 5,355 individuals to calculate polygenic scores (PGSs) for Big Five personality traits and different SWB facets. We estimated the PGS-based genetic correlations between personality and SWB. In an extension of the previous literature, we also examined the consistency of predictions of life satisfaction set-point and personality trait phenotypes by SWB and personality PGSs, while additionally considering age differences.
Background: Links between subjective well-being and personality traits
Theoretical considerations
Subjective well-being
Theories on the structure of SWB, with a cognitive component, life satisfaction, and affective components, namely, positive and negative affect, have been classified by Diener (1984), among others, into top-down versus bottom-up theories (see also Diener et al., 1999). After four decades of scientific progress, this heuristic still holds. Bottom-up theories assume day-to-day emotions and evaluations of one’s life (i.e., fluctuating affect and satisfaction surface levels) to add up to individual differences in general SWB levels. In contrast, top-down approaches typically propose a single higher-order factor accounting for the links between facets of SWB, sometimes referred to as h-factor, with “h” for happiness (Bjørndal et al., 2023). A specific example for top-down theories is the set-point theory (Headey & Muffels, 2018; Ormel et al., 2017), which assumes SWB to fluctuate around individual set-points that are relatively stable across time and linked to personality differences.
Personality and well-being
The Big Five personality traits openness to experience, conscientiousness, extraversion, agreeableness, and neuroticism (or inversely, emotional stability; McCrae & Costa, 1991; Soto & John, 2016) are considered predispositions or basic tendencies that account for stable affective, cognitive, and behavioral patterns of an individual over a certain period of time (Kandler et al., 2014). They shape how individuals (re)act in and perceive their environments (Wagner et al., 2020). Thus, personality traits can drive behavior and experiences in ways that might be more or less beneficial for the development of SWB. In a top-down perspective, personality traits might drive individuals’ perceptions of their surroundings, shaping their day-to-day affect and satisfaction levels. Reciprocally, day-to-day affect might in sum influence more general SWB levels and associated personality characteristics (e.g., emotional stability).
Genetic and environmental factors
The moderately stable variance in SWB—the so-called SWB set-points—might manifest through stable genetic predispositions (Brown & Rohrer, 2020; Lykken & Tellegen, 1996), rather than potentially changing and mutable environments. Linking set-point theory to the robust finding of personality–SWB associations, broad polygenic personality traits may be promising candidates which can account for stable genetic differences in SWB (Weiss et al., 2008, 2016). However, the relevance of certain genetic factors can change with development across the lifespan via multiple interactions and transactions between genetic and environmental factors. For example, selection into fitting environments and creation or modification of environments to increase person(ality)–environment fit, which is important for well-being (Gebauer et al., 2020; Jokela et al., 2015) are increasingly more feasible in adulthood compared to youth (Kandler et al., 2019, 2024). Thus, the relevance of genetic differences in certain personality traits driving SWB set-points may increase with age, or differ depending on the investigated time frame.
Current state of research
Phenotypic associations
In their recent meta-analysis, Anglim et al. (2020) found the strongest links between personality traits and SWB to stem from neuroticism, extraversion, and conscientiousness, followed by agreeableness and openness. Short-scale instruments showed somewhat weaker correlations compared to their long-form versions, but the observed pattern remained the same. Personality differences accounted for about half of the variance in SWB.
Associations between personality traits and SWB can manifest through personality-driven behavior. For example, pronounced conscientiousness drives educational success (Hufer-Thamm et al., 2023), which in turn may lead to higher chances for more stable, prestigious, and well-paid career options. Similarly, high conscientiousness predicts health behavior (Gartland et al., 2021). Career success and health are in turn associated with increased well-being (Diener et al., 2017). Pronounced extraversion might lead to a larger social network and increased social participation, which have been shown to positively predict life satisfaction (Rohrer et al., 2018). Pronounced agreeableness drives socially acceptable behavior in interpersonal relations and might thus increase the satisfaction with one’s social network (Wilson et al., 2015). The negative association of SWB with neuroticism and the positive link between SWB and extraversion are intuitive. Neuroticism includes facets of negative affectivity, such as anxiety or depressiveness, which are negatively associated with SWB (Fergusson et al., 2015; Stein & Heimberg, 2004), whereas extraversion includes facets of positive emotionality (Soto & John, 2016), which can be understood as the dimension driving positive affect as one aspect of SWB (Diener, 1984).
It seems plausible that the described associations are of varying importance in different stages of development. Given that both personality traits and SWB have been shown to be malleable (Headey & Muffels, 2018; Ormel et al., 2017; Wagner et al., 2020), we expect that their relationship, too, may systematically vary across the lifespan. Previous evidence on such age differences is rare and has been mixed. On the one hand, Magee et al. (2013) and Luo et al. (2023) reported evidence for age differences in the links between personality traits, life satisfaction, and general health. On the other hand, Kokko et al. (2015) and Olaru et al. (2023) found evidence for invariant personality–SWB association patterns across age.
Quantitative genetic associations
Heritability estimates for SWB ranged from about 20% to 60%, with environmental effects accounting for the remaining variance (Bartels, 2015). Similarly, personality trait heritability ranges from 40% to 70%, with higher estimates for measures corrected for random error and systematic rater biases (Kandler et al., 2010; Kandler & Papendick, 2017; Vukasović & Bratko, 2015).
Previous quantitative genetic studies have repeatedly found evidence for substantial genetic overlaps, with considerable proportions of genetic variance in SWB being explained by genetic differences in personality traits. In a first study, Weiss et al. (2008) analyzed 973 twin pairs from a U.S. sample using a multivariate model. They found neuroticism, extraversion, and conscientiousness, along with an overarching genetic self-report factor, to completely account for the genetic variance in life satisfaction. Sadiković et al. (2018) provided similar evidence based on 182 Serbian twin pairs. Hahn et al. (2013) investigated the same constructs based on 1,308 twin pairs and other family members from a German sample. Inferring from a genetically sensitive multi-group design with various unrelated kinship dyads, they found the genetic variance in neuroticism and extraversion to completely explain the genetic variance in life satisfaction. Røysamb et al. (2018) found 65% of the genetic variance in life satisfaction to be explained by genetic variance in neuroticism and extraversion facets, but did not include conscientiousness in their biometric analysis of 758 Norwegian twin pairs. In a study of Dutch twins from 8,232 pairs, Pelt et al. (2024) investigated phenotype- and gender-specificity of the personality–SWB relationship, while highlighting the importance of future examinations of possible age specificity. Neuroticism, extraversion, and conscientiousness likewise showed the largest genetic overlaps with SWB. Life satisfaction, specifically, did not show significant unique trait-specific variance, while other characteristics, such as self-rated health, did show such unique genetic variance components. Overall, twin (family) studies provided consistent evidence for genetic links between personality traits and SWB.
Molecular genetic associations
Most previous studies on the genetic overlap between personality and SWB relied on twin studies. However, genome-wide association studies (GWASs) are also informative about common genetic variants that are linked to certain phenotypes in a population. GWASs allow for the discovery of single-nucleotide polymorphisms (SNPs) related to specific traits. PGSs based on GWASs can offer molecular genetic estimates of individual polygenic loads associated with particular traits (Andlauer & Nöthen, 2020). Whereas several GWASs on personality and SWB exist (e.g., Baselmans, Jansen, et al., 2019; de Moor et al., 2012), only few studies have systematically investigated the molecular genetic associations between personality and SWB. Okbay et al. (2016) reported a high negative correlation of
In sum, the evidence from molecular genetic studies for genetic links between personality traits and SWB is mixed. One reason may be age specificity of associations between genetic variants and specific phenotypes. Thus, the gene–personality and the gene–SWB link as well as their genetic cross-links may vary across different stages of development. It has been described as a desideratum for molecular genetic research on complex human traits to take a “lifespan approach” (Freitag & Kelsey, 2023, p. 30), which we follow by investigating PGS-based prediction of stable life satisfaction set-points and personality trait phenotypes in comparison of different age cohorts.
The present research
In the first study, we aimed at quasi-replicating previous findings concerning genetic links between personality traits and life satisfaction set-points. Based on data from a large German twin family panel, which covers longitudinal information on personality traits and life satisfaction, we extended previous studies by analyzing the links between six-year stable components of personality and life satisfaction. We compared these links of valid personality trait and SWB set-point differences between age cohorts, which include different developmental phases from 10 to 30 years of age. In addition to quantitative genetic analyses, PGSs provide molecular genetic estimates of trait associations based on additive genetic effects. Therefore, in the second study, we used PGSs for Big Five personality traits and SWB facets based on genome-wide genotype data. PGS-based genetic correlations of well-being and personality PGSs were estimated. We further examined the consistency of PGS predictions of stable life satisfaction set-point and personality trait phenotypes across different age groups ranging from 8 to 77 years of age.
Overview of Hypotheses.
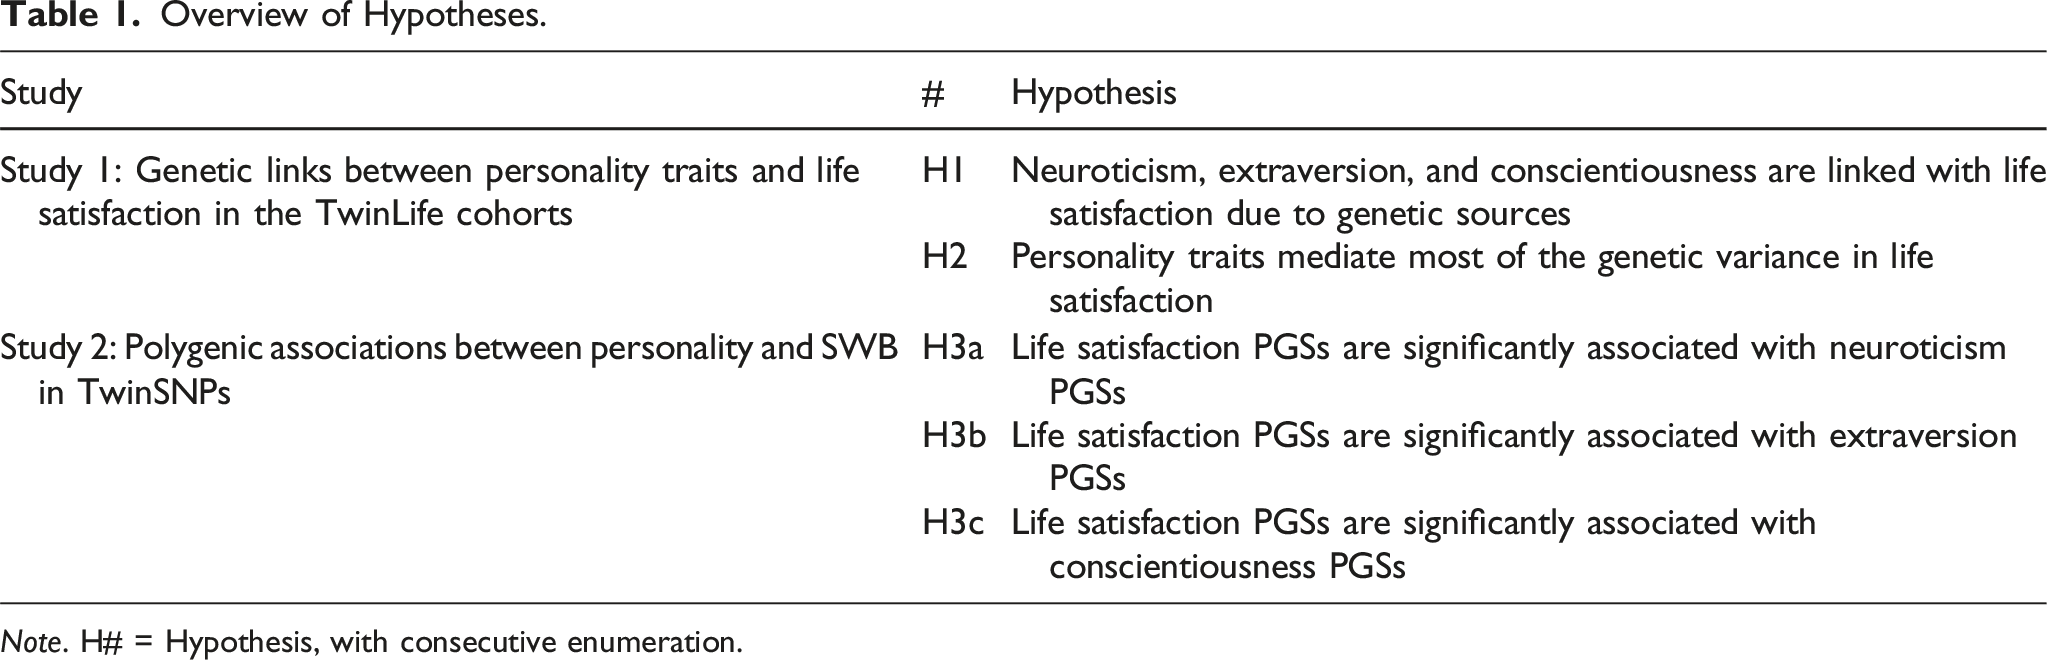
Note. H# = Hypothesis, with consecutive enumeration.
Study 1: Genetic links between personality traits and life satisfaction in the TwinLife cohorts
In the first study, based on data from twins reared together, we aimed at replicating previous findings. In line with previous evidence (Hahn et al., 2013; Pelt et al., 2024; Røysamb et al., 2018; Sadiković et al., 2018; Weiss et al., 2008), we expected that neuroticism, extraversion, and conscientiousness are linked with life satisfaction due to genetic sources (H1) and that these personality traits mediate most of the genetic variance in life satisfaction (H2). We extended previous research by examining the genetic and environmental links of six-year stable personality trait differences and life satisfaction set-point differences. We also explored whether patterns in personality—life satisfaction links are consistent across age cohorts.
Methods
Data
Initial Twin Sample Description.
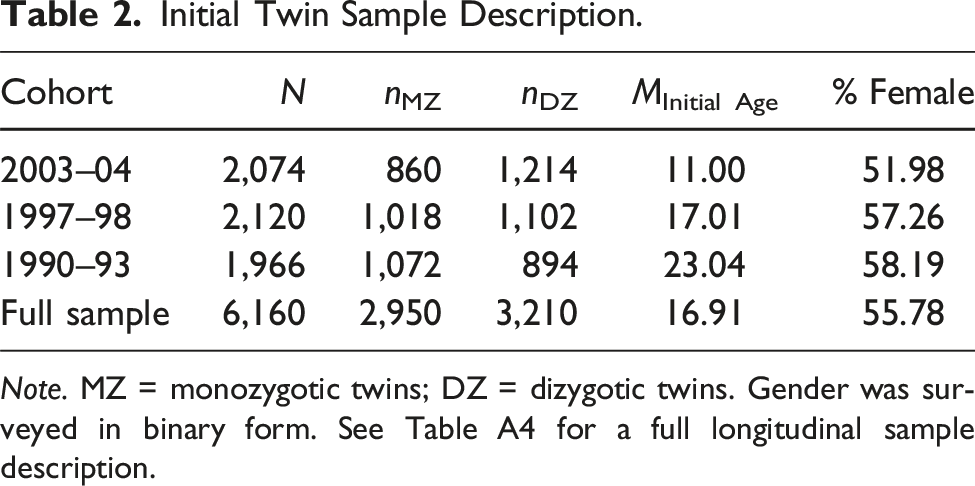
Note. MZ = monozygotic twins; DZ = dizygotic twins. Gender was surveyed in binary form. See Table A4 for a full longitudinal sample description.
Measures
Life satisfaction was measured with the Satisfaction With Life Scale (SWLS; Diener et al., 1985) and the adapted scale for children (SWLS-C; Gadermann et al., 2010). The SWLS-C was applied when participants were 10–15 years old, and the SWLS for participants of age 16 and older (see Table A1). Data from both instruments were pooled for analysis and checked for measurement invariance (MI) between twin birth cohorts (i.e., between instruments). Partial strict MI could be assumed between twin cohorts (see Tables A10, A11, and A12), suggesting comparability of the SWLS and SWLS-C measures. At least partial strict MI could be assumed across panel waves (see Table A12). Personality traits were measured with a short form of the Big Five Inventory as applied in the German Socio-Economic Panel (BFI-S; Gerlitz & Schupp, 2005; Hahn et al., 2012). See Tables A2 and A8 for details.
Internal consistency was examined for all SWLS(-C) and BFI-S measurements. McDonald’s ω ranged from .85 to .89 for SWLS(-C) measures. Internal consistency was acceptable for most of the BFI-S measures, given that short measures were used to capture broad constructs (ranging from
Regarding factorial validity, we ran exploratory and confirmatory factor analyses (EFA and CFA) based on first-wave data (2014–16) from the initial sample. EFAs were based on the principal axis method using varimax rotation, which was used to maximize explained variance in the expectation of an orthogonal factor structure (Kaiser, 1958). Both EFA and CFA for life satisfaction clearly yielded a one-dimensional solution (see Tables A7 and A9). The EFA of personality items yielded no deviations from the expected five-factor structure (i.e., all items loaded highest on their respective domain with factor loadings ≥ .3, which we assume as sufficient following Costello & Osborne, 2005; see Table A8). Factor scores for personality domains were extracted from EFA as Anderson-Rubin scores (DiStefano et al., 2009). These provide the advantage of uncorrelated personality trait scores, resulting in more specific measures of each personality domain and ensuring factorial independence. With the inclusion of a first-order common method variance factor for the BFI-S measurement (to bind error variance from potential method effects; Podsakoff et al., 2003), CFA likewise showed sufficient fit to the five-factor structure (
Latent state-trait models (Steyer et al., 2012) were then fitted to examine stable variance of life satisfaction set-points and personality traits. These models were based on longitudinal data with additional information from the second (2016–18), third (2018–20), and fourth (2020–22) face-to-face survey of the panel. Factorial independence was considered by fixing covariances between latent personality domains to zero. Both models showed acceptable fit to the data (
Analyses
Genetic and environmental variance in life satisfaction and personality domains were estimated in a classical twin design (CTD) model based on the comparison of MZ and DZ twin correlations. In this model, variance is decomposed into an additive genetic component (A), either a shared environmental (C; assuming
We started by comparing univariate ACE, ADE, and AE model variants (see Table A24). According to Falconer’s (1989) formula, which suggests C effects if
Following this, we compared the model fit between multivariate Cholesky models in their ACE, ADE, and AE variants with the weighted Akaike Information Criterion (wAIC; Wagenmakers & Farrell, 2004) and the Bayesian Information Criterion (Schwarz, 1978), the latter of which more strongly considers model complexity and avoids choosing overfitted models, especially in large sample sizes and models with many indicators such as multivariate behavior genetic models (Markon & Krueger, 2004). The most parsimonious models with smallest BIC were therefore chosen for analysis. This was complemented by additional model variants of the most parsimonious model with statistically insignificant paths dropped from the model, and another one with no A paths unique to life satisfaction, to check whether or not these could be dropped from the model without a significant decline in model fit (see Tables A25, A26, and A27). The described analyses were conducted with initial first-wave factor scores (henceforth: initial scores) and with six-year stable personality trait and life satisfaction set-point scores (henceforth, stable trait and set-point scores).
Results
Zero-order correlations between initial life satisfaction and personality scores were highest for neuroticism, conscientiousness, and extraversion ( Phenotypic correlations of six-year stable personality traits and life satisfaction set-points. Note. Estimates = Pearson’s r. Insignificant correlations with 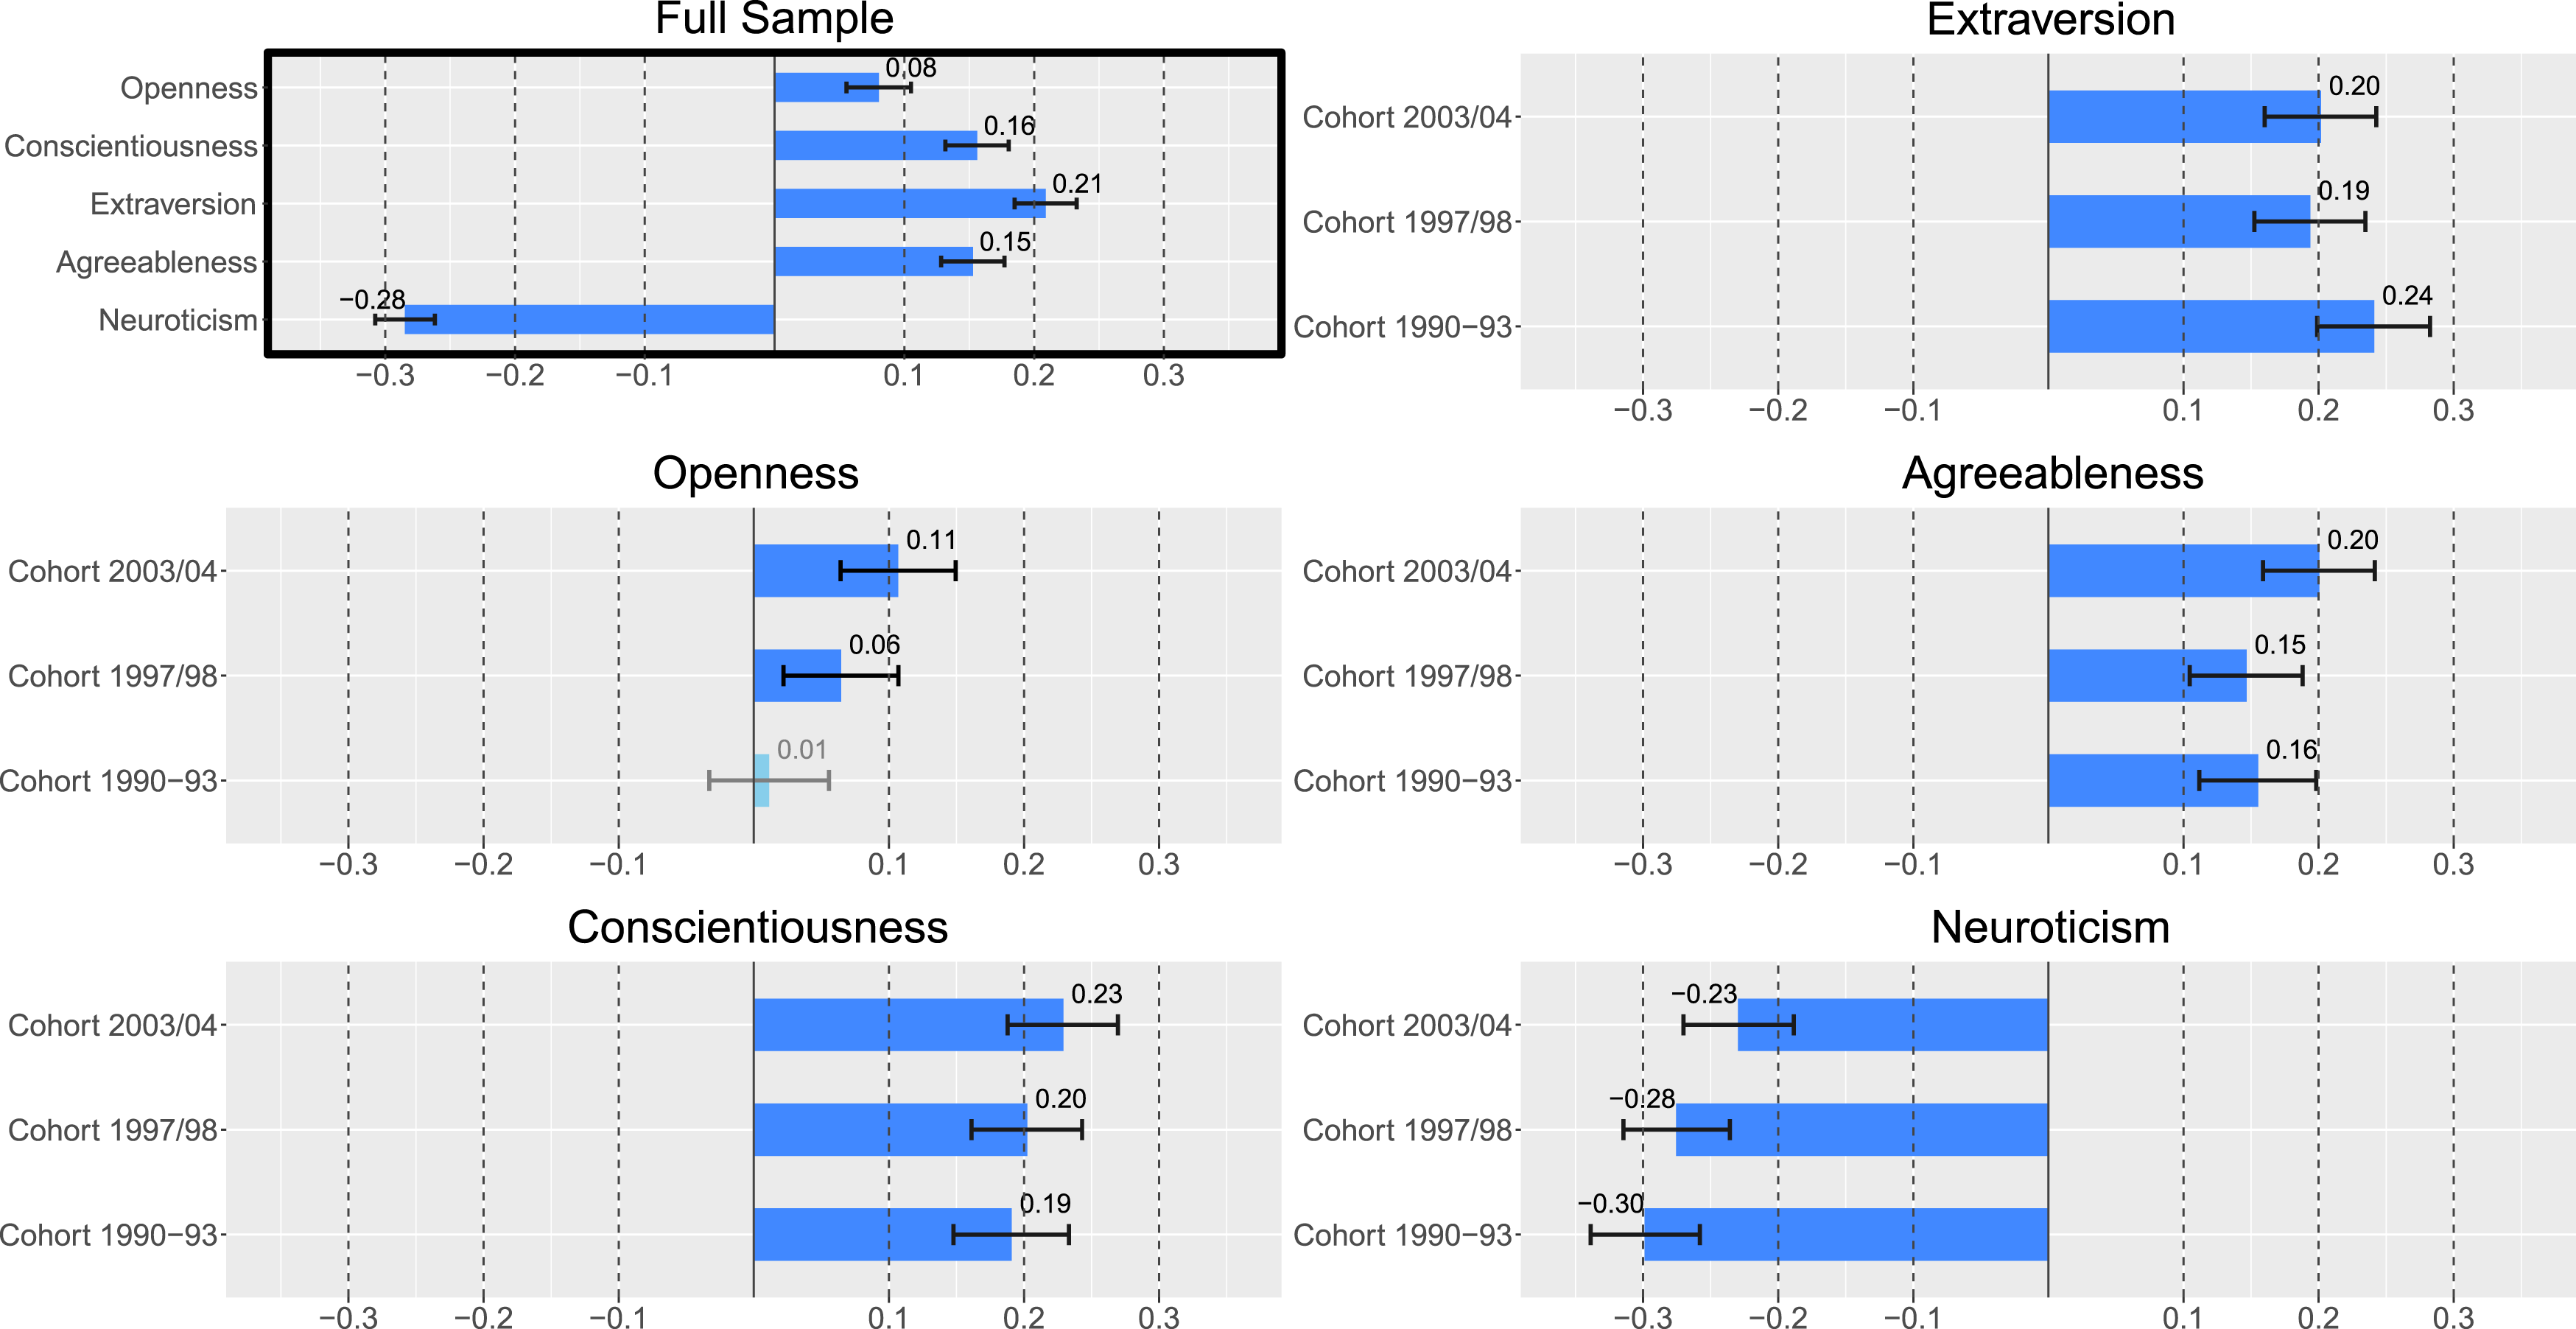
Twin pair correlations suggested only minor genetic effects and the presence of shared environmental influences on life satisfaction with
The analyses of initial scores showed that in these models, the paths estimating genetic effects unique to life satisfaction could be dropped without significant loss of fit (according to
Focusing on the analyses based on stable trait and set-point scores, multivariate Cholesky models yielded the strongest genetic links between life satisfaction and the personality traits neuroticism, extraversion, and agreeableness, partially confirming H1. They explained 50.7%, 31.9%, and 8.6% of the genetic variance in life satisfaction, respectively, while conscientiousness only played a minor role with 6.4% explained variance. In the full sample, genetic variance in personality traits fully explained genetic variance in life satisfaction in the context of our analyses, confirming H2. Genetic variance in personality traits accounted for 16% of total variance in life satisfaction (see Figure 2 and Table A30). For all initial and stable trait scores, genetic variance in personality traits completely explained genetic variance in life satisfaction in our data (see Tables A28 to A33), with one exception: In the oldest cohort, genetic variance in life satisfaction stable set-points could not be fully explained by genetic variance in personality traits. This came along with estimates for life satisfaction C effects not being significantly different from zero in this group. Cholesky decomposition model results for the full sample and different birth cohorts: Six-year stable trait and life satisfaction set-point scores. Note. O = Openness; C = Conscientiousness; E = Extraversion; A = Agreeableness; N = Neuroticism; LS = Life satisfaction; A = Additive and non-additive genetic effects; C = Shared environmental effects (only unique LS paths estimated—personality paths fixed to zero); E = Nonshared environmental effects and measurement error; A/C/ELS estimates = total amounts of variance explained by latent A/C/E factors; Percentages = proportions of A/C/E variance explained; Gray segments = variance in life satisfaction not explained by personality. Percentages rounded via largest remainder method. See Figure A3 for results based on initial first-wave scores. The full sample association with conscientiousness was lower than in the subsamples due to contrary age cohort correlations: Rank-order correlation between cohort and conscientiousness was positive, but negative for life satisfaction (ρC = .26 while ρLS = −.19).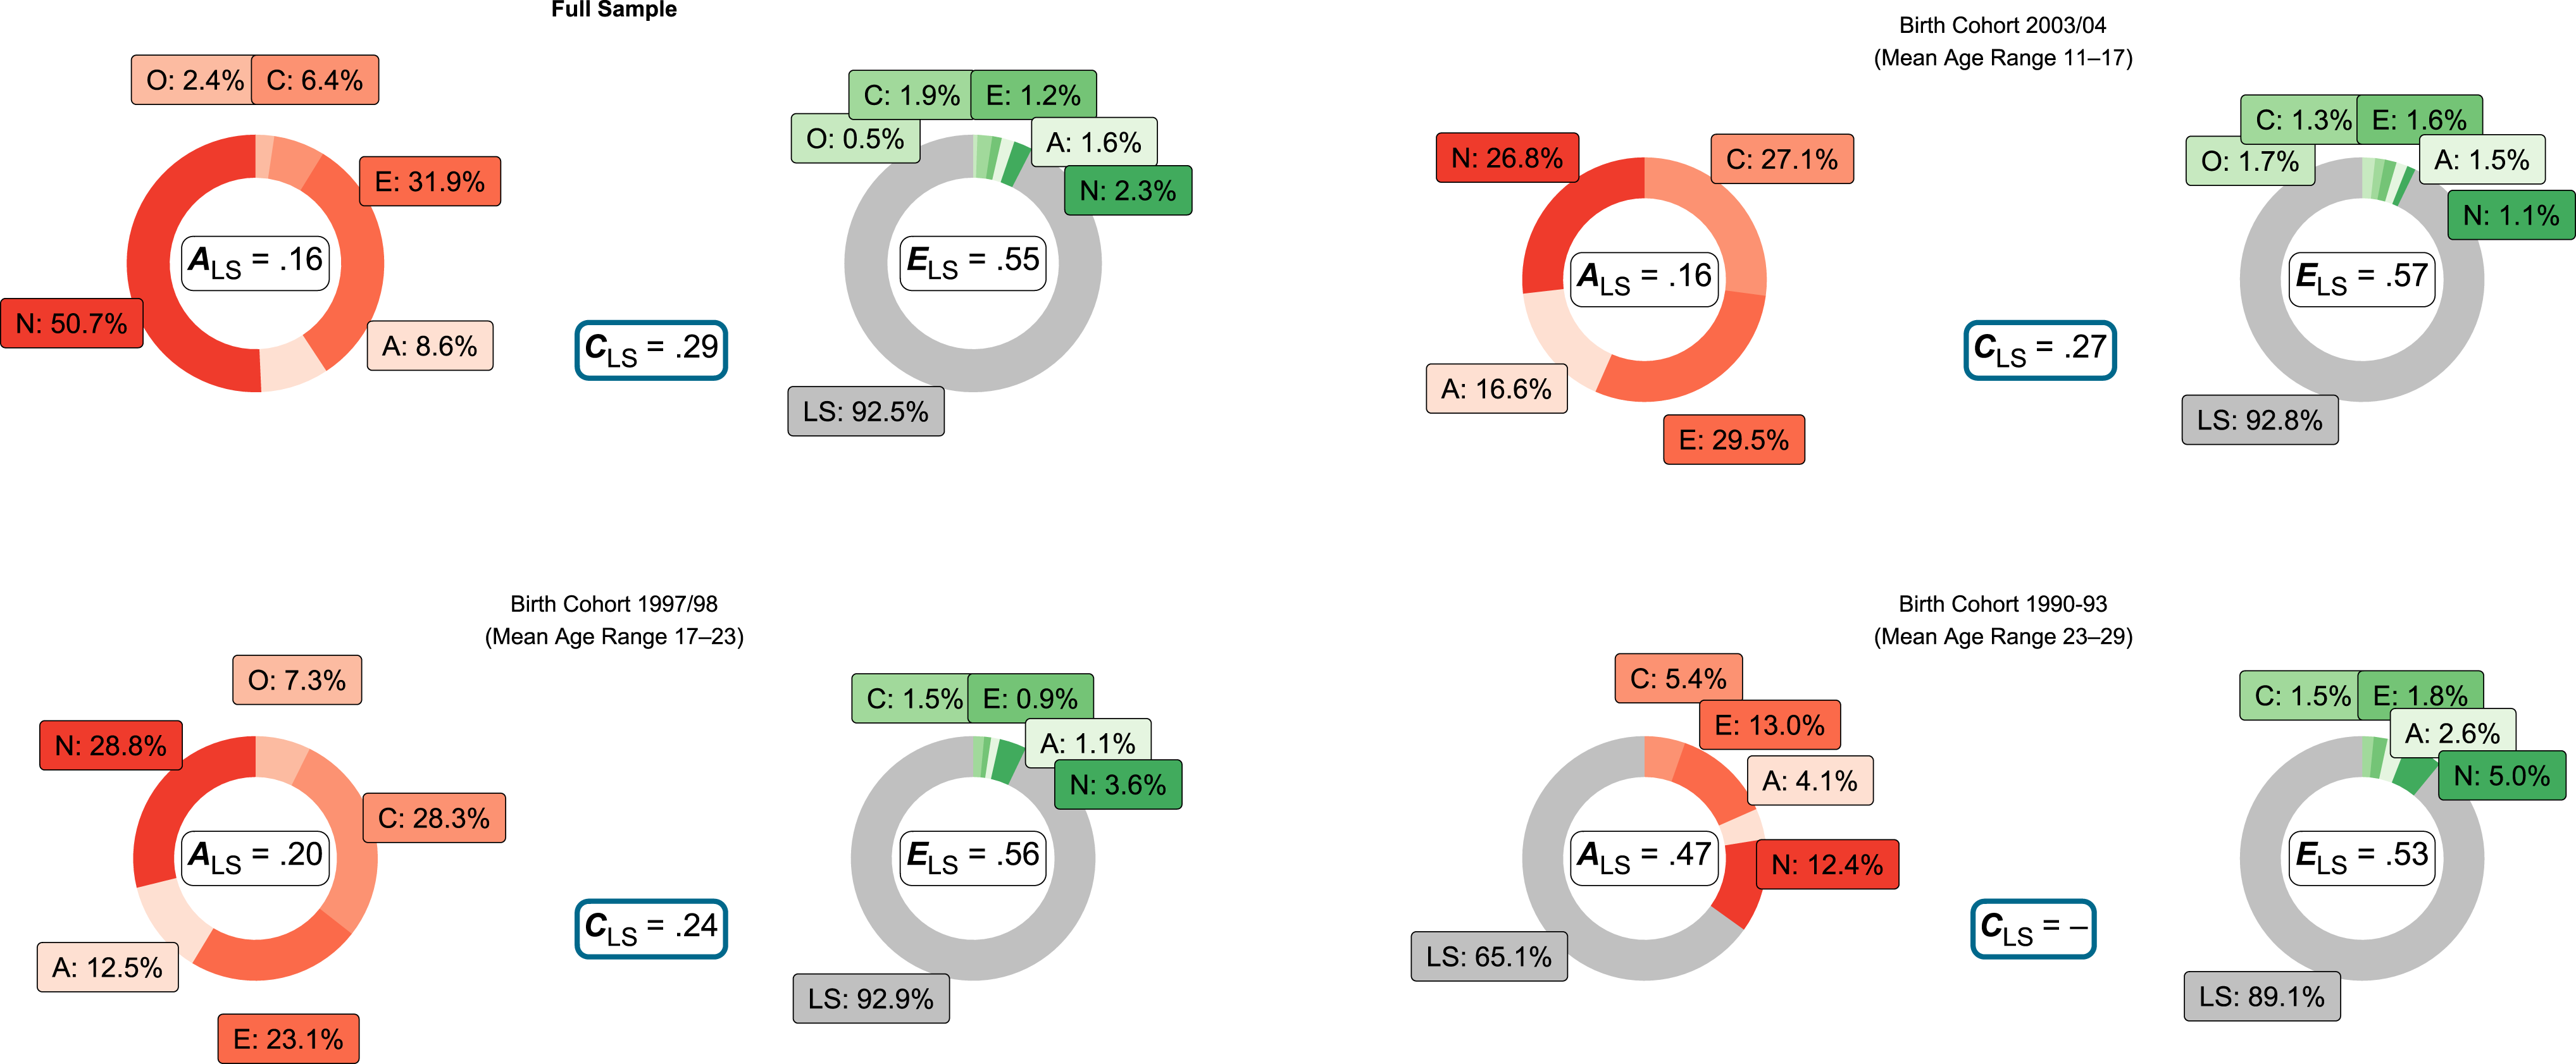
Within the youngest cohort (age range 11–17), genetic differences in stable trait extraversion, conscientiousness, neuroticism, and agreeableness explained 29.5%, 27.1%, 26.8%, and 16.6% of the genetic variance in life satisfaction set-point scores, respectively (with genetic and environmental variance in personality traits accounting for 20% of total variance in life satisfaction). For the middle cohort (age range 17–23), genetic differences in stable trait neuroticism, conscientiousness, extraversion, and agreeableness explained 28.8%, 28.3%, 23.1%, and 12.5% of the genetic variance in life satisfaction set-point scores, respectively (with genetic and environmental variance in personality traits accounting for 24% of total variance in life satisfaction). Additionally, openness was genetically linked in this group, but only explained 7.3% of the genetic variance in life satisfaction. In the oldest cohort (age range 23–29), genetic differences in stable trait neuroticism, extraversion, conscientiousness, and agreeableness explained 12.4%, 13.0%, 5.4%, and 4.1% of the genetic variance in life satisfaction set-point scores, respectively. Genetic differences in personality traits accounted for 35% of the genetic variance in life satisfaction in this group, leaving 65% of genetic variance unexplained. Genetic and environmental variance in personality traits accounted for 22.2% of the total variance in life satisfaction in this group.
The environmental variance overlap between life satisfaction and personality traits was only marginal in our data, leaving more than 80% of environmental variance unique to life satisfaction in the context of our analyses, and therefore unexplained by environmental differences in personality. See Figure 2 and Figure A3 for an overview on the results based on initial as well as stable trait and set-point scores.
Sensitivity analyses
In addition to our original analyses, we ran a number of sensitivity analyses following suggestions during the review process. Although we can assume partial scalar and partial strict MI between the SWLS and SWLS-C (see Tables A10, A11, and A12), it is possible that the partial measurement non-invariance influenced our results. Since we did not compare mean levels, but associations between variables, metric MI could be considered sufficient (Putnick & Bornstein, 2016). To test whether the partial non-invariance on scalar and strict level meaningfully influenced our results, we conducted sensitivity analyses with life satisfaction scores from a reduced three-item model, for which full strict MI could be assumed (following Cheung & Rensvold, 1998; see Table A12). The resulting scores showed a strong coherence with those from the full five-item model (
Another addition concerns the analysis of nuances in personality traits at item level (following Mõttus et al., 2024; Mõttus et al., 2017). The short-scale measure for Big Five personality traits that was used (BFI-S; Gerlitz & Schupp, 2005) measures personality domains with only three items per domain (in case of openness: four items). Although such measurements inevitably exhibit low internal consistency, and one could argue that this is desirable and necessary when attempting to capture broad personality domains with only a few items, estimates of
Our analysis of personality nuances produced very similar results to the aggregated personality trait scores. We investigated two variants of personality nuances, parallel to our main analyses: Initial first-wave nuances from the first measurement, and six-year stable personality nuances derived from a structural equation model (see Table A16). Here, we focus our description on the latter. All stable nuances unequivocally pointed into the same direction as the aggregated traits within which they are subsumed. Zero-order correlations of life satisfaction with personality nuances were comparable to those with personality trait domains (see Table A21). In multivariate Cholesky models based on personality nuances (see Table A35), the overlap with life satisfaction was again very similar to the overlap between personality trait domains and life satisfaction. The association was primarily driven by genetic factors. Stable nuances of extraversion and neuroticism were the main predictors (accounting for 29% and 26% of the genetic overlap, respectively), along with stable nuances of openness, agreeableness, and conscientiousness (accounting for 16%, 16%, and 13% of the genetic overlap, respectively). The most important stable nuances were talkativeness (an extraversion nuance), nervousness (a neuroticism nuance), and thoroughness (a conscientiousness nuance). No unique genetic variance remained in life satisfaction, which means that all meaningful proportions of it were explained by genetic variance in personality nuances (see Table A35). Results for the nuances measured in the first wave broadly mirrored the general pattern of the six-year stable nuances (see Table A34).
Study 2: Polygenic associations between personality and SWB in TwinSNPs
In the second study based on genotype data from families of the TwinSNPs study, including non-twin siblings and parents, we aimed at examining the links between personality traits and SWB using PGSs. In line with previous molecular genetic findings (Baselmans, van de Weijer, et al., 2019; Okbay et al., 2016; Weiss et al., 2016), we expected that PGSs for life satisfaction are significantly associated with PGSs for neuroticism (H3a) and extraversion (H3b). In line with previous twin study findings (Pelt et al., 2024; Sadiković et al., 2018; Weiss et al., 2008), we also expected significant associations with PGSs for conscientiousness (H3c). We further extended previous research by examining whether patterns in PGS–phenotype links across personality traits and SWB measures are consistent across age groups.
Methods
Data
Genotype Sample Description.
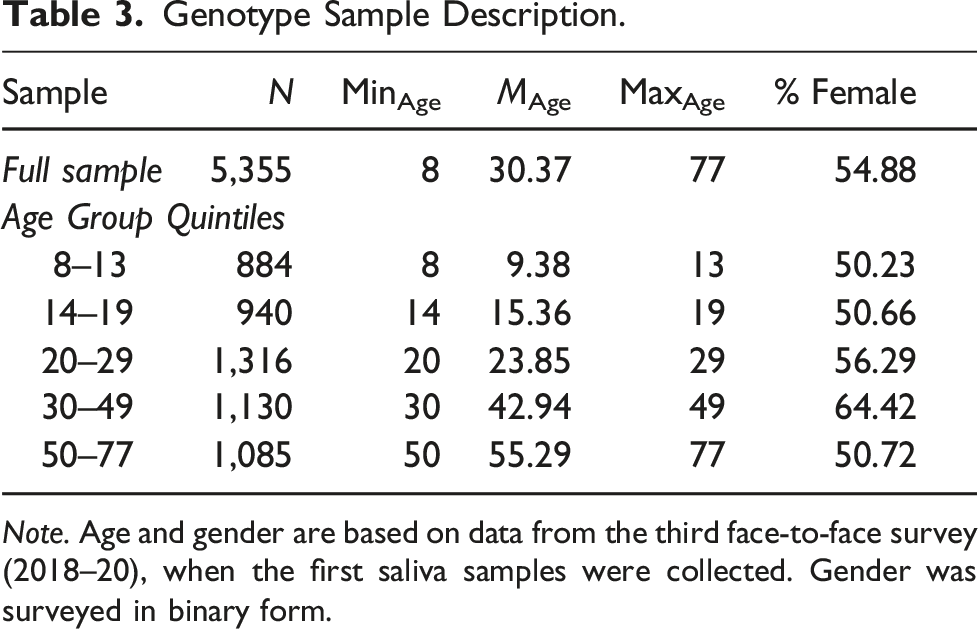
Note. Age and gender are based on data from the third face-to-face survey (2018–20), when the first saliva samples were collected. Gender was surveyed in binary form.
Measures
A detailed description of sampling, genotyping, quality control, filtering and PGS calculation is provided in Supplement B-I. Briefly, common variants in samples of sufficient quality were imputed to the 1000 Genomes Project reference panel data (Phase 3; Fairley et al., 2020). Genetic sex checks, relatedness checks, and a population substructure analysis were performed to remove sex/gender and family mismatches, correct reported zygosity data and to limit the analysis to a subsample matching the ancestry profile of the discovery GWASs. PGS data are available from the authors upon request, on condition that a valid data transfer agreement is concluded.
PGSs were computed using PRS-CS (auto-model), a Bayesian regression method applying continuous shrinkage priors to the SNP effects (Ge et al., 2019) derived from GWAS summary statistics (for details on PGS calculation, see Supplement B-I). For the present study, the summary statistics were obtained from Baselmans, Jansen, et al. (2019) and Becker et al. (2021) to generate PGSs for the SWB facets life satisfaction and positive affect, and a general SWB PGS. Summary statistics from de Moor et al. (2012) and Gupta et al. (2024) were used to generate two sets of PGSs for personality traits (see Table B1). For personality PGSs, Anderson-Rubin scores were extracted from EFA (DiStefano et al., 2009) to generate orthogonal scores that are not intercorrelated. To achieve this, the number of factors was forced to the number of PGSs (i.e., two sets of five; see Table B5 for details). Accordingly, EFA was based on the principal axis method using varimax rotation, which was used to maximize explained variance in the expectation of an orthogonal factor structure (Kaiser, 1958). PGSs were adjusted for effects from gender and the first ten genetic principal components. We employed p‑value correction following Benjamini and Hochberg (1995) to deflate the possible increase of Type I or α errors from multiple testing, but also reported uncorrected p‑values in light of a reciprocal increase of Type II or β errors by p‑value correction where little explanatory power is to be expected (Barnett et al., 2022), as is still the case with PGS prediction of complex behavioral traits.
Analyses
The study followed a three-step analysis plan: (1) Correlations between SWB and personality PGSs were examined. (2) Genotype-genotype associations were tested considering SWB and personality PGSs in multivariate linear regression models. Effect sizes and explained variance informed about the relationship between SWB and personality PGSs. (3) PGS→phenotype predictions were examined for life satisfaction and personality trait scores from latent state-trait models (Steyer et al., 2012). To test these associations, linear regressions from latent trait scores on PGSs were added to the models. In addition, age groups were compared analogous to Study 1, to detect potential differences across the early lifespan, along with continuous age moderation models. At least partial strict MI could be assumed for phenotypic measures across panel waves and across age groups (see Tables B10 and B11). Since we focused on correlations between variables, metric MI could be considered sufficient (Putnick & Bornstein, 2016). Equivalent to the twin study, we nevertheless performed sensitivity analyses using a reduced three-item model for life satisfaction phenotypes for which full strict MI could be assumed (following Cheung & Rensvold, 1998; see Tables B7 and B11).
Results
Overall, correlations between personality and well-being PGSs were small to moderate. Neuroticism PGSs showed the highest correlations with well-being PGSs, which were consistently negative and statistically significant across all measures. This association was most pronounced in neuroticism PGSs based on the Gupta et al. (2024) GWAS, with
Multivariate associations between well-being and personality PGSs showed similar patterns. All well-being PGSs were primarily predicted by neuroticism PGSs ( Genotype-genotype prediction of well-being PGSs by personality PGSs. Note. F = F-Statistic; Adj. R2 = Adjusted R2; β = Standardized regression estimates. All models with 5,349 degrees of freedom, based on N = 5,355. Whiskers represent 95% confidence intervals. Statistically insignificant parameters with p > .05 in greyscale.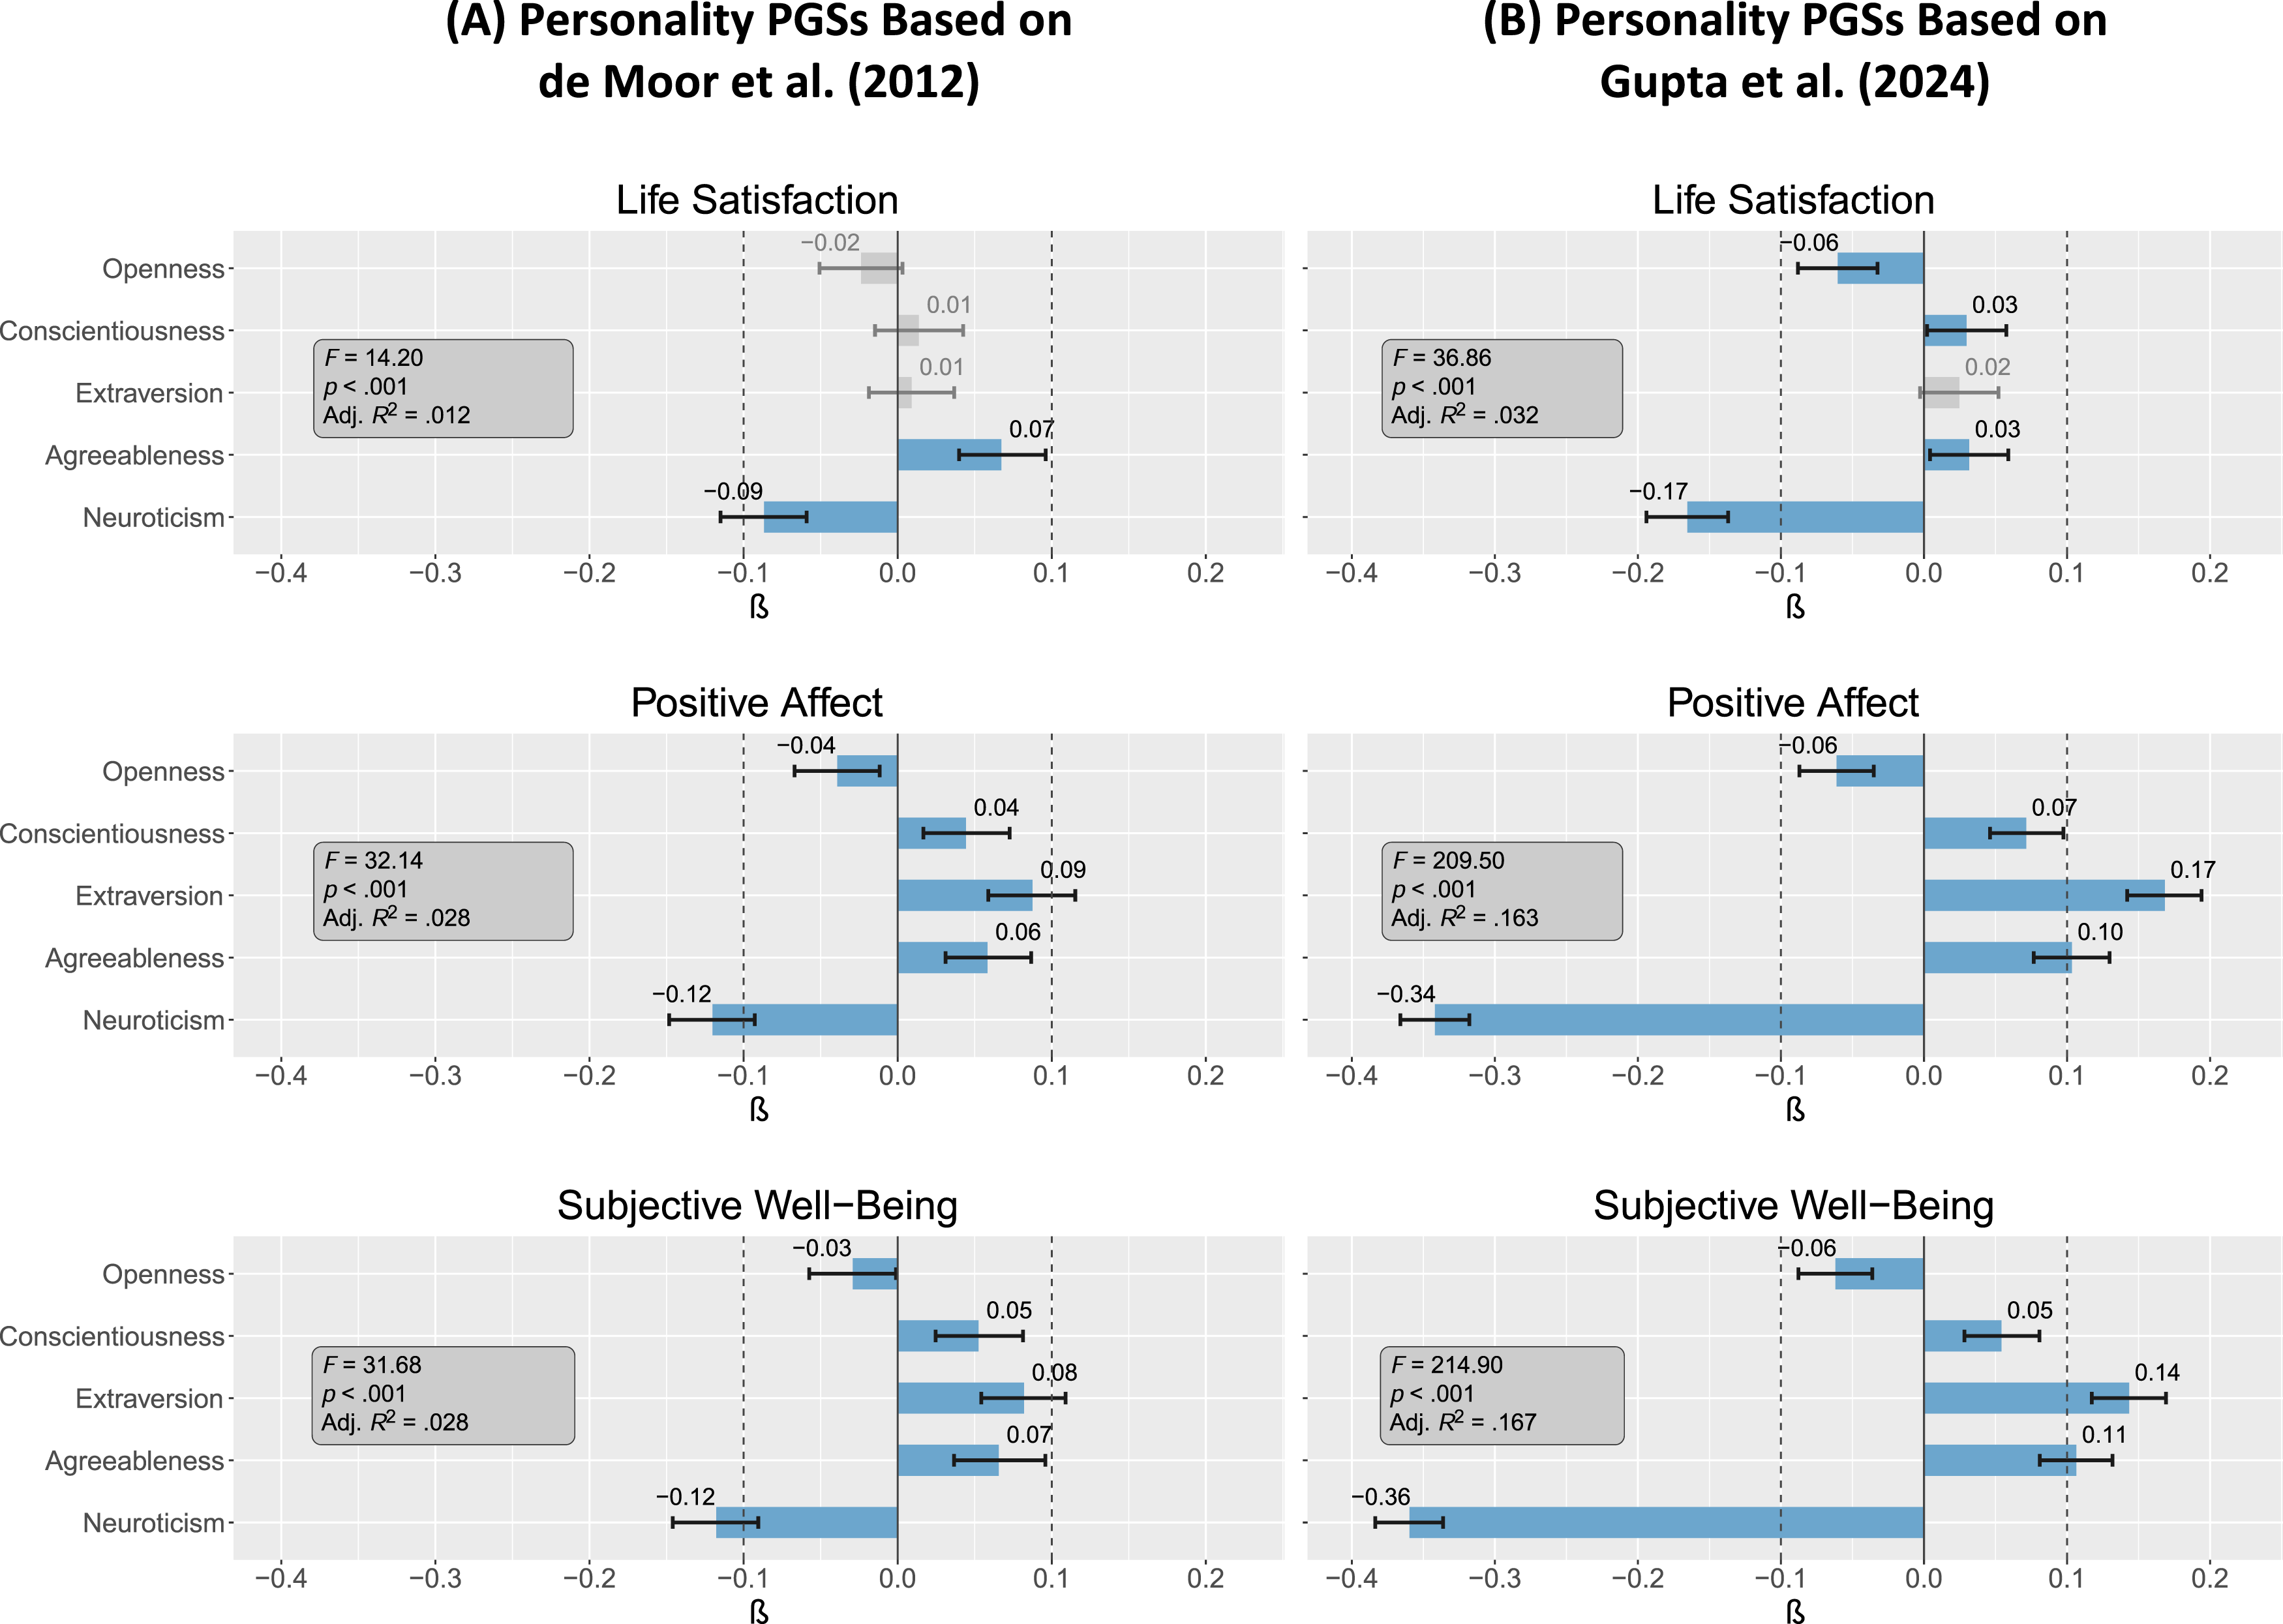
For genotype-phenotype predictions, the latent state-trait models showed acceptable fit to the data in the full sample (
When switching response variables (i.e., the prediction of personality trait phenotypes by well-being PGSs), the only significant associations were found for positive affect and SWB PGSs with neuroticism ( Genotype-phenotype prediction in the full sample. Note. O = Openness; C = Conscientiousness; E = Extraversion; A = Agreeableness; N = Neuroticism. Estimates represent standardized regression coefficients from regression paths within structural equation models. Light green/light red/light gray bars denote statistically insignificant coefficients with p > .05. Whiskers represent 95% confidence intervals.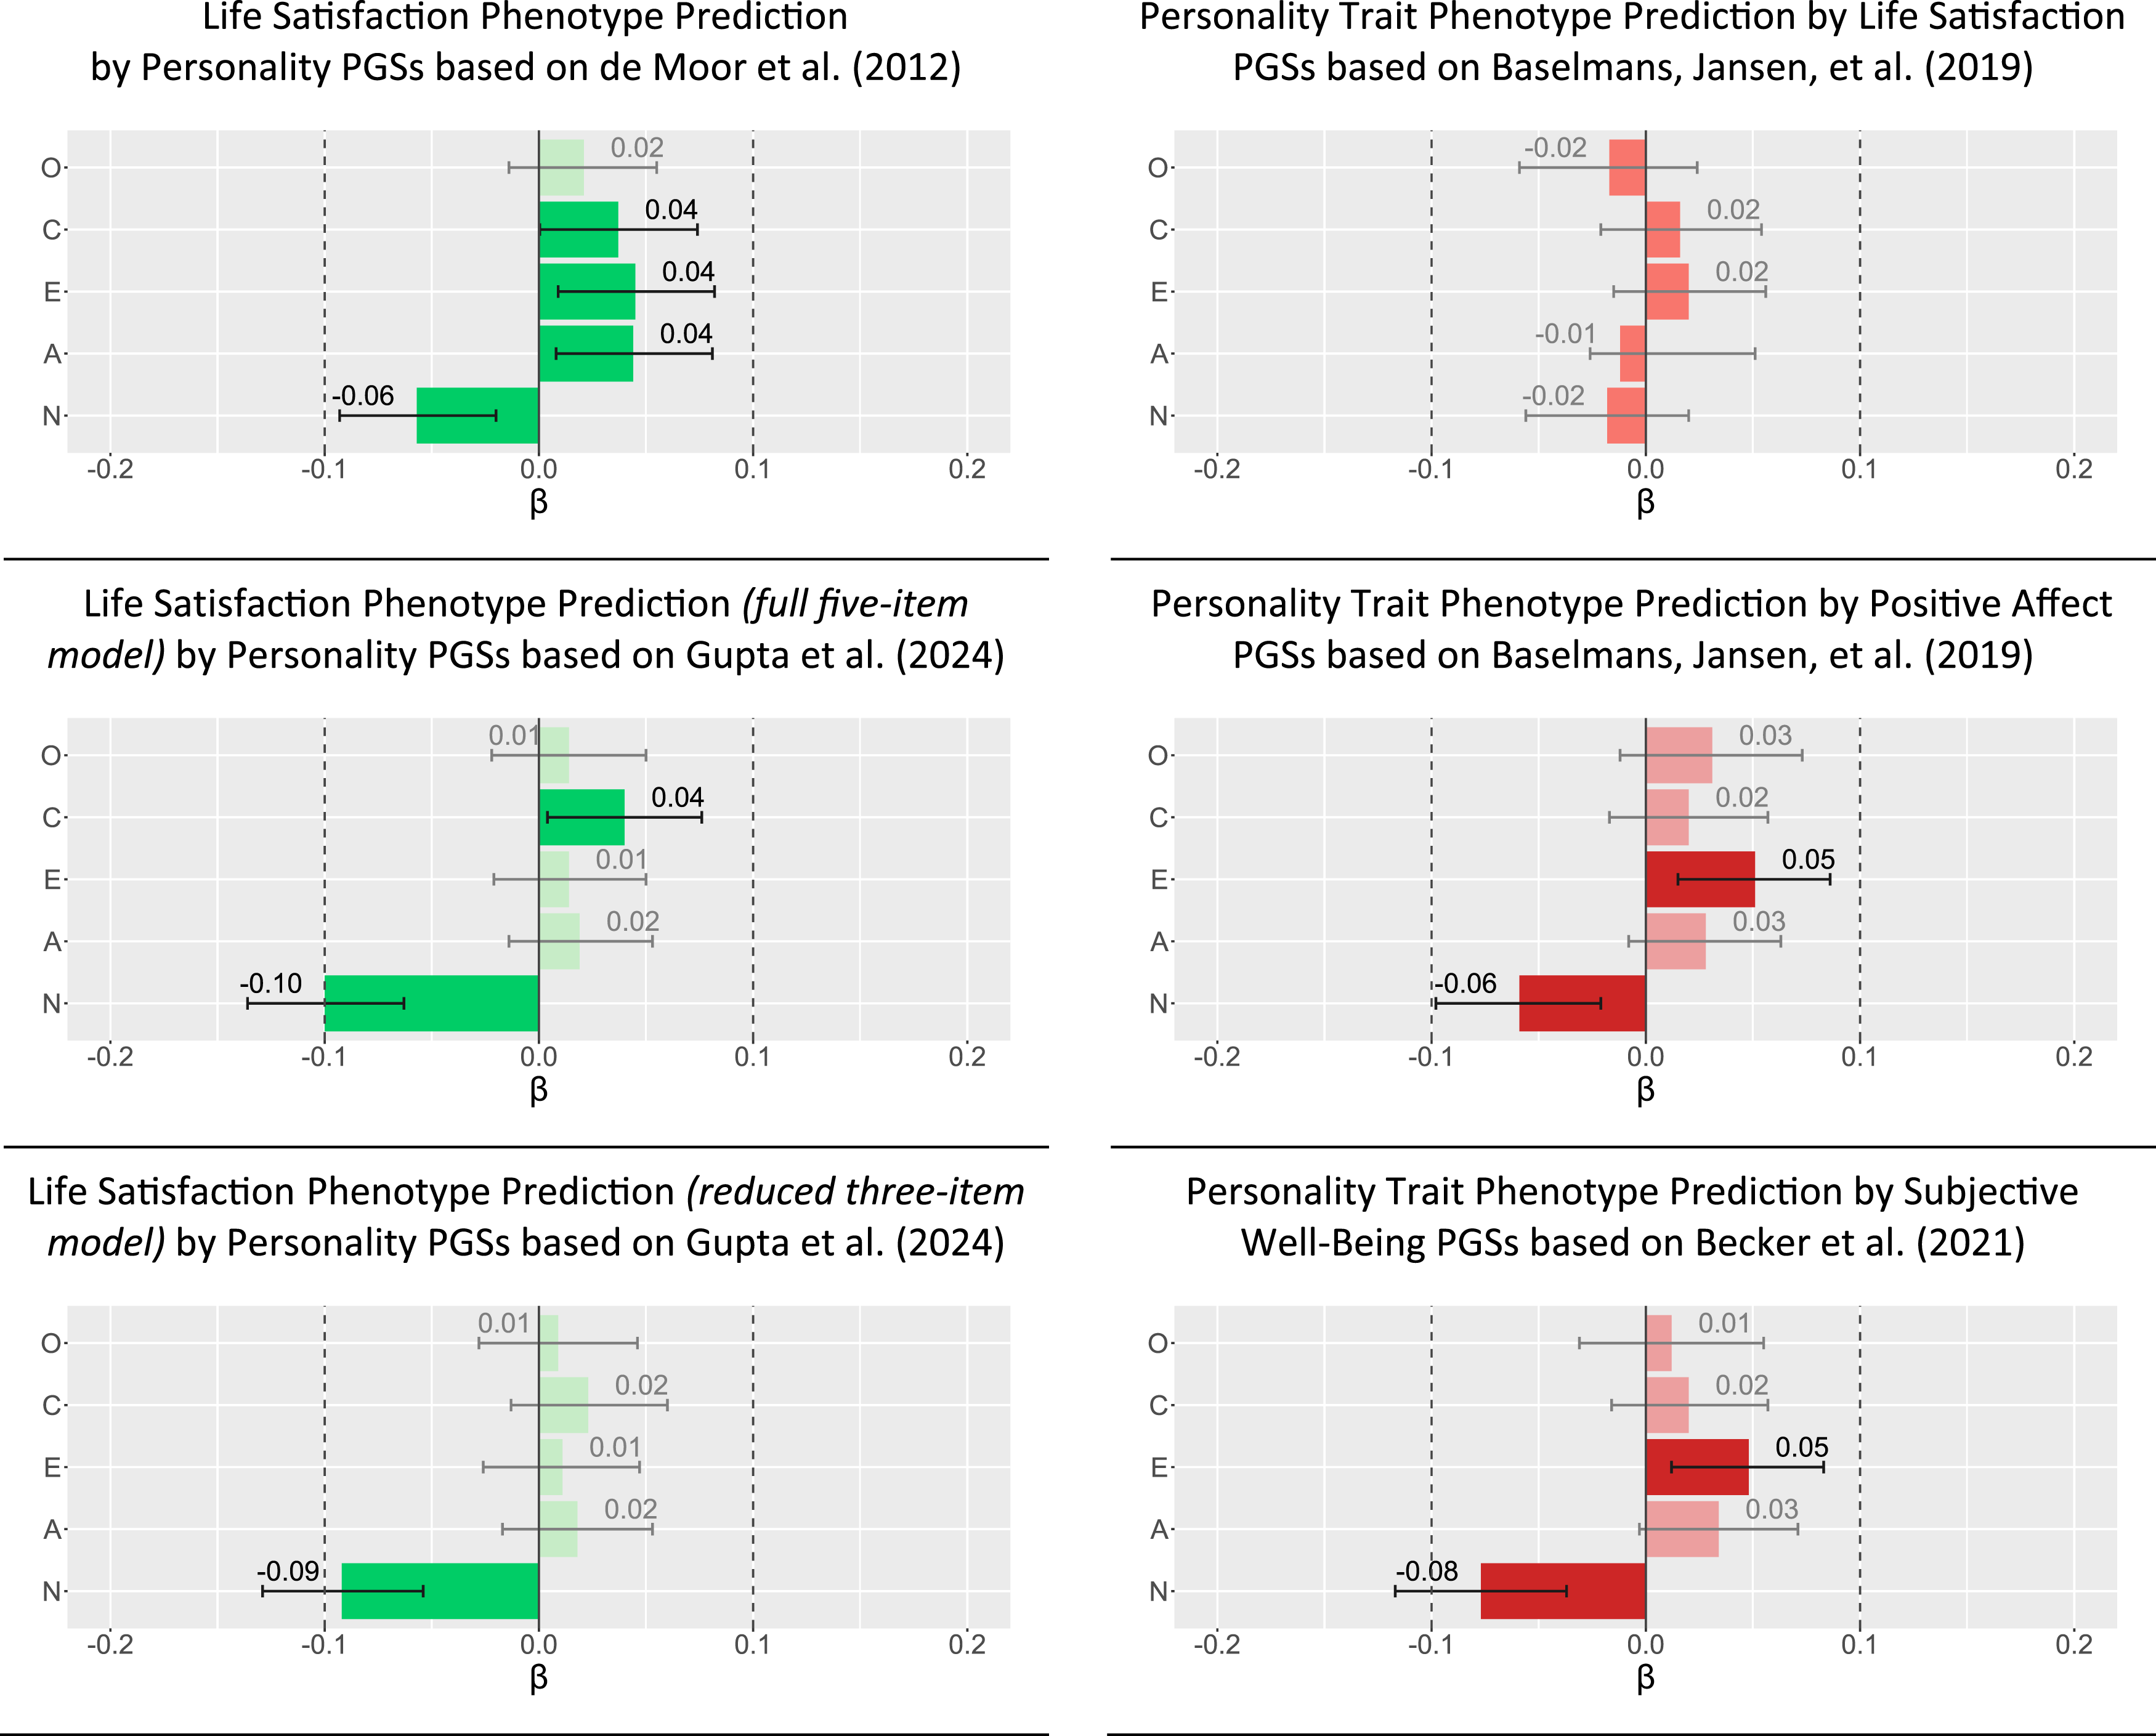
Joint discussion
With neuroticism, extraversion, conscientiousness, and agreeableness as robust personality predictors in the CTD, we found strong genetic links between personality domains and life satisfaction. Polygenic associations of different facets of SWB with personality traits showed similar patterns. However, personality–SWB links and respective sources varied across age groups in the twin study results. Openness was only linked to SWB in younger age groups, and further but inconsistent age differences in the personality–SWB links appeared in molecular genetic analyses.
Genetic variance in personality explains genetic variance in life satisfaction
In line with Weiss et al. (2008), Hahn et al. (2013), Røysamb et al. (2018), Sadiković et al. (2018), and Pelt et al. (2024), our findings point to neuroticism and extraversion as the most robust personality mediators of genetic variance in SWB set-points, while openness was largely unrelated. Our study adds to the former studies by focusing on the links between six-year stable personality traits and life satisfaction set-points. The observed pattern therefore seems to replicate across different WEIRD (Western, educated, industrialized, rich, and democratic) countries, samples, and measurement occasions. This supports a genetic top-down structure of SWB, in which more generalized (core) personality traits are directly associated with well-being measures.
Our results underline the importance of the analytic differentiation from factorially independent personality trait scores, because intercorrelated personality measures (factor scores and PGSs) could have led to biased links between personality characteristics. For instance, correlations between neuroticism, agreeableness, and conscientiousness might lead to an over- or underestimation of each dimension’s role towards SWB if factorial interdependence of theoretically independent personality domains is not accounted for. Intuitive associations of neuroticism and extraversion emerged, which include facets directly related to well-being (e.g., positive affectivity as part of extraversion; anxiety and depression symptoms as part of neuroticism; McCrae & Costa, 1991; Soto & John, 2016). Along with conscientiousness and agreeableness, a high to complete genetic overlap between personality and life satisfaction was observed. Conversely, environmental sources of variance were found to be largely unique to personality and life satisfaction in the context of our analyses. This finding is similar to the results from previous research (Pelt et al., 2024; Røysamb et al., 2018; Weiss et al., 2008). However, it should also be noted that a certain proportion of the unshared variance is due to measurement error. Thus, environmental influences seem to act largely differentially upon personality traits and life satisfaction characteristics and should be the object of dedicated research. For example, individual health trajectories might mediate environmental variance in life satisfaction or moderate its expression (Diener & Chan, 2011; Mroczek et al., 2020). Socio-economic status and possibly associated differences in job security or daily hassles in the workplace may play a role (Gottschling et al., 2019; Kesebir & Diener, 2008). Varying partnership trajectories and perceived relationship or friendship network quality are other plausible mediators of environmental differences (Lucas & Dyrenforth, 2006; Stern et al., 2024). In future studies, variables like these may be implemented in a multivariate genetically informative framework like the one we employed here to identify potential sources of variance and mediations. Likewise, they could be used in the analysis of gene-environment interaction (Purcell, 2002) to investigate their potential role in moderating genetic influences and other environmental factors on the links between personality and subjective well-being.
Polygenic associations largely mirror twin study findings
Links between personality and well-being PGSs mirrored the main twin study findings: Neuroticism showed the most robust associations with well-being PGSs. Links of polygenic indices for extraversion were prominent as well. Associations with conscientiousness were only pronounced in PGS–PGS correlations and did not show reliable associations in phenotype prediction, while openness was again only marginally associated with SWB. In genotype-phenotype prediction, neuroticism and extraversion PGSs showed the strongest associations with life satisfaction set-points. Despite some differences in results concerning the other personality PGSs, the pattern with neuroticism and extraversion PGSs as the strongest predictors and openness as the weakest one replicates across both twin study and molecular genetic results. Thus, we see cross-methodological evidence for the pattern of genetic personality–SWB links.
While showing comparable patterns in sum, PGS associations between personality and well-being were generally low when considering personality PGSs based on the relatively dated de Moor et al. (2012) GWAS, with a maximum of 2.8% and < 1% of variance explained in many of the considered constellations. Different from previous results (e.g., Weiss et al., 2016), we did find small but statistically significant associations between well-being measures and personality PGSs based on de Moor et al. (2012). When considering personality PGSs based on the more recent Gupta et al. (2024) GWAS, variance explanation in well-being PGSs increased up to 16.7%. This increase might be partly due to the increased sample overlap between the Gupta et al. (2024) GWAS with the Baselmans, Jansen, et al. (2019) and Becker et al. (2021) GWASs. All three analyzed UK Biobank data, among others, while de Moor et al. (2012) did not. Phenotype prediction from PGSs was still low and remained < 3%. Twin study estimates were much higher: About 18% to 23% of total variance (compared to < 3%) and about 50% to 100% (compared to a maximum of 16.7%) of the genetic variance in life satisfaction was explained by genetic differences in personality traits. This was much larger compared to the predictive power from personality PGSs regarding life satisfaction PGSs or life satisfaction phenotypes, a phenomenon discussed as the missing heritability problem (Matthews & Turkheimer, 2022). This term describes the large differences in heritability estimates between twin studies and current molecular genetic studies. These can stem from the limitations inherent to PGS and twin study methodologies, which might result in an under- or overestimation of genetic effects, respectively. Both are discussed further in the limitations section. In sum, while PGSs can mirror overall patterns found in twin studies, we still see wide power margins from current polygenic predictors.
Age differences in the role of personality domains for well-being
Associations between personality traits and SWB varied across age groups in the twin study. Based on the CTD, extraversion was not genetically linked to initial first-wave life satisfaction in the youngest cohort (born 2003/04;
In the molecular genetic findings, only minor age differences emerged, but there were no systematic patterns between the different PGS predictors or between the PGS and the twin study. The age differences that were found in the twin study, however, could point to genetic variance associated with personality traits to be differentially relevant for life satisfaction throughout the lifespan. For example, genetic variance in conscientiousness showed stronger associations with genetic variance in life satisfaction set-points in the two younger cohort groups. This might mean that genetic loci associated with conscientiousness could be differentially relevant across the lifespan. For instance, conscientiousness facets of achievement-striving and diligence might be especially relevant in formative educational and professional life stages for achieving outcomes positively associated with SWB.
All in all, neuroticism showed the strongest and most robust associations across age cohorts and studies, while openness was unrelated in most (but not all) of the considered constellations. The level of emotional stability therefore seems to be most relevant for overall SWB levels across all ages. At that, neuroticism appears as a constant and significant lifetime predictor of genetic set-point differences in SWB, while other personality characteristics might play mutable roles throughout the lifespan.
Strengths and limitations
The studies at hand provide further evidence towards a growing body of research regarding personality–SWB associations. Our twin study analysis of six-year stable trait scores further adds evidence for younger, less studied ages thus far. Results underscore previous findings and extend them with an examination of age cohort differences. These shed light on some differences across age, whereby we followed recent suggestions on the inclusion of PGSs in the analysis of longitudinal data (Allegrini et al., 2022), although we could not directly disentangle age from birth cohort effects.
While study 2 compared PGS-based associations between personality traits and different well-being facets, as a phenotypic measure, we had to rely on life satisfaction. Thus, the examined associations do not cover all SWB components. Links between personality traits and other facets might manifest differently. It also has to be noted that PGSs have inherent limitations (e.g., biases introduced by ethnicity, social and geographical stratification, and gene-environment interplay), which kept us from referring to them as indicators of “genetic propensity”, and had us rather describe them as polygenic “estimates” (following suggestions of Burt, 2023 and subsequent peer commentary).
This links to the previously mentioned heritability gap (Kandler & Instinske, 2025; Matthews & Turkheimer, 2022), which describes the rather strong differences between polygenic and twin study estimation of genetic effects. On the one hand, this might be due to an underestimation of genetic effects from current polygenic methods. On the other hand, this might be due to an overestimation of genetic effects from the CTD. We elaborate on both in the following paragraphs.
GWASs are systematic molecular genetic studies that typically require very large sample sizes to uncover polygenic associations with complex psychological traits. They are based on regressions of phenotype characteristics on many genetic SNPs, and cannot account for the influences of rare genetic variants, copy number variants, epigenetic modifications, or non-additive genetic effects (Matthews & Turkheimer, 2022; Burt, 2023). The latter might be especially relevant here, as our results on twin correlations and from univariate twin models have shown. The legacy GWAS by de Moor et al. (2012) might have been considerably limited regarding sample size, with N = 17,375 and only two found loci with genome-wide significance. While the personality GWAS based on Gupta et al. (2024) had a considerably larger sample size with N = 237,390 to 682,688 and 234 loci with genome-wide significance, its explanatory power towards personality and life satisfaction phenotypes was still very low. More recent developments in personality trait GWASs promise stronger variance explanation in Big Five personality traits, for example, the recent preprint by Schwaba et al. (2025; N = 611,000 to 1,140,000 and 1257 loci with genome-wide significance), for which the summary statistics were not yet publicly available by the time of our analyses. Such increased sample sizes and increased numbers of identified genetic loci might (but do not necessarily) translate into further increases in explanatory power. Future studies should therefore elucidate whether ongoing GWAS developments offer increases in the explanatory power of the Big Five and, by extension, of subjective well-being.
The CTD can only estimate either shared environmental or non-additive genetic effects. However, if both factors play a role, additive genetic effects would be overestimated in the twin model. As a consequence, some of the genetic overlap between personality traits and well-being measures could reflect common environmental factors shared by twins reared together. The CTD also comes with some further limitations stemming from its necessary assumptions. Most prominently, CTDs assume an absence of gene-environment interplay, such as gene-environment correlation (rGE) and gene-environment interaction (GxE). These assumptions rarely hold and might lead to biased estimations of genetic effects, if present (Kandler et al., 2019). Active or evocative rGE (i.e., seeking out environments or receiving reactions from environments that fit heritable characteristics) and AxC interaction effects would be confounded with estimates of A effects in ACE models (Briley et al., 2018; Purcell, 2002). It is plausible that either of these mechanisms could influence both personality and subjective well-being and contribute to their association. For example, a genetic influence on comparatively high neuroticism might elicit more negative environmental reactions, leading to lower subjective well-being (evocative rGE). Individuals with a genetic influence on comparatively high extraversion might actively seek out larger, more active, or more stimulating friendship networks, leading to higher subjective well-being (active rGE). Parental demands shared by twins might positively accentuate genetic influences on conscientiousness, which can lead to increases in subjective well-being via educational or career trajectories (AxC interaction). Furthermore, passive rGE would be confounded with C estimates, while AxE interactions would be confounded with E estimates. While our results suggested no evidence for passive rGE in personality traits, since C was negligible, AxE interaction effects could underly the small environmental links between personality traits and life satisfaction. The presence of rGE and GxE effects, the latter of which are not confounded with PGSs, can act differently across the lifespan which could account for some of the observed age group differences. Particularly, the GxE interactions between genetic effects and environmental influences shared between twins reared together, if present, are confounded with estimates of genetic effects. These are comparatively likely in our highly educated and relatively affluent sample. Taken together, these factors might account to some degree for the large gap in explained variance between the twin study and PGS study results.
The BFI-S, which was used for phenotypic measurement of personality, is a very short measure to capture broad personality trait dimensions. Consequently, it shows low internal consistency estimates deemed unacceptable by some standards (i.e.,
As one of the first studies to incorporate all Big Five personality traits in quantitative genetic and molecular genetic designs to uncover age differences in associations between personality and SWB, our results showed that genetic variance in personality traits can be differentially important across the lifespan to explain variance in SWB levels. Although the main association patterns were consistent across both twin study and PGS results, common patterns of age differences did not show up between studies. This could in part be due to the different age ranges in both studies or due to the described power limitations of PGSs. Nonetheless, future studies could further focus on age differences in genetic variance in personality explaining well-being, as this might point towards systematic differences across the lifespan. Another approach could be to investigate differences in the explained variance between twin studies and molecular genetic designs, taking the limitations of both into account. Future studies could investigate to what extent CTD limitations lead to an overestimation of genetic variance (e.g., by elucidating biases from gene-environment interaction effects) or whether future developments in molecular genetic methodology can correct for a possible underestimation of genetic variance from polygenic information (e.g., increases in sample size and discovery of influences from previously unidentified loci, whole-genome sequencing including rare variants, longitudinal phenotyping, or improved epistasis modeling; Tang et al., 2023). Taken together, these approaches might be able to reduce the heritability gap (Kandler & Instinske, 2025; Matthews & Turkheimer, 2022).
Outlook and conclusion
Our studies provide evidence that genetic differences in well-being are linked to genetic differences in basic personality traits. Association patterns replicate across quantitative and molecular genetic approaches, particularly underscoring the robust link between neuroticism and SWB. Established twin study results on the genetic links between personality traits and well-being could be mirrored based on molecular genetic information. Significant age differences in phenotypic and genetic links between personality traits and well-being were found, with openness, extraversion, and conscientiousness showing the most pronounced age group differences.
As GWASs increase in sample size and precision, a more accurate detection of genetic variants relevant for complex behavioral traits might become possible. Personality PGSs based on forthcoming GWASs might thus yield increases in explanatory power regarding genetic set-points in SWB. Our study has shown that age differences should be considered in the investigation of genetic personality–SWB links. With most of the environmental influences on personality and SWB unique to each construct, the environmental personality–SWB link was estimated as small, but might be meaningful nonetheless, and could also be focused with respect to different age-dependent context variables in future studies.
After all, the observed associations might manifest through differences in personality-driven behavior. Future research could shed light on this by examining possible mediators between personality and SWB (e.g., educational, professional, and health behaviors). Examining other potential mediators, such as experiences related to educational and professional attainment, social inclusion, or susceptibility to external influences, could further enhance our understanding of the associations between personality and SWB. One aim of future research could therefore be to investigate which tangible individual behaviors, choices, and situations (e.g., life stages or environments) might facilitate the found associations between personality domains and well-being (Kandler et al., 2024). In sum, we conclude from our results that well-being is indeed a personality thing (Weiss et al., 2008), at least on the basis of genetic associations, and one that can have different meanings across developmental phases and contexts over the lifespan.
Supplemental Material
Supplemental Material A - Personality and well-being are genetically associated: Extending previous twin and molecular genetic studies
Supplemental Material for “Personality and well-being are genetically associated: Extending previous twin and molecular genetic studies” by Marco Deppe, Charlotte Katharina Louise Dißelkamp, Carlo Maj, Rana Aldisi, Markus Nöthen, Martin Diewald, Frank Michael Spinath, Andreas Josef Forstner and Christian Kandler in European Journal of Personality.
Supplemental Material
Supplemental Material B - Personality and well-being are genetically associated: Extending previous twin and molecular genetic studies
Supplemental Material for “Personality and well-being are genetically associated: Extending previous twin and molecular genetic studies” by Marco Deppe, Charlotte Katharina Louise Dißelkamp, Carlo Maj, Rana Aldisi, Markus Nöthen, Martin Diewald, Frank Michael Spinath, Andreas Josef Forstner and Christian Kandler in European Journal of Personality.
Footnotes
Author contributions
Deppe, Marco, Project administration, conceptualization, methodology, data curation (panel data), software, formal analysis, investigation, validation, visualization, writing – original draft, writing – review & editing. Pahnke, Charlotte Katharina Louise, Conceptualization, methodology, data curation (polygenic scores), software, formal analysis, investigation, writing – review & editing. Maj, Carlo, Data curation (genotype data), resources, methodology, software, formal analysis, investigation, validation, writing – review & editing. Aldisi, Rana, Data curation (genotype data), resources, methodology, software, formal analysis. Nöthen, Markus, Supervision, resources, funding acquisition. Diewald, Martin, Resources, funding acquisition. Spinath, Frank Michael, Resources, funding acquisition. Forstner, Andreas Josef, Supervision, resources, writing – review & editing. Kandler, Christian, Project administration, conceptualization, methodology, supervision, resources, funding acquisition, writing – review & editing
Declaration of conflicting interests
The authors declared no potential conflicts of interest with respect to the research, authorship, and/or publication of this article.
Funding
The authors disclosed receipt of the following financial support for the research, authorship, and/or publication of this article: Positions of involved researchers, the TwinLife project, and molecular genetic analyses are kindly funded by the German Research Foundation (DFG; funding no. 458609264 for the position of M. Deppe, funding no. 428902522 for the position of C. Pahnke and molecular genetic analyses within the TwinSNPs project, funding no. 220286500 for the TwinLife project).
Open science statement
The phenotype data analyzed in this article are freely available and can be accessed on request via a simple online form at https://search.gesis.org/research_data/ZA6701. Polygenic score data from molecular genetic analyses can currently only be shared with collaboration partners via a valid data transfer agreement, due to data protection laws. The study materials used for this article can be accessed at https://www.twin-life.de/documentation/downloads. ![]() We decided not to pre-register our analyses, as they mostly cover quasi-replications of previous empirical findings. Phenotype data are publicly available as TwinLife Scientific Use File v8.0.0 (https://doi.org/10.4232/1.14331). Materials such as questionnaires are provided with the Scientific Use File(s). Supplemental material and syntax files for statistical software are openly shared via the Open Science Framework: https://doi.org/10.17605/OSF.IO/NQH26.
We decided not to pre-register our analyses, as they mostly cover quasi-replications of previous empirical findings. Phenotype data are publicly available as TwinLife Scientific Use File v8.0.0 (https://doi.org/10.4232/1.14331). Materials such as questionnaires are provided with the Scientific Use File(s). Supplemental material and syntax files for statistical software are openly shared via the Open Science Framework: https://doi.org/10.17605/OSF.IO/NQH26.
Supplemental Material
Supplemental material for this article is available online.