
Abstract
Changes in personality traits are not unusual, and common mental disorders (CMDs) may play a role. In a large population sample of 55,056 individuals, we examined associations of CMDs recorded in a national registry over 17 years (2004–2021) with self- and informant-rated Big Five personality traits (assessed once in 2021–2022). Besides comparing diagnosed and undiagnosed individuals, we considered the number and timing of CMD records. Those diagnosed with CMDs during the 17-year period differed from undiagnosed individuals by about 0.50 SDs higher neuroticism and slightly higher openness. For neuroticism, the difference was greater for those with more recent and numerous diagnoses, whereas for openness, the association did not depend on the number or timing of diagnoses. These findings suggest increased neuroticism in response to mental health issues, which may take over a decade to gradually return to baseline, and that less open people may be less likely to seek mental health help. We also found evidence of temporary decreases in extraversion and conscientiousness in response to depressive disorders. Findings were similar in self- and informant-ratings, suggesting they were not assessment artefacts. Our findings are consistent with small personality trait changes in response to mental disorders that gradually fade over several years.
Plain language summary
Why was the study done? Personality traits usually stay fairly stable but they can shift over time. Given that common mental health conditions (anxiety disorders, depressive disorders, and alcohol use disorder) affect a large number of people worldwide, we sought to understand the associations between these conditions and personality traits, and whether these associations depend on how many diagnoses they had and how long it had been since their last diagnosis. What we did: We studied over 55,000 individuals whose mental health records had been collected over 17 years in a national registry. We also asked the participants themselves and people who knew them well (such as a family member or a friend) to rate their personality traits. What we found: Those diagnosed with common mental disorders were noticeablely more neurostic than people without any diagnosis, especially among those with more recent diagnoses or multiple diagnoses over time. In particular, people with depressive disorders also tended to be less extraverted and conscientious for a time. These findings were simialr whether people rated themselves or others rated them, suggesting they were reliable. **What this means: **Common mental disorders may contribute to long-term changes in personality traits that tend to last for years but often fade, with people returning to their typical levels over time.
Keywords
Individuals’ personality trait differences are often summarized with the Big Five personality trait domains of neuroticism, extraversion, conscientiousness, agreeableness, and openness (Goldberg, 1990) using self-report questionnaires. Whereas personality traits were originally thought to remain mostly stable after age 30 years (McCrae & Costa, 2003), later meta-analyses have shown changes throughout the lifespan in traits’ mean levels and individuals’ relative trait standings (e.g. Bleidorn et al., 2022). For example, if a group of people were provided feedback on their trait scores (low, medium, or high), about every third individual would receive a different result when re-assessed in a few years (Mõttus, 2022). Although many of the changes revert, others persist for at least some time (Roemer et al., 2025). The causes of these changes, however, have remained elusive (Bleidorn et al., 2020; Bühler et al., 2024). As nearly a billion people worldwide experience diagnosable mental health issues (GBD 2019 Mental Disorders Collaborators, 2022), with anxiety disorders, depressive disorders, and alcohol use disorder (AUD) often grouped as common mental disorders (CMDs) (e.g. Kotov et al., 2010; Ormel et al., 2013; Steel et al., 2014), it is important to explore whether experiencing CMDs may relate to personality traits and their changes, and how long the associations last.
Temporal scales of trait change
Personality traits can change along various timescales. Many personality psychologists view traits as individual differences in the average distributions of momentary states (e.g. Fleeson, 2001), which can fluctuate systematically depending on situational context but tend to cluster around an individual’s trait level over time (Fleeson & Jayawickreme, 2015); at the state level, then, individuals’ personalities can fluctuate greatly – even from moment to moment, within or across days (Fleeson & Gallagher, 2009; Sosnowska et al., 2020) – but tend towards their typical ‘attractor’ states that correspond to trait levels (DeYoung, 2015; Lewis, 2005). Such short-term state variations are normative and do not correspond to CMDs, which are conceptualized as conditions that develop gradually and/or need to persist for some time to be clinically recognized. At the other extreme, there might be permanent personality changes that happen either gradually or in response to sudden dramatic events (Bühler et al., 2024; Roberts et al., 2006). However, medium-term trait changes are also possible. In particular, the sociogenomic model of personality traits (Roberts, 2018) differentiates between medium-term ‘elastic’ trait change (e.g. 1–3 years) and semi- or fully permanent ‘pliable’ change. So, if personality traits respond to CMD-related processes, their changes could be either elastic or pliable.
Researchers sometimes refer to pathology-related trait change as ‘state’ and ‘scar’ effects, with the former lasting for a relatively short period and the latter lasting for much longer or even permanently (Klein et al., 2011; Ormel et al., 2013). Usually, however, these researchers do not specify the duration of trait change that marks the difference between the state and scar effects, or whether longer-term changes that revert after, say, several years count as scar effects or not. Moreover, in this parlance, the term ‘state’ refers to something more enduring than the fleeting, momentary fluctuations typically described in the personality literature (Fleeson, 2001). Here, thus, we will rely on the sociogenomic model of personality traits (Roberts, 2018) rather than the state-scare distinction because it articulates the different forms of trait change and differentiates between medium-term, or elastic, and long-term, or pliable, trait changes.
Associations between CMDs and personality traits
There is extensive evidence that those with a CMD history tend to score differently in personality traits than undiagnosed people (e.g. Barnes, 1979; Krueger et al., 1996; Malouff et al., 2005, 2007). In a comprehensive meta-analysis (Kotov et al., 2010), those with CMD diagnoses tended to score up to about 1.70 standard deviations (SDs) higher in neuroticism than undiagnosed people (mean d ≈ 1.72 for depressive and anxiety disorder diagnoses, d ≈ 0.80 for AUD diagnosis). Compared to undiagnosed people, individuals across the three diagnostic groups scored, on average, about one SD lower in conscientiousness and extraversion, whereas the associations for openness and agreeableness were much smaller and less consistent across the disorders. Broadly similar patterns have been confirmed in subsequent studies, although the associations have often been weaker (e.g. d ≈ 1.10, −0.85, and −0.52 for neuroticism, extraversion, and conscientiousness, respectively, and limited differences for the other domains, in relation to depression diagnosis; Jourdy & Petot, 2017; Hakulinen et al., 2015; Hell et al., 2022; Ho et al., 2022; Koorevaar et al., 2013; Spinhoven et al., 2013; Watson & Naragon-Gainey, 2014; Weber et al., 2012).
Existing evidence that CMDs contribute to trait change
The associations between CMD and personality traits may arise in different ways. For example, the spectrum model proposes that personality and psychopathology lie on a continuum, while the common cause model suggests they share common aetiological factors (Clark & Watson, 2008; Klein et al., 2011; Krueger & Tackett, 2003; Widiger, 2011); both are supported by evidence of overlapping genetic predispositions (Carey & DiLalla, 1994; Lo et al., 2017; Sanchez-Roige et al., 2018). In more directly causal scenarios, however, personality traits may increase vulnerability to CMDs, as shown by prospective associations between neuroticism and various mental disorders (Hengartner et al., 2016; Jeronimus et al., 2016; Lahey, 2009; Ormel et al., 2013).
However, CMDs may also contribute to personality trait change over different timescales, accounting for some of the trait change variability in the population (Bleidorn et al., 2022; Roemer et al., 2025). For example, depressive disorder has been suggested to influence neuroticism over periods up to 18 months (Jylhä et al., 2009; Kendler et al., 1993; Prince et al., 2021). Likewise, anxiety symptoms have been suggested to have generally small effects on neuroticism at 18 and 24-month follow-ups (Jylhä et al., 2009; Karsten et al., 2012) and large increases for individuals with disorder episodes within the 12 months prior to the follow-up assessment in Prince et al. (2021). Depressive disorder, but not anxiety, has also been linked with a small decrease in extraversion at 18 months or 2 years follow-up (Jylhä et al., 2009; Karsten et al., 2012) as well as a small decrease in conscientiousness at the 2-year follow-up (Karsten et al., 2012). There is less evidence that either disorder influences agreeableness or openness (Karsten et al., 2012). As for AUDs, Chassin et al. (2010) observed higher alcohol use to predict lower psychosocial maturity (potentially similar to conscientiousness) in 6 months among male juvenile offenders, whereas heavy drinking has been linked with higher impulsivity (a trait that reflects low conscientiousness; see Roberts et al., 2014) over the following year among moderately impulsive adolescent boys (White et al., 2011).
In aggregate, however, evidence on the presence, size, and/or endurance of these effects is inconsistent yet. Although some studies have observed moderate scar effects of depression on neuroticism (Kendler et al., 1993), with Prince et al. (2021) finding moderate scar effects among those remitted for 12 months at the six-year follow-up, others have reported that neuroticism returns to pre-morbid levels over a period of several years (Shea et al., 1996; Spinhoven et al., 2014), while Jylhä et al. (2009) found no additional personality changes from recurrent episodes. For extraversion, some studies have found no lasting effects following depressive episodes (Jylhä et al., 2009; Kendler et al., 1993), while Klimstra et al. (2010) reported small but lasting declines in extraversion, conscientiousness, agreeableness, and emotional stability across five annual assessments. For anxiety disorders, evidence of enduring effects on personality traits is mixed and generally small (e.g. Prince et al., 2021). However, Klimstra et al. (2014) linked alcohol abuse to small but longer-term decreases in agreeableness and conscientiousness across four annual assessments, Luchetti et al. (2018) observed changes in conscientiousness (β = −0.10) and extraversion (β = 0.10) related to alcohol use over a 4-year follow-up in middle and older adulthood, and Hakulinen and Jokela (2019) found modest decreases in agreeableness, conscientiousness, and emotional stability, and an increase in extraversion over a 5.6-year period. Likewise, Hicks et al. (2012) found that persistent alcohol use moderately disrupted normative declines in negative emotionality (comparable to neuroticism) from ages 17 to 24, although Kroencke et al. (2021) found little evidence of alcohol-related personality change in a 10-year longitudinal study, and Littlefield et al. (2012) also observed no evidence of alcohol involvement effects on personality change over longer developmental timeframes. In line with the latter, Kotov et al. (2010) found that current CMD diagnoses were not more strongly associated with Big Five traits than lifetime diagnoses, which is evidence against a permanent trait change due to CMD-related processes.
In sum, this evidence shows that experiencing CMDs may be associated with some changes in personality traits, most likely accentuating pre-existing trait levels associated with developing the disorders in the first place. However, without reliable estimates of the effects’ strength and duration, it remains unknown whether CMD-related trait changes, where they exist, are elastic or pliable.
Need to go beyond self-reported personality traits
Up to 40% of self-report personality variance can be attributed to single-method effects (e.g. stable perception or rating biases, and idiosyncratic item interpretations), limiting how accurately self-reports represent people’s actual personality traits (McCrae & Mõttus, 2019). Above and beyond actual trait variance, the self-report’s method-specific variance can be correlated with CMDs in at least two ways. First, people experiencing mental health issues may perceive changes in their traits that are not necessarily observable with other methods, and these perceptions may change once the issues subside. Second, diagnoses often rely on self-reports, similarly to personality trait assessment in most studies. So, people’s general perceptions and descriptions of themselves (identity; Connelly & Ones, 2010; Hogan, 2017) and (lasting and temporary) biases in these may influence how people report on both their psychopathology and personality traits, confounding their associations. To mitigate these possibilities, it is imperative to include personality informant-reports to assess traits as they are visible to other people, besides oneself (reputation; Connelly & Ones, 2010; Hogan, 2017). There is little evidence that informant-reports are systematically more or less valid than self-reports (e.g. Connelly & Ones, 2010; Mõttus et al., 2025). Hence, findings that replicate in both self- and informant-reports are more likely to be reliable and valid than those relying on self-reports alone (Balsis et al., 2015; Carlson et al., 2013; McCrae, 2020; Mõttus et al., 2020; Oltmanns et al., 2022; Schneider & Schimmack, 2009).
This study
We examined the Big Five personality traits’ associations with three CMD diagnoses in a sample of 77,378 individuals from the Estonia Biobank (Vaht et al., 2024), using complete CMD records from 2004 to 2021 and a comprehensive personality trait assessment in 2021/2022, including informant-reports for nearly 21,000 of the participants. Leveraging the unique 17-year time-series data on CMDs allowed us to test whether the time elapsed since the last diagnosed CMD episode was linked with not only self-reported personality traits but also traits as seen by external observers.
Assuming no secular trends in the associations between personality traits and seeking help for CMDs, these trait-CMD timing associations would provide evidence for the rate at which personality traits return towards typical levels after acute CMDs have subsided to the extent that medical support is no longer sought. This design is unable to differentiate permanent-pliable (beyond 17 years) effects from the associations between CMDs and pre-existing trait levels, since this would require large longitudinal designs starting in young adulthood and spanning several decades (currently unavailable). We also adjusted for, and report, the strength and form of the associations between traits and CMD counts accumulated over the 17-year period, since these are interesting in and of themselves, especially their robustness across trait assessment methods. For example, are the associations weaker for informant-rated traits, suggesting inflated associations in self-reports-only studies? And do personality traits only differ between ever- and never-diagnosed people regardless of how many diagnostic episodes people have, suggesting that personality traits are relevant for seeking medical help? Or do traits also vary with the number of additional diagnoses accumulated over time, suggesting that personality traits track disorder severity?
We restricted our sample to those who were adults in 2004 to give all participants an equal ‘chance’ to have accumulated adult CMD diagnoses and controlled for age and sex to reduce confounding. Both personality traits and CMDs show age and gender-related patterns: emotional stability typically declines while conscientiousness increases with age (Roberts et al., 2006), similar to how CMDs show the highest prevalence in adolescence and early adulthood and then decline (e.g. Goodwin et al., 2022; Littlefield et al., 2009). In terms of gender differences, women typically score higher in neuroticism, agreeableness, and extraversion (Weisberg et al., 2011) and experience more internalizing disorders, whereas men face greater AUD risk (Eaton et al., 2012).
Based on past literature (e.g. Kotov et al., 2010), we anticipated that having any/more CMD diagnoses would be associated with higher neuroticism and lower extraversion and conscientiousness. As for the counts of diagnoses, we could not predict whether their associations with personality traits would be linear with ever more diagnoses implying ever larger differences from undiagnosed people and therefore used a modelling strategy allowing for non-linear trends to naturally occur. Further, we expected results consistent with both anxiety and depressive disorders having effects on neuroticism, but only depressive disorders associating with extraversion (Jylhä et al., 2009; Karsten et al., 2012); whether their effects would be more consistent with elastic or pliable trait change was not clear based on past literature. However, we expected evidence consistent with pliable effects of AUD on agreeableness and conscientiousness (e.g. Hakulinen & Jokela, 2019). Because diagnosing CMDs is based on a person’s self-report and behaviour when interacting with medical professionals, we expected the CMD-personality trait associations to be stronger in self-reports than in informant-reports.
Methods
Participants
The Estonia Biobank (EstBB) includes over 200,000 adults (gene donors), covering around 20% of the adult population of Estonia (Milani et al., 2024). Between November 2021 and April 2022 (Vaht et al., 2024), 182,405 gene donors with valid email addresses were invited to complete a one-time personality survey, with 80,116 donors starting the survey. They could complete the survey in either Estonian or Russian and received feedback on their Big Five personality traits. Before starting, participants were asked to optionally provide the email address of an informant, such as a partner, relative, or friend, who could also rate the participant’s personality traits using a third-person version of the same questionnaire. Both participants and their informants provided electronic consent after being fully informed about the study. The activities of the EstBB are regulated by the Human Genes Research Act, which was adopted in 2000 specifically for the EstBB. Individual-level data analysis was carried out under ethical approval 1.1-12/626 (13.04.2020) from the Estonian Committee on Bioethics and Human Research (Estonian Ministry of Social Affairs), using data according to release application 3-10/GI/11571.
We removed participants who completed the study in Russian (N = 3,747) because they were too few for separate analyses and those with more than 10 missing responses in the personality survey, leaving us with 73,631 participants. There were very few missing values (0.001% in self-reports and 0.0001% in informant-reports), which we replaced with the median. We then restricted the sample to the age range from 35 to 75 years to (a) ensure participants could be diagnosed with adult disorders in 2004 and (b) reduce the likelihood that personality changes were linked to cognitive deficits more common among older adults (e.g. Bishop et al., 2010); this left us with 55,056 participants with self-reports.
We set the cut-off for the CMD records to November 11, 2021, to ensure that all diagnoses preceded the assessment of personality traits. This resulted in 26,619 participants with at least one record for any of the three CMDs. Among them, 15,995 had been diagnosed with only one of the three CMDs, 10,054 had diagnoses for two of the three CMDs, and 570 had been diagnosed with all three at some point over the 17 years; allowing for partly overlapping samples for different CMDs, this means 37,813 sets of trait scores could be linked with CMD diagnoses, their counts, and timings. Specifically, there were 15,615 participants with a depressive disorder record, 20,749 participants with an anxiety disorder record, and 1,449 participants with an AUD record. We considered the 24,713 participants with no recorded International Classification of Diseases, Tenth Revision (ICD-10, World Health Organization, 1992), F-code diagnosis as our healthy control group.
Descriptive statistics of sample size, sex, age, CMD count, and time since last diagnosis, separately for participants with self-reported and informant-reported personality data.
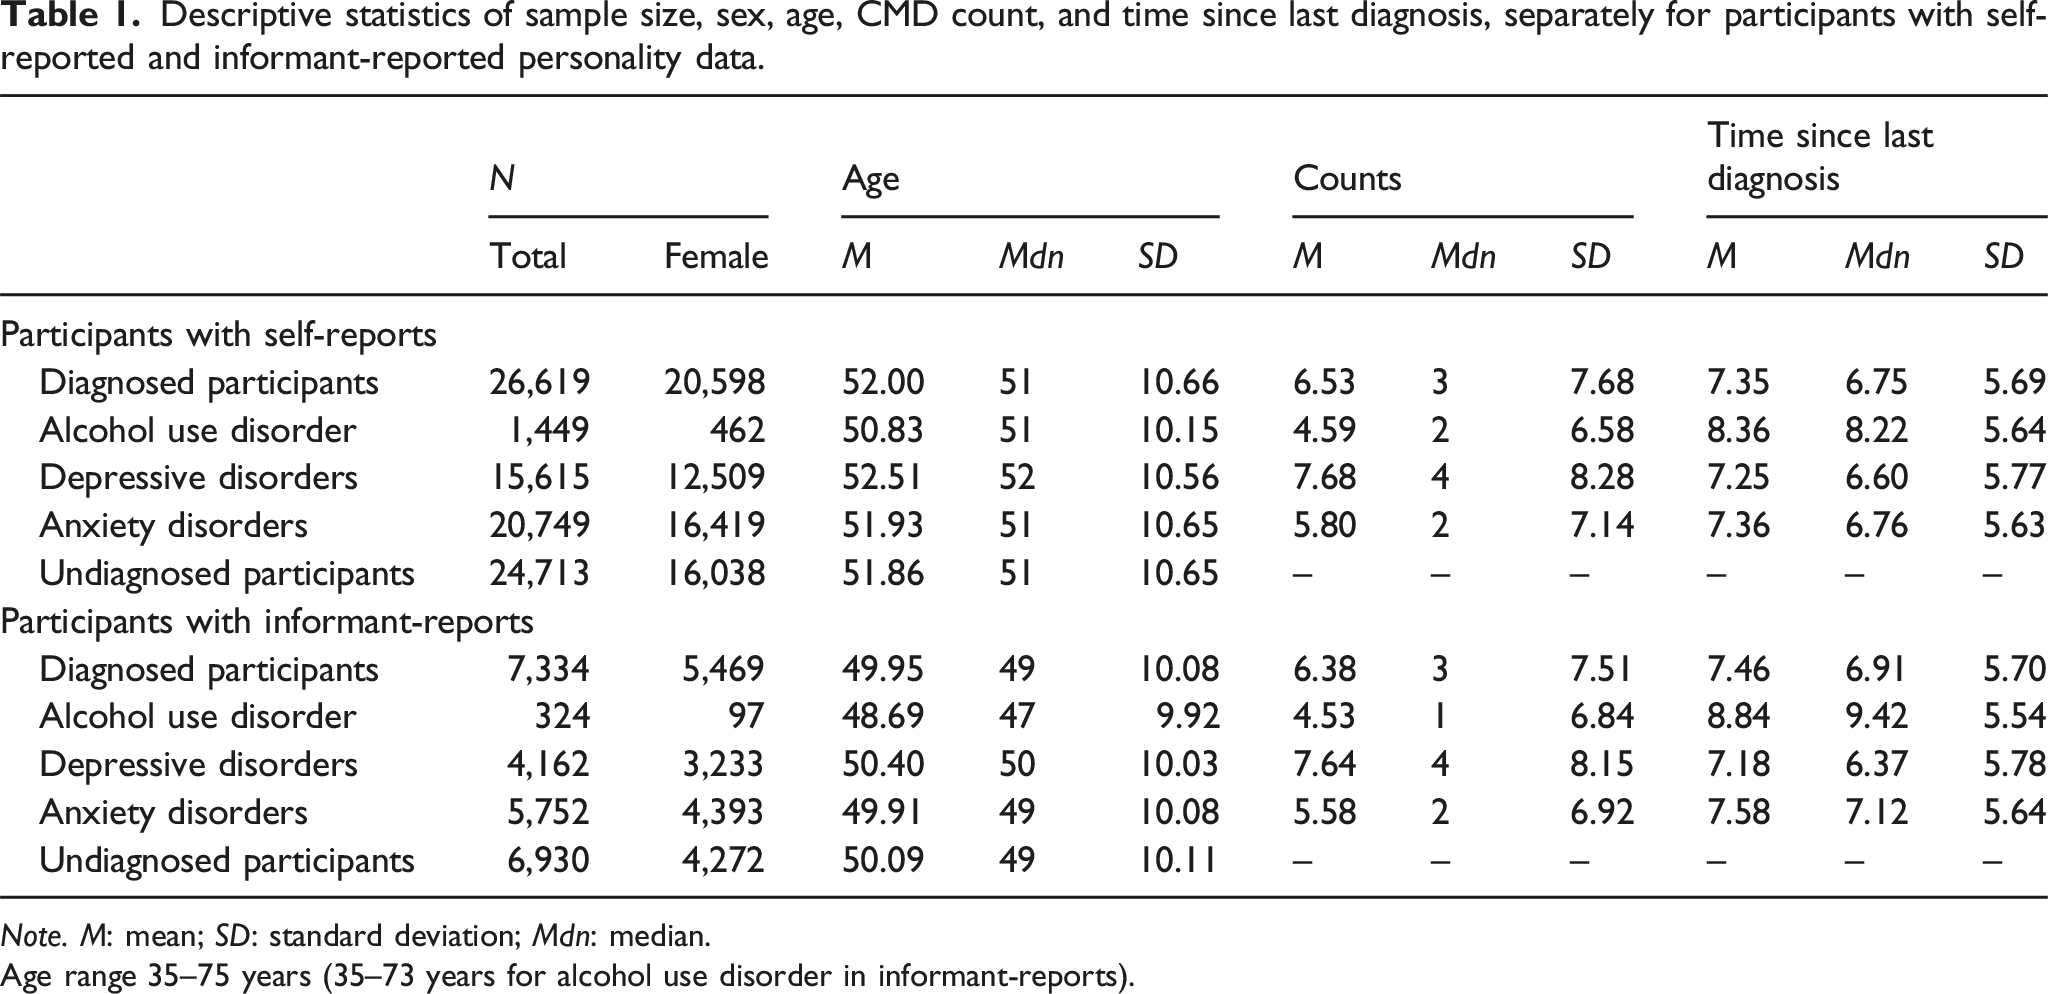
Note. M: mean; SD: standard deviation; Mdn: median.
Age range 35–75 years (35–73 years for alcohol use disorder in informant-reports).
Measures
Personality trait assessment
In the EstBB PS21 study, we aimed to assess personality traits more comprehensively and orthogonally than allowed by the existing Big Five measures. To do this, both participants and their self-selected informants completed the 100 Nuances of Personality (100NP), a 198-item inventory developed to capture a broad range of personality traits with high reliability and minimal redundancy (Anni et al., 2025; Henry & Mõttus, 2025). The item pool was drawn from sources such as the International Personality Item Pool (Goldberg, 1999) and Synthetic Aperture Personality Assessment (Condon & Revelle, 2016) and was designed to cover standard Big Five domains and facets, as well as additional traits often under-represented in traditional measures (e.g. envy, sexuality, spirituality, and Dark Triad traits). Items were selected based on test–retest reliability, variance, cross-rater agreement, and low redundancy, with some redundancy retained to assess acquiescent responding and low-reliability traits. Responses were given on a 6-point Likert-type scale ranging from 1 (completely inaccurate) to 6 (completely accurate). Full details on the 100NP are documented in Henry and Mõttus (2025).
The Big Five domain scores were calculated from 60 items selected through a multistep process prioritizing broad content coverage and reduced redundancy (Anni et al., 2025). Conceptually, we define domains as formative traits (aggregates) rather than reflective (latent causes of their items) since there is no compelling evidence to suggest that the Big Five act as latent causes; rather, they constitute of largely autonomous building blocks (Condon et al., 2020). Standardized self- and informant ratings from 20,886 participants (who had both self- and informant ratings) were averaged, and redundant (intercorrelations >0.50) or weakly correlated (all correlations <0.30) items were removed. Principal component analysis (PCA) of the combined self- and informant-reports of the remaining 119 items identified five varimax-rotated components. The 12 highest-loading items for each component were retained, resulting in a final 60-item set. A subsequent PCA of the combined ratings of these 60 items produced loadings that we then used to compute Big Five scores separately in self- and informant reports. This approach yielded relatively orthogonal trait scores (Mdn intercorrelations: 0.05 in self-reports and 0.04 in informant reports), a component structure that clearly reflected typical Big Five content (see Supplementary Material, Table S1 in Anni et al., 2025; https://osf.io/y735x), and scores calculated similarly on both rating types.
Previous research defining the Big Five as latent traits has shown sufficient measurement variance across self- and informant-reports (Mõttus et al., 2020; Olino & Klein, 2015). Here, we assessed the structural consistency of the Big Five between the two rating sources by aligning their PCA structures using the Procrustes rotation and assessing the resultant structures’ congruence (McCrae et al., 1996). Our Procrustes rotation analysis rotation (McCrae et al., 1996) showed that both sets of ratings reflected the same underlying trait structure, as indicated by factor congruence coefficients ranging from 0.98 to 0.99 and an overall matrix congruence of 0.98. Cross-rater correlations of the Big Five (consensual validity) varied between 0.45 and 0.59 (Mdn = 0.51), above typical values (Connelly & Ones, 2010), further supporting the validity and reliability of the ratings across sources in our study. We also examined structural similarity by comparing the factor structures between diagnosed and undiagnosed participants. The structures showed extremely high congruence in both self-reports (factor congruence 0.993–0.998 and overall congruence 0.996) and informant-reports (factor congruence 0.995–0.998 and overall congruence 0.997), suggesting that the measure’s structure is highly comparable across diagnostic status.
Anni et al. (2025) showed high test–retest reliability (r = 0.85–0.88) for these Big Five scores, convergent validity through strong correlations with other Big Five inventories (e.g. NEO Personality Inventory–3 (NEO-PI-3), McCrae & Costa, 2010; International Personality Item Pool–NEO, Maples-Keller et al., 2019), and discriminant validity, supported by substantially lower inter-scale correlations than those observed in other Big Five measures. Notably, these Big Five scores consistently captured more variance in other comparable Big Five measures than vice versa, and their criterion validity has also been demonstrated (e.g. Anni et al., 2025; Mõttus et al., 2024; Soodla et al., 2025). Taken together, this body of evidence establishes the component scores’ strength as reliable and valid assessments of the Big Five domains. Further details and analyses are in Anni et al. (2025).
Diagnostic assessment
Information on gene donors’ diagnoses was obtained from the government’s medical information system, which includes all hospital, outpatient clinic, and general practitioner records from 2004 onwards. The diagnoses were based on ICD-10. We combined depressive episode (F32) and recurrent depressive disorder (F33) as depressive disorders; phobic anxiety disorders (F40), other anxiety disorders (F41), reaction to severe stress, and adjustment disorders (F43), somatoform disorders (F45), and other neurotic disorders (F48) as anxiety diagnoses. We considered mental and behavioural disorders due to the use of alcohol (F10) as AUD. For each participant and diagnosis, we calculated the count of diagnoses since 2004 (C) and the time since the last record in years (TLD; difference between the trait assessment date and the date of the last diagnosis in days converted to year units).
Statistical analyses
We analysed data using the R statistical programming environment, version 4.3.1 (R Core Team, 2023). As per our research questions, we were interested in C and TLD in relation to each personality domain, besides comparing ever and never diagnosed participants. We residualized personality domain scores for age and sex and then standardized them such that undiagnosed participants had a mean of 0 and SD of 1, so mean scores of those with different diagnoses counts and timings would represent differences from the undiagnosed individuals in Cohen’s d (i.e. SD) units (Cohen, 1992). We capped diagnoses counts at 25 diagnoses for each person and each CMD to reduce the influence of extreme scores.
Considering the possibility of non-linear associations – only short-term CMD effects on personality traits and more diagnoses not necessarily implying higher trait scores – we used a generalized additive model (GAM), as implemented in the mgcv R package (Wood, 2017). GAMs utilize penalized regression splines to create non-linear yet smooth functions; in our case, we treated C and TLD as smoothed terms using thin plate splines that were fine-tuned using the Restricted Maximum Likelihood (REML) method to determine the optimal degree of smoothness directly from the data. We used the ‘by’ argument to estimate separate smooth terms for the C and TLD for each CMD, accounting for trait-C and trait-TLD associations and their variations across the CMDs’ diagnostic levels within one analysis. We also used the ‘select’ argument to automatically apply an extra shrinkage penalty to each term, allowing non-contributing terms to be shrunk to nearly zero and thus avoiding overfitting. In GAMs, estimated degrees of freedom (EDF) reflects the non-linearity of associations (Wood, 2017), with an EDF = 1 suggesting a linear relationship, 1 < EDF ≤2 suggesting weak non-linearity, and EDF >2 demonstrating clear non-linearity (Zuur et al., 2009). Since only people with at least one CMD diagnosis were used in these GAM models (undiagnosed people could not have a C and TLD), the models’ intercepts showed the baseline personality trait differences between people with and without a CMD diagnosis, as if individuals had been, hypothetically, yet undiagnosed but would be imminently diagnosed. To visualize the smoothed relationships between traits and C/TLD, we generated a sequence of values spanning the observed data range for C and TLD and used GAM predictions to plot curves representing the estimated relationships.
To examine the robustness of our findings, we conducted several supplementary analyses. In our main analyses, we used all 37,813 observations, that is, we used data for those with more than one kind of CMD diagnoses as if they were separate observations (e.g. often the diagnoses were from different periods). In supplementary analyses, however, we controlled for comorbidity by retaining participants for only a single type of CMD (see Tables S2.1–S2.5, Figures S1 and S2). We prioritized people with AUD diagnoses first, followed by depressive diagnoses, then anxiety diagnoses, thus preferring less common diagnoses to ensure adequate statistical power for detecting effects in smaller diagnostic groups. We also accounted for the time since the first diagnosis (TFD) to adjust for the length of the period over which participants were diagnosed, to account for the possibility that those diagnosed over a longer period systematically differed from those with multiple diagnoses over a short timespan (Tables S3.1–S3.4; Figures S3 and S4). Third, we performed traditional linear models for comparison with our GAM approach (Tables S4.1–S4.3; Figures S5 and S6). Fourth, we re-ran models without controlling for age and sex to test whether demographic factors affected our main findings (Tables S5.1–S5.4; Figures S7 and S8). Finally, we conducted sex-stratified analyses (Tables S6.1–S6.6; Figures S9 and S10) and age-stratified analyses (Tables S7.1–S7.6; Figures S11 and S12) to examine whether the main results generalized across demographic groups. Age-stratified analyses divided participants into younger and older groups using median splits calculated separately for each diagnostic group, based on our initial sample before applying age limitation (i.e., self-reports range: 18–102 years; informant-reports range: 18–93 years). For example, among people with any CMD record, the median age was 47 years for self-reports and 44 years for informant-reports.
Results
Main effects
GAM models’ intercepts, showing the baseline trait differences between diagnosed and undiagnosed people.
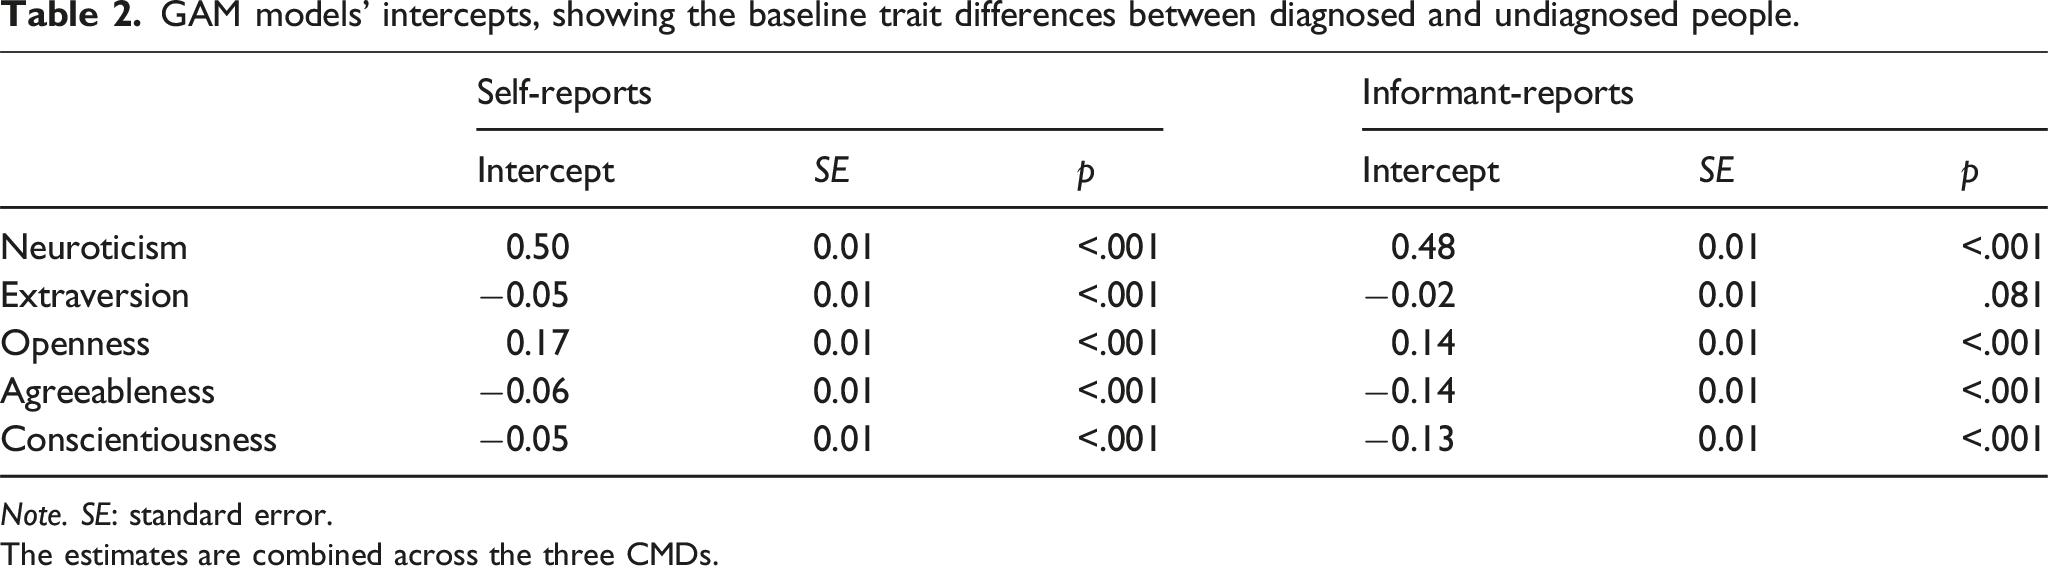
Note. SE: standard error.
The estimates are combined across the three CMDs.
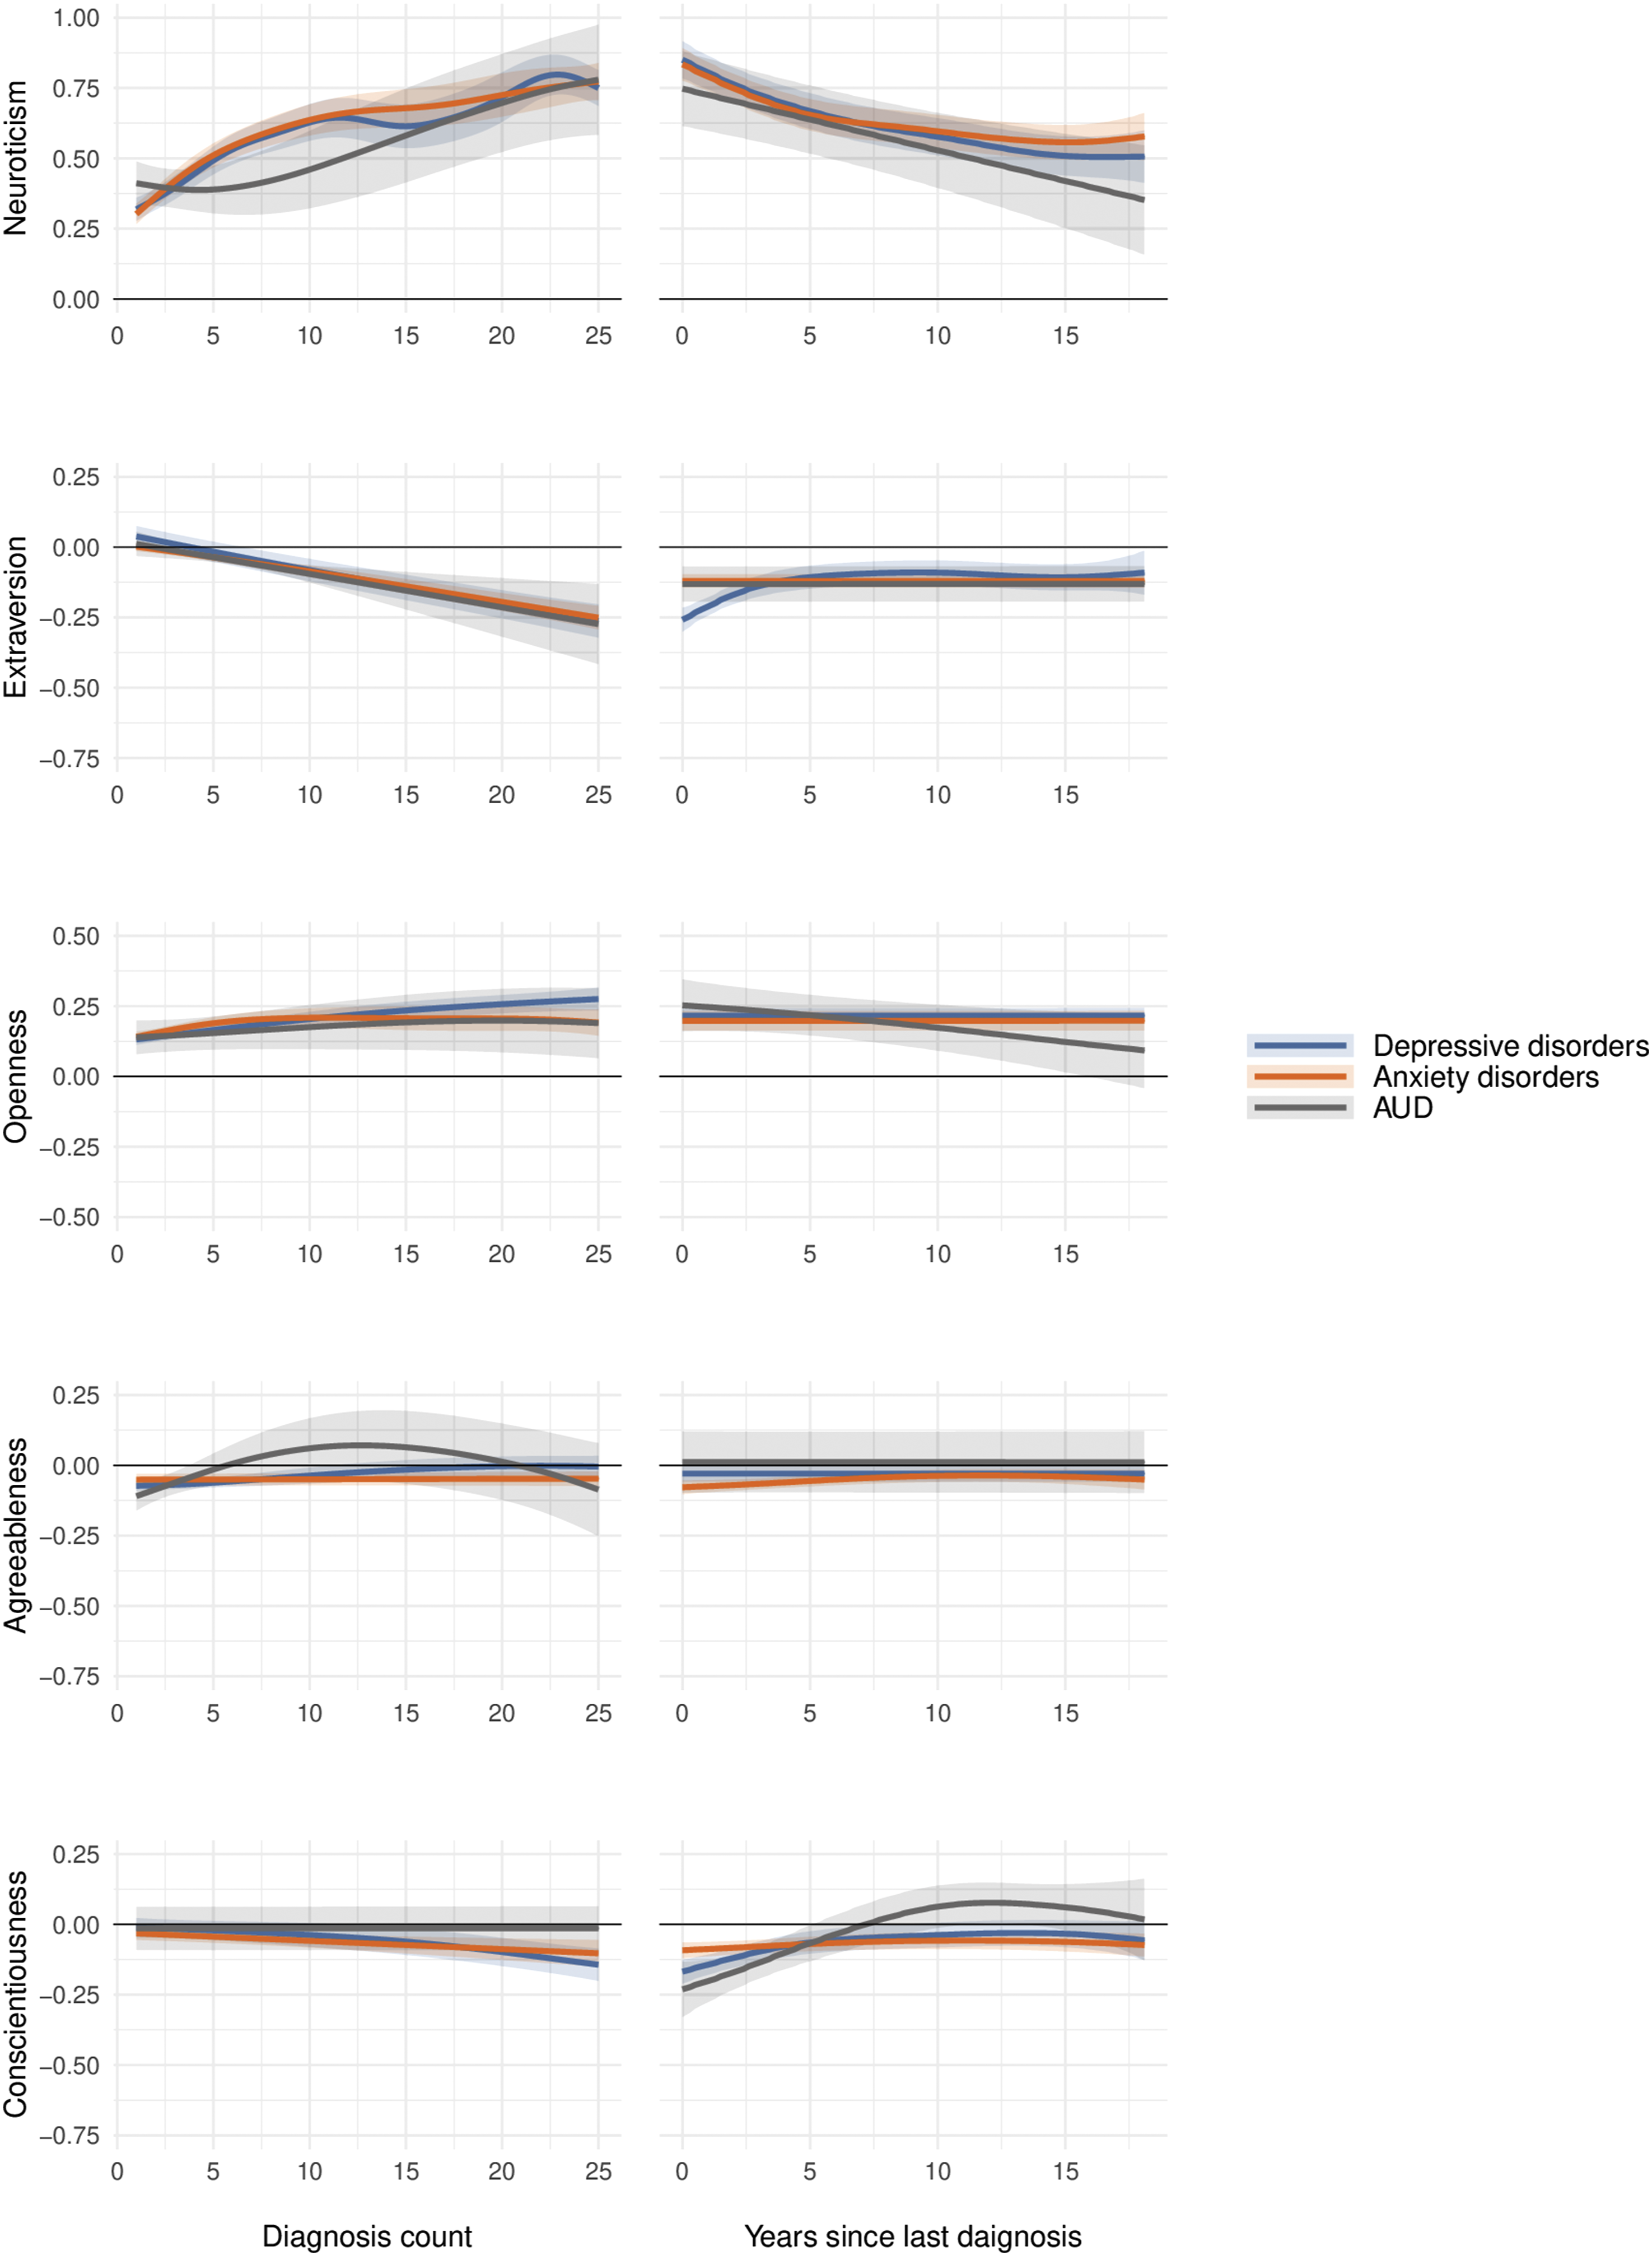
Associations of CMD diagnosis count (C) and time since last diagnosis (TLD; in years) with self-reported personality traits, shown as standardized effect sizes (Cohen’s d). Shaded areas represent 95% confidence intervals. Note. Diagnosis count refers to the total number of diagnoses per participant over the 17-year study period.
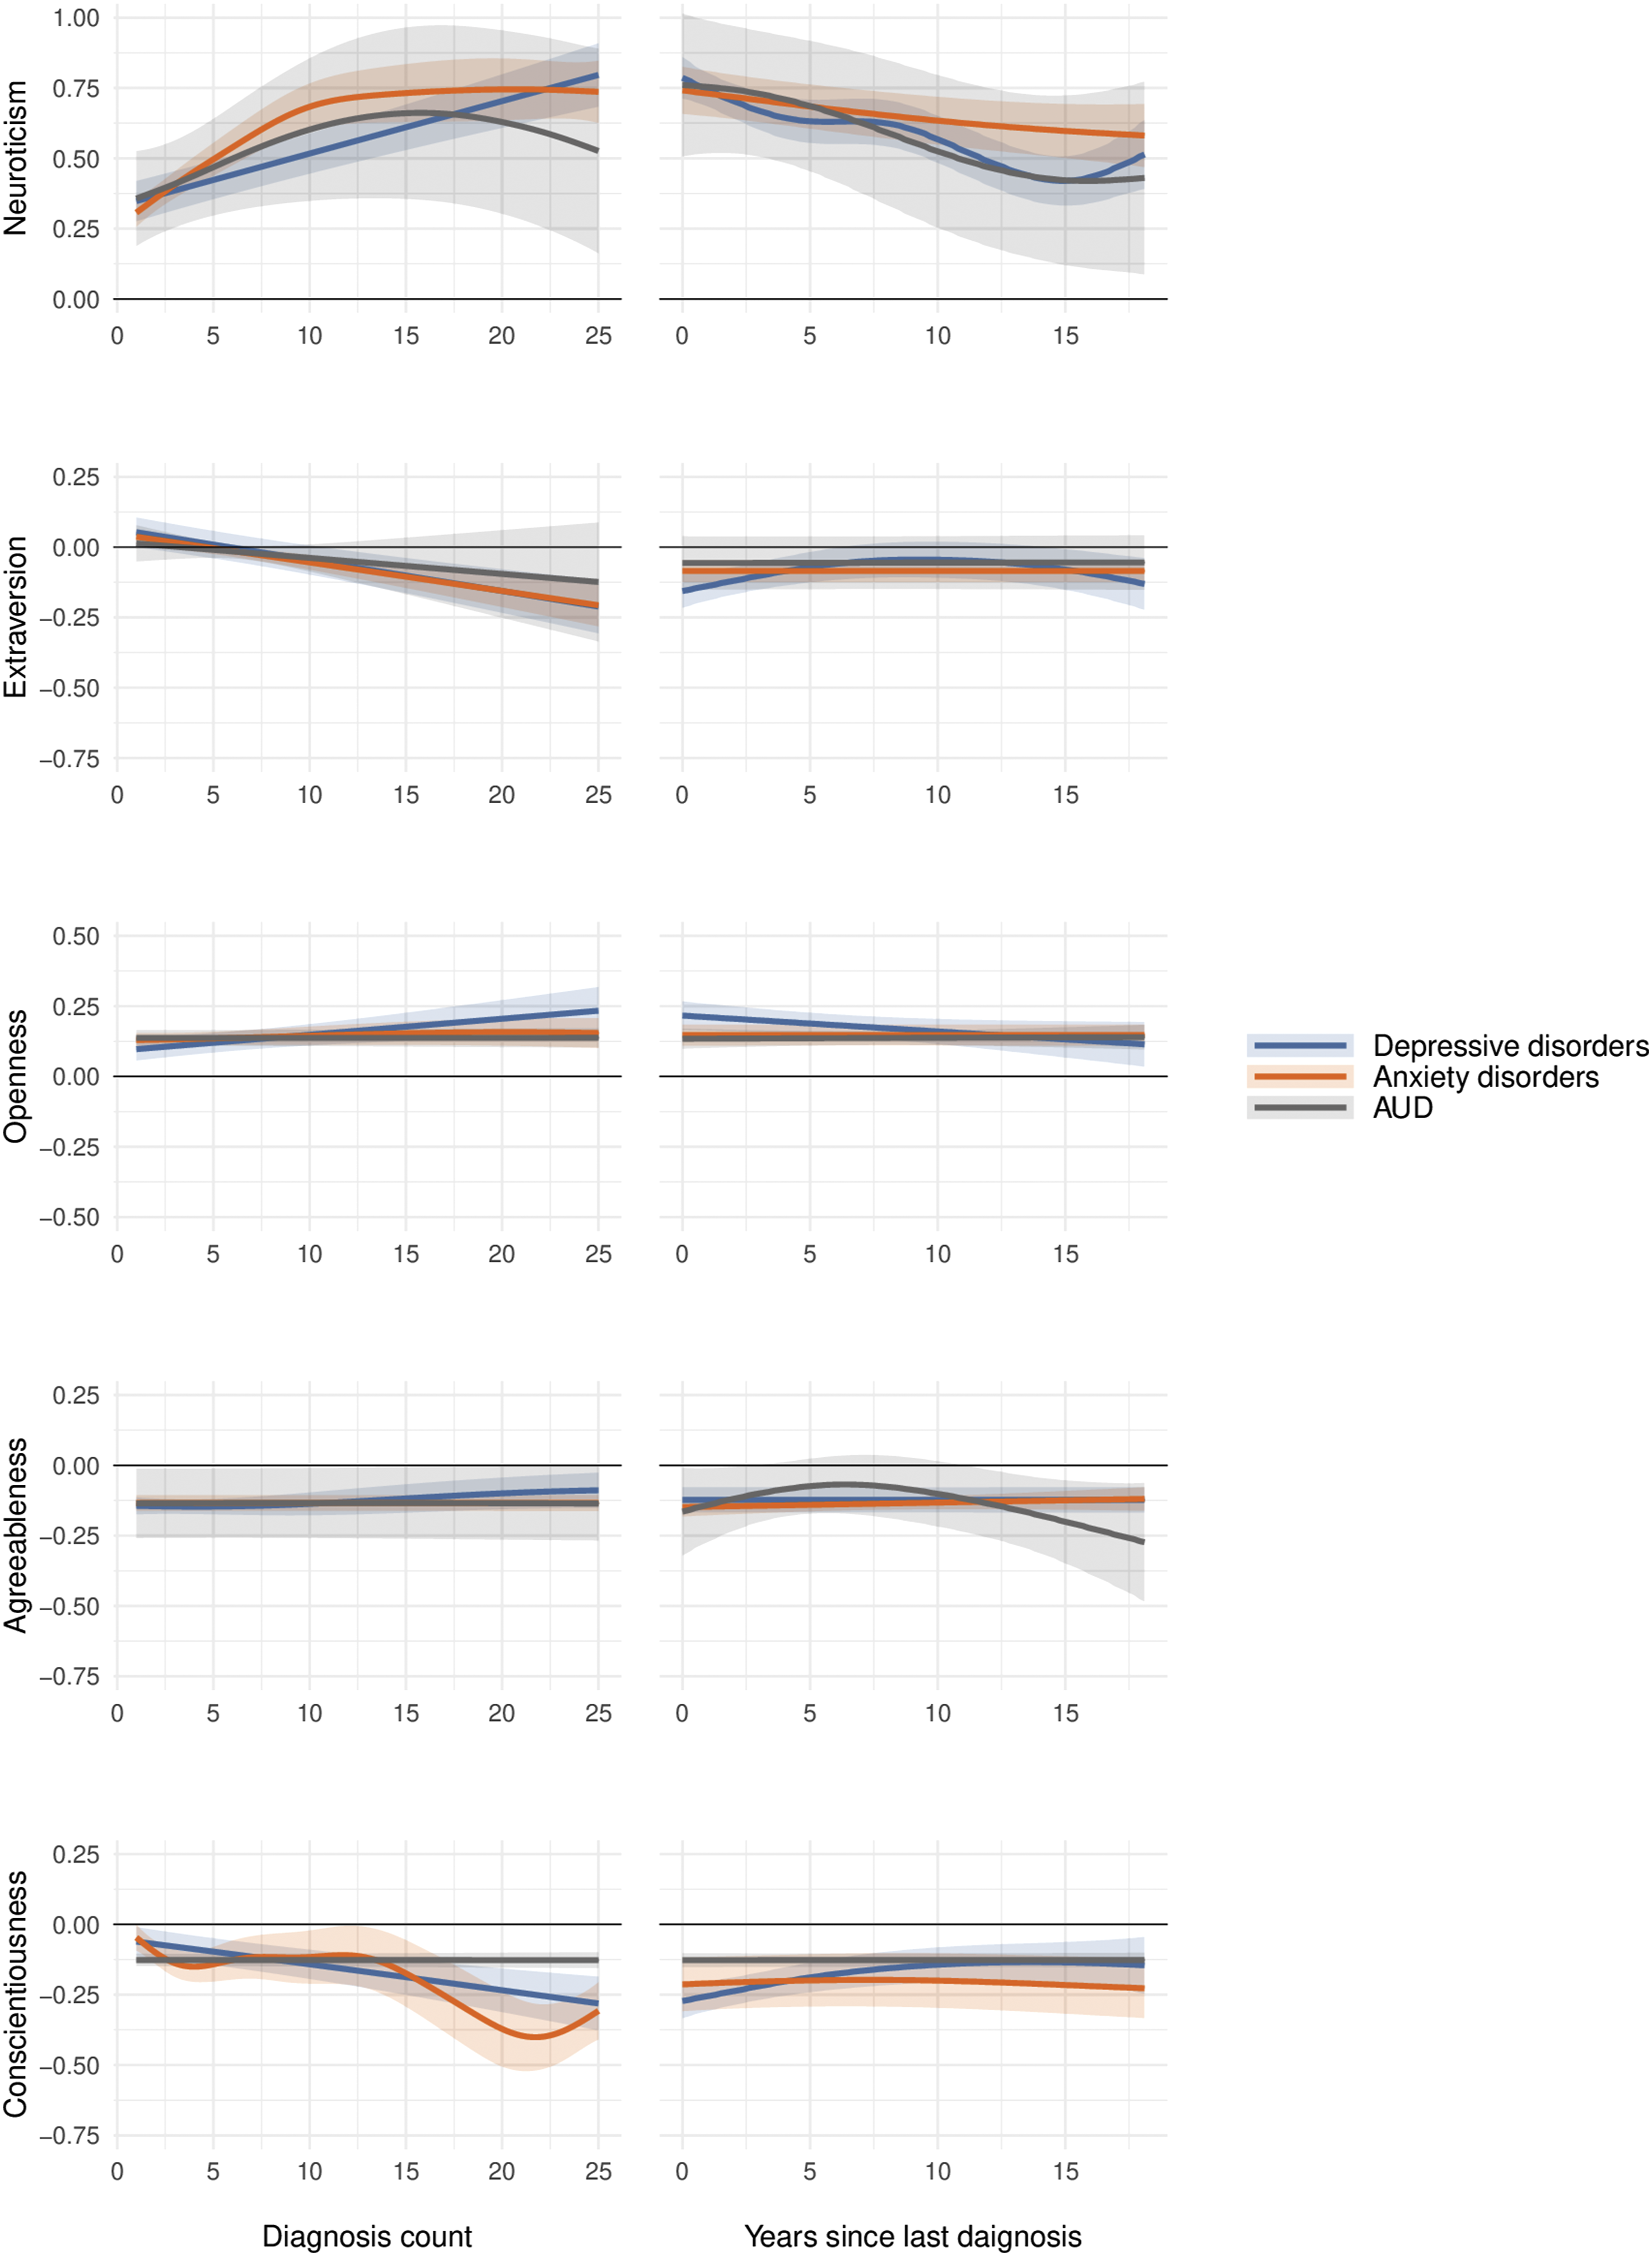
Associations of CMD diagnosis count (C) and time since last diagnosis (TLD; in years) with informant-reported personality traits, shown as standardized effect sizes (Cohen’s d). Shaded areas represent 95% confidence intervals. Note. Diagnosis count refers to the total number of diagnoses per participant over the 17-year study period.
Percentage of variance in the Big Five domains explained by diagnostic counts (C), time since the last diagnoses (TLD), and both combined.
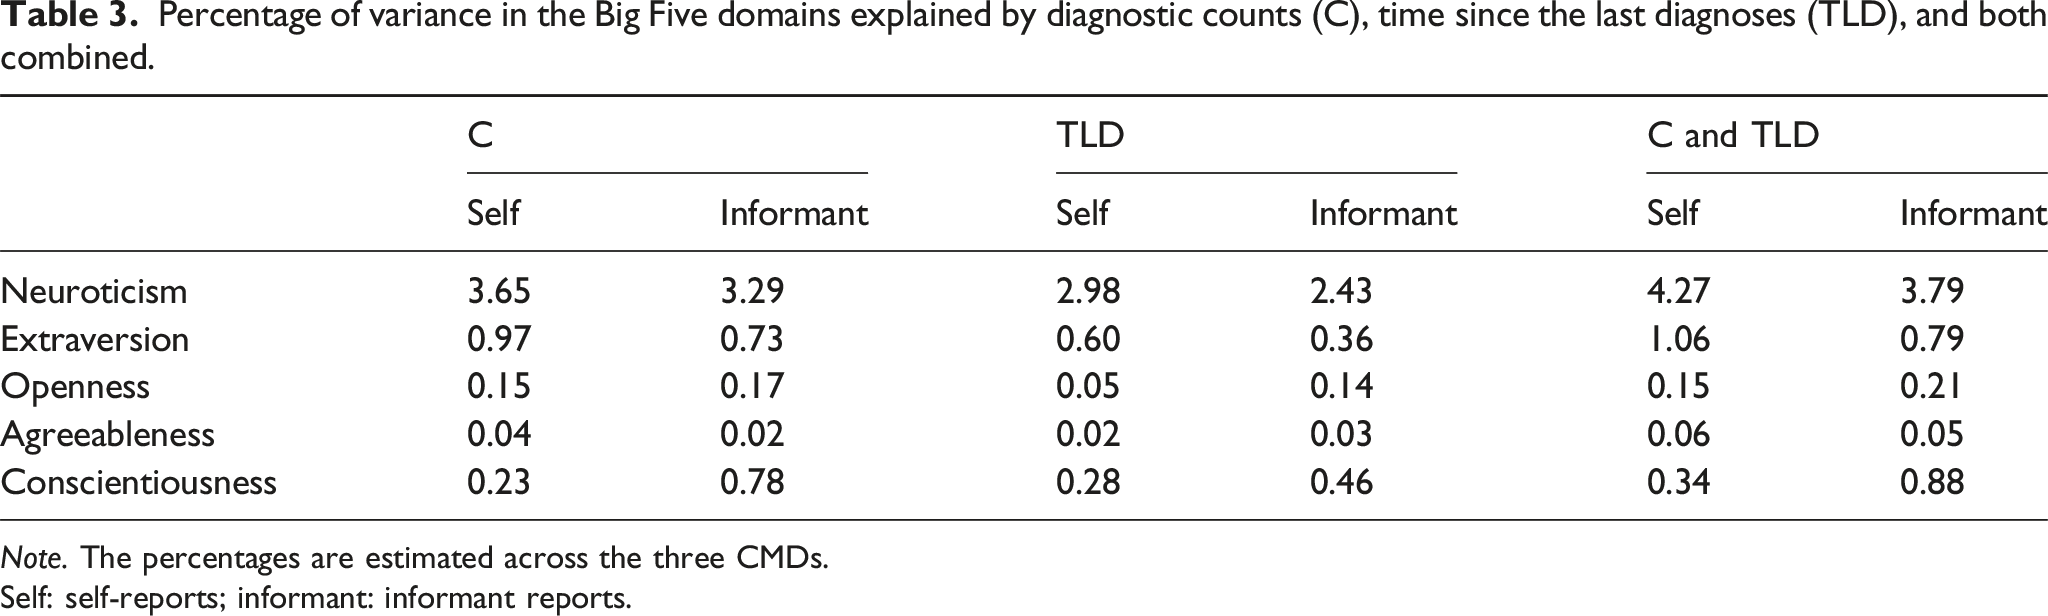
Note. The percentages are estimated across the three CMDs.
Self: self-reports; informant: informant reports.
Diagnostic counts and timing
GAM results for each of the Big Five traits in self-reports.
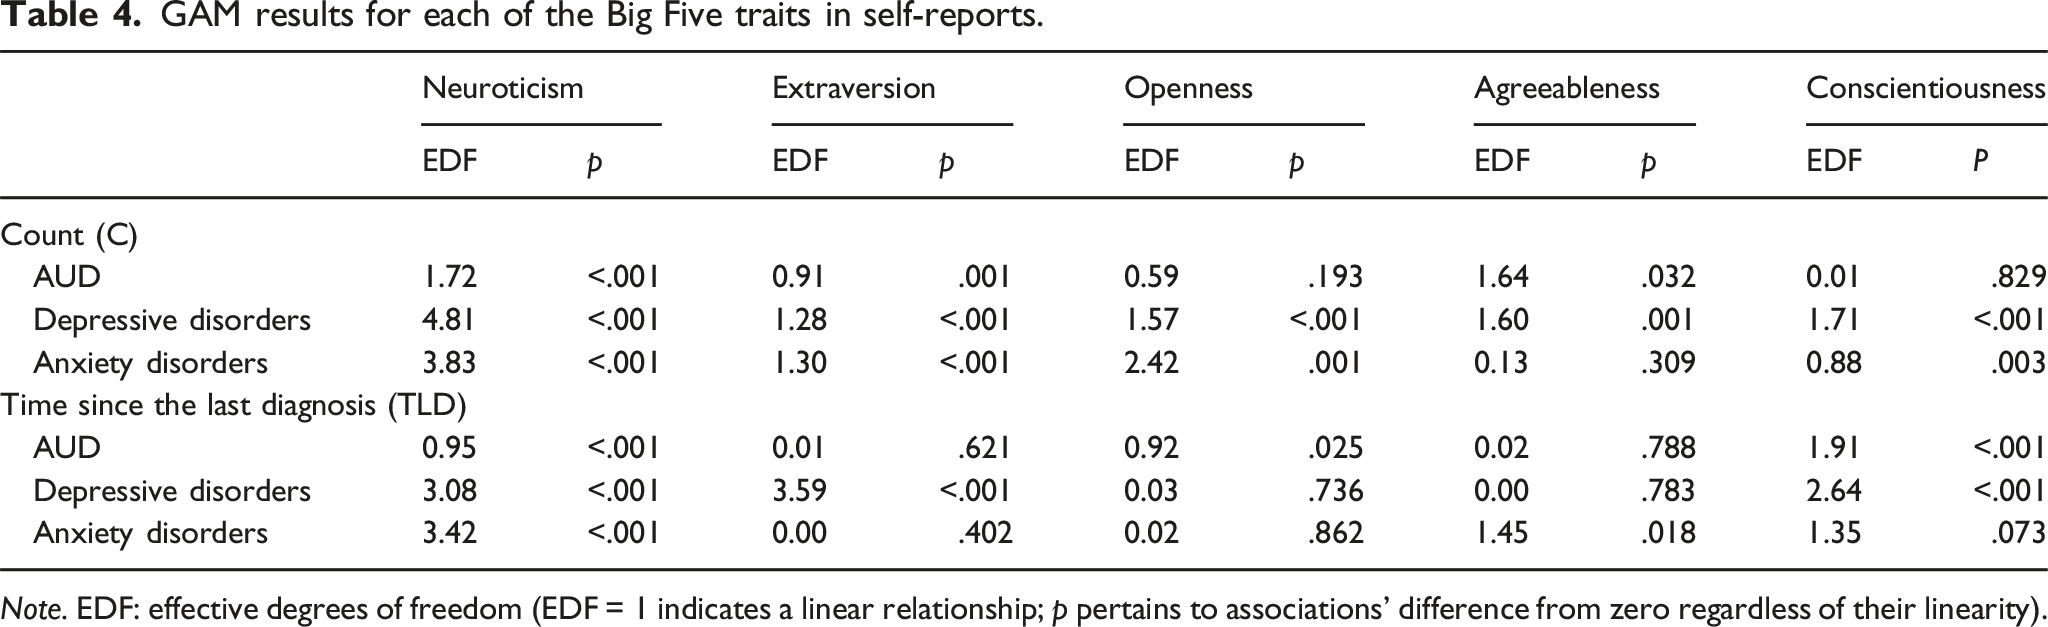
Note. EDF: effective degrees of freedom (EDF = 1 indicates a linear relationship; p pertains to associations’ difference from zero regardless of their linearity).
GAM results for each of the Big Five traits in informant reports.
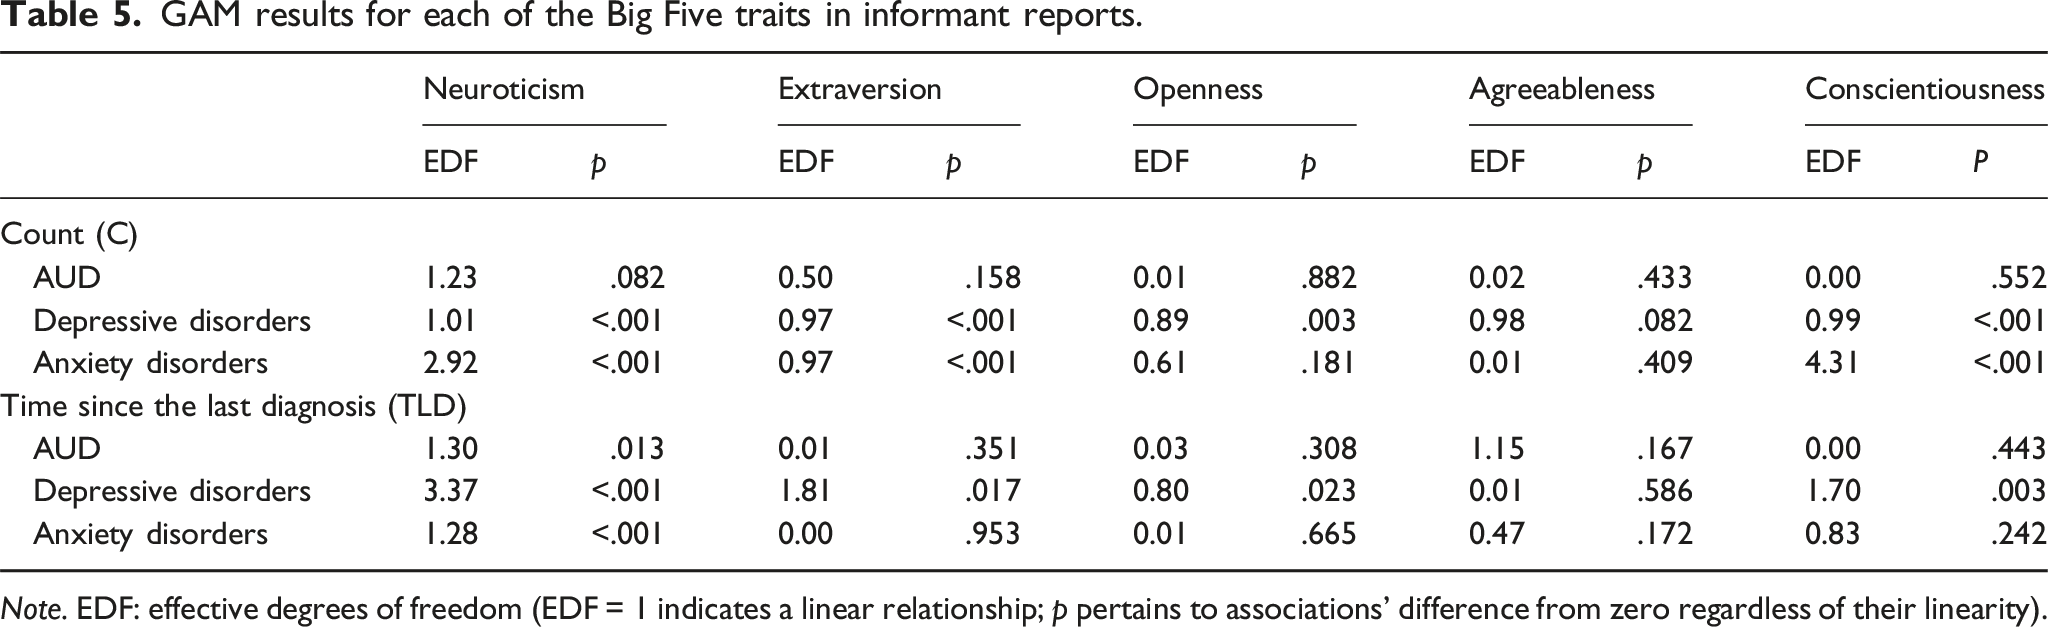
Note. EDF: effective degrees of freedom (EDF = 1 indicates a linear relationship; p pertains to associations’ difference from zero regardless of their linearity).
For all CMDs and according to both rater perspectives, the more time that had passed since the last diagnosis, the closer the diagnosed participants’ average neuroticism scores were to those of undiagnosed people. Again, the exact form of the association somewhat varied across CMDs and rater perspectives, but there was consistent evidence for ever lower neuroticism with more time since the last diagnoses within at least a 10-to-12-year window. As the first approximation, while those last diagnosed around the time of personality assessment scored about 0.75–0.85 SDs above healthy people, those last diagnosed approximately 12 years before trait assessment scored about 0.40–0.60 SDs higher than the undiagnosed people. This finding is in line with the possibility that diagnosable CMDs tend to be associated with a slight increase in neuroticism and that it tends to take at least a decade, if not more, after the conditions have subsided – or have started to subside enough so that medical help is no longer sought – for the trait to return to its pre-existing levels. Notably, this pliable – or scarring – trait change was similarly visible to other people, suggesting the findings were not a self-perception bias artefact.
Extraversion tended to decrease linearly with ever more diagnoses, with those having only one or a few diagnoses being indistinguishable from undiagnosed people and those with 25 or more diagnoses scoring about 0.12–0.25 SDs lower than undiagnosed people, on average. There was evidence consistent with a slight extraversion-decreasing effect of depressive disorder: those diagnosed within the last few years before trait assessment scored somewhat lower than those last diagnosed earlier, according to both rater perspectives.
More numerous depressive and anxiety disorder diagnoses were linked with slightly lower conscientiousness (the trends were especially small in self-reports), and those diagnosed in more recent years with a depressive disorder also tended to have slightly lower conscientiousness than those last diagnosed many years ago: even those diagnosed recently only had about up to 0.25 SDs lower trait score than undiagnosed people, while those diagnosed a longer time ago tended to score even closer to undiagnosed people. Compared to extraversion, conscientiousness’ return-to-baseline after a subsiding depressive disorder was slower according to these data.
For openness, diagnosed individuals had average scores within the 0.12 to 0.25 SDs range. Openness scores remained consistent regardless of time since the last diagnosis, though self-reported openness appeared slightly higher for AUD when the diagnosis was more recent compared to longer elapsed time. For agreeableness, there were no consistent trends.
Supplementary Analyses
In the supplementary analyses for comorbidity control (Tables S2.2 and S2.3; see also Table S2.1 for descriptive statistics), participants with a maximum of one diagnosis type showed a somewhat smaller intercept compared to the main analysis, indicating smaller differences from undiagnosed people. This is expected, as comorbidity likely indicates a psychopathological burden and hence a stronger association with personality traits. The relationship patterns between personality traits and C/TLD remained consistent with our main findings, though with slightly less non-linearity (Tables S2.4 and S2.5; Figures S1 and S2). This consistency across analyses with different sample restrictions validates our findings and suggests the observed trends are not artefacts of, nor substantially inflated by, comorbidity.
When adding TFD as an additional predictor to the model, results closely followed our main findings regarding mean differences from undiagnosed participants (Table S3.1) and variance explained (Table S3.2), with TFD contributing minimal additional variance across reporting sources. The C and TLD predictors maintained similar EDF values and graphical trends even after controlling for TFD (Tables S3.3 and S3.4; Figures S3 and S4), suggesting the timing of initial diagnosis did not substantially confound our observed relationships.
Moreover, our comparison between GAMs and linear models revealed broadly similar interpretations regarding model intercepts and variance explained (Tables S4.1–S4.3). GAMs accounted for more variance in neuroticism, supporting the use of a non-linear approach. In contrast, linear models outperformed GAMs for openness and agreeableness, suggesting that these traits may follow more linear patterns. For extraversion and conscientiousness, the variance explained was consistent across both modelling approaches and reporting sources. The linear model plots (Figures S5 and S6) revealed general trends consistent with the GAM plots, though key nuances were better captured by the flexibility of the non-linear GAMs.
Models without age and sex controls also yielded trends consistent with the main results, though effect sizes were somewhat larger without the controls (Tables S5.1–S5.4; Figures S7 and S8). This is likely because age and gender are associated with both personality traits and CMDs, and without adjusting for them, some of the variance they explain may be misattributed to CMDs per se. These findings support the robustness of the main results, while also highlighting that controlling for age and sex in the main analyses is important to avoid inflated estimates. Informant-reported plots were less consistent, though, particularly for AUD.
Our sex-stratified sensitivity analyses revealed similar results with the main analyses across both sex groups (Tables S6.3–S6.6; Figures S9 and S10), despite wider confidence intervals for some traits – likely due to reduced sample sizes within each subgroup (see descriptive statistics in Tables S6.1 and S6.2). This consistency further supports the stability of the observed associations between CMDs and personality traits in our main analyses.
Age-stratified analyses also yielded results consistent with our main findings (Tables S7.3–S7.6; Figures S11 and S12; see also Tables S7.1 and S7.2 for descriptive statistics). Younger adults showed higher neuroticism and openness levels as C accumulated, with greater variability in response to proximal diagnoses. Older adults showed comparatively lower variability. These patterns were consistent across both reporting methods, supporting the robustness of our findings across the 35–75-year age range.
Discussion
We first compared people diagnosed with a CMD to undiagnosed people in self- and informant-reported Big Five personality traits in a large population sample. We then addressed how the number of CMD diagnoses is related to self- and informant-reported personality traits. Finally, and most importantly, we examined evidence consistent with CMDs influencing personality traits by testing how the traits varied with the time since the last diagnosis within a 17-year period, controlling for the number of diagnoses as a marker of disorder severity.
Personality traits and CMD’s presence and severity
This is the first large population study to examine self- and informant-reported Big Five trait domains’ associations with clinically diagnosed CMD history and, more specifically, the number of diagnoses accumulated over nearly two decades. Importantly, we provide a complementary perspective to previous research that predominantly relied on self-reports to assess personality traits’ associations with the history and/or severity of CMDs. For both self- and informant-reports, ever-diagnosed people scored about 0.5 SDs higher in neuroticism than undiagnosed people. Neuroticism was the primary trait domain to track all CMDs, with having versus not having a CMD record from the last 17 years explaining about 5% of the domain’s variance, and the count of diagnoses among the diagnosed people – an ostensible measure of CMD severity – explaining nearly 4% of the domain’s variance among diagnosed people. Hence, having any as well as having more CMD diagnoses can be seen as markers of CMD severity that tracks neuroticism as seen by people themselves and their close others. Despite some variations across CMDs and rater perspectives, higher neuroticism tended to go with more diagnoses, although the association was slightly steeper at lower diagnosis counts. This suggests that the count of diagnoses accumulated over many years is a marker of the severity of mental health issues that shares variation with neuroticism. This finding extends prior research on the relationship between personality traits and the accumulation of diagnoses (Jylhä et al., 2009).
Openness and extraversion were the other Big Five domains associated with CMDs consistently across trait assessment methods. However, these associations were small and depended on how CMD history was operationalized, with consequences for interpretation. Openness was slightly higher among diagnosed people regardless of how many times people had been diagnosed, suggesting that openness is not affected by the severity of the CMDs; instead, less open people may be less likely to seek help for CMDs (Mackenzie et al., 2006). This shows the potential selection bias in clinical samples, where individuals higher in openness and neuroticism are more likely to seek mental health care and professional services regardless of symptom severity (Foulds et al., 2017; Goodwin et al., 2002; Kakhnovets, 2011; Oluyinka, 2011; Seekles et al., 2012). Other traits may be less related to perceived need for care (Seekles et al., 2012), although the directions of these associations are less consistent (e.g. Atik & Yalçin, 2011; Goodwin et al., 2002). Extraversion, in contrast, was somewhat lower only among those with higher numbers of CMD diagnoses, compared to undiagnosed people, suggesting that extraversion is only reduced (albeit slightly) when CMD severity is high rather than it being a factor that prevents people from turning to professional help.
Our findings were broadly consistent with past research (Hakulinen et al., 2015; Jourdy & Petot, 2017; Koorevaar et al., 2013; Kotov et al., 2010; Malouff et al., 2005; Spinhoven et al., 2013), although our effect sizes tended to be smaller. For example, average neuroticism among those diagnosed with the ‘distress’ group of disorders that included depressive and anxiety disorder diagnoses was about 1.7 SDs higher than that of healthy people in Kotov et al.’s (2010) meta-analysis; in our findings, the difference was about 0.5 SDs. This could be because of lower disorder severity within our large population sample, particularly due to many individuals diagnosed for less severe conditions and only once, perhaps often by general practitioners (GPs) due to passing stressors (see Table S1). In contrast, much of the earlier literature relied on small, selective samples and assessed traits during acute illness, which could likely increase the likelihood of inflated estimates through both publication bias (Sidebotham & Barlow, 2024) and transient symptom effects. However, even those with dozens of diagnoses accumulated over years – presumably due to sustained mental health problems – showed considerably less extreme average Big Five in our data compared to the meta-analytic estimates of Kotov et al. (2010). Therefore, our results may offer a more ecologically valid estimate of trait-disorder associations. Also, we should note that effect sizes as big as d ≈ 1.7 (or, equivalently, r ≈ 0.65) are highly unusual in psychological research (Funder & Ozer, 2019), so the previous meta-analytic findings should be considered with care. Effects in the range that we observed, d ≈ 0.50 (r ≈ 0.24), are still high, but more common and plausible.
Another possible explanation that our associations between the Big Five and CMDs were not as (unusually) strong as those in Kotov et al. (2010) is based on CMD diagnoses’ low reliability (Regier et al., 2013; Stausberg et al., 2008). That is, some diagnoses may have been false positives (Wakefield, 2010), and some undiagnosed people may have suffered from undiagnosed mental health problems even if they had sought professional help (false negatives). For example, many diagnoses were likely made by GPs rather than psychiatrists specifically trained to diagnose mental disorders (Mitchell et al., 2009). Moreover, many people objectively suffering from a CMD to the extent of warranting a clinical diagnosis may not have sought professional help, and remaining undiagnosed. Alternatively, they may have also sought help in private practices, not part of the Estonian Health Insurance Fund. However, it is worth noting that about half of our sample had at least one CMD diagnosis over the last 17 years, so generally, people must have been willing to seek medical help through the Estonian Health Insurance Fund. For reference, in a population-representative Estonian sample, 24% of people had sought professional help for anxiety, depression, or alcohol use problems over a five-year period from 2016 to 2021 (Eesti rahvastiku vaimse tervise uuringu konsortsium, 2022; note that our coverage spanned 17 years, hence the larger prevalence). Also, the reliability of the diagnoses must have been less than half of those meta-analysed by Kotov et al. (2010) to fully explain the effect sizes differences, which is not plausible. Hence, we believe that low reliability of CMD diagnoses may be one reason explaining the effect size differences but not the only or even the main reason. And again, the effect sizes we observed were in a plausible range, considering our general knowledge of psychological phenomena (Funder & Ozer, 2019). Moreover, our effect size is consistent with neuroticism’s general association with mental health (r = 0.27) as revealed in a meta-synthesis encompassing hundreds of previously observed effect sizes (Strickhouser et al., 2017).
Personality traits and diagnosis timing
Assuming that there were no secular trends in how personality traits are related to CMDs, we considered the associations between TLD – in other words, remission duration – and the Big Five personality domains as evidence that CMDs or related processes may contribute to personality trait change. As reviewed above, existing evidence on the presence, strength, and duration of such effects is sketchy at best, whereas our study was particularly well powered to test them due to a huge sample, very long study period (17 years), and multiple assessment methods (self-reports, informant reports, medical diagnoses).
Across all CMDs and both trait assessment methods, we found a trend for longer remission to be linked with lower neuroticism. Although TLD accounted for a smaller amount of variance in the trait than C, its non-linearity offered additional insights. Our findings suggested that neuroticism could initially spike following a diagnosis yet not return to its set-point within a short or even medium term; instead, its increased level may persist for over a decade and only gradually decrease to baseline levels as mental health issues become less acute and professional help is no longer sought. In the sociogenomic model (Roberts, 2018) terms, these effects are clearly not elastic because they could last for several years, sometimes over a decade. But neither are they entirely pliable because they do gradually reverse. In terms of effect sizes, while those last diagnosed around the time of personality assessment scored about 0.75–0.85 SDs higher than undiagnosed people, those last diagnosed over a decade before trait assessment scored about 0.40–0.60 SDs higher than the undiagnosed people, on average. This is consistent with an average of about 0.15–0.45 SDs reduction in neuroticism during this period.
For other trait domains, the effects were smaller or non-existent. For extraversion and conscientiousness, more recent depression diagnoses were associated with slightly lower average trait scores, suggesting that these trait domains, too, may respond to diagnosable mental health issues or related problems. Our findings that depressive disorders, but not anxiety disorders, are associated with changes in extraversion and more broadly with conscientiousness are consistent with Karsten et al. (2012), and this trend was also observed across all supplementary analyses. Our data shows that it could typically take over five years for extraversion to return to baseline levels, while conscientiousness may take slightly longer, yet still less than ten years. Finally, AUD timing’s association with lowered conscientiousness only appeared for self-reports, which might reflect measurement error or bias in ratings rather than real, observable trait change.
Moreover, the comparison of non-linear and linear models suggests that linear models sometimes (particularly for neuroticism) fell short in capturing the nuanced relationships between variables as effectively as non-linear GAMs, which offered additional and important insights. Because the relationship of mental health and personality traits is far from straightforward, linear models could serve as a starting point, and we recommend a shift towards non-linear modelling techniques that are better suited to address the complexities inherent in human behaviour – at least if and when sufficiently powerful data are available.
Baseline personality traits and CMDs
Assuming that these data suggest CMDs themselves or related problems can have medium- (extraversion, conscientiousness) or even longer-term (neuroticism) effects on personality traits, this suggests that the most accurate estimates of the ‘premorbid’ trait levels associated with CMD risk may be those of people last diagnosed over a decade (or of course, sufficiently long before being diagnosed, since the conditions often emerge earlier than people seek help). Among those diagnosed nearly two decades ago, at least most of the ostensible trait-lowering effect of mental health issues are likely reversed, whereas those last diagnosed less than a decade ago may still have trait levels affected by their mental health issues. If so, both our model intercepts and Figures 1 and 2 suggest that the risk of developing a diagnosed CMD is associated with about 0.50 SDs higher neuroticism, on average, regardless of the trait assessment method. The risk of a CMD diagnosis also increases with slightly higher openness (about 0.15 SDs), although it may reflect the difference among those who seek help versus those who do not. Because our Big Five scores were nearly orthogonal by design, these effects are likely additive and not mutually confounded – unlike in typical studies that rely on non-orthogonal Big Five assessments (Anni et al., 2025).
An alternative explanation
We note that there is an alternative explanation for the associations between TLD and personality traits. Specifically, the remission duration may be seen as another marker or manifestation of the general risk of developing mental health problems: those with higher risk could only manage to stay diagnosis-free for shorter periods. And this general risk may correlate with personality traits either because they have shared causes or lie on the same spectrum, or because personality traits predispose to mental health risk. Although we controlled for another marker of the risk, C, in our models, this adjustment may have been imperfect, leaving some of the underlying risk for TLD to capture.
To tease the two explanations apart, a longitudinal study would be needed that lasts for at least a decade (given the possibility of long recovery as indicated by our results) and assesses both personality traits (preferably using both self- and informant-reports) and CMDs repeatedly at multiple time-points (to capture trends in personality traits in response to CMDs that could start and end at any point). Also, the study would need to be based on a large sample for reliable parameter estimates, given the need for highly parametrized time-series models and the fact that most people do not experience CMDs most of the time. To our knowledge, no such study yet exists.
Self- and informant-reports
The self-reports and informant-reports generally matched in terms of how diagnosed and undiagnosed people differed in personality traits and in how the number and timing of diagnoses tracked the traits. This could mean that personality trait assessment is relatively robust even for those with a recent/many CMD diagnoses. On the one hand, this could be because personality trait self-ratings are relatively less influenced by current emotions and cognitions and more based on people’s stable views of themselves as they are generally – and the same is true for informant reports that may be less sensitive to shorter-term changes by design (informants may have less information about their targets’ short-term ups and downs than the targets themselves). On the other hand, to the extent that both self- and informant-reports did similarly pick up the CMD-related trait trends, it suggests that personality traits may truly track with, and possibly to some extent respond to, CMDs. From the perspective of personality assessment, this further validates the use of informant reports as an equal and complementary assessment method (Carlson et al., 2013; Connelly & Ones, 2010; Oltmanns et al., 2020).
Although we prioritized results that converged between self- and informant reports, it is important to acknowledge that such agreement does not inevitably represent individuals’ true personality scores. Both types of reports are shaped by subjective perceptions and can be influenced by interpersonal dynamics. While greater familiarity may enhance accuracy, high levels of liking can introduce positivity bias (Wessels et al., 2020), and shared self-protective tendencies in close relationships may lead both parties to overestimate strengths or downplay weaknesses (Vazire, 2010). In such cases, agreement may reflect shared bias rather than objective trait convergence, limiting the extent to which convergence alone should be taken as validation – a question that may warrant further research. We were cautious not to overinterpret traits where self-other discrepancies emerged. However, such divergence may reflect meaningful differences in perspective rather than error. For example, self-reports may better capture purportedly internal traits like neuroticism, whereas informant-reports may be more accurate for observable traits such as extraversion and conscientiousness (Carlson et al., 2013; John & Robins, 1993; Vazire, 2010; we note, however, that evidence to back these intuitions is sketchy, and some of the well-known findings have been disowned by their authors; Rohrer et al., 2021). As such, the observed discrepancies in our results (i.e. results on conscientiousness) may shed light on how and why these differences arise. Nevertheless, although two aligned but inherently flawed assessments do not logically validate each other, trait variance on which raters agree is far more likely to be valid than variance unverified by another method in general (e.g. Campbell & Fiske, 1959; Lieberman et al., 2016; Olino & Klein, 2015; Thielmann et al., 2017).
In sum, we’d like to emphasize that findings transcending a single method are much more robust and credible than the (typical) findings only relying on a single assessment method. We feel many psychologists may not be routinely aware of the need to validate findings across methods.
Strengths and limitations
The study’s strengths include a huge population sample, unusually long (17 years) high-frequency (diagnoses were recorded exactly when people sought help, so there were no typical researcher-imposed assessment schedules) time-series of clinical diagnostic records (allowing for accurate and non-linear trends in relation to personality traits), two methods of personality assessment, and a comprehensive personality test that is psychometrically superior to many other Big Five assessment tools.
Although the study had an intensive longitudinal design in terms of assessing CMDs, the main limitation is the single-time-point trait personality assessment. While our findings suggest scar effects through non-linear relationships across TLD intervals (suggesting personality changes following disorders), the cross-sectional nature of personality measurement means we cannot directly observe the process of change within individuals. Ideally, the study would also have contained multiple (ideally at least yearly) personality trait assessments starting before CMD diagnosis onset, which would have allowed better distinguishing between the effects of CMDs on personality traits and remission time reflecting underlying CMD risk, despite controlling for the number of diagnoses accumulated.
Another limitation is that personality traits tend to show the most change during young adulthood (ages 18–34), as traits tend to increase in a maturity-related pattern (Roberts et al., 2006). Since our primary analyses focused on middle and older adulthood, future research is needed to examine whether and how CMDs diagnosed earlier in life contribute to personality trait change during this key developmental period. We note, however, that the association patterns held similarly among younger and older adult participants in our Supplemental Analyses.
Diagnostic reliability assessed in field trials has been found to be low, often showing only slightly better than chance agreement (e.g. Freedman et al., 2013), far below the reliability ideally expected of medical diagnoses. The diagnoses also face validity issues (Barglow, 2013). For example, they often fail to capture comorbidity patterns (Zimmerman & Mattia, 1999), are influenced by clinicians’ theoretical orientations (Kim & Ahn, 2002), and their categorical nature obscures the dimensional nature of psychological difficulties (Krueger & Markon, 2006). Additionally, they typically overlook the heterogeneity problem within diagnostic categories, where patients with the same diagnosis may present vastly different symptom profiles and etiological factors (Fried & Nesse, 2015; Kapur et al., 2012; Zimmerman et al., 2015). Ideally, participants would have been repeatedly (yearly) assessed with structured clinical interviews carried out by trained specialists. Unfortunately, both ideals (high-density personality and reliable CMD assessments in a large population sample) are difficult to achieve in practice, so we may have to accept the limitations for now.
Conclusions
Using a large sample, we found that neuroticism is the primary trait associated with CMD diagnoses in the population, with diagnosed individuals exhibiting approximately 0.50 SDs higher neuroticism. Also, diagnosed people were slightly more open, on average. Among those diagnosed, higher neuroticism was associated with more diagnoses, suggesting that neuroticism is a marker of the severity of mental health issues rather than simply predisposing people to seek help for poor mental health. Openness, however, did not track the number of diagnoses, suggesting it may help people to seek help rather than index disorder severity. Our key finding was that those in longer remission from CMDs tended to have lower neuroticism, suggesting that CMDs may contribute to relatively long-term trait change that takes multiple years to gradually revert. Likewise, we found evidence that depression may lower extraversion and conscientiousness for some years, but with smaller average effects. Importantly and uniquely, these results were validated by personality trait informant ratings, suggesting they were not self-report artefacts.
Supplemental Material
Supplemental Material - Associations of common mental disorders with personality traits over a 17-year period
Supplemental Material for Associations of common mental disorders with personality traits over a 17-year period by Y Zhang, Michelle Luciano, Estonian Biobank Research Team, Uku Vainik, René Mõttus in European Journal of Personality
Footnotes
Acknowledgments
We thank Brent Roberts, Timothy Bates, and Wendy Johnson for their critical suggestions. Data analysis was carried out in part in the High-Performance Computing Center of University of Tartu. We thank the Estonian Biobank Research Team (Mait Metspalu, Andres Metspalu, Lili Milani, and Tõnu Esko) for contributing to data collection and curation, and all biobank participants for their participation.
Declaration of conflicting interests
The author(s) declared no potential conflicts of interest with respect to the research, authorship, and/or publication of this article.
Funding
The author(s) disclosed receipt of the following financial support for the research, authorship, and/or publication of this article: This work has been funded by Estonian Research Council’s grants PSG656 (Uku Vainik), PSG759 (Uku Vainik), PRG1291 (Tõnu Esko), and PRG2190 (René Mõttus). The research was conducted using the Estonian Center of Genomics/Roadmap II funded by the Estonian Research Council (project number TT17).
Open science statement
The data cannot be publicly shared because it is part of a large, ongoing national biobank study and is subject to national regulations, specifically the Human Genes Research Act, which ensures the protection of participant anonymity. However, researchers may request access to the data, which will be granted pending approval by a research and ethics committee. For more information, visit https://genomics.ut.ee/en/content/estonian-biobank. This study was not preregistered. The R code, personality assessment, and supplement are available at ![]() .
.
Supplemental Material
Supplemental material for this article is available online.
References
Supplementary Material
Please find the following supplemental material available below.
For Open Access articles published under a Creative Commons License, all supplemental material carries the same license as the article it is associated with.
For non-Open Access articles published, all supplemental material carries a non-exclusive license, and permission requests for re-use of supplemental material or any part of supplemental material shall be sent directly to the copyright owner as specified in the copyright notice associated with the article.