
Abstract
Personality inventories are predominantly curated using factor analytic approaches. Indicators capturing common and thus redundant variance are preferentially selected, whereas indicators capturing a large proportion of unique variance outside the broad trait domains are omitted from further research. Even recent research dealing with lower-level personality traits such as facets or nuances has invariably relied on inventories founded on this factor analytic approach. However, items can also be selected to ensure low instead of high communality amongst them. The expected predictive power of such item sets is higher compared to those compiled to capitalize on the indicators’ redundancy. To investigate this, we applied Ant Colony Optimization (ACO) to select personality-descriptive adjectives with minimal inter-item correlations. When used to predict the frequency of everyday life behaviors, this ‘crude-grit’ set outperformed a traditional big-five item set and sets of randomly selected adjectives. The size of the predictive advantage of the crude-grit set was generally higher for those behaviors that could also be predicted better by the big-five item set. This study provides a proof-of-concept for an alternative procedure for compiling personality scales, and serves as a starting point for future studies using broader item sets.
Introduction
Factor analytic approaches to personality description and assessment have been an essential driving force for personality psychology over the last 70 years. In general, personality factors, such as the big-five or other similarly extracted personality factors (e.g., HEXACO, Ashton et al., 2004) represent very broad hierarchical trait domains and thereby provide a somewhat unifying structure for the strongest, most salient, and universal personality traits.
Furthermore, these personality factors have been shown to predict many relevant life outcomes, such as health, well-being, or academic and occupational achievement (e.g., Barrick et al., 2001; Barrick & Mount, 1991; Ozer & Benet-Martinez, 2006; Poropat, 2009). Recent research has shown that these life outcomes can be better predicted by focusing on more specific traits, such as personality facets or nuances (Mõttus et al., 2017; Seeboth & Mõttus, 2018; Stewart et al., 2021). However, the true potential of predicting relevant life outcomes with these narrower traits is arguably limited due to personality measures being designed to predominantly measure five (or six) broad trait domains. As a consequence, items have been selected to correlate highly with each other and might thus capture content redundantly (i.e., shared trait domain variance). The full breadth of personality traits is likely to be underrepresented.
In the current study, we highlight conceptual and psychometric issues of factor analytic approaches to item selection. We illustrate an alternative procedure for compiling a personality instrument in which item overlap is minimized. The predictive accuracy of this new item set is measured with respect to a broad range of 395 behavioral act frequencies. Its predictive accuracy is then compared to that of a traditional big-five scale and to that of randomly selected item sets.
Scale Construction and Item Selection
The focus on a small set of few trait domains and factor analyses (Cattell, 1945; Fiske, 1949; Goldberg, 1990; John et al., 1988) has shaped the way most personality inventories are built. Based on the factor analytic approach, item selection is mainly driven by the goal to maximize internal consistency amongst groups of indicators. Psychologists tend to select items that load strongly on target factors (i.e., maximize main loadings) and weak on all other factors (i.e., minimize cross-loadings) (Goldberg, 1993). This approach does not account for smaller traits that represent interstitial variance and fall in between the few dimensions or represent blends thereof (Clark & Watson, 2019; see also AB5C model; Hofstee, 1994). Notably, items with cross-loadings are usually discarded during scale construction. Furthermore, homogenous and potentially redundant indicators are favored; indicators capturing unique variance which might contribute to covered content breadth are excluded (Epstein, 1984).
A more differentiated description and assessment of personality traits within the trait-domain hierarchy is possible by focusing on lower-level traits, such as facets or nuances. Facets are commonly defined as narrower personality traits located directly below the trait domains (Costa Jr. & McCrae, 1995) and are represented by subscales within an inventory. Personality nuances are seen as even narrower traits, which are often operationalized by single items in personality inventories (McCrae, 2015; Mõttus et al., 2017). These additional hierarchy levels allow for a more differentiated perspective on personality traits. Yet, they are still limited to capturing variance within the few broad trait domains, as they have been introduced in a top-down manner. Thus, the expansion of the personality space is restricted to the five dimensions at the apex of the hierarchy. As a result, indicators capturing variance outside the domains are not included in measures representing the lower levels of the personality trait hierarchy as well.
While this factor analytic approach provides a unifying framework for personality trait research, the prediction of relevant life outcomes or behaviors is limited due to the focus on the big few (Mõttus et al., 2020). Therefore, the following section presents a review on how prediction is affected by item selection.
Prediction and How it is Affected by Item Selection
Predictions improve, when the dimensionality of the predictor set increases. This relationship is supported by studies showing the incremental predictive power of personality facets over factors (Anglim et al., 2020; Paunonen, 1998) or nuances over facets (Seeboth & Mõttus, 2018; Stewart et al., 2021). The latter findings suggest that relations between criteria and personality traits (or facets) are driven by narrow personality nuances because they contain unique information. However, as nuances have so far been conceptualized within an implicit higher-order model of personality, empirical results do not entail how explained variance changes with the selection strategy for indicators.
A recent study by Saucier et al. (2020) provides first insights about how different item selection strategies affect predictive power of personality scales. They found higher predictive performance for personality measures developed to measure a large number of relatively independent dimensions compared to narrowly arranged big few measures. Nevertheless, these high-dimensional item sets have still been extracted based on factor analytic approaches. Therefore, in this manuscript we aim to select a broad set of indicators via an item sampling algorithm, moving beyond the factor analytical approaches on personality.
The Present Study
The goal of the present study was to examine how an item selection strategy that prioritizes low redundancy compares to alternative selection strategies in terms of predictive power.
A first item set, representing the factorial approach to personality, consisted of 40 adjectives referred to as the big-five mini-markers (Saucier, 1994). The items of this big-five set were selected to maximize inter-item correlations amongst indicators representing the same trait domain (high internal consistency) and to minimize inter-item correlations amongst indicators representing different trait domains (simple structure).
A second set of personality-descriptive adjectives was selected to minimize inter-item correlations as well as the standard deviation amongst those. We thus strived to maximize unique variance of each item belonging to the set. Minimizing the variance in inter-item correlations ensured that items were equidistantly dispersed and no clusters of redundant items emerged. Given these criteria of item selection, we referred to this set as the crude-grit set. It was used to address the key question of this manuscript – what if there were no personality factors?
For comparison, further adjective sets were randomly selected. These random sets did not adhere to the factorial approach by maximizing inter-item correlation within one specific domain, nor did they pursue the crude-grit approach by minimizing inter-item correlations. Note that the items were sampled from a large item pool of personality-descriptive adjectives likely containing a proportionally larger number of big-five than non-big-five related adjectives. Thus, the random sets were expected to constitute a compromise between the big-five set and the crude-grit set. This means, although latent factors could be present in these random sets, we expected them to be weaker. As such, the items in the random sets should have more unique variance than those in the big-five set.
We were interested in the general predictive power of the different adjective sets. Thus, a large set of behavioral statements as outcome variables was used instead of pre-selected relevant outcome variables. We compared the overall explained variance in these behavioral statements (R 2 ). As the R 2 of the BRIs was not expected to equal zero even in completely random data, we used reshuffled data to estimate a baseline for explained variance. All sets were expected to perform better than this baseline, because it should only represent random covariances between variables with no underlying ‘true’ covariances. Further, we expected the crude-grit set to perform better than the big-five set as well as the random sets due to items capturing more unique than shared variance. Following this reasoning, we also expected the random sets to perform better than the big-five set. In turn, lowest explained variances were expected for the big-five set, because its items had been selected to be redundant within factors and their unique variance was minimized. The hypotheses regarding the predictive performance of differently selected sets were not pre-registered.
Methods
Sample
We used data from the Eugene-Springfield Community Sample (ESCS; https://dataverse.harvard.edu/dataverse/ESCS-Data). The ESCS was collected by the Oregon Research Institute (ORI) starting in 1993 and involved volunteers who were willing to complete questionnaires over a period of 5–10 years. We selected the sample of participants that provided responses on the personality-descriptive adjectives in 1995 and on behavioral act frequencies in 1997. The final sample therefore consisted of 621 participants (f = 364, m = 257) with a mean age of Mage = 52 years (SDage = 13). The majority of our sample (96.6%) self-identified as Caucasian. Of the participants, 28.2% reported having obtained some college degree and 24.5% reported having obtained a post-college degree. Across the measures used in this study, about 0.3% of the responses were missing values. We imputed missing values using the K-nearest neighbor (KNN) procedure, namely, searching for the k = 5 closest samples based on Euclidean distance and then imputing the mean response of those neighbors. This procedure centers and scales the data automatically. Therefore, whenever descriptive statistics (mean, variance, skew) are reported, they relate to the raw data.
Instruments
Person Descriptive Adjectives 525
The 525 adjectives of the Person Descriptive Adjectives list were used as a representation of the personality item universe. Using such a broad adjective list facilitates the extension of the big-five framework. Additionally, by using single adjectives as personality indicators rather than statements including an action, we minimized the risk of predictor-criterion contamination. The Person Descriptive Adjectives 525 (PDA 525) consists of 500 adjectives that have been rated to be most common in use (Saucier, 1997), as well as 25 additional adjectives belonging to the 40 mini-markers (more information given in the Item Selection section) not already included within the 500 adjectives. Participants rated these person descriptive adjectives on a 7-Point Likert scale ranging from 1 ‘very inaccurate’ to 7 ‘very accurate’ as a description of themselves.
Behavioral Report Inventory (BRI 400)
To investigate the predictive power of the different adjective sets, the 400 items of the Behavioral Report Inventory (Goldberg, 2009) were used as criteria. Participants rated statements about everyday life behavior (e.g., ‘drove a car’ or ‘paid someone to polish my shoes’) in terms of the frequency with which they perform said behavior on a 5-Point Likert scale ranging from 1 ‘never in my life’ to 5 ‘more than 15 times in the past year’. We excluded five sex-specific statements (e.g., ‘had a mammogram’, ‘did a testicular self-examination’), because the prediction of these could be inflated by sex differences in the responses to some adjectives (e.g., ‘feminine’).
Item Selection
Pre-Selection
The PDA 525 list contains non-personality related adjectives, such as physical descriptors (e.g., ‘old’, ‘tall’) or adjectives that are mainly used to describe life circumstances (e.g., ‘homeless’, ‘poor’). Therefore, it was necessary to evaluate the suitability of the 525 adjectives as self-report indicators in personality assessment before selecting different item sets from the PDA 525. Accordingly, 10 experts (master students of psychology (n = 5) and research assistants in the department of individual differences and psychological assessment (n = 5)) rated each of the 525 adjectives as suitable or not (yes/no). Inter-rater reliability for the 10 raters was good (α = .95). 140 adjectives rated as unsuitable for self-reported personality assessment by at least half of the raters were excluded. After the expert rating, adjectives that had an antonym included in the list were further excluded (e.g., we excluded the word ‘unintellectual’ because the word ‘intellectual’ was already included in the list). This prevented the parallel selection of two adjectives which only differ due to their reversed meaning. The pre-selection procedure yielded a set of 360 adjectives. We will refer to this cleaned list as PDA 360 in the remainder of this manuscript.
Big-Five Set
To represent the big-five personality factors, we selected 40 adjectives that Saucier (1994) extracted from Goldberg’s 100 big-five markers. These adjectives, also referred to as big-five mini-markers, are included in the PDA 525 (and our PDA 360). They are assumed to have simple structure on the corresponding big-five factors, with each factor being represented by eight adjectives. They include six antonyms (‘uncreative’, ‘unenvious’, ‘unintellectual’, ‘unsympathetic’, ‘inefficient’, ‘disorganized’), which were kept in order to use the full set of big-five mini-markers in further analyses.
‘Crude-Grit’ Set
For the selection of the crude-grit set, Ant Colony Optimization (ACO; see Olaru et al., 2019) was applied. Ant Colony Optimization is a metaheuristic algorithm that can be used to identify combinations of items that maximize or minimize a given criterion (e.g., minimize inter-item correlations and the standard deviation of the frequency distribution of these correlations). The algorithm selected a set of 40 adjectives from the PDA 360, which would have minimal inter-item correlations and a minimal standard deviation of inter-item correlations. The latter criterion was included in the optimization function to ensure that the final selection did not include isolated pairs of highly correlated adjectives, but instead low correlated adjectives overall. The exact optimization function is provided in the online supplement at OSF https://osf.io/je6us/.
As the aforementioned item selection approach is probabilistic, it does not necessarily return the same item set across independent runs. We thus ran ACO eight times. The eight selected crude-grit sets had an average item overlap with each other of Moverlap = 50% (SDoverlap = 7%). Although the eight runs shared on average only half of their selected adjectives, both optimization criteria were fit similarly well by all solutions (indicated by equally high values for the overall optimization criterion (φoverall)). Mean absolute inter-item correlation (criterion one; φ1) of all eight extracted sets varied only between .08 and 09; the standard deviation of the inter-item correlations (criterion two; φ2) varied between .07 and .08. For further analyses, the set which had the best overall optimization criterion was retained as the final crude-grit set.
Random Sets
For comparison, 40 adjectives from the PDA 360 adjective list were randomly extracted a thousand times. Results for the random sets will be reported as the averaged results over the 1000 adjective sets. Based on the average prediction amongst the 395 behavioral act frequencies (i.e., BRIs), we extracted the least and most predictive random set out of the 1000. The least predictive set can be interpreted as the expected lower-bound of prediction in our dataset. In contrast, the most predictive set can provide an indication of how an item set specifically designed to predict the behavioral act frequencies (i.e., an empirical keying approach) would perform.
Reshuffled Sets (Baseline Prediction)
To estimate the explained variance that could be expected even for uncorrelated predictors and outcomes given the available data, we used a reshuffling approach. Specifically, we used the 1000 randomly selected item sets and randomly reshuffled the responses on each selected adjective. This would ensure that the response distribution was maintained for each adjective, while eliminating any potential correlations with the outcomes. We then used the 1000 reshuffled adjective sets to predict the BRIs, and calculated the average explained variance as the baseline for prediction.
Comparison of Adjective Difficulty
The lexical approach not only presupposes that differences between persons are reflected in language (i.e., humans invented adjectives to refer to relevant personality characteristics), but also that a sufficiently large number of persons understand the meaning of these adjectives. An unknown proportion of personality-descriptive adjectives might be uncommon, hard to understand, or obscure. One risk of the crude-grit approach is that it might predominately select those adjectives, with low correlations arising from being a lack of understanding. To judge language complexity of our sets, we used data from Condon et al. (2022) who collected short definitions for a list of 2818 adjectives. These adjectives were presented to 1572 participants, who had to choose the corresponding term from a set of four terms. The percentage of correct responses for each adjective was then calculated. Based on these ratings, we calculated the mean percentage of correct answers across the 40 selected adjectives for each set.
Statistical Analysis
All statistical analyses were run in RStudio with R version 4.0.3 (RStudio Team, 2020). Correlational analyses were conducted using the ‘psych’ package (Revelle, 2020); for multiple regression analyses, we used the ‘stats’ package (Bolar, 2019). For item sampling, we used the ACO algorithm by Olaru et al. (2019) with an adapted fit-function (see OSF https://osf.io/je6us/).
After the initial item selection, exploratory factor analyses were conducted to (a) inspect how much variance in the sets could be explained by five factors and (b) check how well the crude-grit set met our criteria of capturing variance outside and between the big-five set. To address the latter, Dwyer’s (1937) method of extension analysis was applied. In this type of exploratory factor analysis, first the ‘core variables’ (in our case: the big-five adjectives) are factorized, and then the loadings of the ‘extension variables’ (in our case: the crude-grit adjectives) are calculated for the aforementioned extracted factors. Thus, the communality of the crude-grit adjectives, when they are projected into a factorial space which was produced by the big-five adjectives, was extracted. We used these communalities as an index to determine how well each adjective can be represented by the extracted factors.
Overview of calculations for the random and reshuffled sets.
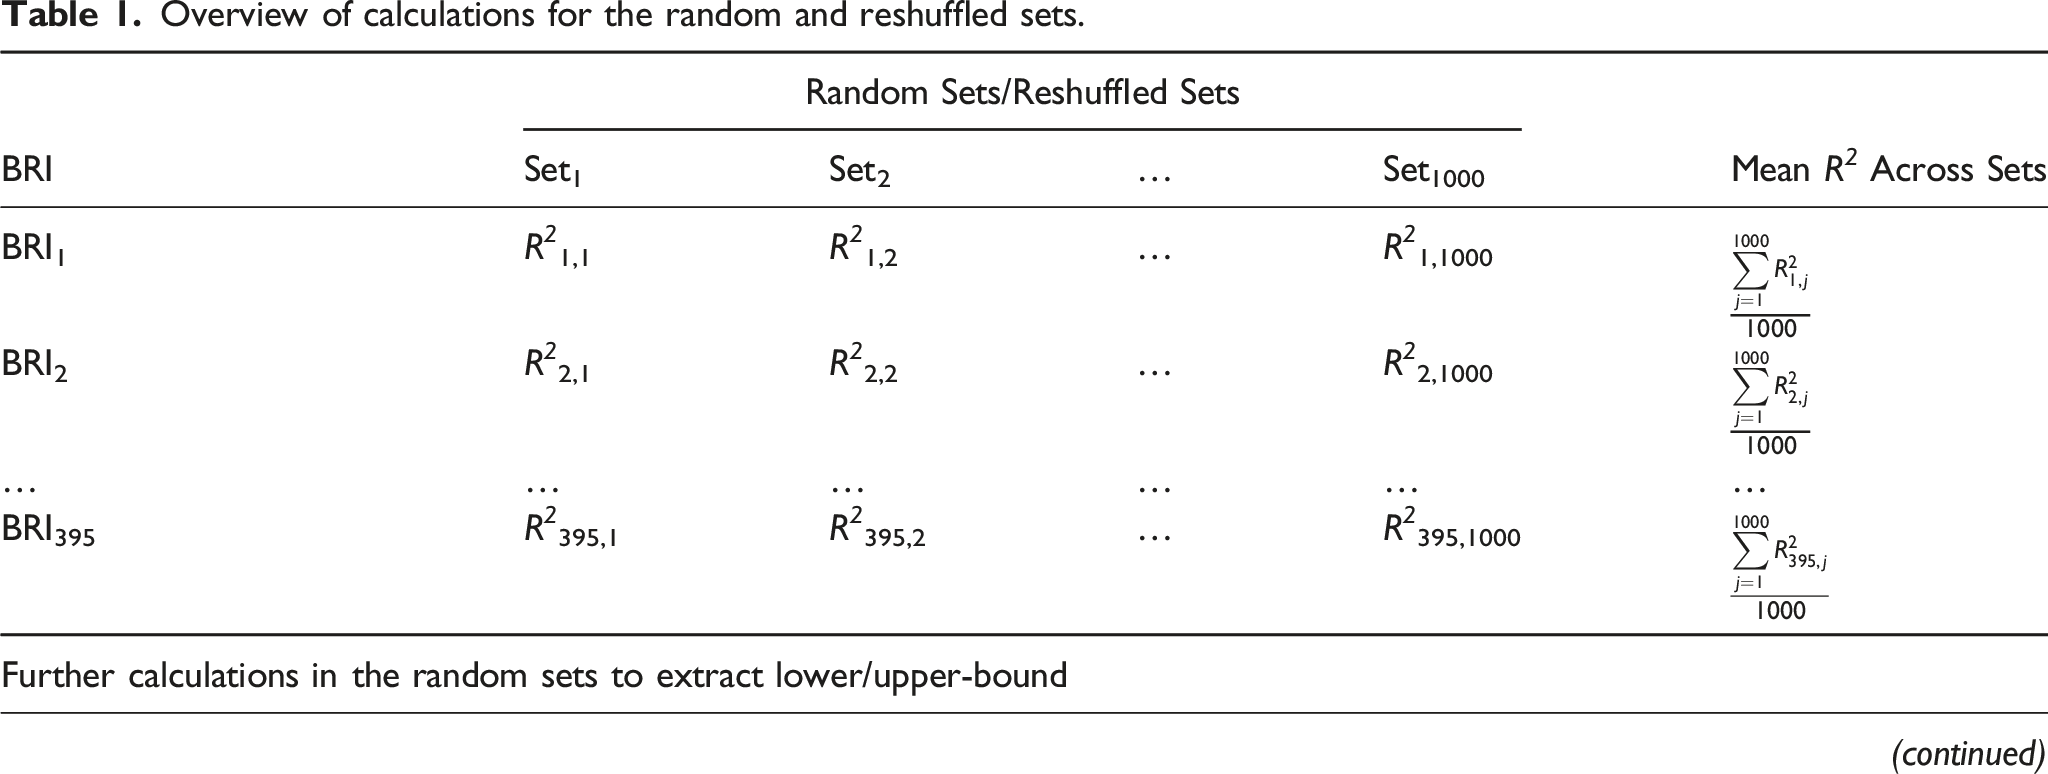
For the reshuffled sets, we followed the same procedure as we did for the random sets; we calculated 1000 regressions per BRI and averaged the R 2 values across sets. This value served as a baseline index for prediction, as we expected the R 2 to be randomly higher than zero. Note that despite the random sets acting as a suitable index for comparison when the adjective selection is performed randomly, only the reshuffled sets are capable of providing the baseline index for prediction, which results from completely random data.
In some research on the predictive accuracy of personality nuances, the residual variance of items after extracting latent factors is used for prediction (e.g., Mõttus & Rozgonjuk, 2021). We did not do so because it would disadvantage the big-five set compared to the crude-grit set. Partialling out factor variance would come at the cost of predictive power for the big-five set as the factor variance is assumed to drive the associations of a big-five set with behavioral act frequencies. In contrast, the crude-grit set should remain relatively unaffected, due to a lack of factors.
Results
Descriptive Statistics
Descriptive statistics for the different selected adjective sets.
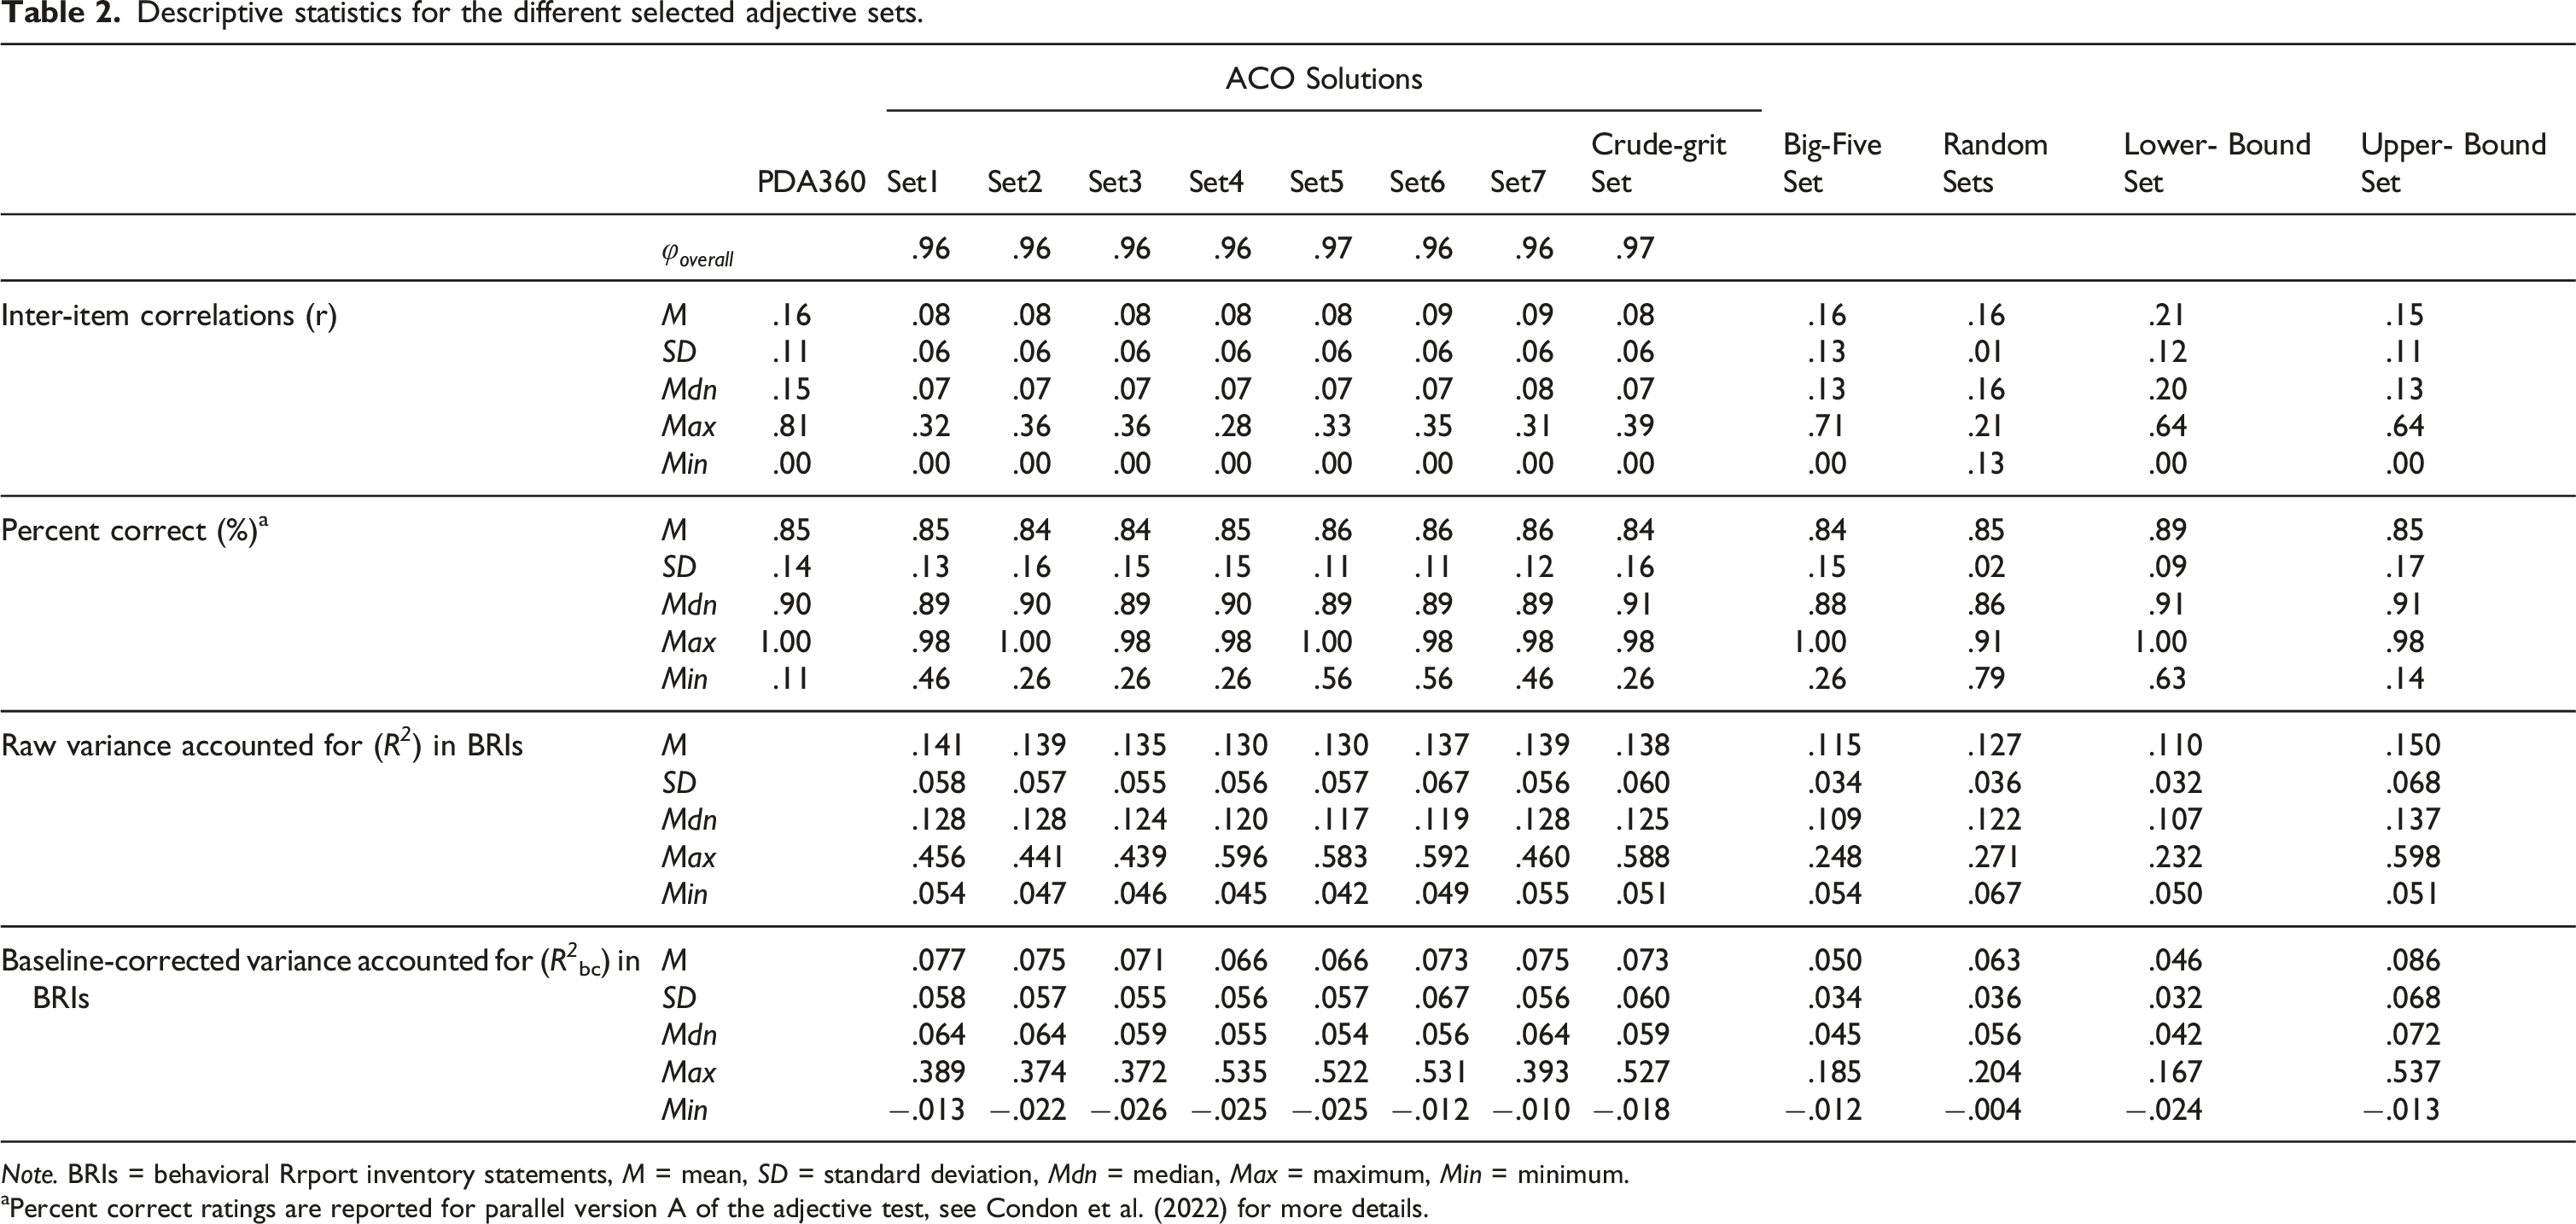
Note. BRIs = behavioral Rrport inventory statements, M = mean, SD = standard deviation, Mdn = median, Max = maximum, Min = minimum.
aPercent correct ratings are reported for parallel version A of the adjective test, see Condon et al. (2022) for more details.
Inspecting the word difficulty ratings from the data provided by Condon et al. (2022) for the big-five, the crude-grit and the random sets, average percentage of correct answers within a set did not differ between sets (see Table 2). This means, the selected crude-grit item set was not predominantly made up of uncommon or complex words.
Factor Analysis of Item Sets
After item selection, we conducted a parallel analysis on the eigenvalues for the big-five set, the crude-grit set, and the random sets. Within a parallel analysis, eigenvalues for resampled data are calculated on default, so we did not include the reshuffled sets in this step of the analyses. Eigenvalues were extracted from a maximum likelihood exploratory factor analysis with five correlated factors and are presented in Figure 1. The scree plot for each of the three sets is presented above the curve for resampled data. Although the crude-grit set was selected to have inter-item correlations near zero (and thereby pushed to have eigenvalues near zero), extracting an indicator set without any covariances among the indicators was not possible. However, the cumulative explained variance by five factors was much smaller for the crude-grit set (19.2%) than it was for the big-five set (41.4%) or the random sets (mean cumulative variance for the 1000 random sets was M = 35.5% with SD = 1.6%, histogram available in the online supplement at OSF https://osf.io/je6us/). Eigenvalue curve for the different item sets as well as for resampled data, as calculated in a parallel analysis. Only eigenvalues for the first 10 factors are presented in this figure. Eigenvalues for the random sets are averaged among the 1000 eigenvalues that have been extracted for all random sets. All eigenvalues are presented before rotation.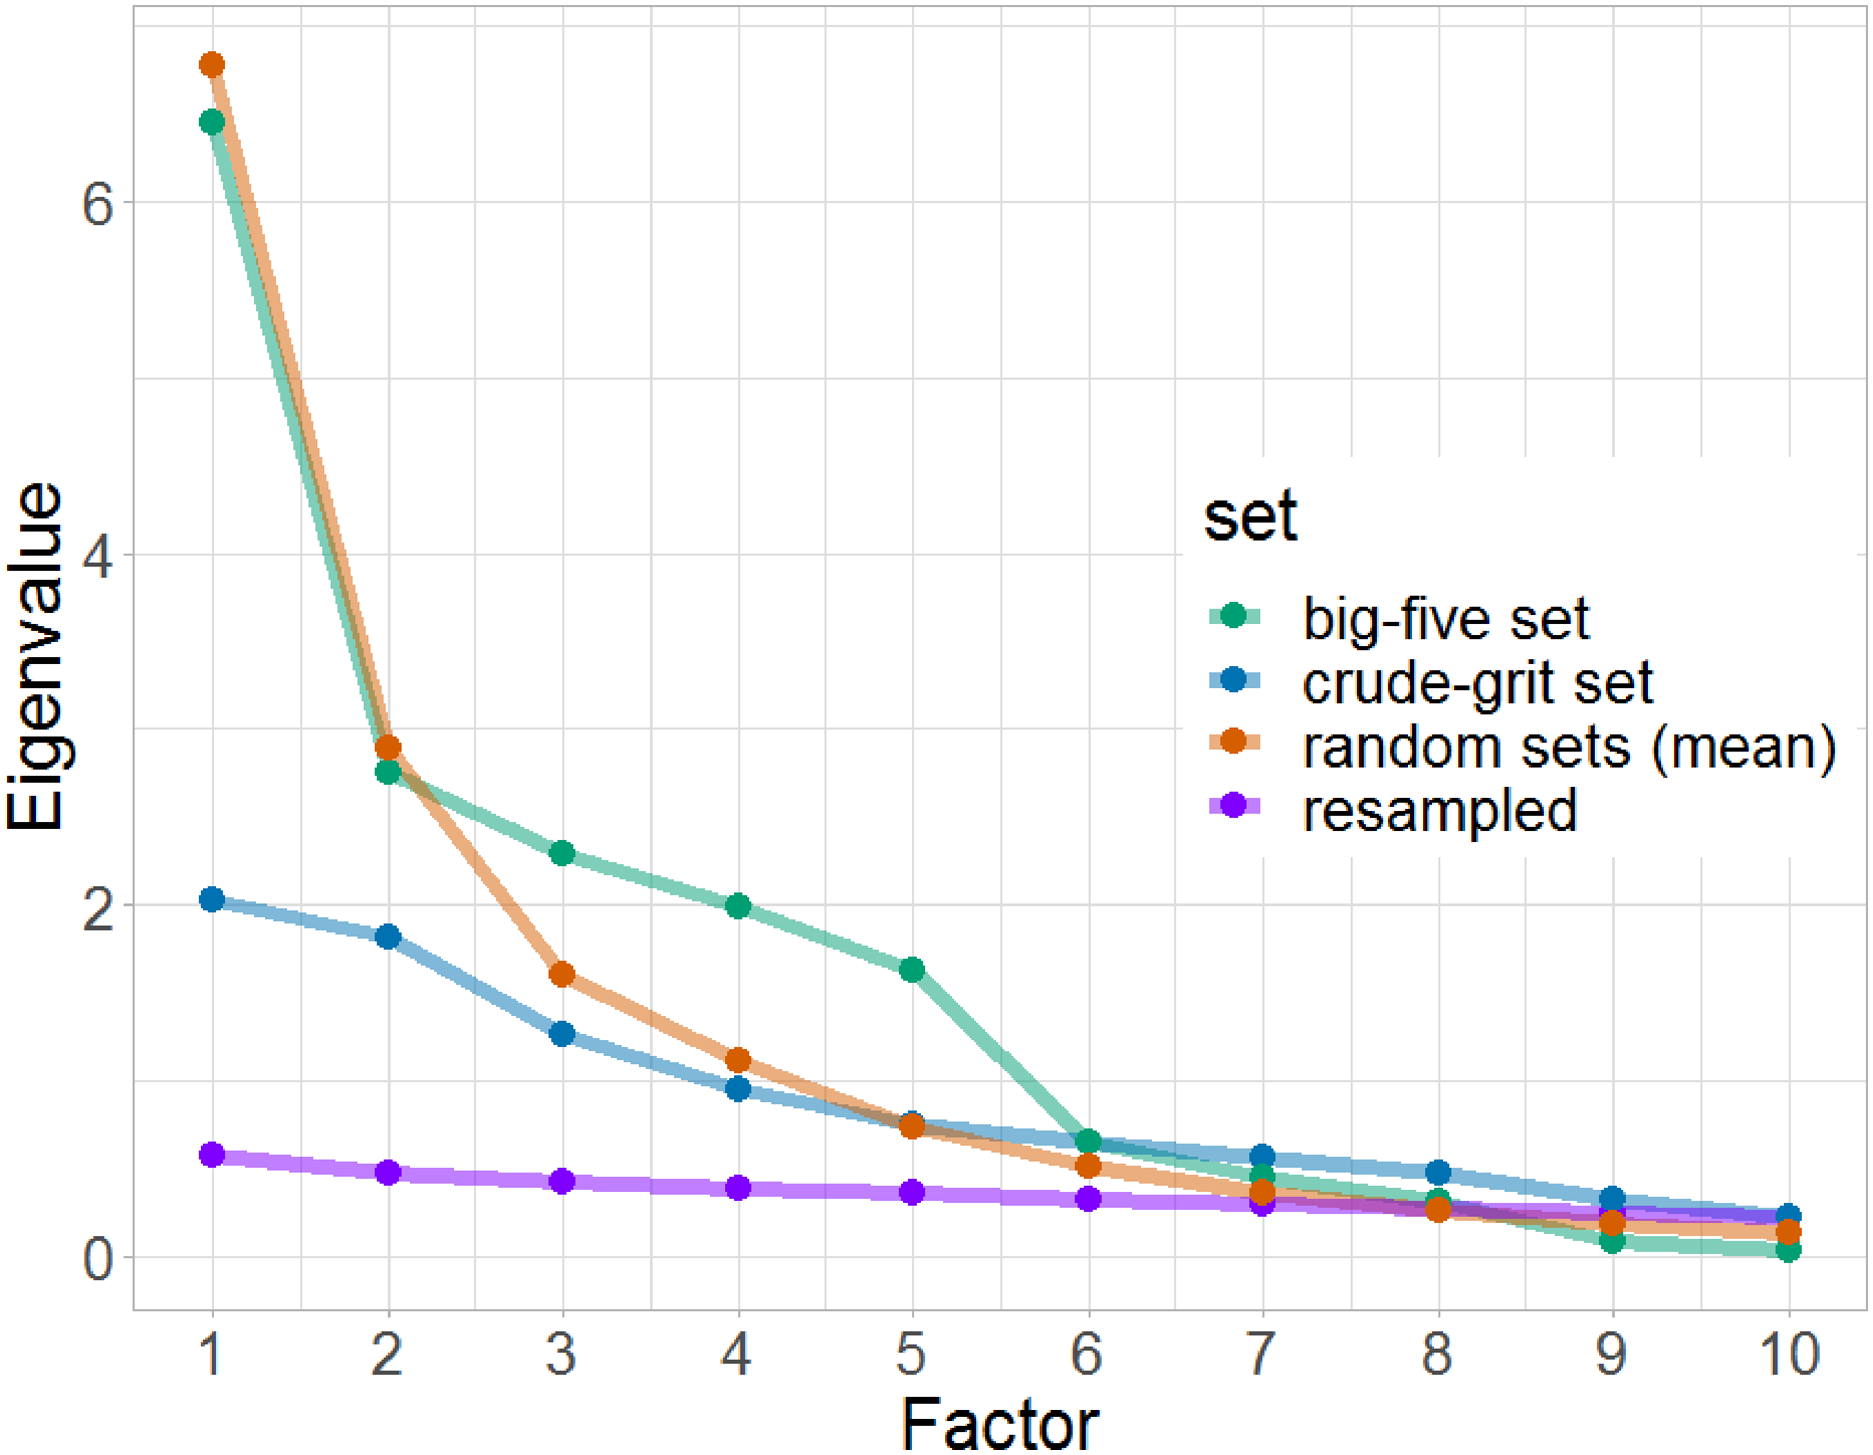
Loadings from a maximum likelihood exploratory extension factor analysis with five correlated factors for 40 big-five adjectives (core variables) and 40 crude-grit adjectives (extension variables).
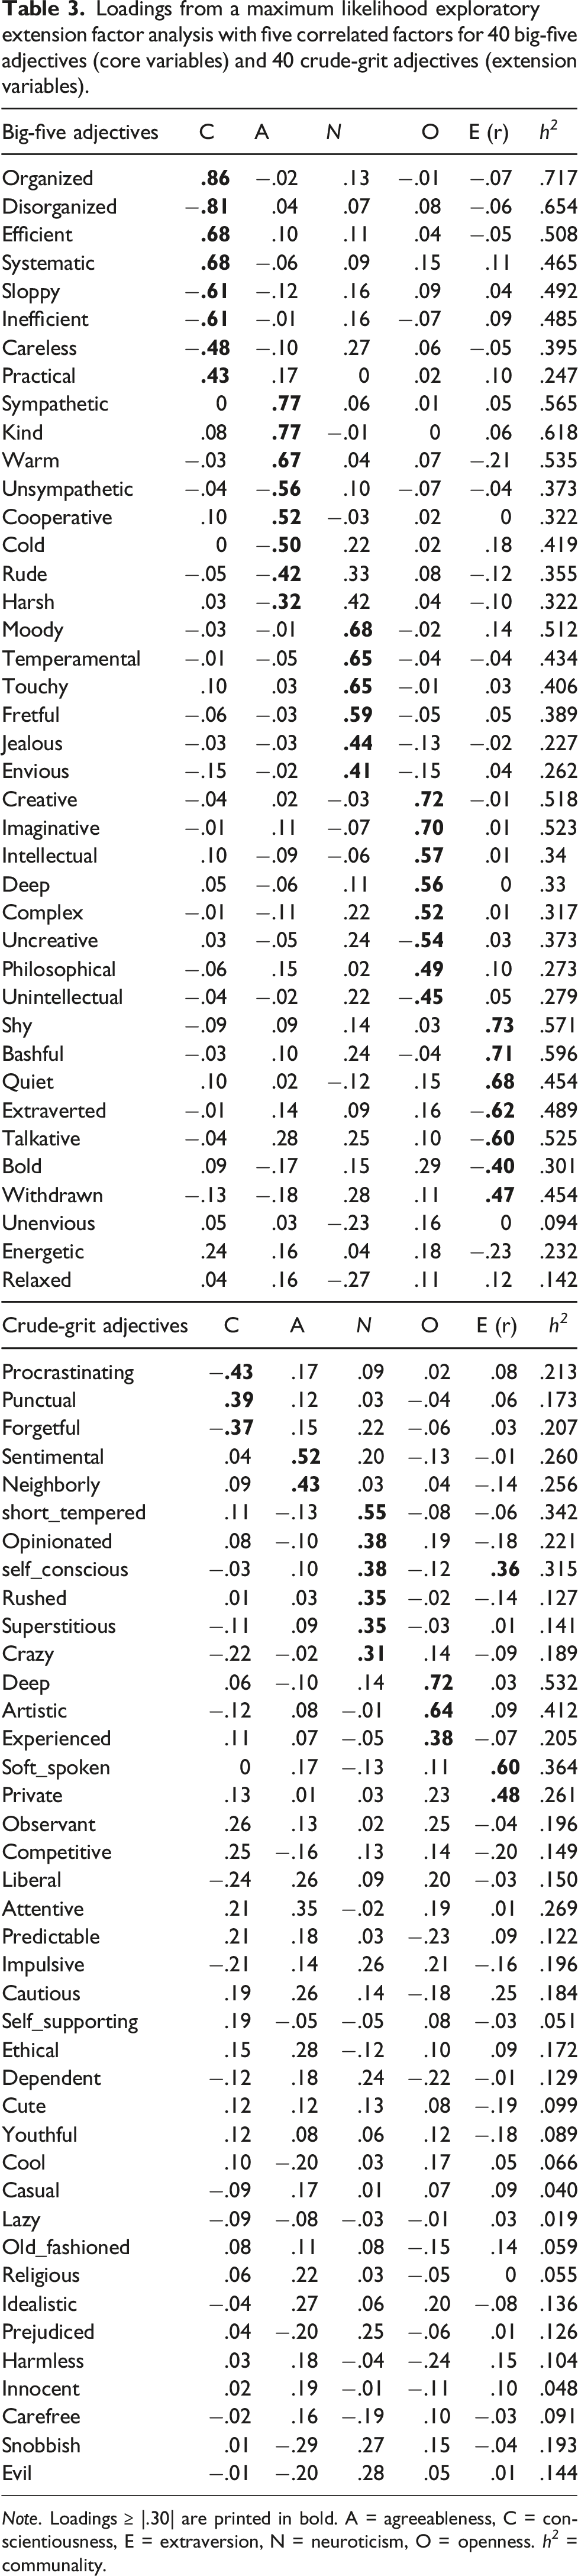
Note. Loadings ≥ |.30| are printed in bold. A = agreeableness, C = conscientiousness, E = extraversion, N = neuroticism, O = openness. h 2 = communality.
Predictive Power of Adjective Sets
Next, we examined the predictive accuracy of the adjective sets by comparing the explained variance (R
2
) in multiple regression analyses with 40 adjectives as predictors of behavioral act frequencies (i.e., BRIs). The explained variances for each BRI are presented in Figure 2, ordered by size of the mean R
2
across the differently selected adjective sets. An interactive version of the plot in which readers can access further information for the single data points is provided in the OSF. Explained variances (R2) for each BRI by three differently selected sets in ascending order, plus the upper- and lower-bound as well as baseline predictions. Each BRI has six data datapoints. Each point represents the R2 reached by the corresponding adjective set for the specific BRI. For the random sets and the reshuffled sets, the means over 1000 R2 values are represented as single data points (random sets (mean)/reshuffled sets (mean)). The lower and upper bounds indicate the R2 values of two different random sets for which the average R2 across all BRIs was minimal/maximal, respectively. Regression lines are based on local polynomial regression fitting (function ‘loess’ from the R-package stats (R Core Team, 2022), while the gray bounds surrounding the regression lines represent the 95% CI-intervals for the model’s prediction.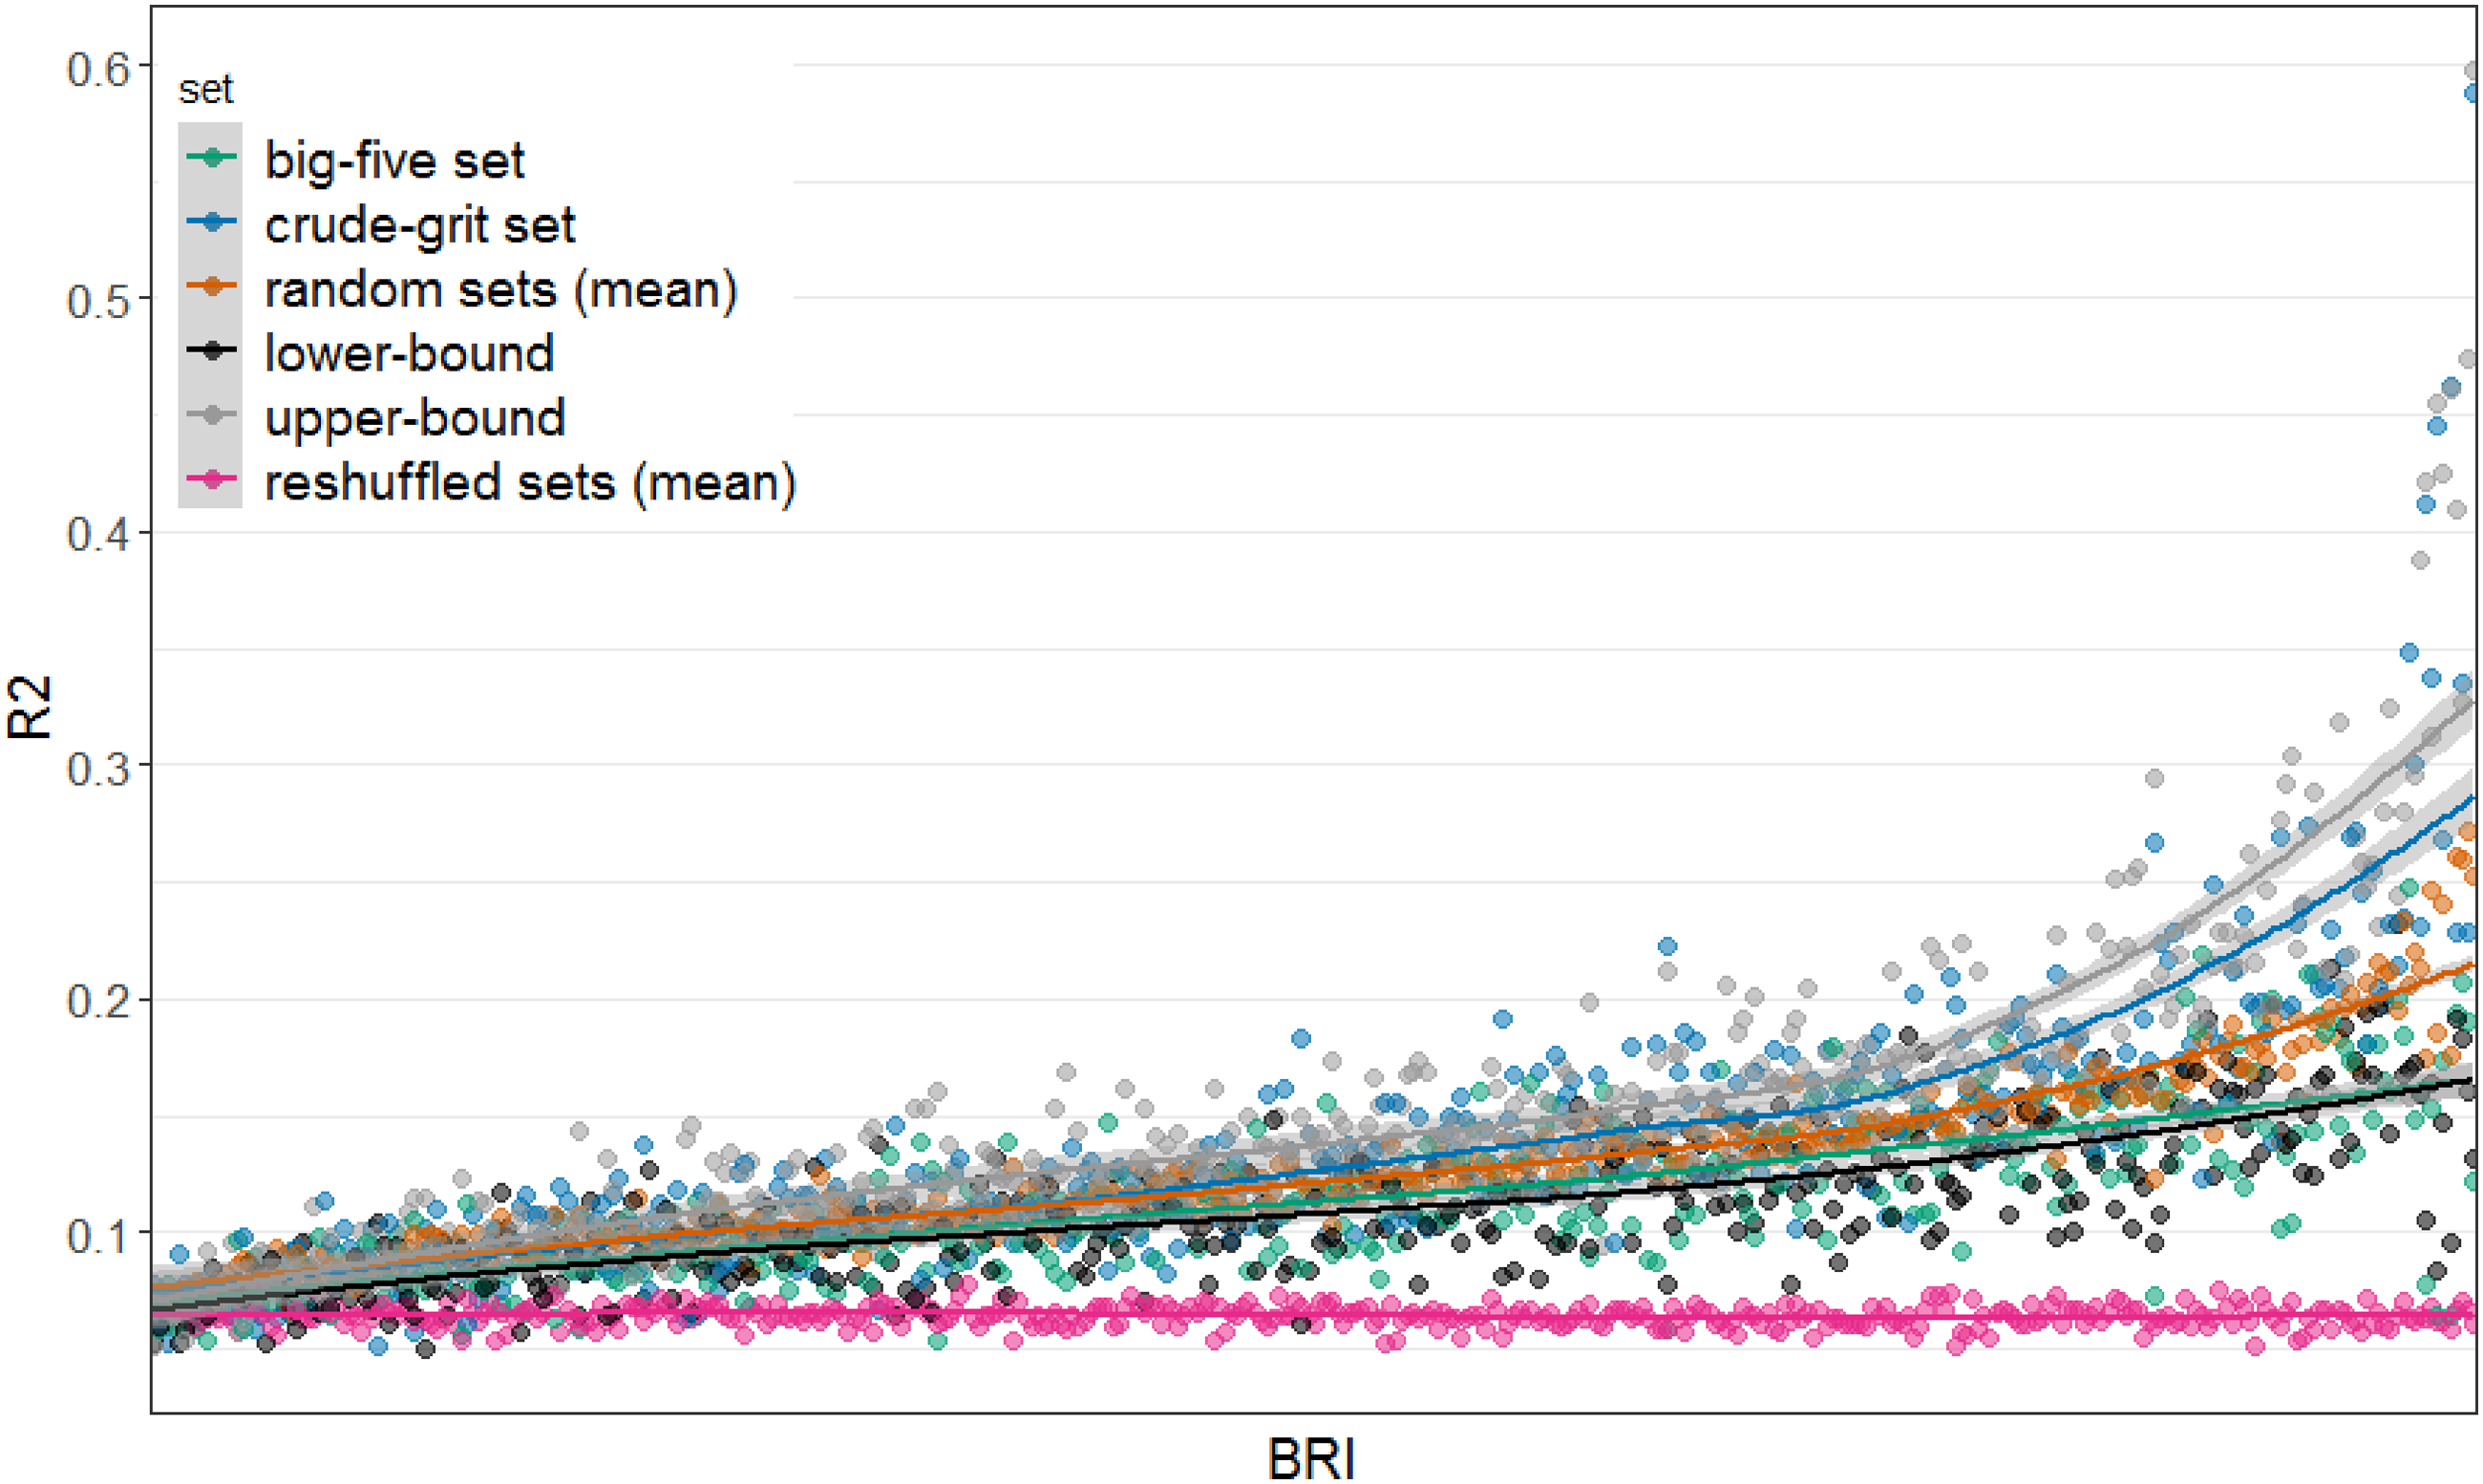
As shown in Figure 2, the baseline of the R 2 for the BRIs was not at zero but slightly higher, with an average R 2 of the reshuffled sets of M = .064 (SD = .005). Therefore, in the following we subtracted this average baseline from the raw R 2 values and report baseline-corrected values (R2bc = R 2 - .064).
The average R 2 bc across the 395 BRI statements was M = .073 (SD = .060) for the crude-grit set, M = .050 (SD = .034) for the big-five set, and M = .063 (SD = .036) across all random item sets. A linear regression in which the R 2 bc for a BRI statement was predicted by the type of adjective set (dummy coded) showed that the big-five set explained significantly less variance in the BRIs than the crude-grit set (β = −.023, p < .001). The same applied for the averaged random sets (β = −.011, p = .002). Although the crude-grit set performed better than the random sets or the big-five set, the upper-bound random set was still slightly better than the crude-grit set (β = .013, p < .001). In contrast to that, the big-five set did not perform better than the lower-bound random set (β = .004, p = .226). Furthermore, the crude-grit set outperformed the big-five set for 70.9% of regressions, while it outperformed the random sets for 67.3%. Notably, the random sets also outperformed the big-five set for 63% of the regressions.
In general, the results indicate that the personality adjectives only explained a small to moderate amount of variance in the behavioral act frequencies. As indicated by the increase of R 2 for all sets along the X-Axis in Figure 2, some behavioral act frequencies are more predictable by personality adjectives than others – independent of the adjective selection strategy.
As some of the BRI statements refer to extremely uncommon behaviors (e.g. ‘called in sick to work because I was too tired to get up’, ‘picked up a date in a bar, restaurant, or similar place’) or to extremely common behaviors (e.g. ‘watched television’, ‘drove a car’), some of the BRI variables are heavily skewed and variance-restricted. Therefore, we dichotomized all BRI statements via median split (1 = performed said behavior more often/equal times than the median, 0 = performed said behavior fewer times than the median) and repeated the analyses using a logistic regression model instead of a linear regression. In logistic regression models, a higher area under the curve (AUC) for the receiver operating characteristic curves (ROC) indicates a more precise categorization of a participant. In other words, the higher the AUC values, the more accurately the model predicted whether a participant performed said behavior more often/equal times than the median or not.
The mean AUC was MAUC = .73 (SDAUC = .06) for the crude-grit set, MAUC = .71 (SDAUC = .05) for the big-five set and MAUC = .72 (SDAUC = .05) for the random sets. As with the R 2 bc values, when regressing the AUC on the type of set which was used as a predictor (dummy coded variables, crude-grit set is the reference group), the AUC was slightly, but significantly higher for the crude-grit set than for the big-five set (β = −.02, p < .05) or the random sets (β = −.01, p < .05). Logistic regression analyses are available in the online supplement material.
Overall, when using logistic instead of linear regressions the results followed a similar pattern and our conclusions remain unchanged: the predictive accuracy of the crude-grit set was generally higher for those behaviors that were better predicted by the big-five set as well. This outcome suggests that an increased breadth in the personality trait measure predominantly improves the accuracy for outcomes well predicted by personality traits in the first place, but does not compensate for insufficient trait-outcome associations.
To further understand which adjective set best predicted a given behavior, we inspected 20 BRI statements that were predicted best by either the crude-grit set, the big-five set, or the average random sets (Figure 3). As presented in Figure 3(a), when focusing on the 20 BRI statements for which the crude-grit set performed best, explained variances ranged between R
2
bc = .18 and R
2
bc = .59 and yielded the highest values for spiritual and religious behavioral statements, as well as for sensation seeking behaviors such as drug use. Baseline-corrected explained variance (R2bc) in 20 BRI statements each as predicted in multiple regression analyses by three differently selected item sets. (a) = 20 BRI statements that were predicted best by the crude-grit set. (b) = 20 BRI statements that were predicted best by the big-five set. (c) = 20 BRI statements that were predicted best by the random sets.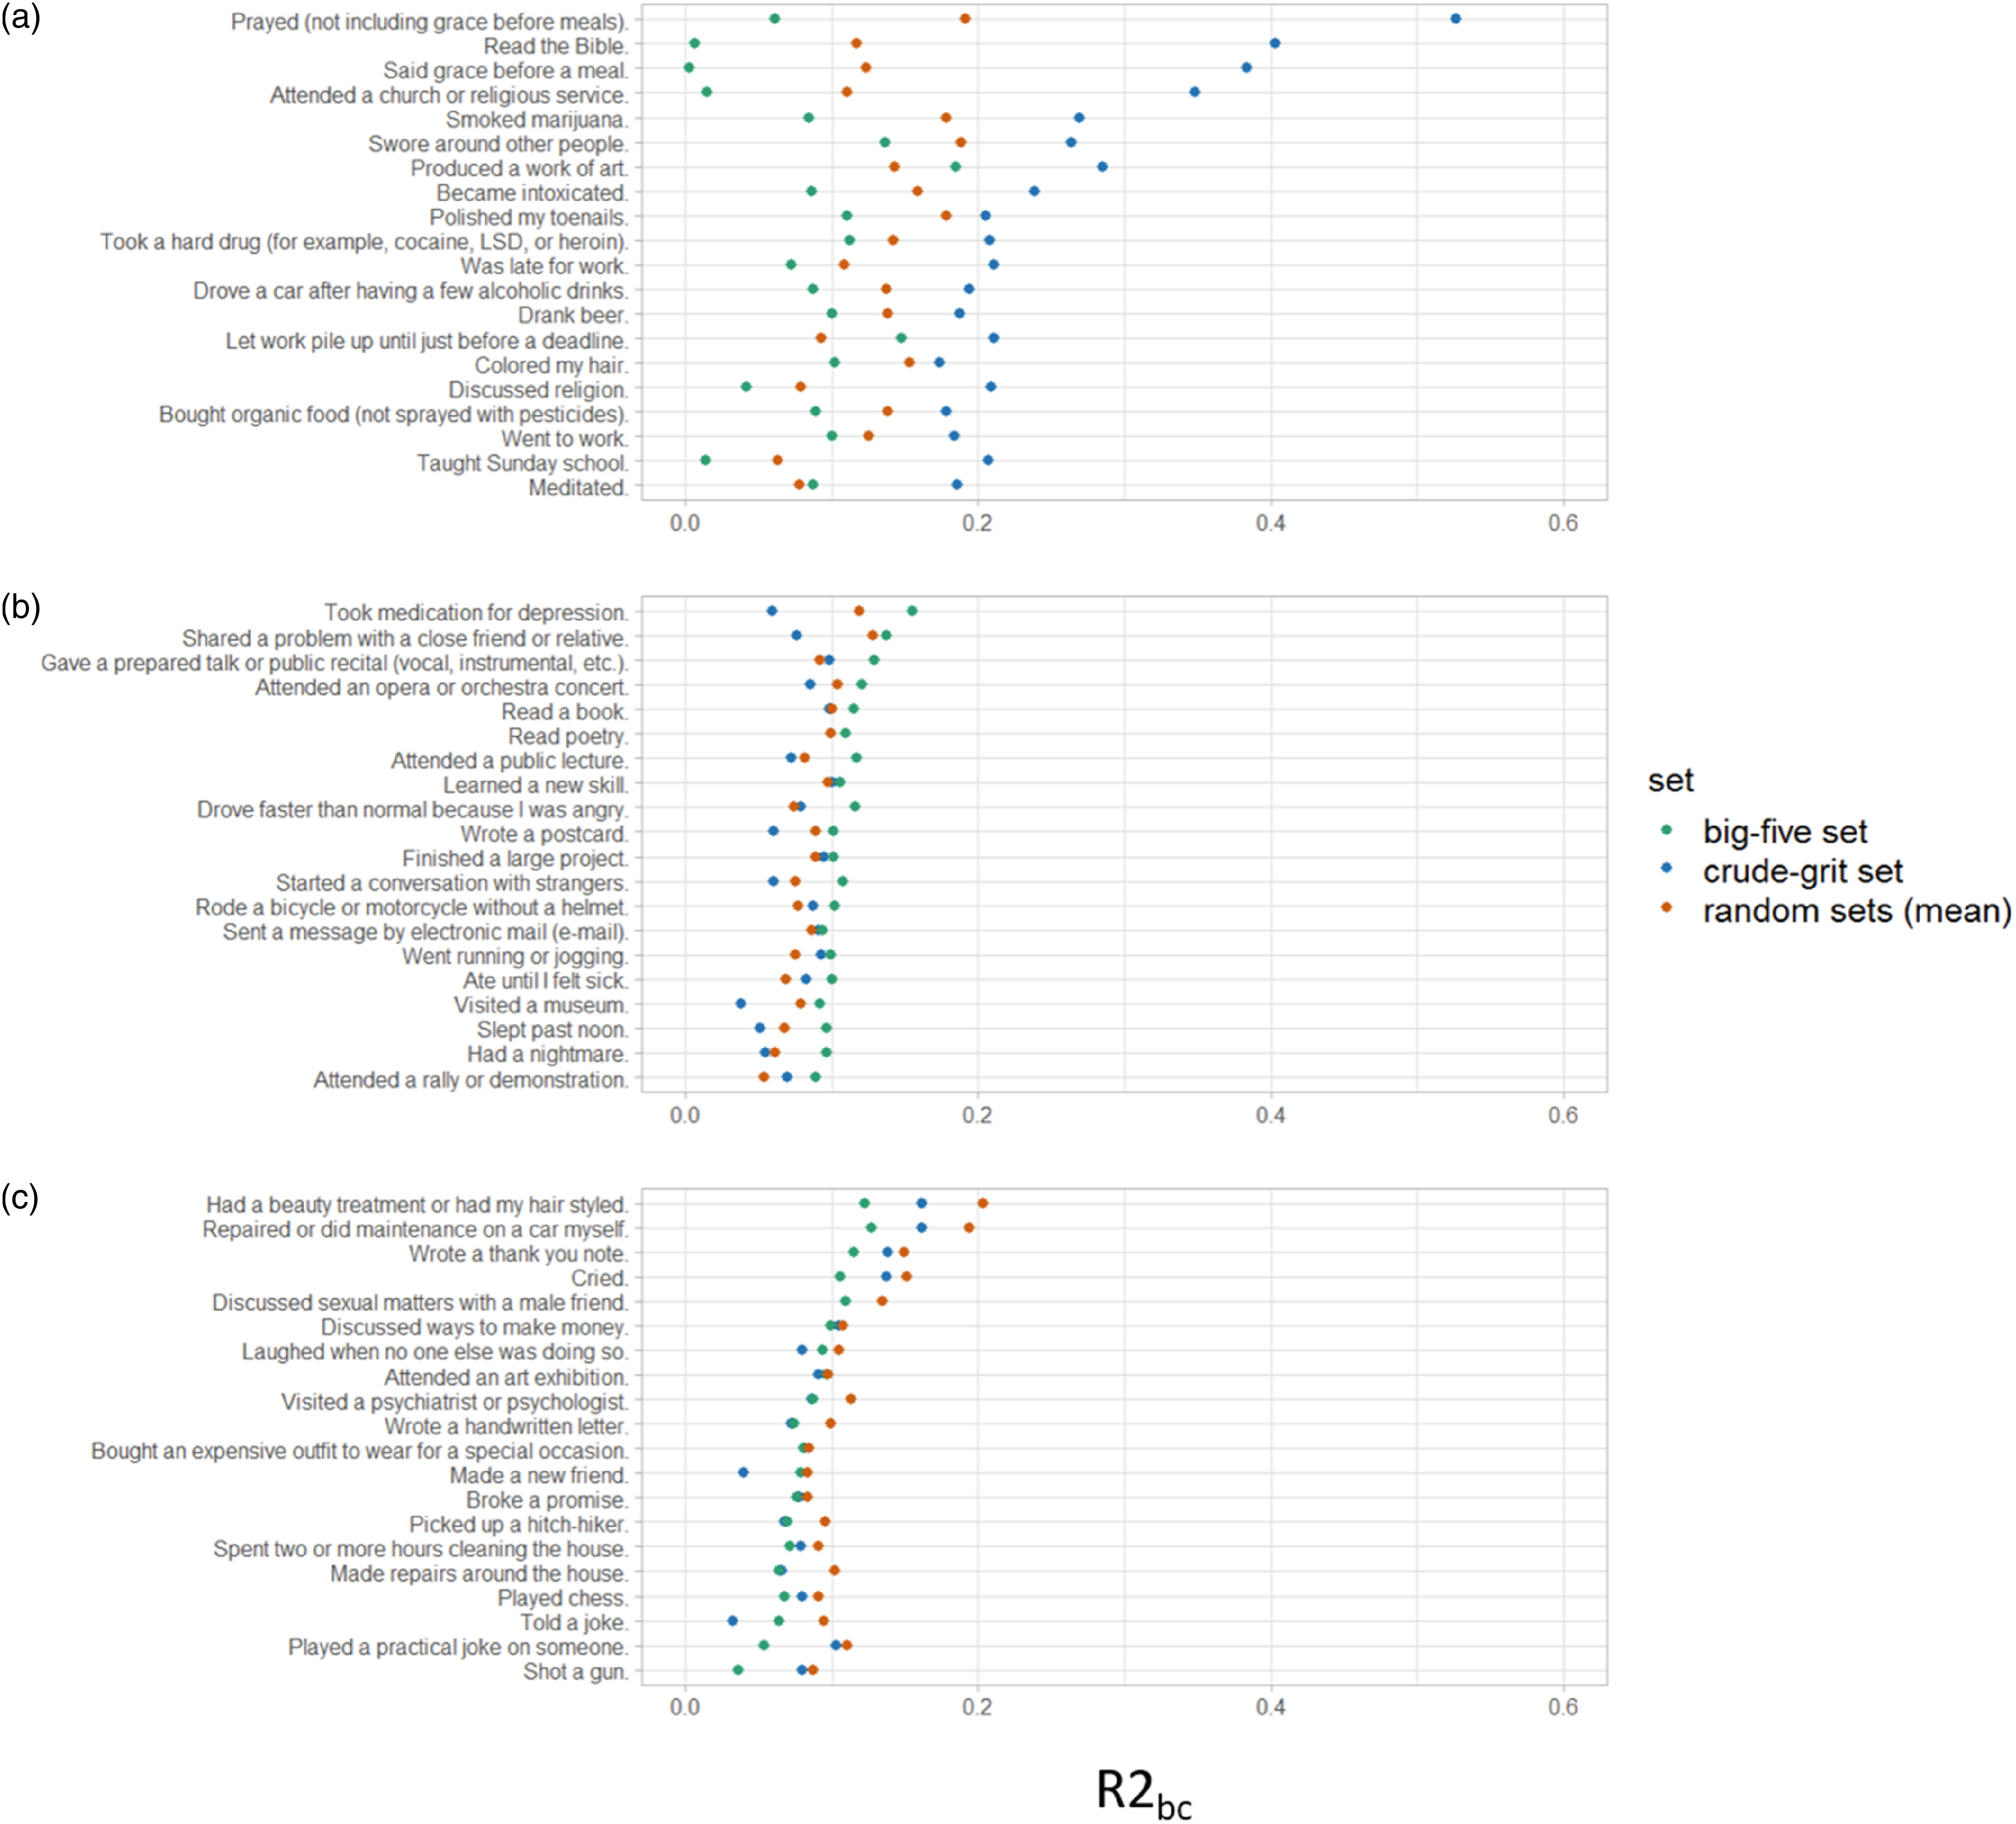
In contrast, for the top 20 BRI statements corresponding to the big-five set (Figure 3(b)), explained variances by the big-five set ranged from R 2 = .10 to R 2 = .22. The highest explained variances by the big-five set were observed for statements about intake of depression medication, giving talks, sharing problems with friends, or visiting the opera. For comparison, in the random sets, the 20 highest explained variances (Figure 3(c)) ranged between R 2 = .09 and R 2 = .27 and were observed for statements about receiving a beauty treatment, repairing one’s car, writing a thank you note, or crying.
As the crude-grit set included the terms ‘religious’ and ‘impulsive’ its predictive power for religious/spiritual behavior statements or statements about drug use might be unjustly inflated. However, this crude-grit set was only one of eight sets that were selected by ACO and all additional sets met our optimization criteria equally well (see Table 1). Four of these seven remaining sets did not contain the term ‘religious’, and one of the seven sets additionally did not contain the word ‘impulsive’ (Set7, see Table A1 in the appendix). Therefore, repeating the analyses with these sets allowed us to inspect possible predictor-criterion contamination. Regardless of whether the sets contained the terms ‘religious’ or ‘impulsive’, the results remained consistent: the ACO-selected crude-grit sets outperformed the big-five and the random sets, with an average difference in R 2 being small (see Table 1), but for specific BRI statements being rather large. Detailed information on those analyses is available in the online supplement on OSF https://osf.io/je6us/.
Discussion
We examined how different item selection strategies affect the predictive accuracy of personality traits. Selection strategies might be deemed competing approaches to personality representation. However, the crude-grit strategy strives for a broad representation of personality, and the factor analytic strategy strives for a condensed representation via the big-five personality factors. In general, the crude-grit set slightly outperformed the big-five set for predicting everyday life behavior. It also outperformed randomly selected adjective sets, confirming that its predictive advantage was not due to chance but rather due to the deliberate elimination of content overlap in the personality measure.
Item Selection
Goldberg (1993) suggested that the big-five personality factors provide coordinates for a personality landscape. This proposal inspired us to select indicators that cover the personality landscape approximately equidistant from each other and labeled this indicator set crude-grit set. By maximizing unique variance of indicators and reducing redundancy amongst them this crude-grit set was curated to overcome limitations of the few-dimensional perspectives on personality. The set contained prototypical big-five adjectives, such as ‘punctual’ (Conscientiousness), ‘artistic’ (Openness), or ‘dependent’ (Neuroticism), as well as adjectives commonly known to lie outside the range of the big-five, such as ‘religious’ or ‘impulsive’ (Paunonen & Jackson, 2000). This characteristic shows that the crude-grit set did not exclude content from the big-five framework, but rather bypassed clustering around these dimensions and also included indicators typically neglected within big-five sets.
As indicated by the extension analysis, the selected crude-grit adjectives had smaller loadings on the big-five factors than the big-five adjectives, indicating that they captured mainly unique variance. However, the parallel analysis showed that some factors could be extracted even within the crude-grit set, pointing towards shared variance among the indicators. Means and dispersions of the inter-item relations of the crude-grit set also highlight that this set was not composed of completely independent adjectives. Obviously, response sets and other biases could be causal for residual communalities among the crude-grit adjectives. Given self-report biases such as acquiescence, it might be nearly impossible to extract an (self-report) item set with mean absolute inter-item correlations equal to zero. Given the materials used in this study, an item sampling heuristic allowed us to approximate the goal of an equidistant item set: the selected items did not cluster around the big-five personality dimensions and dispersion among inter-item correlations within this set was close to zero.
Minimizing inter-item correlations could result in selecting items which are unreliable, e.g., because they are rarely used in common language or are hard to understand. To address this concern, reliability indices on item level (e.g., re-test data) could be implemented during the sampling process. As such, indices were not available for the current adjectives, the lexical difficulty of the selected sets was compared post-hoc to address this problem, using the data provided by Condon et al. (2022). These comparisons indicated no differences in the lexical difficulties between the differently selected sets. Hence, unreliability due to lexical characteristics of the adjectives is unlikely to distinguish between item sets. Nevertheless, there was no direct estimate of item reliability at our disposal. However, if the crude-grit set happened to include less reliable adjectives, disattenuated relations with outcomes would have more strongly outperformed the big-five set.
Predictive Power
Three main results can be summarized for the comparison of predictive power for differently selected adjective sets. First, for 67 and 71% of the behavioral act frequencies, the crude-grit selected set had a predictive advantage compared to randomly drawn item sets or a big-five based measure, respectively. Second, the difference in the average explained variance across all behavioral act frequencies was mostly small between the crude-grit set and the big-five set, but reached statistical significance. Third, for specific criteria, such as religious and spiritual behaviors or impulsive and sensation seeking behaviors (drug use), the difference in explained variances was substantially greater. Here, the crude-grit set explained up to twice as much variance as the big-five set.
From a statistical stance, the reported predictive advantage of the crude-grit set might be taken as reflecting a statistical necessity: other things being equal, more orthogonal predictors are more predictive than more redundant predictors. This effect is not only visible in the comparison of the big-five and the crude-grit set, but also when juxtaposing the big-five and the random sets. Since indicators within those random sets share less variance among each other by chance, the proportion of shared variance between those indicators and a criterion can be higher compared to a factor-analytic-based set. However, in this manuscript, we deliberately amplified the orthogonality of indicators by selecting items that maximize the unique variances of single indicators.
Regarding the magnitude of prediction, we found that everyday life behaviors in general were hardly predictable from personality traits, regardless of how the inventory was selected. Considering that the big-five set, which has been purposely selected to capture five broad trait domains did not perform better than the worst-performing random set, our results bring into question the utility of factor-analytic-based selection strategies in a predictive context. Relative to that low baseline, the crude-grit selection strategy has shown an increment in a predictive context. The crude-grit set could explain up to 58% of individual differences in some specific behaviors. Hence, it is possible to select item sets capable of explaining everyday life behaviors substantially. However, we need to acknowledge that these very high R 2 values might be attributable to the relation between individual items and a specific behavior statement. In fact, very high bivariate relations between adjectives and behaviors might be indicative of predictor-criterion contamination (Brogden & Taylor, 1950). For instance, the crude-grit set contained the term religious, which could have caused its high predictive power for religious behaviors.
Nevertheless, the term religious can be considered a personality-descriptive adjective, just like any of the adjectives in any other item set. Similar to how ‘talkative’ or ‘creative’ are indicators of the big-five trait domains extraversion and openness, respectively, ‘religious’ can be considered an indicator of a spirituality trait. Furthermore, specific traits or trait-indicators are inevitably related to specific behaviors (e.g., ‘creative’ is related to ‘creating art’). Hence, we do not view the inclusion of the term religious as an issue of the crude-grit approach. Instead, its inclusion might be considered a limitation of the big-five set, because it does not cover this part of the personality trait space (e.g., a spirituality trait). Furthermore, even crude-grit sets without the term religious explained a comparable amount of variance across all behaviors. Thus, while the prediction accuracy of specific outcomes inevitably depends on the selected adjectives, the overall explained variance in a broad pool of outcomes should be similar across different sets of non-redundant item sets.
Certainly, our findings must not be misinterpreted as a ubiquitous advantage of the crude-grit set, as there are scenarios in which another item selection strategy is preferable. For example, if the goal is to predict only one, or a few highly inter-related criteria, the criterion keying approach (French, 1952; Smith et al., 2003) would be more efficient. Here, items are being selected to maximize the association with the outcome (e.g., Elleman et al., 2020). However, items which are highly predictive for one criterion will not be highly predictive for another orthogonal criterion. Thus, the more dimensions the targeted criterion space has, the more dimensions are needed in the predictor set for successful prediction. When the criterion space is broad and high dimensional, as was the case in this study, the overall predictive accuracy of the criterion-approach might be comparable to the crude-grit approach. This reality becomes evident when considering that the most predictive random item set (akin to a criterion keying selection) and the crude-grit item set were similarly predictive for the same behaviors (Figure 2).
Limitations
Inevitably, the present results are dependent on the measures and instruments included in this study. The item universe used for item sampling, for example, was meant to extend the big-five space (Saucier, 1997), but still only represents a sample of personality trait adjectives. Furthermore, although the selection of this adjective list was not based on factor analyses, when performing a maximum likelihood EFA with five correlated factors, only 8% of the adjectives had a loading |<.30| on one of the five extracted factors. While this fact might point towards a big-five bias within the item universe, there is no reason to assume that such a bias is less of an issue in any other available trait-descriptive adjective list. Also, applying the crude-grit approach in a confirmed unbiased item universe is likely to be even more successful in terms of covered content breadth.
Furthermore, it is conceivable that the vocabulary of participants affected their responses to the personality adjectives. We were able to discard the assumption that crude-grit adjectives differed in difficulty from the big-five adjectives or the random sets. Still, it remains unclear whether or not the covariance within adjective sets or their predictive validity would change, when considering vocabulary as a covariate or a moderator.
With regard to the criterion variables, the list of everyday life behaviors brings forth a number of limitations as well. First, as the list of everyday life behaviors is from 1976 (Loehlin & Nichols, 1976), it lacks behaviors that have become common or that have changed prevalence recently (e.g., behaviors related to smartphone use, sustainability or health related behaviors, for example, considering the COVID-19 pandemic). Hence, the breadth of the criterion space is likely to be underrepresented. Second, we do not know the degree to which behaviors differ in terms of reliability and validity. For instance, it is unclear whether or not behaviors are equally accessible to introspection. Finally, the degree to which behaviors apply to different participants might vary. For example, the behavior ‘went to a lawyer’ is not equally applicable across participants and likely hinges on many determinants, one of which being the financial situation of an individual.
After all, the Eugene Springfield Community Sample might be deemed as having WEIRD participants (Henrich et al., 2010) and the validity of our results for a wide range of human societies is therefore limited. Based on the aforementioned limitations, the following section outlines starting points for future research.
Future Directions
One step for future research could be the application of the crude-grit selection strategy on other kinds of personality indicators. Applying the crude-grit selection strategy to a sample of conventional personality items could be interesting. Because such items provide more context, they are more specific and less abstract (Condon, 2018; Hendriks et al., 1999) relative to trait-descriptive terms (adjectives). Therefore, it might be easier and more comfortable for participants to respond to this type of personality indicator, which might then result in higher-quality data. Better data quality should come along with less error variance, which in turn might result in better predictions, because attenuation is reduced.
On the predictor side, a second avenue for future research is the item sampling algorithm, which is essential for crude-grit selection. Refining the algorithm could provide further insights about the full potential of crude-grit selection strategies. For example, parameters focusing on the dimensionality of data, such as multi-dimensional scaling, effective dimensionality (Del Giudice, 2020), or network analyses could be used for selection. Using such parameters within the item sampling algorithm could help with the selection of equidistant personality indicators. Additionally, lexical indices such as semantic similarity indices (as done in latent semantic analyses; Landauer et al., 1998; Rosenbusch et al., 2019) could be a target for selection algorithms as well.
On the criterion side, covering the full spectrum of everyday life behaviors seems crucial for further research. In accordance with the idea of covering the personality space in its entire breadth, future research could focus on expanding and broadening the criterion space. To do so, generating a possibly exhaustive item pool for everyday life behaviors is necessary. Based on this, a crude-grit selected criterion set could be extracted. This set should capture behaviors that have not been included in the present study (e.g., smartphone usage, health behaviors, and sustainable behaviors).
Conclusion
Our results provide initial insights about how crude-grit selection of personality indicators can enhance prediction of everyday life behaviors. Yet, the full potential of crude-grit selection strategies for prediction is still unknown and possibly underestimated. Therefore, the current work should be seen as ‘proof-of-principle’, as it needs to be replicated and extended in larger samples and with other kinds of measures (e.g., personality items, expanded criteria space).
In addition to the predictive advantage, the crude-grit selection strategy provides a competing perspective on personality assessment. We selected the crude-grit set with the goal to not factorize, cluster, or reduce it in dimensionality. Therefore, this set will not serve the purpose of describing personality in the condensed manner the big-five sets do (Mõttus et al., 2020). Rather, instead of factors, individual responses are conceptualized as an inventory of trait-like person attributes. In the end, our findings emphasize the trade-off between capturing the entire personality trait space or only the most salient trait domains. While a questionnaire based on a few broad trait domains will provide a tool for easier interpretation and communication of personality-outcome associations, we showed that it may be limited in finding these associations to begin with. In contrast, a broader personality space coverage can improve the prediction of relevant outcomes, but does so at the cost of interpretability of the associations.
Supplemental Material
Supplemental Material - What if there were no personality factors? Comparing the predictability of behavioral act frequencies from a big-five and a maximal-dimensional item set
Supplemental Material for What if there were no personality factors? Comparing the predictability of behavioral act frequencies from a big-five and a maximal-dimensional item set by Elisa Altgassen, Gabriel Olaru, and Oliver Wilhelm in European Journal of Personality
Footnotes
Author contributions
Conceptualization, E.A., G.O, and O.W.; Data curation, E.A.; Formal analysis, E.A.; Methodology, E.A., G.O., and O.W.; Project ad-ministration, E.A; Supervision, G.O. and O.W.; Writing – original draft, E.A.; Writing – review & editing, E.A., G.O., and O.W. All authors have read and agreed to the current version of the manuscript.
Declaration of conflicting interests
The author(s) declared no potential conflicts of interest with respect to the research, authorship, and/or publication of this article.
Funding
The author(s) received no financial support for the research, authorship, and/or publication of this article.
Open Science Statement
The study materials, supplement materials and analysis scripts used for this article can be accessed at the Open Science Framework (OSF) via https://osf.io/je6us/. All data is publicly available at Harvard Dataverse from Eugene Springfield Community Sample ![]() .
.
Supplemental Material
Supplemental materials are publicly available on OSF: https://osf.io/je6us/ Data is publicly available at Harvard Dataverse from Eugene Springfield Community Sample: ![]()
Appendix
Selected adjectives for the big-five set, the crude-grit set, the lower-bound and upper-bound random sets plus the remaining seven ACO-selected sets.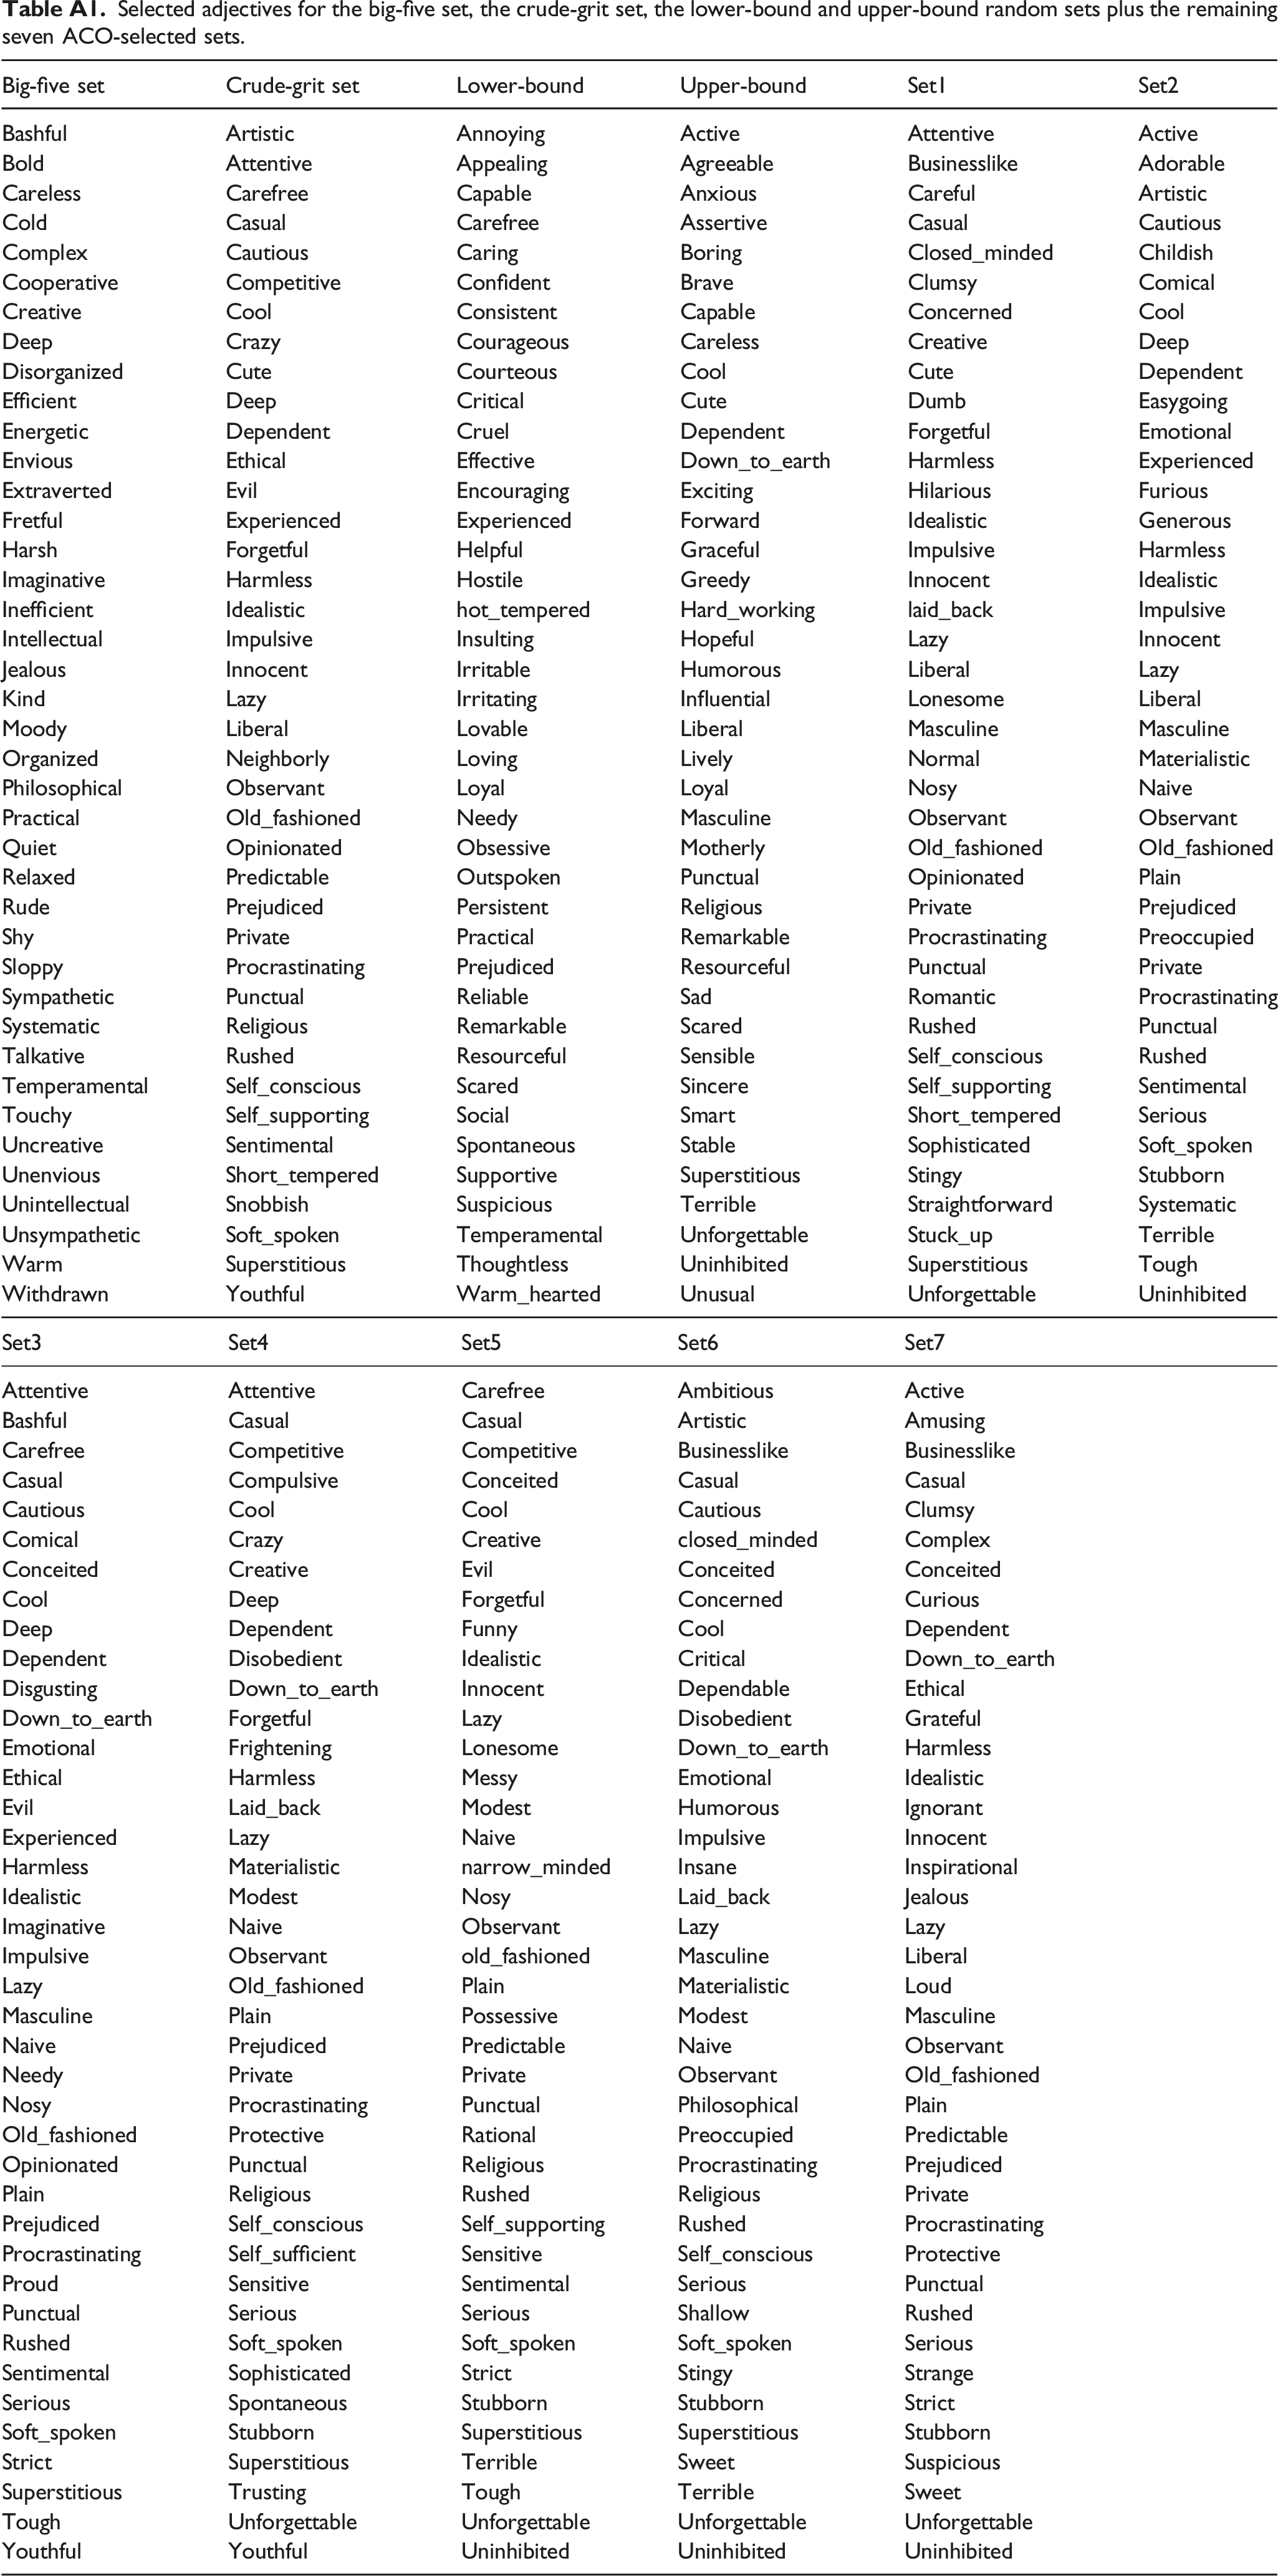
Big-five set
Crude-grit set
Lower-bound
Upper-bound
Set1
Set2
Bashful
Artistic
Annoying
Active
Attentive
Active
Bold
Attentive
Appealing
Agreeable
Businesslike
Adorable
Careless
Carefree
Capable
Anxious
Careful
Artistic
Cold
Casual
Carefree
Assertive
Casual
Cautious
Complex
Cautious
Caring
Boring
Closed_minded
Childish
Cooperative
Competitive
Confident
Brave
Clumsy
Comical
Creative
Cool
Consistent
Capable
Concerned
Cool
Deep
Crazy
Courageous
Careless
Creative
Deep
Disorganized
Cute
Courteous
Cool
Cute
Dependent
Efficient
Deep
Critical
Cute
Dumb
Easygoing
Energetic
Dependent
Cruel
Dependent
Forgetful
Emotional
Envious
Ethical
Effective
Down_to_earth
Harmless
Experienced
Extraverted
Evil
Encouraging
Exciting
Hilarious
Furious
Fretful
Experienced
Experienced
Forward
Idealistic
Generous
Harsh
Forgetful
Helpful
Graceful
Impulsive
Harmless
Imaginative
Harmless
Hostile
Greedy
Innocent
Idealistic
Inefficient
Idealistic
hot_tempered
Hard_working
laid_back
Impulsive
Intellectual
Impulsive
Insulting
Hopeful
Lazy
Innocent
Jealous
Innocent
Irritable
Humorous
Liberal
Lazy
Kind
Lazy
Irritating
Influential
Lonesome
Liberal
Moody
Liberal
Lovable
Liberal
Masculine
Masculine
Organized
Neighborly
Loving
Lively
Normal
Materialistic
Philosophical
Observant
Loyal
Loyal
Nosy
Naive
Practical
Old_fashioned
Needy
Masculine
Observant
Observant
Quiet
Opinionated
Obsessive
Motherly
Old_fashioned
Old_fashioned
Relaxed
Predictable
Outspoken
Punctual
Opinionated
Plain
Rude
Prejudiced
Persistent
Religious
Private
Prejudiced
Shy
Private
Practical
Remarkable
Procrastinating
Preoccupied
Sloppy
Procrastinating
Prejudiced
Resourceful
Punctual
Private
Sympathetic
Punctual
Reliable
Sad
Romantic
Procrastinating
Systematic
Religious
Remarkable
Scared
Rushed
Punctual
Talkative
Rushed
Resourceful
Sensible
Self_conscious
Rushed
Temperamental
Self_conscious
Scared
Sincere
Self_supporting
Sentimental
Touchy
Self_supporting
Social
Smart
Short_tempered
Serious
Uncreative
Sentimental
Spontaneous
Stable
Sophisticated
Soft_spoken
Unenvious
Short_tempered
Supportive
Superstitious
Stingy
Stubborn
Unintellectual
Snobbish
Suspicious
Terrible
Straightforward
Systematic
Unsympathetic
Soft_spoken
Temperamental
Unforgettable
Stuck_up
Terrible
Warm
Superstitious
Thoughtless
Uninhibited
Superstitious
Tough
Withdrawn
Youthful
Warm_hearted
Unusual
Unforgettable
Uninhibited
Set3
Set4
Set5
Set6
Set7
Attentive
Attentive
Carefree
Ambitious
Active
Bashful
Casual
Casual
Artistic
Amusing
Carefree
Competitive
Competitive
Businesslike
Businesslike
Casual
Compulsive
Conceited
Casual
Casual
Cautious
Cool
Cool
Cautious
Clumsy
Comical
Crazy
Creative
closed_minded
Complex
Conceited
Creative
Evil
Conceited
Conceited
Cool
Deep
Forgetful
Concerned
Curious
Deep
Dependent
Funny
Cool
Dependent
Dependent
Disobedient
Idealistic
Critical
Down_to_earth
Disgusting
Down_to_earth
Innocent
Dependable
Ethical
Down_to_earth
Forgetful
Lazy
Disobedient
Grateful
Emotional
Frightening
Lonesome
Down_to_earth
Harmless
Ethical
Harmless
Messy
Emotional
Idealistic
Evil
Laid_back
Modest
Humorous
Ignorant
Experienced
Lazy
Naive
Impulsive
Innocent
Harmless
Materialistic
narrow_minded
Insane
Inspirational
Idealistic
Modest
Nosy
Laid_back
Jealous
Imaginative
Naive
Observant
Lazy
Lazy
Impulsive
Observant
old_fashioned
Masculine
Liberal
Lazy
Old_fashioned
Plain
Materialistic
Loud
Masculine
Plain
Possessive
Modest
Masculine
Naive
Prejudiced
Predictable
Naive
Observant
Needy
Private
Private
Observant
Old_fashioned
Nosy
Procrastinating
Punctual
Philosophical
Plain
Old_fashioned
Protective
Rational
Preoccupied
Predictable
Opinionated
Punctual
Religious
Procrastinating
Prejudiced
Plain
Religious
Rushed
Religious
Private
Prejudiced
Self_conscious
Self_supporting
Rushed
Procrastinating
Procrastinating
Self_sufficient
Sensitive
Self_conscious
Protective
Proud
Sensitive
Sentimental
Serious
Punctual
Punctual
Serious
Serious
Shallow
Rushed
Rushed
Soft_spoken
Soft_spoken
Soft_spoken
Serious
Sentimental
Sophisticated
Strict
Stingy
Strange
Serious
Spontaneous
Stubborn
Stubborn
Strict
Soft_spoken
Stubborn
Superstitious
Superstitious
Stubborn
Strict
Superstitious
Terrible
Sweet
Suspicious
Superstitious
Trusting
Tough
Terrible
Sweet
Tough
Unforgettable
Unforgettable
Unforgettable
Unforgettable
Youthful
Youthful
Uninhibited
Uninhibited
Uninhibited
References
Supplementary Material
Please find the following supplemental material available below.
For Open Access articles published under a Creative Commons License, all supplemental material carries the same license as the article it is associated with.
For non-Open Access articles published, all supplemental material carries a non-exclusive license, and permission requests for re-use of supplemental material or any part of supplemental material shall be sent directly to the copyright owner as specified in the copyright notice associated with the article.