
Abstract
Gender differences persist in the social work academy. We follow up and extend the work of Sakamoto, Anastas, McPhail, and Colarossi. A multistage probability sample of Council on Social Work Education (CSWE)-accredited programs yielded a 21% response rate (n = 535) by faculty to an electronic survey. A significant difference was found on base salary with men earning $76,337 and women earning $70,400. On many status variables, women and men have achieved parity; but, men are significantly more likely to be full professors. Gender differences were found on all seven climate subscales. CSWE must obtain robust data, at the individual level, on salary and other implicit curricular items.
Keywords
The majority of social work faculty (72%) and students (bachelor, 85%; masters, 85%; and PhD students, 74%) are female (Council on Social Work Education [CSWE], 2017). Despite these stable trends, social work education is not female dominated (McPhail, 2004). Therefore, it is critical to have current research on the experiences of female social work educators in order to achieve equity.
The most recent study on the status of social work faculty was conducted by Sakamoto, Anastas, McPhail, and Colarossi (2008) who used secondary data collected by the CSWE in 2003. These data are more than 15 years old, underscoring the need for more research in this area. While CSWE continues to conduct annual program surveys, data are currently collected in aggregate, making individual comparisons impossible. This research is an attempt to begin to fill the gap.
This study was guided and organized by Sakamoto et al. (2008) who asked: Are there gender differences in the social work academy? More specifically, are there gender differences in salary, leadership, status-related positions and institutional characteristics, workload, and salary? Lastly, we pose additional questions: Are there differences in how men and women perceive support within their campus climate?
Theoretical Framework
Sex discrimination manifests in many forms on college campuses, such as sexual harassment, gender insensitivity, and implicit or unconscious bias. Sexism alone, however, is not a wide enough lens to capture co-occurring forms of discrimination in campus climate for female faculty. Intersectionality of social identities (e.g., professor, American, mother) within the intersection of multiple systems of oppression (e.g., sexism, racism, classism, ableism, homophobia/transphobia, xenophobia) is a means to understand the experiences of women in the social work academy (Smooth, 2016). An intersectional framework recognizes that multiple systems of oppression interact to create unique and specific patterns of discrimination that are different from a singular system (Hill Collins, 1990). Thus, the norms and expectations of individuals in the academy, based in multiple systems of oppression, make the understanding of climate very complex.
Another important manifestation of sex discrimination comes in the form of unequal pay. Pay equity studies tend to include a combination of theories to explain pay disparities between men and women: human capital, organizational structure and culture, discrimination, and more. Each type of theory focuses on important mechanisms that create and reinforce the complex constellation of causes, reinforcing actions, and forms of workplace discrimination. Human capital theories explain how individual choices, such as education, skills, and experience, are rewarded through compensation. However, sex discrimination as a social norm also impacts human capital variables (Lips, 2013; Olson, 2013).
Theories that focus on organizational structures shift the focus from the individual to the organization—the formal and informal rules, norms, and practices in which individuals are situated. Organizations, including universities, are gendered (Acker, 1990; Williams, 2000). Organizational rules, for example, reward research productivity over service and teaching. Recent reductions in tenure-track positions leave fewer people to perform service work, which is critical to the functioning of an academic unit (Misra, Lundquist, Holmes, & Agiomavritis, 2011). Faculty women disproportionately perform this institutional housekeeping (Bird, Litt, & Wang, 2004).
Literature Review
There is a broad range of literature on women in the academy, particularly in science, technology, engineering, and math (STEM), but there are few research studies on women in the social work academy. This review will discuss the influence of sex on salary as well as additional variables that predict salary (e.g., institutional characteristics), followed by a discussion of campus climate.
Salary
Lane and Flowers (2015) carefully documented the long-standing pattern of pay disparity between male and female social work faculty. They conclude that salary tends to be influenced by a constellation of variables relating to institutional characteristics of the employer, traits of the position, and attributes of the individual. Variables that have historically influenced salary for social work faculty include, “rank (1970s, 1980s, and 2000s), tenure (1980s and 2000s), level of primary program (2000s), time spent on research (2000s), number of articles published and total publications in a year (2000s), and gender of dean (1980s)” (p. 373).
Institutional characteristics of the employing university, are applicable, but not specific to the social work academy, are important in predicting salaries in higher education. Institutional factors, such as Carnegie classification, size of the student body, public versus private institutions, also influence faculty salaries. As an example, private universities tend to pay more than public universities (AAUP, 2016; Porter, Toutkoushian, & Moore, 2008).
Throughout higher education, salary appears to be related to status variables associated with one’s university. The Carnegie Classification System of Institutions of Higher Education, for example, groups U.S. universities according to a framework (Carnegie Classification, 2015). Institutions with the “highest research activity” (formally termed Research 1 [RI] universities) tend to have higher status than other universities and thus pay more than those in lower rankings AAUP, 2016; Porter et al., 2008). Women are less well represented in social work programs at RI and Research II (RII), doctoral universities (Di Palma, 2005).
In the most recent study on pay inequity in the social work academy, the type of social work degree program offered was found to influence faculty salaries (Sakamoto, Anastas, McPhail, & Colarossi, 2008). Faculty in higher status social work programs (i.e., graduate-only programs) had higher salaries compared to joint bachelor and graduate programs and undergraduate-only programs. Salary and student enrollment were also reported to be positively correlated (Sakamoto et al., 2008).
Individual traits and position traits
Human capital variables that influence salary throughout higher education include highest degree obtained, position, rank, years in rank, discipline, research productivity, experience, academic discipline, Carnegie classification of terminal degree, demographic variables (Porter et al., 2008), and administrative responsibilities. Some individual variables are considered to be higher status than others. For example, full professors tend to earn the highest salaries and have the highest status, while other ranks, such as lecturer or instructor and part-time faculty, earn the least amount of money (AAUP, 2016). Likewise, RI graduates had higher salaries ($4,000 for women, $6,000 for men) than RII graduates (Webber & Canche, 2015).
Nevertheless, Porter, Toutkoushian, and Moore (2008) reported that recently hired women at RI universities still experience pay disparities compared to their male counterparts; studies across and within disciplines continue to show pay disparities are influenced by sex and race. Porter et al. analyzed 4 years (i.e., 1988, 1993, 1999, and 2004) of nationally representative samples collected by the National Study of Postsecondary Faculty. A wage gap was found between underrepresented minorities and white faculty across all 4 years of the study. But no negative salary differential was found for recently hired faculty, defined as assistant professors who were in their first through third year, in their first tenure-track appointment. They found a wage gap for women across all 4 years, and a wage gap for newly hired women, but the wage gap for the newly hired women was less severe. At higher status universities, Porter et al. found that both senior women and recently hired women at RI universities experienced large pay disparities compared to their male counterparts.
Webber and Canche (2015) used longitudinal data from the National Science Foundation’s Survey of Doctoral Recipients to study doctoral degree graduates in science, engineering, and health (n = 10,100). In the decade studied, women’s salaries, regardless of ethnicity, remained significantly below men’s. Moreover, they found a wage penalty for married women, but marriage benefited men’s salaries, particularly for underrepresented men.
In the social work academy, Sakamoto and colleagues (2008) reported, on average, female faculty earned $9,000 less than males. They further reported that one’s sex impacted salary, independent of race/ethnicity. Significant positive correlations were found with salary and age, years of full-time employment, years at rank, percentage of time spent on research, number of articles published, and number of publications in a year. They also found a significant negative correlation with percentage of time spent in field, liaison work, and employment in an undergraduate-only program. In addition, men were more likely to hold higher status leadership positions, such as dean (53% vs. 47%) and directors (66% vs. 34%), but fewer chair positions (30% vs. 70%) than women (Patrick & Colby, 2011).
Some human capital variables that are more highly rewarded tend to be correlated with male gender norms. As an example, men are more willing and able to relocate for work, as men’s careers are often prioritized in heterosexual relationships (Boyle, Feng, & Gayle, 2009; Shauman & Noonan, 2007). While it may appear neutral to compensate employees more generously who can relocate or are at risk of leaving an institution, this practice systematically disadvantages women.
Climate
Campus climate refers to the attitudes and behaviors exhibited by administrators, faculty, staff, and students as well within organizational policies and practices (Rankin & Reason, 2008). Campus climate may include such constructs as positive climate (e.g., how respected, supported, and comfortable a faculty member feels) and cohesion (e.g., how committed and involved a faculty member is with her, his, or their unit; Jacobs, Bergen, & Korn, 2000).
An intersectional perspective of campus climate must also measure discrimination experienced by underrepresented groups. Forms of sex and gender discrimination that tend to manifest in the workplace range from sexual harassment to subtler or unconscious forms of bias. Other forms of gender discrimination have been documented in the higher education literature, including the objectification of faculty women; messages that female faculty do not deserve the same privileges as their male counterparts; unconscious bias or assumptions of inferiority or gender roles; use of sexist language; denial that sexism exists or denial of specific examples of it; and institutional discrimination or microaggressions (Vaccaro, 2010). Additional forms of discrimination are experienced by social work faculty related to gender and race (Bent-Goodley & Sarnoff, 2008; Bonner & Thomas, 2001; Vakalahi, Starks, & Hendricks, 2007; Zamani, 2003), age (Carr et al., 2000), and sexual orientation (Chonody, Woodford, Brennan, Newman, & Wang, 2014; Woodford, Brennan, Gutierrez, & Luke, 2013).
An important form of institutional discrimination relates to the generosity and accessibility of work/life policies. Achieving work/life fit in the social work academy is particularly difficult for women because women’s developmental life cycle tends to be in conflict with the academic life cycle (Tower, Faul, Hamilton-Mason, Collins, & Gibson, 2015). Work/life fit or work/life satisfaction relates to the ability of a worker to both conduct her work obligations and maintain her family responsibilities. For example, female faculty spend more time caregiving compared to male faculty (Holley & Young, 2005).
Gender also plays a role in workload that is devalued, invisible, or unrewarded within and outside the social work academy. Faculty women tend to spend more time teaching and performing service compared to men who spend more time conducting research (Barrett & Barrett, 2011; Misra et al., 2011; Sakamoto et al., 2008). Overall, Hendel and Horn (2008) found gender to be an important predictor of work overload, role conflict, faculty interaction, and academic advancement.
This study offers the first follow-up study to Sakamoto et al. (2008) who asked: Are there gender differences in the social work academy? In particular, are there gender differences in salary, leadership, status-related positions and institutional characteristics, workload, and salary? Are there differences in how men and women perceive support within their campus climate?
Design
A cross-sectional electronic survey design was used to gather information from social work educators across the U.S. Institutional review board approval was obtained.
Sample
A stratified random sample was derived from all CSWE-accredited programs. Stratification occurred within nine divisions of four U.S. regions. Two states were randomly selected per division, resulting in the selection of 18 states for the sample. All BSW- and MSW-accredited programs, within the 18 states were included in the sample. Please see Table 1 for details about universities or individual faculty members excluded from the sample.
Sample Development.
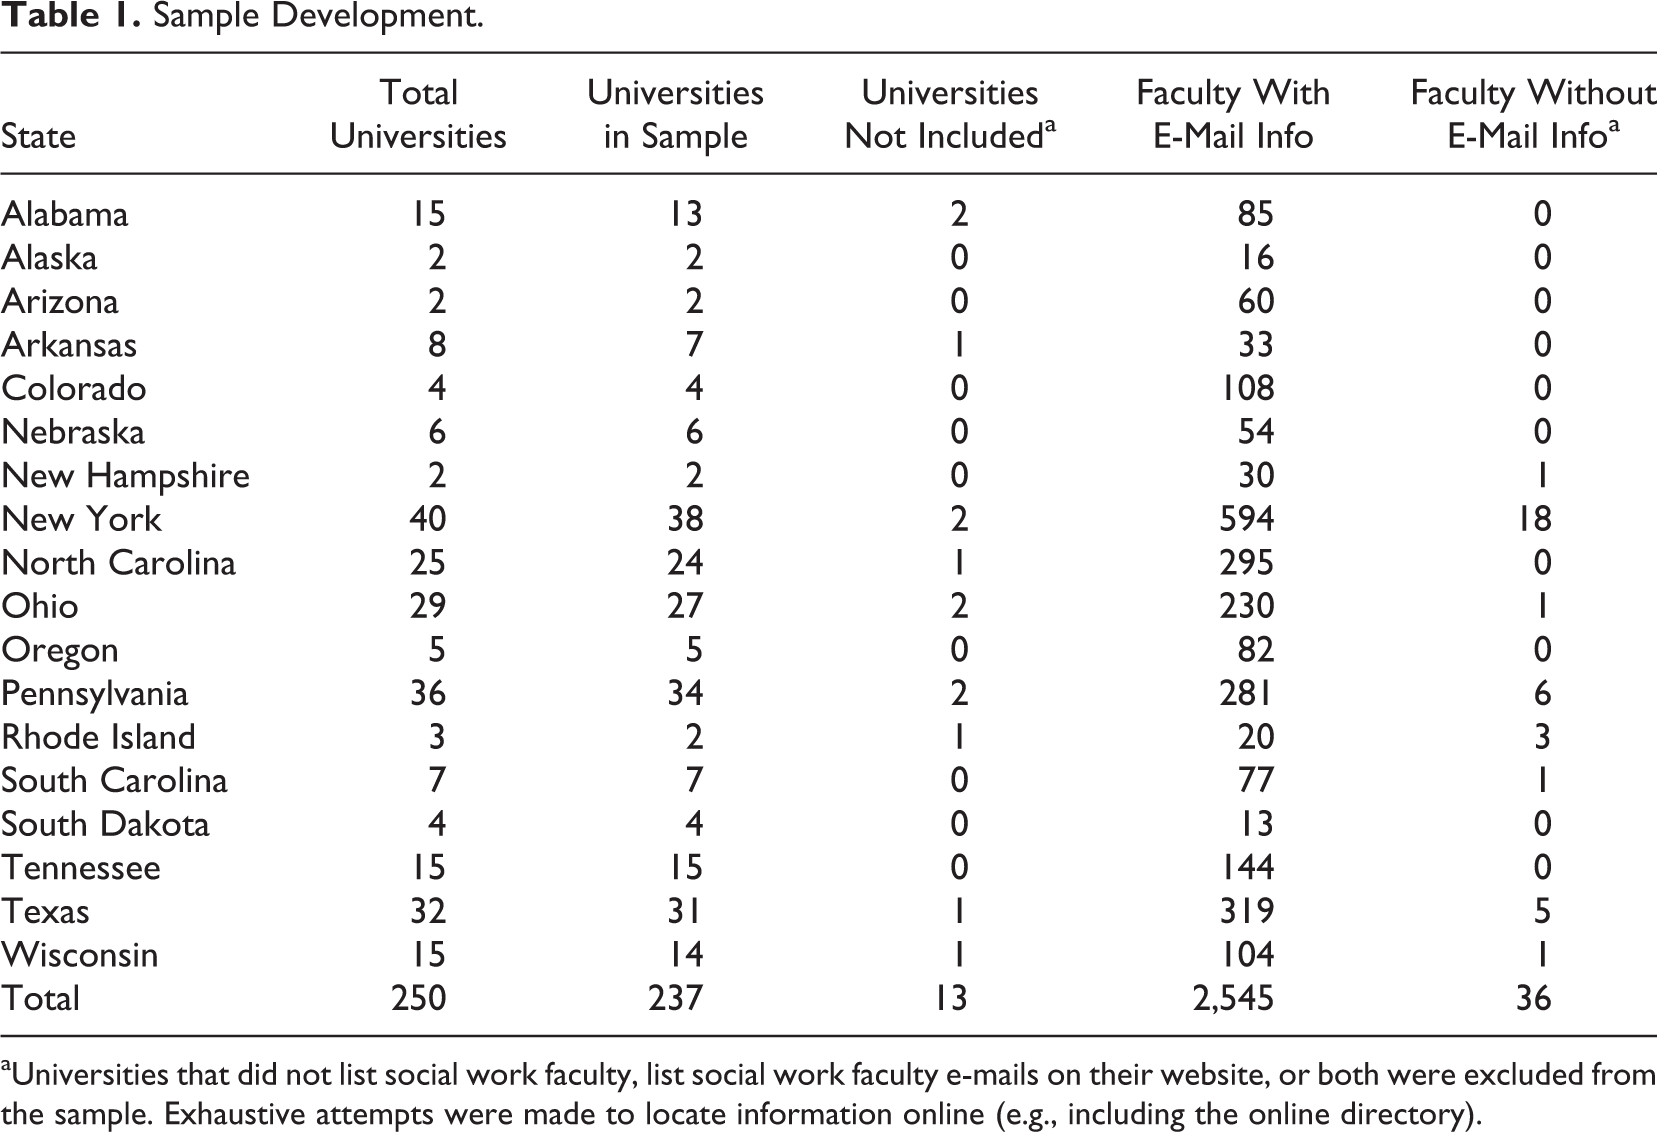
aUniversities that did not list social work faculty, list social work faculty e-mails on their website, or both were excluded from the sample. Exhaustive attempts were made to locate information online (e.g., including the online directory).
In the 18 randomly selected states, there were 230 BSW-accredited programs (46% of the population) and 94 MSW-accredited programs (40% of the population). Under the supervision of the researchers, research assistants compiled the names, titles, and e-mail addresses of faculty listed on each university’s website. Individuals with staff position titles (e.g., executive assistant or secretary) were removed. But titles associated with adjunct positions (e.g., lecturer) and support function positions (e.g., field director, continuing education director) were retained because these individuals tend to hold, at minimum, the social work profession’s terminal degree and contribute to the educational mission of the program. In total, there were 535 participants, resulting in a 21% response rate. Lack of responses to key variables resulted in an analytic sample of 493 participants.
The participants were demographically similar to full-time social work faculty as reported by CSWE (2017) in the annual report of social work education statistics. The 2016 CSWE report reflects 2015 data, the same year the survey was distributed among full-time social work faculty. For example, when comparing CSWE data to the demographic characteristics of survey participants: 71% compared to 72% identified as female, respectively; and 65.6% versus 73% identified as white. Seventy percent of survey participants and nearly 52% of CSWE faculty in general hold PhD degrees. No direct comparison to age was available in CSWE data.
Instrumentation
The online survey contained 115 items. In an effort to replicate Sakamoto et al. (2008), we measured demographic variables (e.g., age, race/ethnicity), school or department characteristics (e.g., gender of unit head and program levels offered), salary (e.g., salary and length of contract period), status-related variables (e.g., rank, tenure status, and unit head gender and title), and professional activities (e.g., time spent in research, teaching, and service). Additional variables related to these categories were also added, for example, gender identity and sexual orientation, disability status, and marital status. As another example, participants were asked to report all sources of income they receive, in addition to their base salary, such as administrative pay, course overload pay, salary from grants, and consulting and direct practice fees.
In an effort to reduce the number of questions asked, participants were asked to identify their university. Then, supervised by the researchers, research assistants visited each university or college website to aggregate data about the institutions such as size, student body, and Carnegie classification.
The survey also included the following five prevalidated scales: Climate Scale, external support, psychological demands, burnout inventory, and job satisfaction. A 34-item Campus Climate Scale with good validity and reliability was utilized. Content validity was evaluated by four experts in the area of campus climate, including the first author of the original scale (Tower, Bowen, & Alkadry, 2011). The Campus Climate Scale contains the following subscales (and αs for the current data set): The Positive University Climate subscale measures how a faculty member experiences their university (for this study their social work unit), including feeling respected and having available mentoring and collaboration opportunities (α = .85). Sample items from the Positive University Climate subscale include, “My opinions are respected” and “Mentoring in…social work has been beneficial to my career.” The Work/Life Climate subscale measures work/life fit and satisfaction (α = .77). A sample item from the Work/Life Climate subscale is, “I am expected to work an unhealthy and unreasonable number of hours to succeed.” The Cohesion subscale measures feelings of collegiality (α = .92).
The remaining four climate subscales measure different forms of discrimination. The Sexual Harassment subscale measures the perception of a hostile work environment (α = .85). The Gender Discrimination subscale measures perceptions of differential treatment in salary, access to resources, and opportunities (α = .71). The Gender Insensitivity subscale measures more subtle forms of discrimination, such as microaggressions (α = .83). The Additional Discrimination subscale measures perceptions of negative talk about people from different groups for example, religious groups, race/ethnicity, and sexual orientation (α = .88). For reporting purposes, the climate subscales measuring different forms of discrimination were reversed to move in the same direction as the other subscales (e.g., “Sexual Harassment subscale” to “Lack of Sexual Harassment”).
The External Job Support Scale measures support from family, friends, the public, and other professionals. The reliability of the scale was reported to be good, with an α of .77 (Horwitz, 2006). An additional question was added regarding support from students. The reliability for the Six-Question Scale used in this study was .74.
Psychological demands were measured by a Five-Question subscale selected from the Job Content Questionnaire. Reliability was reported to be good and consistent across populations with a mean Cronbach’s α of .63 (Karasek et al., 1998). For this study, the Cronbach’s α is .70.
Disengagement and exhaustion, two components of burnout, were measured by the 16-item Oldenburg Burnout Inventory (OLBI). Cronbach’s α levels of the OLBI-English version range from .74 to .87 for the Exhaustion subscale and .76 to .83 for the Disengagement subscale (Demerouti, Mostert, & Bakker, 2010). For this study, the Cronbach’s α for exhaustion is .86 and for disengagement .82.
Three questions from the Michigan Organizational Assessment Questionnaire were used to measure job satisfaction. The Job Satisfaction subscale has good reliability with a coefficient α of .84 (Bowling & Hammond, 2008). For this study, the Cronbach’s α for job satisfaction is .90.
Data Analysis
SPSS Version 24 was used to conduct univariate, bivariate, and multivariate analyses. Chi-square tests were used ex post facto to assess significant differences in various dichotomous variables based on gender. Independent samples t test and one-way analysis of variance tests were used post hoc to assess significant differences between male and female faculty on a variety of continuous variables.
For this study, a modeling procedure like structural equation modeling (SEM) would be the preferred analysis. However, within the context of a much smaller male than female sample (110 males vs. 383 females), a preliminary analysis of the data structure cautioned against SEM due to potential bias in the parameter estimates. Also, our multifactor measurement model with correlations between factors made the need for a larger sample size important when SEM analysis is considered (Wolf, Harrington, Clark, & Miller, 2013). Therefore, multiple regression analysis was chosen as the analysis method.
Multiple regression analyses allowed for the exploration of the influence of and interaction among multiple variables and highlighted the amount of variance explained in salaries for male and female faculty. Consistent with the suggested methodology for gender gap analysis, two separate hierarchical regression analyses for male and female faculty were used (Olson, 2013). The estimated effects of differences and potential discrimination can be determined by comparing the standardized β weights between the two regression analyses. To prepare for this analysis, the total salary criterion variable was transformed with an Lg10 transformation due to being highly positively skewed. In checking for multicollinearity, potential predictors that showed high correlation with other predictors were excluded. In addition, five multivariate outliers (one male, four females) were deleted from the analysis.
The predictors were entered in six blocks. In the first step, only demographic variables (white non-Hispanic or Other race/ethnicity; partnered status; lesbian, gay, bisexual, transgender, queer or questioning [LGBTQ] status) were entered as predictors. School, college, or department characteristics were entered second (graduate only, undergraduate only or joint, Carnegie classification rank, public or private institution). Status-related variables were entered third (being tenured or on tenure track, performing administrative duties, years of experience as a faculty member). Workload variables were entered as the fourth block (average hours worked per week, percentage of time teaching, percentage of time doing research, percentage of time doing service, percentage of time spent on positions outside the university). Nonwork-related activities were entered as the fifth block (percentage of time spent on leisure activities, housework, caring for a dependent child, and caring for a dependent person). Scales related to climate, external support, psychological demands, and burnout were entered as the sixth block (positive climate, work/life climate, cohesion, sexual harassment, gender discrimination, gender insensitivity, additional discrimination, external job support, psychological demands, job satisfaction, and burnout).
Findings
Demographics
Of the total sample, 38 or 7% did not indicate their gender. One percent (4) indicated themselves to be transgender (2) or female gender queer (2). This group was too small to include in any subsequent analysis. Table 2 contains demographic information for the remainder of the sample (493) who identified as either male (110, 22%) or female (383, 78%). Male faculty in this sample were significantly older than the female faculty. A significantly higher percentage of male faculty were married. Their spouses were significantly more likely to hold graduate degrees and significantly less likely to work full time. Male faculty’s caregiving responsibilities for older adults were also significantly less than for female faculty. Male faculty identified more as LGBTQ+.
Demographics.
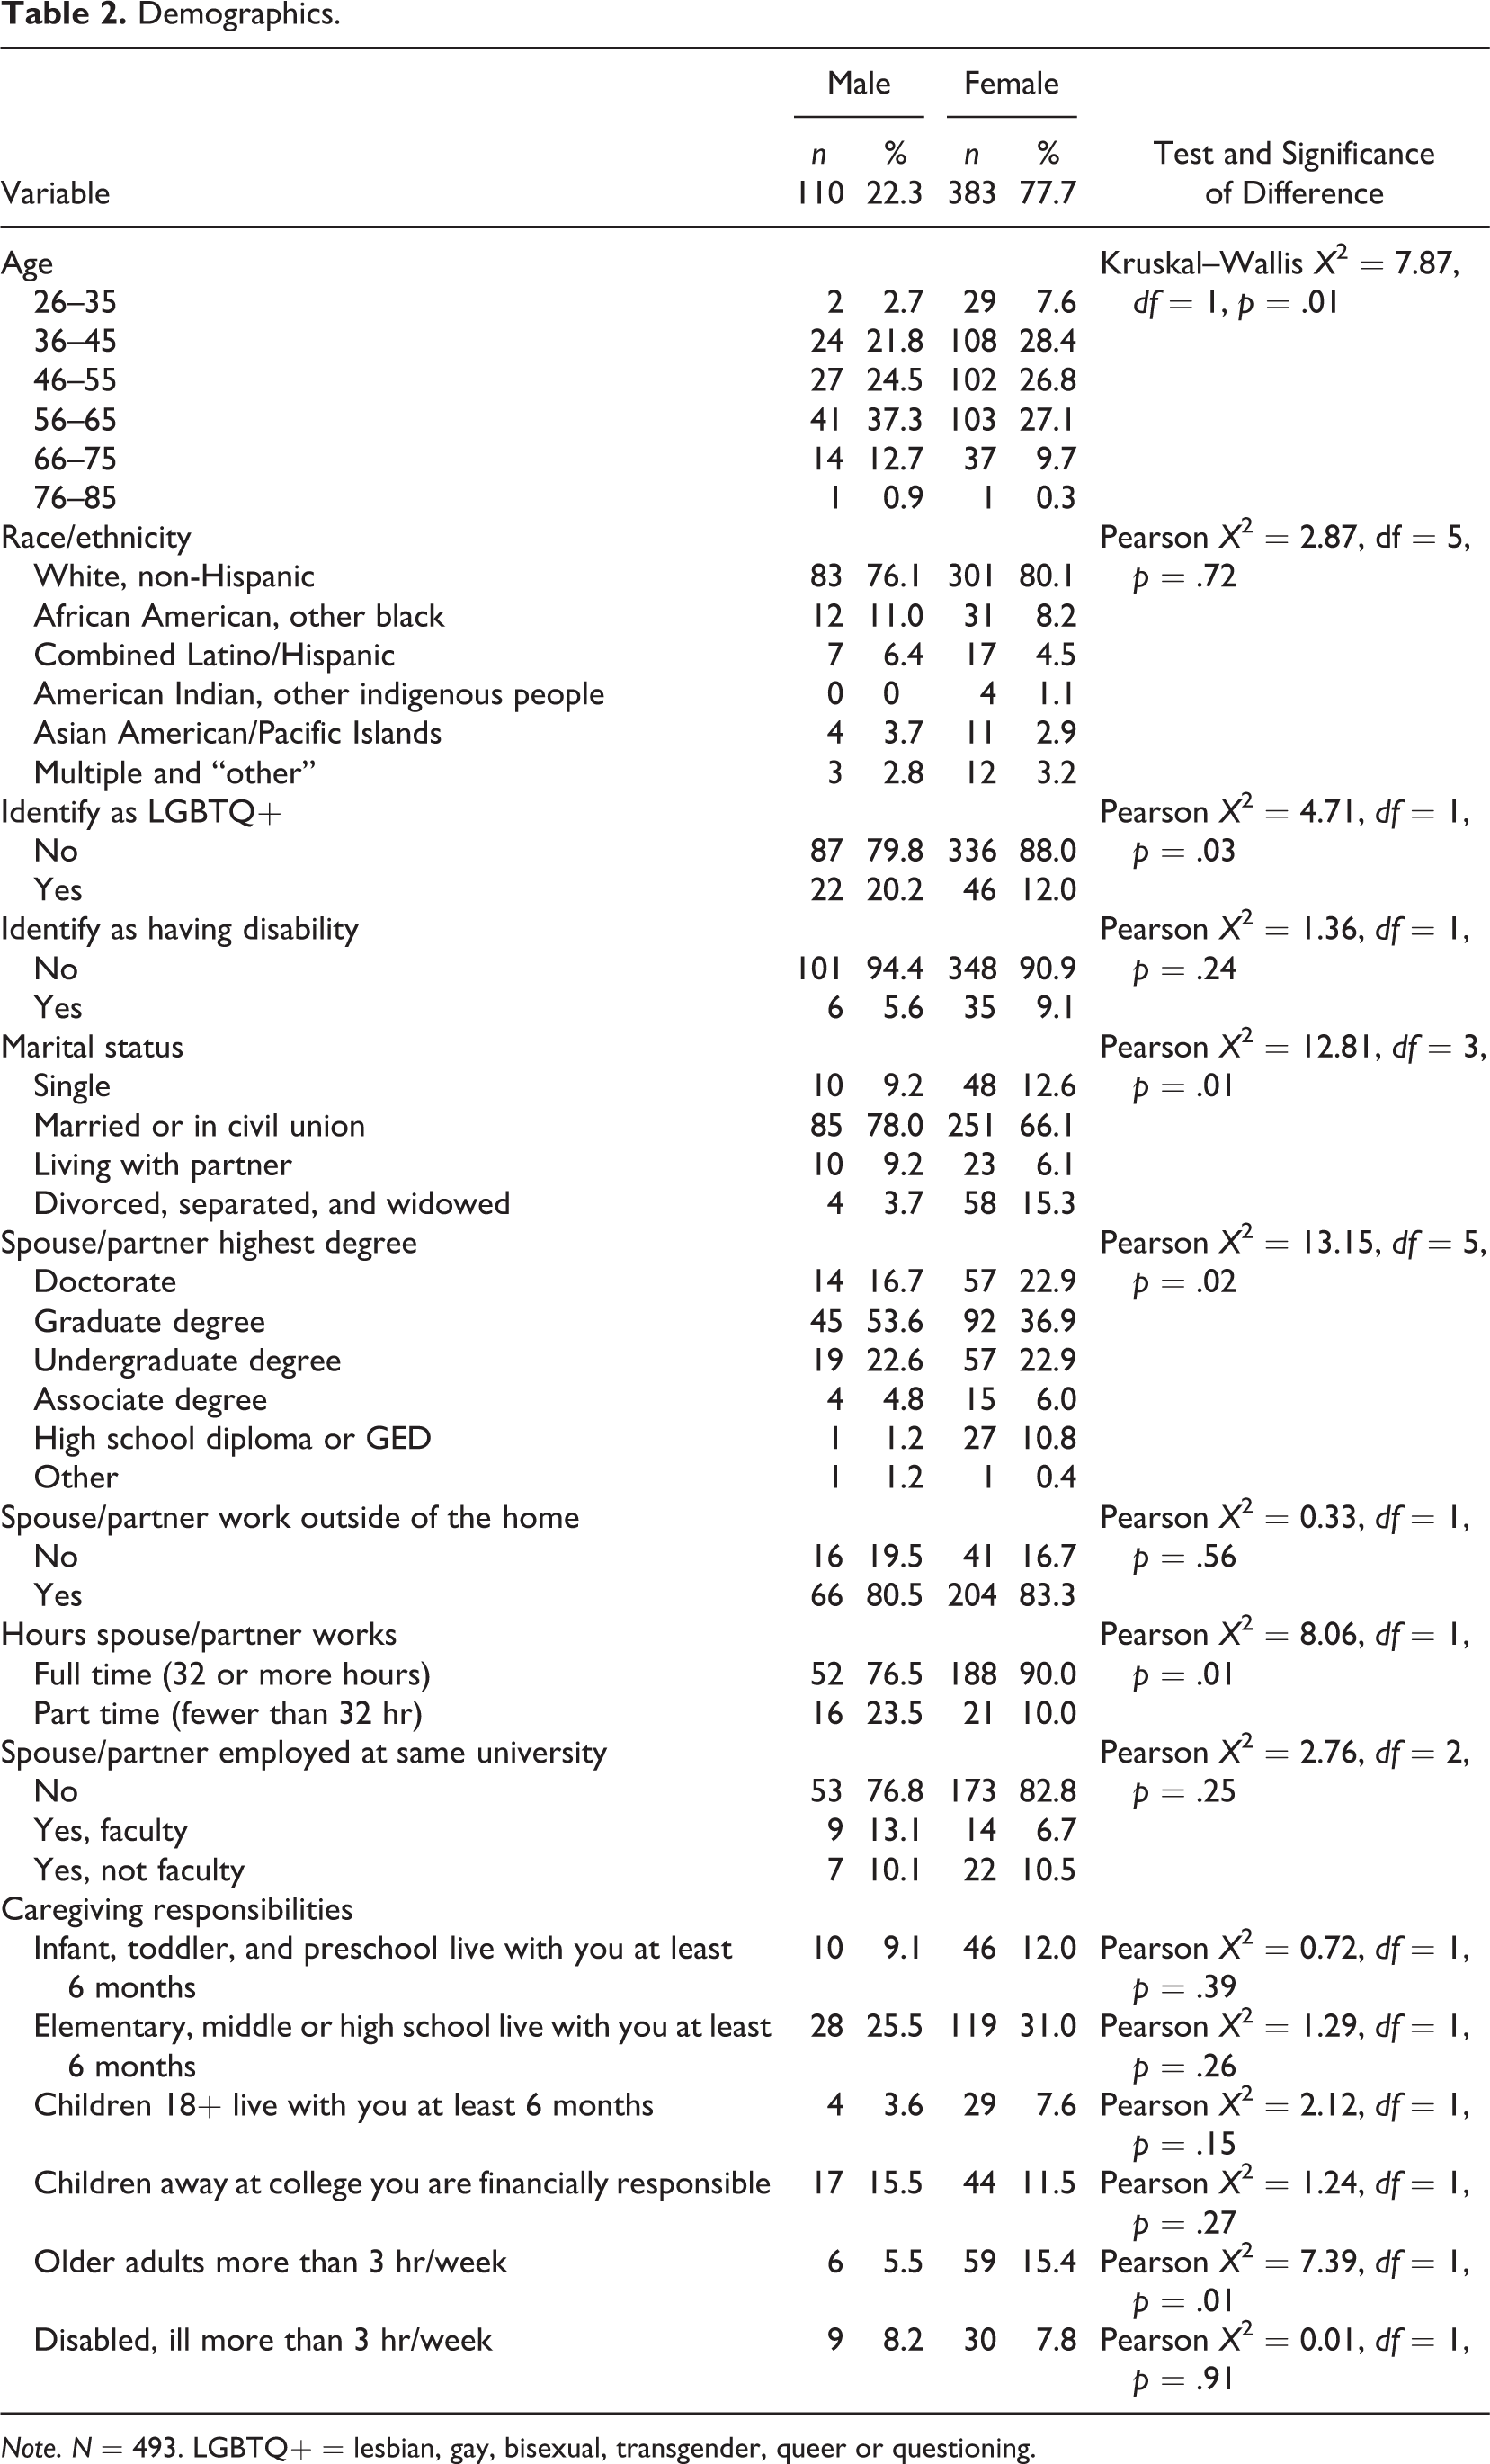
Note. N = 493. LGBTQ+ = lesbian, gay, bisexual, transgender, queer or questioning.
School or Department Characteristics
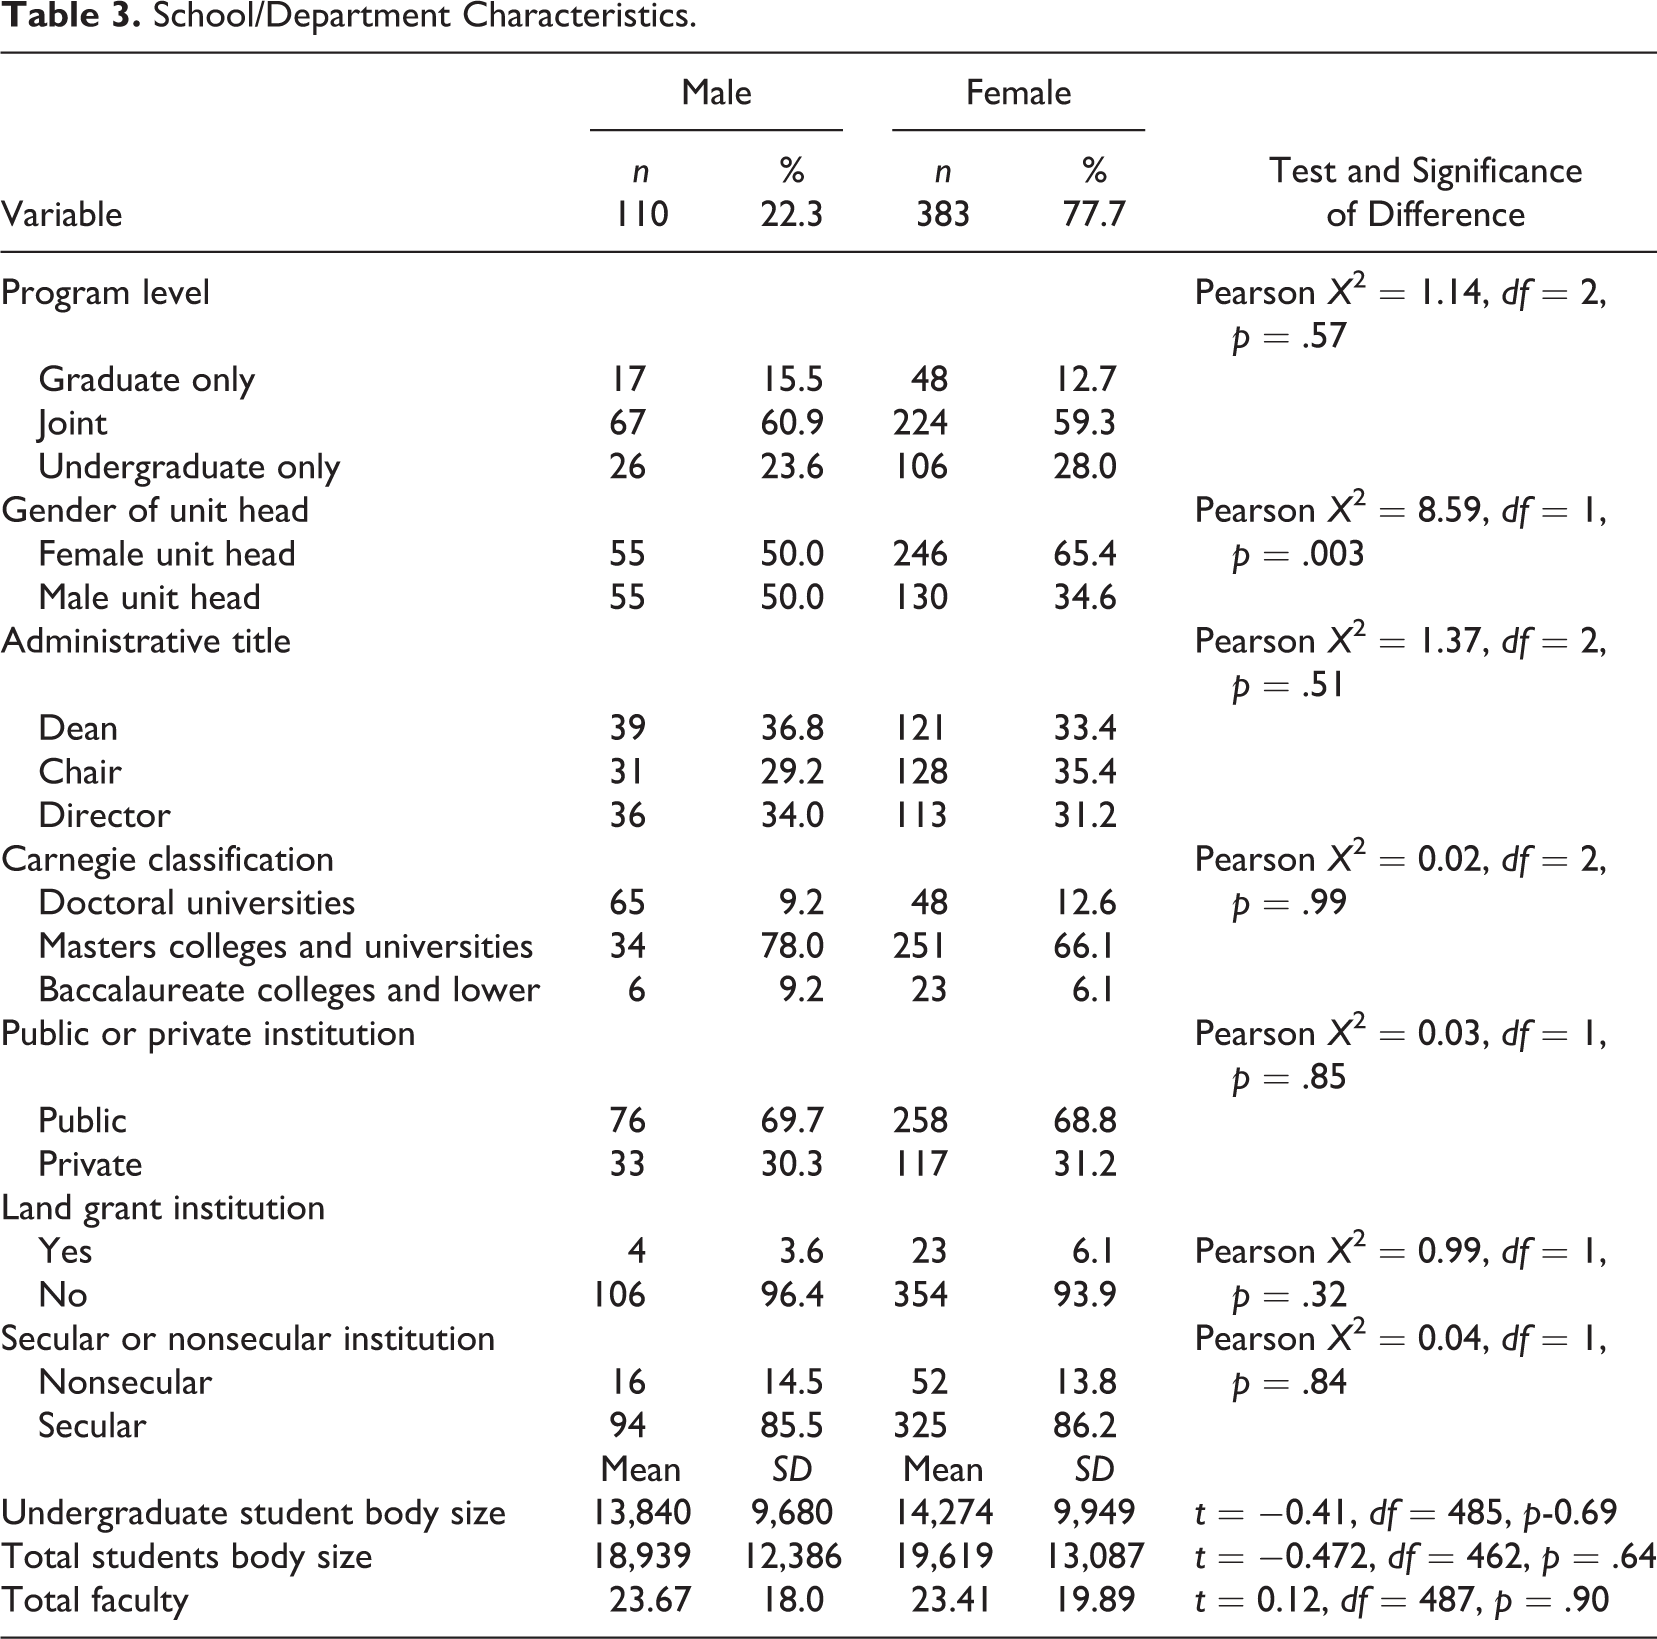
No significant differences were found between men and women on their school or department characteristics, except for the gender of the administrator. Female faculty were more likely to have a female unit head (66% vs. 35%), but men are equally likely to have a male (50%) or female (50%) unit head. See Table 3 for school or department characteristics.
School/Department Characteristics.
Salary
As shown in Table 4, there is a significant difference on base salary between men and women, with men making on average $76,337 and women $70,400. Salary discrimination was higher for females of color; however, there was not enough power to achieve significance (due to the low sample size of men). We report this here because future research should examine this relationship. It is worth noting that men with no administrative duties earned nearly the same salary as women with administrative duties ($82,300 vs. $82,800).
Salary.
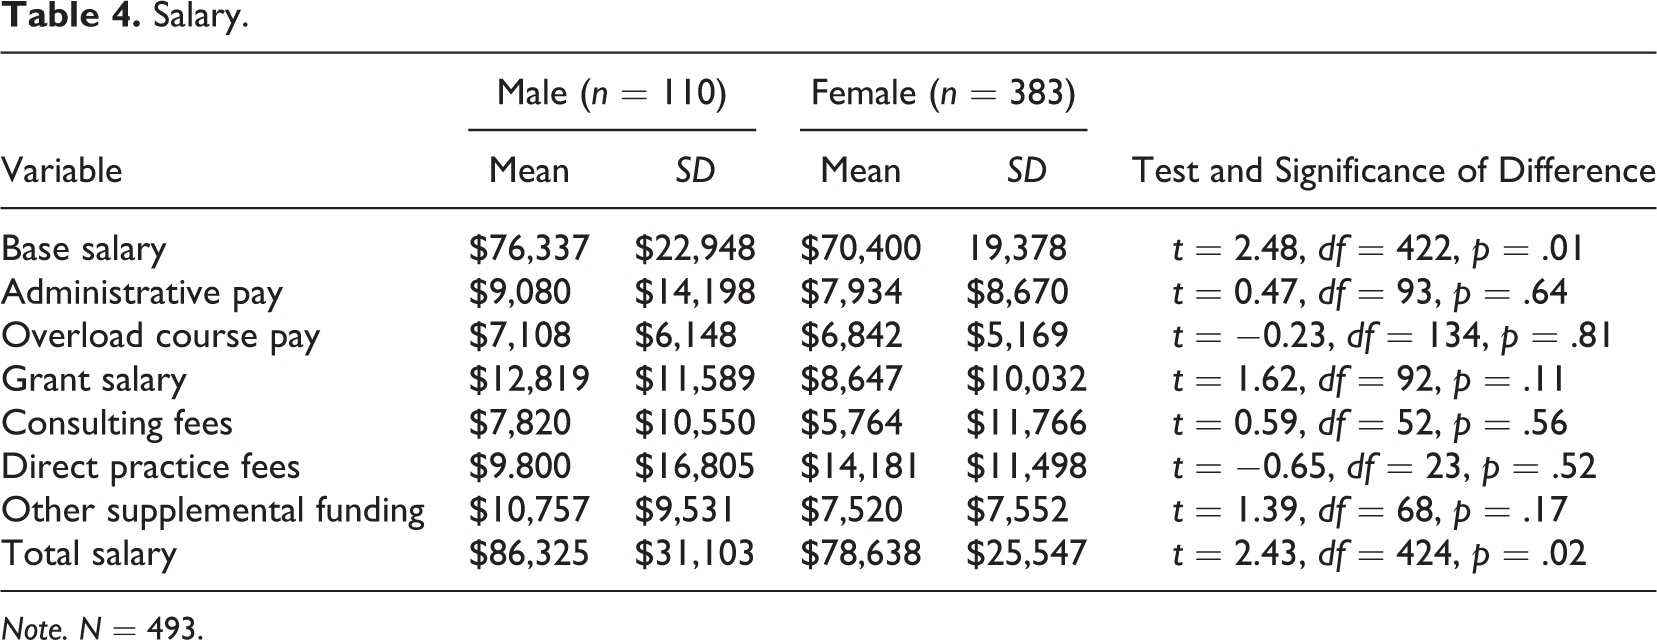
Note. N = 493.
Status-Related Variables
On status variables (Table 5), women and men have parity, except for rank and experience. Men are significantly more likely to be full professors and women are more likely to be associate professors. Men had more years of experience as a faculty member and also more years of experience at their current institution.
Status.
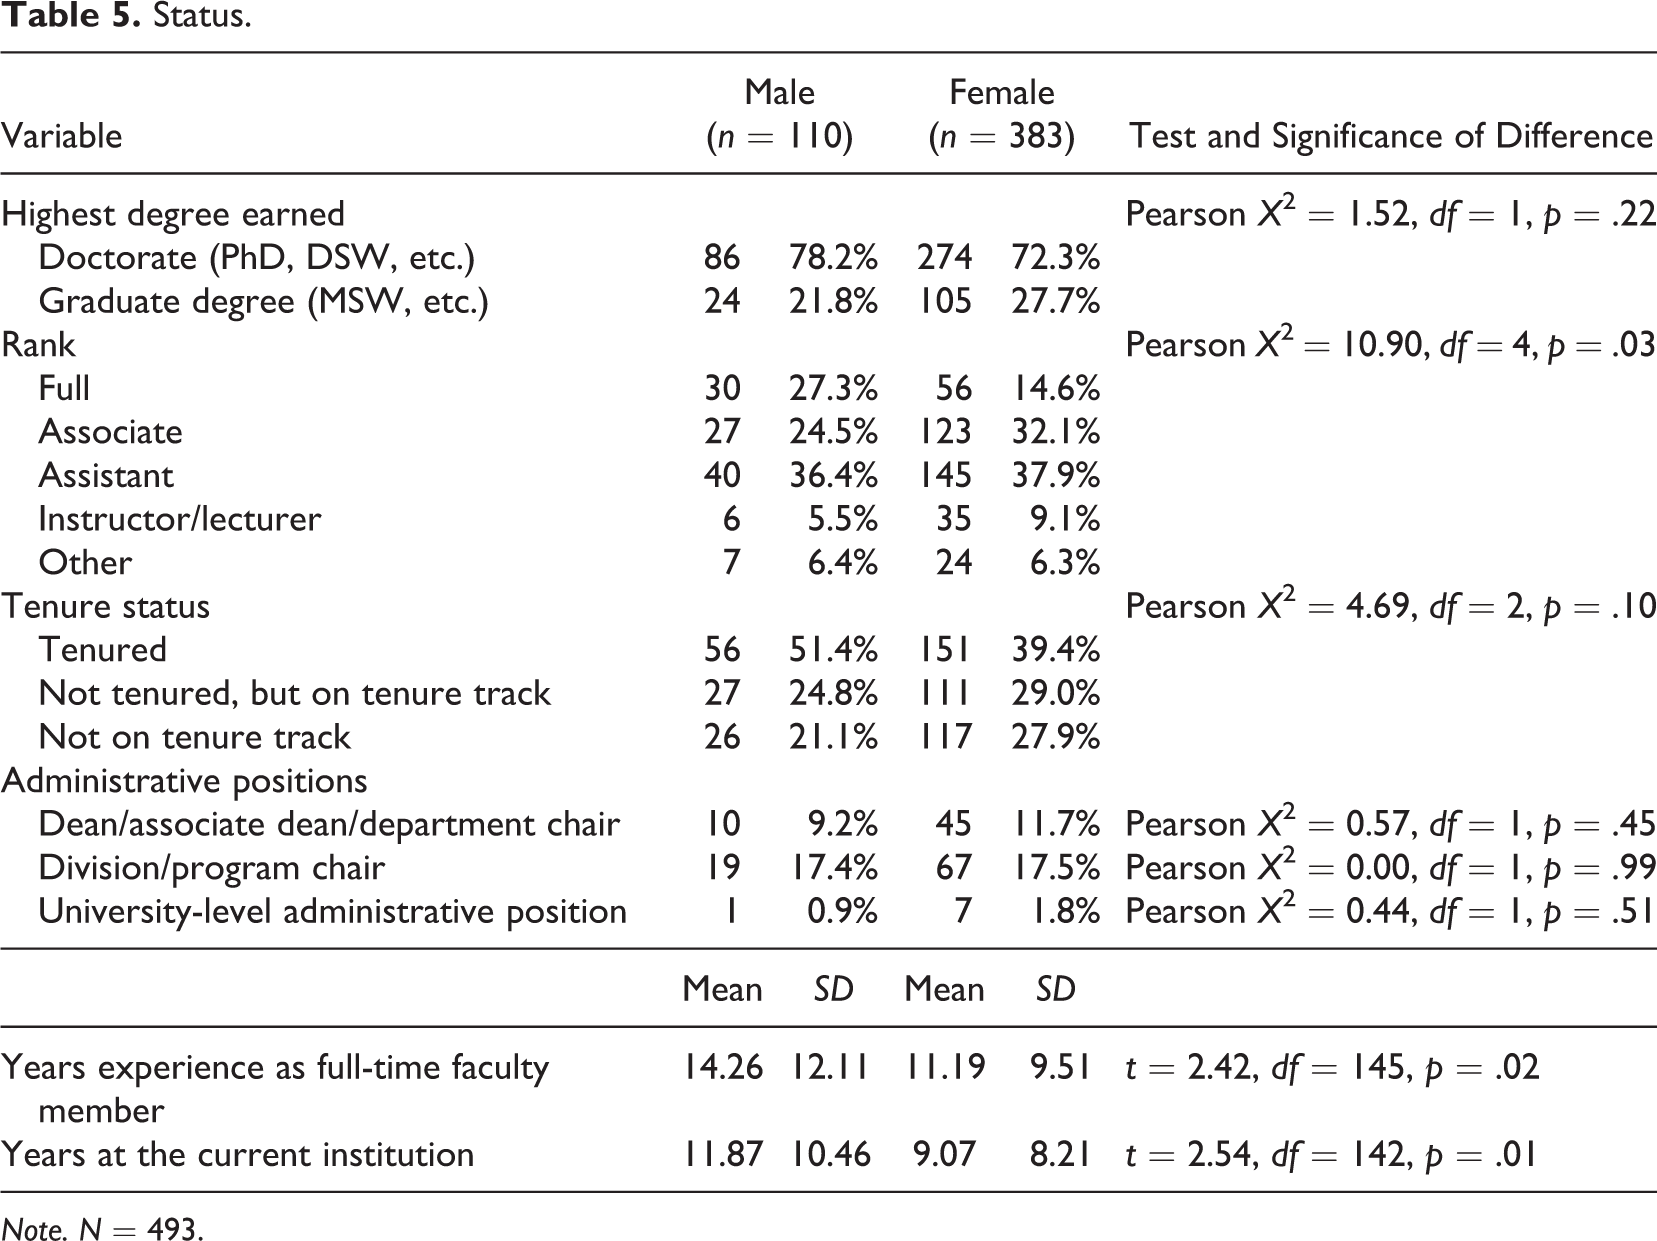
Note. N = 493.
Workload
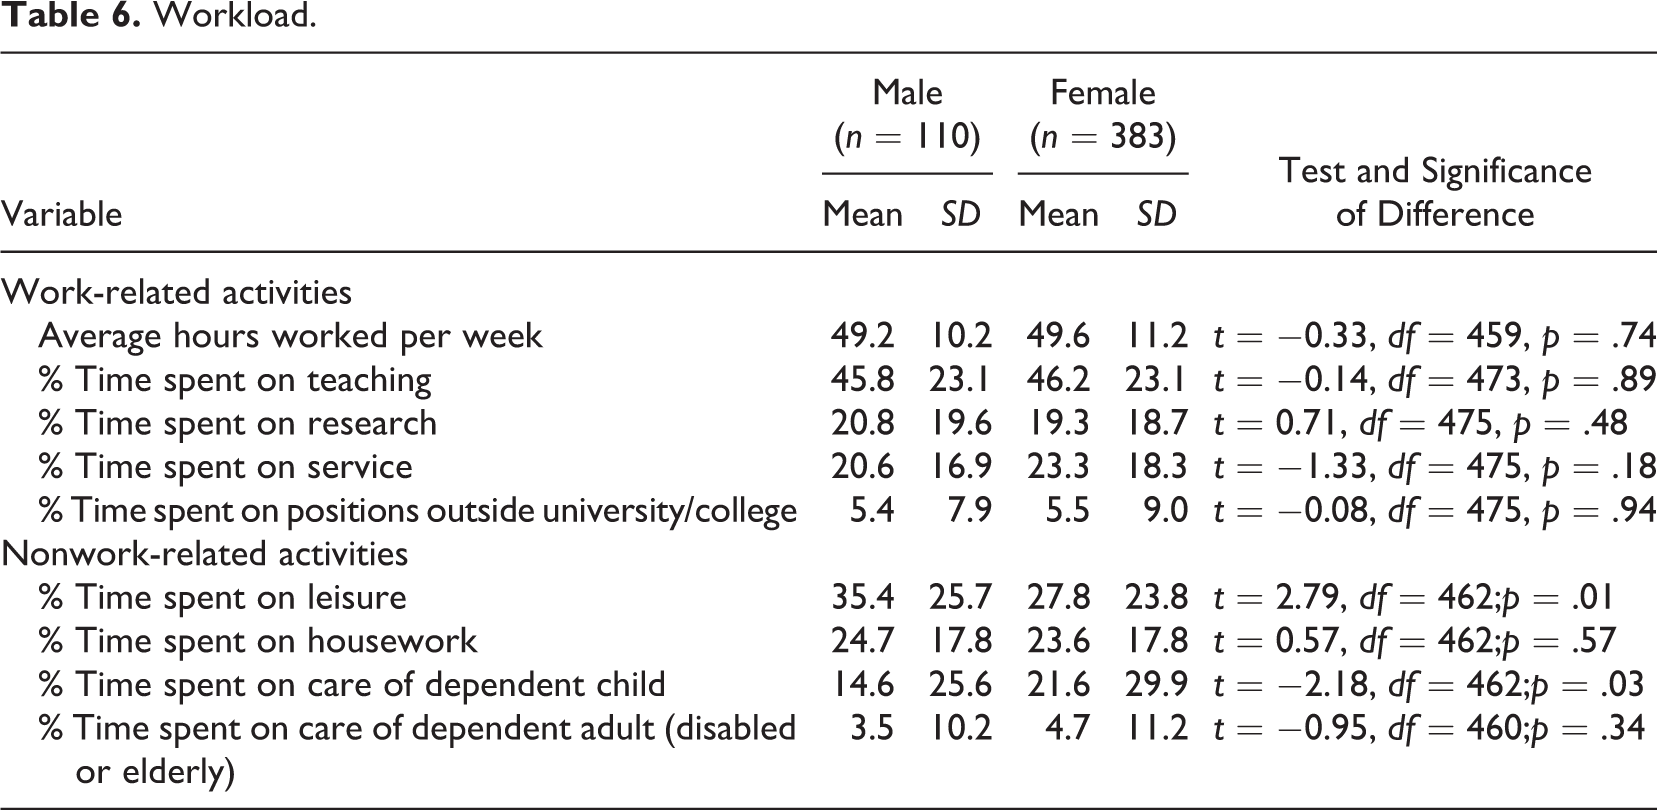
Social work faculty reported working about 50 hr per week (see Table 6). Average hours worked per week by gender was not significantly different. Hours spent on activities, such as teaching, research, and service, were also not significant between men and women. Men, however, spent significantly more time involved in leisure activities, and women spent significantly more time involved in taking care of dependent children.
Workload.
Climate Scale
As shown in Table 7, t tests reveal significant gender differences on all seven climate subscales: positive climate, work/life climate, cohesion, lack of sexual harassment, lack of gender insensitivity, lack of gender discrimination, and lack of other discrimination. Also shown in Table 7, t tests reveal significant gender differences in the exhaustion subscales of the Oldenburg Burnout Inventory. No significant difference was found in regard to the Disengagement subscale. Given the composition of the sample, it was not possible to examine differences on subscales and other important demographic variables (e.g., race, LGBTQ+, disability).
Scales.
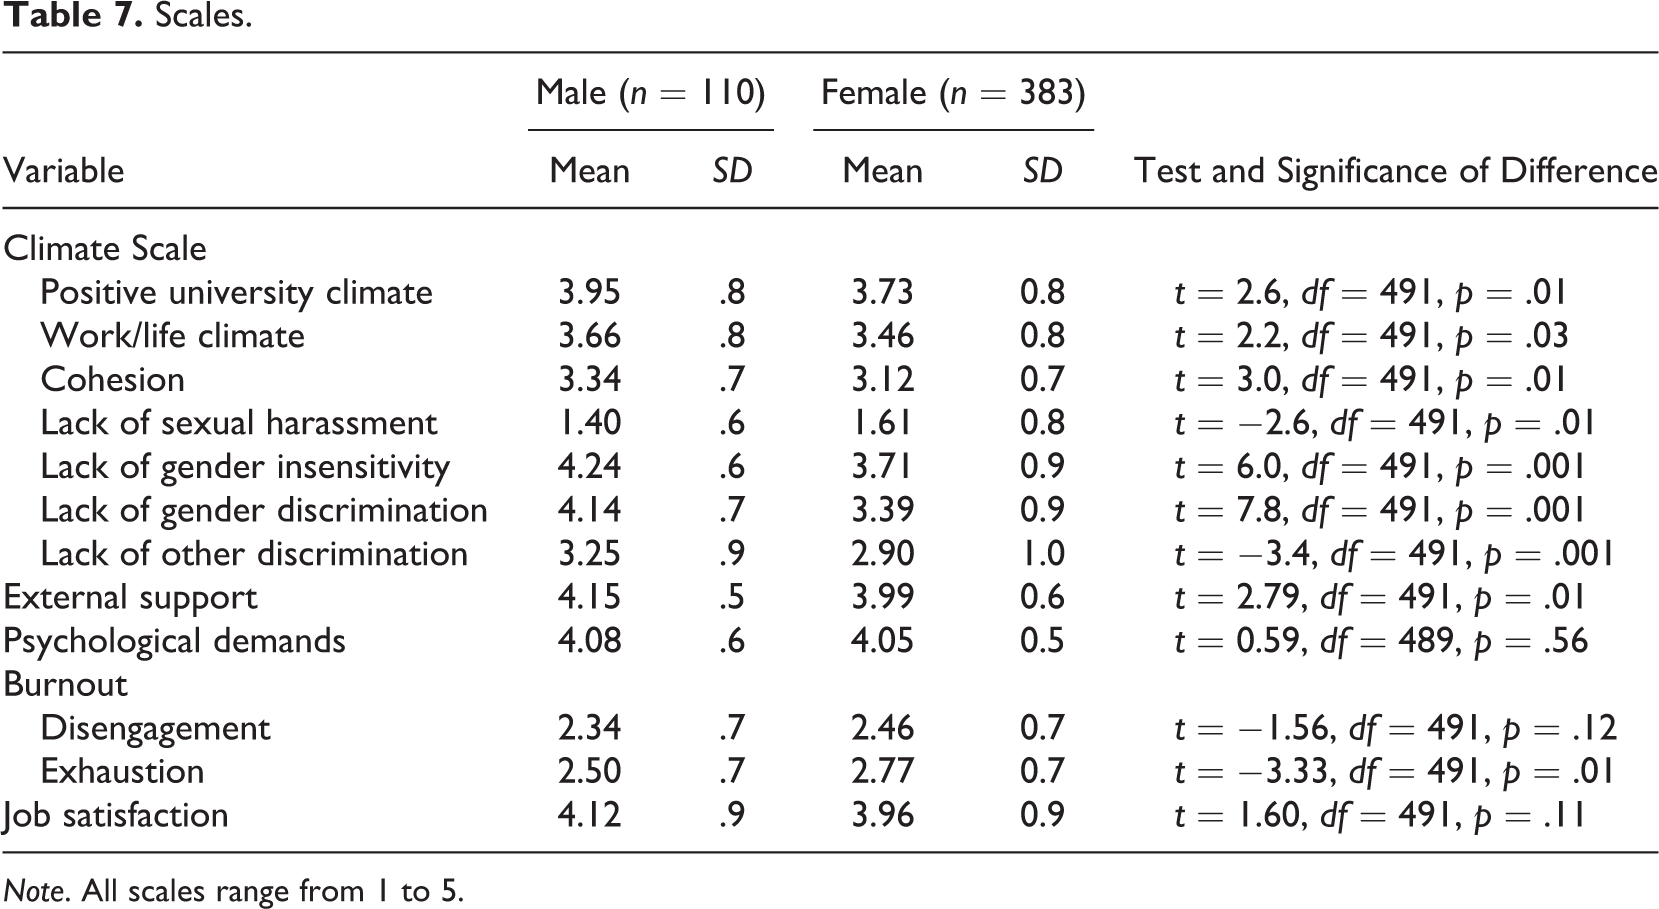
Note. All scales range from 1 to 5.
Predictors of Salary
Hierarchical regression analysis was used to explore which variables were the best predictors of total salary (see Table 8). Predictor variables were entered in six blocks. The weakest nonsignificant variables in each block were removed from the model for the sake of parsimony after the model was built. In the first step, only demographic variables (race or ethnicity, partnered status) were entered as predictors. The final model showed no significance for any of these variables, resulting in Block 1 removed from the model for the sake of parsimony. The second block of variables (that became Step 1 in the analyses results in Table 8) were then added, namely school, college, or department characteristics (program level, Carnegie classification, public or private institution). As can be seen in Table 8, these characteristics explained 11% of the variance in total salary for men and 12% of the variance in total salary for women, males: R 2 = .11, F(3, 77) = 3.16, p = .03; females: R 2 = .12, F(3, 267) = 12.21, p = .001. Adding the status-related variables, significantly improved the model, with the overall model predicting 60% of the variance in total salary for men and 48% of the variance in total salary for women, males: R 2 = .60, F(3, 74) = 18.39, p = .001; females: R 2 = .48, F(3, 264) = 40.59, p = .001. After workload variables were added, the model significantly improved for both men and women, with the overall model predicting 62% of the variance in total salary for men and 52% of the variance in total salary for women, males: R 2 = .62, F(2, 72) = 14.90, p = .001; females: R 2 = .52, F(2, 262) = 35.55, p = .001. The addition of nonwork-related activities did not significantly improve the model for men, but did improve the model for women, with the overall model predicting 63% of the variance in total salary for men and 54% of the variance in total salary for women, males: R 2 = .63, F(2, 70) = 11.89, p = .001; females: R 2 = .54, F(2, 260) = 29.90, p = .001. The addition of the final climate and burnout variables did not improve the model for women, but did significantly improve the model for men, with the overall model predicting 65% of the variance in total salary for men and 54% of the variance in total salary for women, males: R 2 = .65, F(1, 69) = 11.85, p = .001; females: R 2 = .54, F(1, 259) = 27.28, p = .001.
Prediction of Salary.
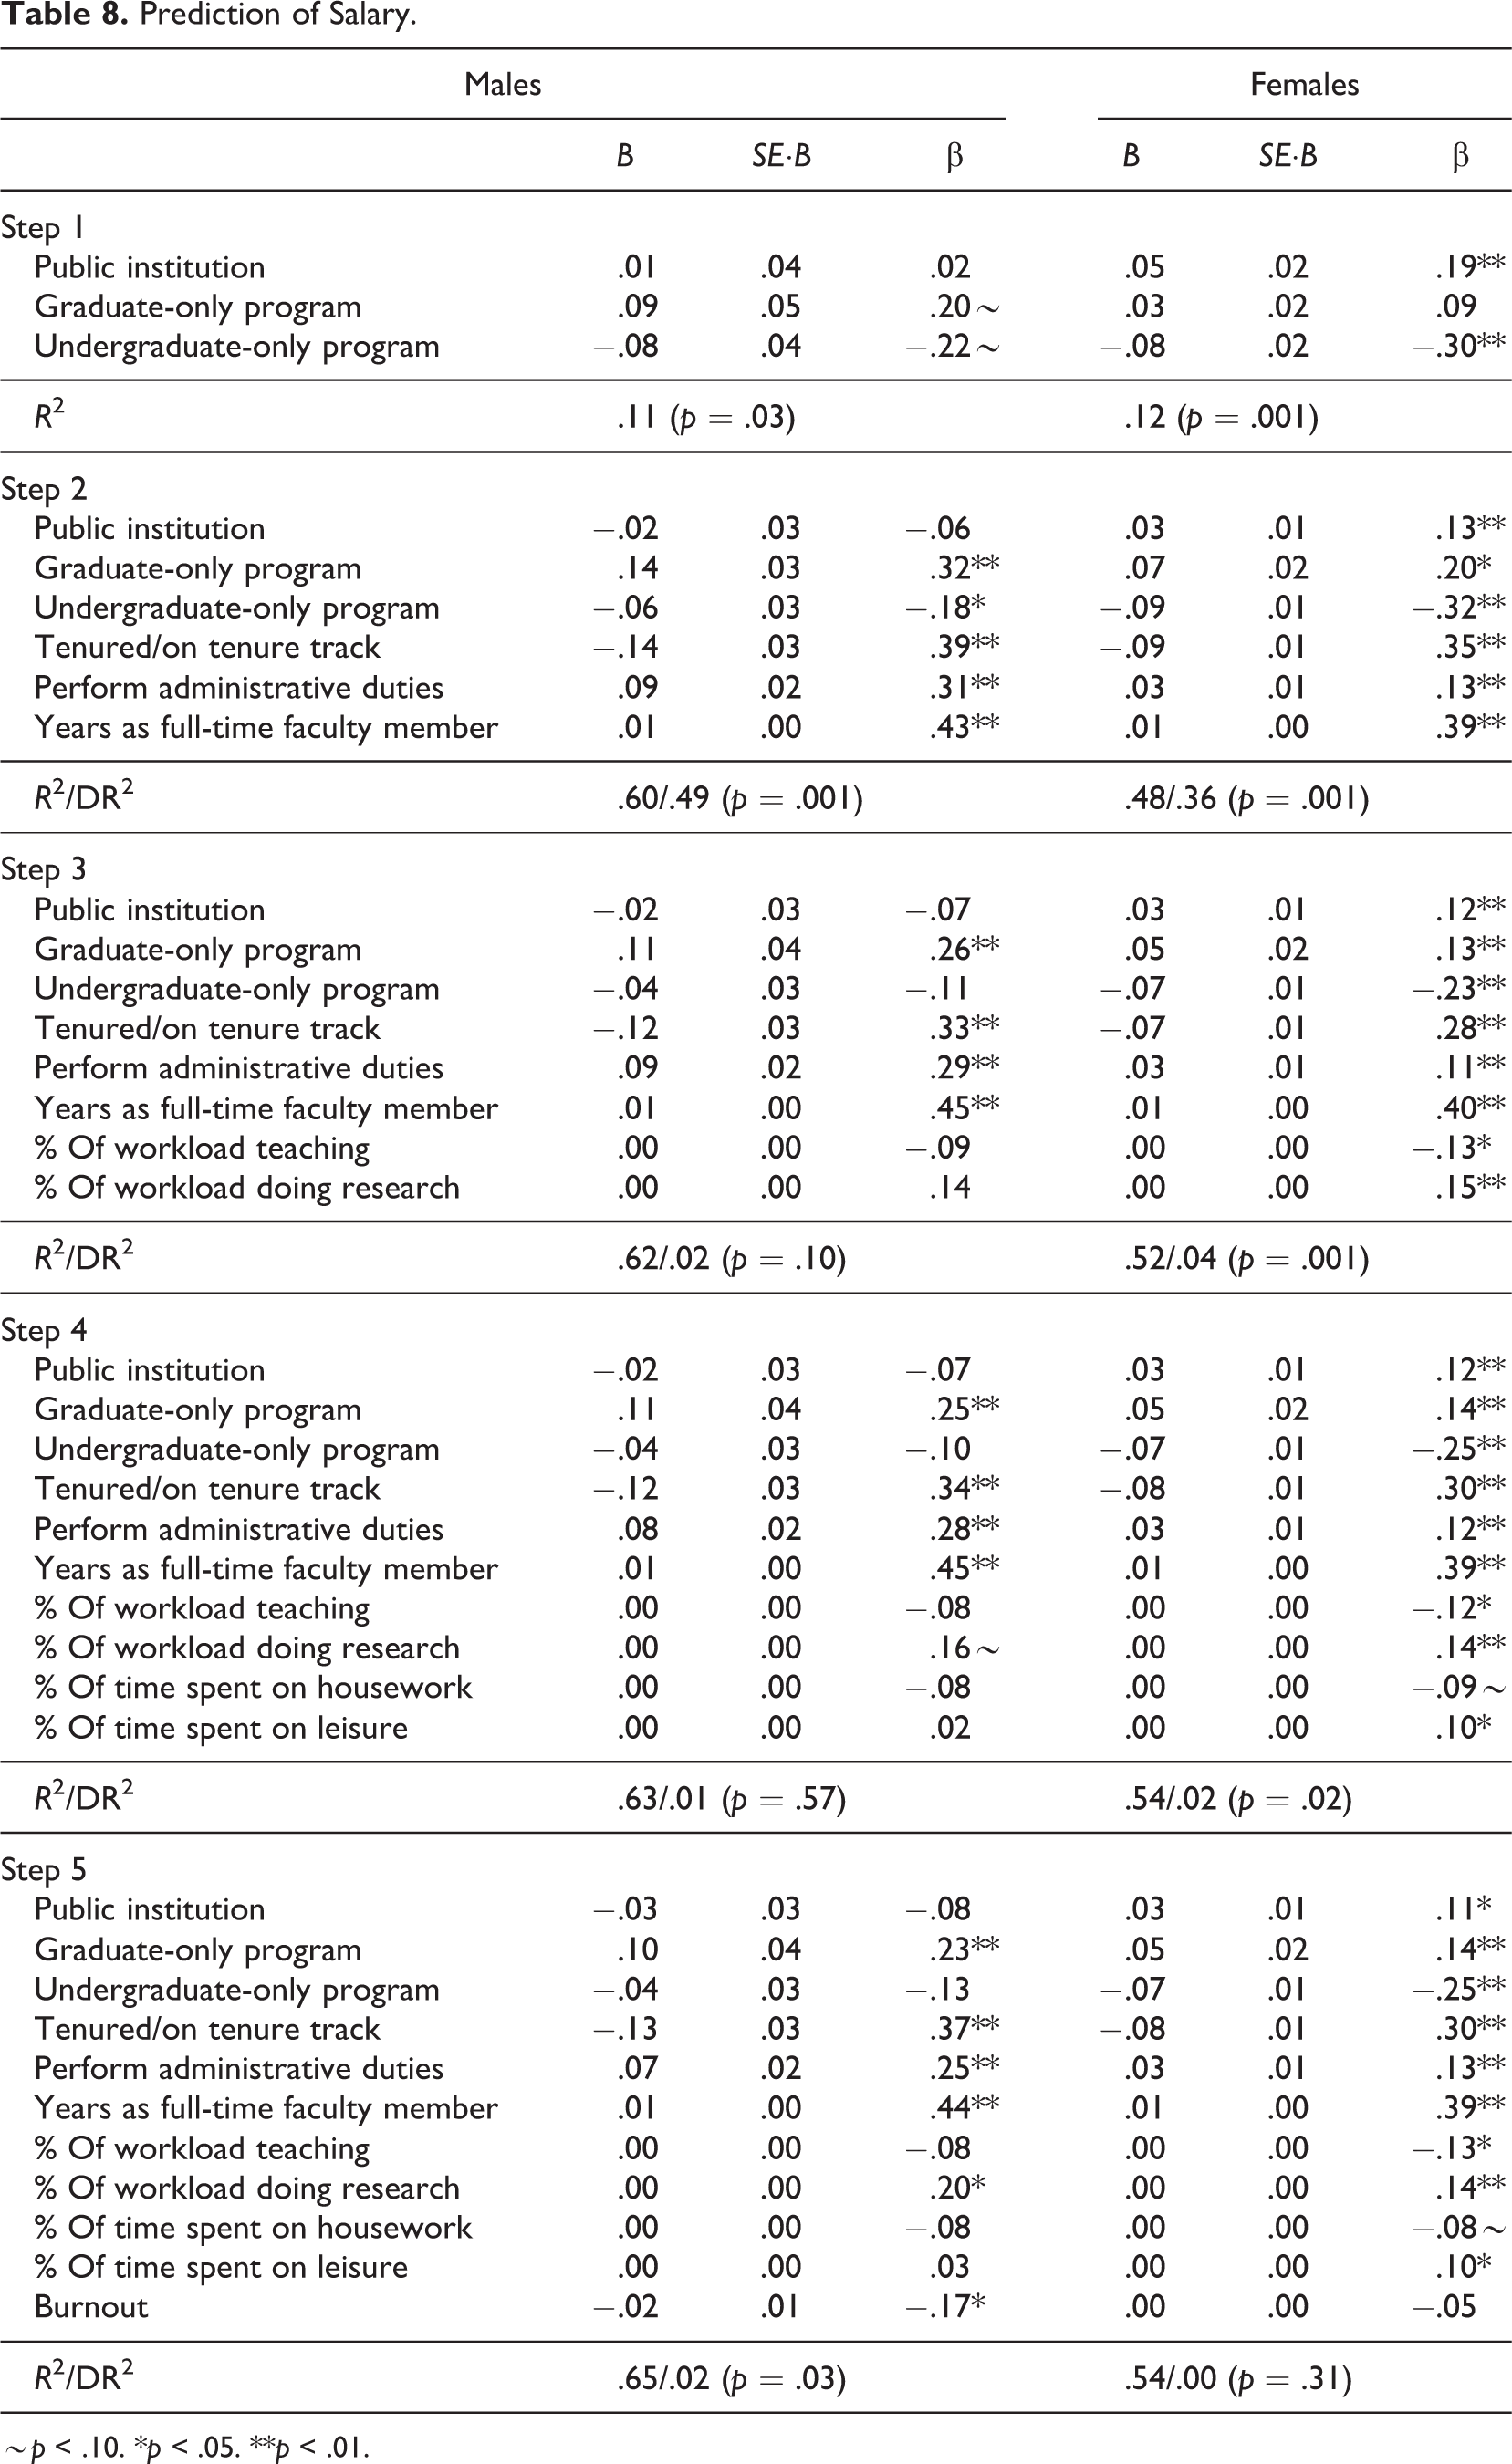
∼p < .10. *p < .05. **p < .01.
In the final model for men, the significant predictors were teaching in graduate-only programs, being on the tenure track or tenured, performing administrative duties, years of experience as a full-time faculty member, percentage of time devoted to research, and burnout (that negatively influenced total salary). The regression analysis showed an advantage for men teaching in graduate-only programs. There was not enough power to compare programs offering doctoral degrees and master degrees versus programs only offering master degrees. Sample size was too small to divide the subsample into these groups.
For women, the significant predictors were teaching at a public institution, teaching in graduate-only programs and not teaching in undergraduate-only programs, being on the tenure track, performing administrative duties, years of experience as a full-time faculty member, having teaching as a lower percentage of their workload, having research as a higher percentage of their workload, and spending more time on leisure activities. Spending fewer hours on housework showed a trend toward significance.
The largest gender gap, based on the standardized β coefficients, was seen in teaching at a public institution, with men being negatively affected versus women being positively affected by teaching at a public institution (difference in β2 = .19). Burnout affected males more negatively in terms of total salary than females (difference in β2 = .12). Performing administrative duties gave men a better salary than women (difference in β2 = .12). The same advantage was seen for men teaching in a graduate-only program (difference in β2 = .09). Women were more negatively affected for teaching in an undergraduate-only program (difference in β2 = .12). Being on a tenure track or being tenured gave men a greater advantage (difference in β2 = .07). The same was true for spending a higher percentage of time on research, a lower percentage of time on teaching, and having more experience as a full-time faculty member (difference in β2 = .06, .05, and .05, respectively).
Limitations
This study relied on a sample, not the population. As described previously, full-time faculty were identified using university websites. Attempts to access faculty contact information from CSWE were not successful. This limited our ability to understand differences among and between subpopulations of social work educators because the entire population of full-time faculty could not be accessed. The 21% response rate was acceptable but not as high as anticipated. While we tried to increase response rate and data accuracy by asking participants for the name of their university, it is possible that some faculty may not have responded to the survey for fear that their university name, paired with their demographics, would allow the researchers to identify them. Participants are representative of social work educators associated with CSWE-accredited programs (CSWE, 2016). Our analytic sample is also higher than similar studies (e.g., 493 vs. 269; Levin, Woodford, Guiterrez, & Luke, 2015).
Self-reports of salary were problematic, due to different standard contract time (i.e., 9 vs. 12 months) at different institutions and faculty not clearly defining their standard contract time in responses. However, questions were asked to obtain a full picture of total salary earned from a variety of additional tasks outside of base contract salary (e.g., administrative duties, research grants, overload teaching). The assumption was made that just being at a school with fewer opportunities for additional salary options could be seen as discriminatory in itself. Therefore, base pay was not used in the analysis but rather total pay from all sources and all additional tasks. Additionally, data collection occurred during the summer when some 9-month faculty may not be available to respond to an e-mailed survey. These issues emphasize the importance of CSWE taking the leadership in collecting salary data at the individual level.
Discussion
In the United States, there continues to be gender differences within the social work academy. As theorized, gender differences may be attributed to human capital, organizational structure and culture, and discrimination. Movement toward closing the gender gap has been made, but there is still a resounding gender disparity within the social work academy.
Salary and Leadership
Similar to Sakamoto et al. (2008), we found that men’s salaries were significantly higher than women’s. Sakamoto et al. reported a mean salary difference of about $9,000, whereas the mean salary difference in our data was nearly $6,000. Salary differentials may be decreasing for social work faculty but pay disparities continue. We also found that men with no administrative duties earned nearly the same salary as women with administrative duties. The unfortunate reality is that women in administrative roles still do not receive the same salary advantages as their male counterparts. We are clearly not “postwomen’s equity.”
A gender wage gap continues in nearly all U.S. jobs. The Institute for Women’s Policy Research (2018) reported that regardless of the gender composition of the occupation—male majority, female majority, or evenly mixed—men outearn women (e.g., male nurses earn more than female nurses) and between occupations (e.g., teachers who are 78% women earn $987 weekly vs. software developers who are 18% women earn $1,543). According to the American Council on Education, male faculty earn higher salaries than female faculty at all types of 4-year universities and within every faculty rank (Johnson, 2017).
The occupational segregation found in STEM fields has received a lot of focus because of the relatively low numbers of women in these fields. Yet, within social work, a female majority occupation, gender equity problems remain and receive limited attention. In fact, we found that different university and program characteristic variables predict higher salaries for women and men. For example, men’s salaries are negatively affected by working at public university, whereas women’s salaries are positively affected. It may be because public institutions tend to have more workplace protections than private institutions (U.S. Bureau of Labor Statistics, 2018).
Women experience a higher salary penalty for teaching in undergraduate-only programs, programs that may be perceived to have lower status than programs that offer graduate degrees. Female faculty are also more prevalent than male faculty in undergraduate-only programs. While women earn higher salaries in graduate-only programs compared to women in undergraduate-only programs, women’s salaries are lower than men’s salaries in graduate-only programs.
Men on the tenure track, with many years of experience, who are spending a higher percentage of their time on research, earn more money than women with the same characteristics. Women must spend less time on teaching to earn more money. The same is not true for men, as their time spent on teaching does not impact their salary; but, burnout affects men’s but not women’s salaries. Spending more time on leisure activities and finding better work/life fit are positively correlated with women’s salaries.
Leadership roles of faculty also had an impact on salary. Unlike Sakamoto et al. (2008) and other researchers, we found no significant difference in the leadership positions held by men and women. Also, administrative duties did not significantly differ between men and women. Previous research found that men were more likely to hold higher status leadership positions, such as dean (53% vs. 47%) and directors (66% vs. 34%), but fewer chair positions (30% vs. 70%) than women (Patrick & Colby, 2011). Social work faculty women may be reaching parity in administrative positions but not in their pay to perform the work. Men with administrative duties earned $10,020 more than women with administrative duties.
Status-Related Variables
Several status-related variables have improved since Sakamoto et al. (2008), including student body size, program type, Carnegie classification, and tenure status. Sakamoto et al. examined student body size, finding that women were overrepresented in the two smallest categories (under 2,000 and 2,001 to 4,999) of institutional sizes and underrepresented in the largest (20,000 and over). Sakamato et al. did not look at Carnegie classification. We found no significant difference on student body size or Carnegie classification. Sakamoto et al. reported that women were more likely to be in undergraduate-only program. We found no significant differences between men and women in the program types (undergraduate only, joint, graduate only) at which they were employed. Unlike Sakamoto et al., we found no significant difference in tenure status.
While several status variables have improved, rank remained consistent with Sakamoto’s et al. (2008) findings as well as others. Full professors, followed by associate, and assistant professors tend to earn highest salaries (Porter et al., 2008), while other ranks, such as lecturer or instructor, earn the least amount of money (AAUP, 2016). We found significant differences on rank, with men more likely to hold the rank of professor and women more likely to hold the rank of associate professor, instructor, and other. According to Misra, Lundquist, Holmes, and Agiomavritis (2011), “Men still hold more than three-quarters of full professorships in the United States, and women’s share of full professorships has increased only marginally over the last several decades” (p. 22). Time itself will not alleviate this pattern as researchers have documented a pattern of women more slowly advancing to the rank of full professor or not at all (Geisler, Kaminski, & Berkely, 2007).
Workload
Sakamoto et al. (2008) found that women had lower percentages of time in classroom teaching and research. We found only slight differences in workload activities between male and female faculty. But small differences become large differences over the course of a 30-week academic year. Female social work faculty are working 30 more hours per academic year, which is almost a full week more than their male counterparts.
A recent national study (n = 19,000) found women spent 30 minutes more per week on service than men (Guarino & Borden, 2017). Given the importance of social justice and service in the profession of social work, it is not surprising that social work faculty are spending more time on service than faculty across all disciplines. However, we were surprised that time spent on service by male and female social work faculty was not significantly different. The data revealed that nonwork-related activities have gendered patterns. Women spent significantly more time on caregiving; men spent significantly more time on leisure.
Climate
Female social work faculty perceived all seven climate measures—positive university climate, work/life climate, cohesion, gender insensitive, gender discrimination, sexual harassment, and other discrimination—as significantly worse than male social work faculty.
Social work administrators and faculty may learn from various National Science Foundation ADVANCE projects that have informed our understanding of and improved campus climate for female faculty (e.g., Bryan & Wilson, 2015; Latimer, Jackson, Dilks, Nolan, & Tower, 2014). After all, faculty women highly value positive interactions and relationships with colleagues (Callister, 2006). Perceptions of gender equity and inclusivity in academic departments have been found to be important factors for women’s productivity, overall job satisfaction, and intention to quit (Settles, Cortina, Malley, & Stewart, 2006).
Exhaustion
The data exposed that female social work faculty are more likely to experience exhaustion. Feeling exhausted, an indication of burnout (Demerouti, Bakker, Vardakou, & Kantas, 2003), aligns with past research on work-related stress experienced by women in academic roles and our findings that women spent more time working and caregiving. Second-wave feminist identified this as women “being liberated to hold two jobs,” while academics have called it the “second shift” (Hochschild & Manchung, 2012). Further, El-Alayli, Hansen-Brown, and Ceynar (2018) recently found that students have higher expectations and are more like to make special requests of their female professors. Expectations of female faculty, societal gender roles, and the elusive work–life balance contribute to exhaustion and the overall experience of female social work faculty (Anyikwa, Chiarelli-Helminiak, Hodge, & Wells-Wilbon, 2015).
Implications
Salary and Climate
While CSWE continues to conduct annual program surveys, data are currently collected in aggregate, making individual comparisons impossible. Other professional organizations collect and maintain salary data by demographic variables (e.g., American Association of College of Nurses Association, American Psychological Association, American Sociological Association, and Association of American Medical Colleges). CSWE must also mandate action be taken in cases of pay discrimination and climate issues.
CSWE accreditation guidelines must go farther to eliminate discrimination within the professorate by adding more substance to the implicit curriculum. The introduction of the implicit curriculum in 2008, and the subsequent requirement of its measurement in the 2015 accreditation standards, is necessary for identifying and addressing pay equity and climate concerns. According to the Educational Policy and Accreditation Standards (EPAS) guidelines, “Assessment also involves gathering data regarding the implicit curriculum, which may include but is not limited to an assessment of diversity, student development, faculty, administrative and governance structure, and resources” (CSWE, 2015, p. 18). While there is the opportunity for schools of social work to measure pay equity and campus climate for faculty, students, and staff, we are concerned many schools will not, as the guidelines only require the measurement of one self-selected component.
Should a program proactively select one or more of these issues for measurement, CSWE accreditors will not cite a program for poor findings (e.g., faculty perceiving poor campus climate or a finding of significant pay inequities). CSWE is interested in the ongoing nature of program improvement (CSWE, 2015). While this is an important stance to take to continue to help schools of social work improve, it is also a double-edged sword. A plan to address pay equity would involve significant challenges because salary is not solely determined by the school; therefore, a citation would conversely not be fair. If a school is not cited, however, the issue may not be resolved in a meaningful way. Social work faculty likely lose out on pay corrections that faculty from other professions receive, simply because their professional organizations require it.
Without a specific CSWE requirement for schools of social work to conduct pay equity and climate studies, schools that are aware of such issues may choose to avoid measuring it for reaccreditation, while other schools may remain unaware of the existence of such issues. Furthermore, it is likely that only the largest of schools will have the faculty numbers and diversity to be able to make meaningful comparisons. Therefore, CSWE is best positioned to find successful strategies to understand discrimination within the social work academy. The most efficient way to achieve this is for CSWE to collect and analyze data, at the individual level, on salary, climate, and faculty demographics from accredited schools of social work. Such a strategy would likely yield the highest response rate. We recognize that such an endeavor is resource intensive; however, our findings indicate that it is very much needed.
Additionally, while CSWE collects yearly data on social work programs in the aggregate, when a program is going through accreditation or reaccreditation, faculty data must be reported at the individual level. At the very least, CSWE could analyze the data already being collected. Either way this is an opportunity to begin to assess the existence of disparities and make recommendations for closing the gender gap.
Shifting Work Expectations
External forces are changing the landscape of higher education. Universities are relying more on tuition because of state budget cuts coupled with rising costs. The marketization of higher education is changing student and faculty expectations and perceptions. Students feel more entitled (Mark, 2013). Social work faculty are asked to be more student centered (Gates, Heffernan, & Sundore, 2015), while at the same time expected to produce grant-funded research for their institution. Such a shift comes at the expense of teaching and other forms of scholarship (Belcher, Pecukonis, & Knight, 2011). As a result, students and institutions view students more as consumers and faculty less as scholar-teachers. Simultaneously, tenure-track positions and grant dollars are diminishing.
The trend of universities reducing tenure-track positions leaves fewer people to distribute the institutional housekeeping. To reduce the disproportionate amount of service and teaching that faculty women experience, researchers have several suggestions. First, the trend in decreasing tenure-track positions needs to be reversed. Contrary to assumptions, a recent study showed that having a high percentage of nontenure-track faculty was actually more expensive (Sav, 2016). Researchers further recommend that (a) administrators must examine workload to ensure equity, (b) promotion and tenure guidelines must be clear and reward institutional housekeeping in promotion and tenure decisions, and (c) meaningful culture change is needed (Misra et al., 2011).
We found that women’s salaries are positively impacted for women who spend more time on leisure activities and experience better work/life fit. Schools of social work should offer more flexibility in meeting and course scheduling so that women can have time to make use of fitness facilities at universities, have lunch outside of the university/office, and meet informally with colleagues. We also suggest that women schedule leisure time into one’s day and not letting other priorities override it.
We recommend that female faculty take full advantage of work/life fit policies. If generous work/life policies do not exist at your institution, Tower et al. (2015) argue that social workers have the knowledge, values, and skills to advocate for work/life policies and ought to do so. For more information on the generosity of work/life policies in higher education, see Tower and Dilks (2015) for their review and ranking of more than 14 work/life policies at 124 universities. Finally, Tower (2015) provides a theoretically based case study on changing work/life policies at a land grant university.
Conclusion
Roberts and Smith (2002) advise that “there exists an illusion of inclusion in social work education in which the curriculum, personnel, and students reflect some level of diversity, but the organization itself is not transformed” (p. 196). As higher education is transformed by external forces, there is inadequate institutional attention and data on salary equity and work/life fit of social work faculty, within a female majority profession, that highly values “social justice,” “dignity and worth of the person,” and the “importance of human relationships” (National Association of Social Workers, 2017, p. 1). Now is the time for social work to be leaders in transforming higher education to recognize work/life fit, rewarding faculty who remain committed to higher education, and reviving affirmative action in hiring and advancing faculty.
Footnotes
Declaration of Conflicting Interests
The author(s) declared no potential conflicts of interest with respect to the research, authorship, and/or publication of this article.
Funding
The author(s) received no financial support for the research, authorship, and/or publication of this article.