
Abstract
Background:
Although hepatocytes have a remarkable regenerative power, the rapidity of acute liver failure makes liver transplantation the only definitive treatment. Attempts to incorporate engineered three-dimensional liver tissue in bioartificial liver devices or in implantable tissue constructs, to treat or bridge patients to self-recovery, were met with many challenges, amongst which is to find suitable polymeric matrices. We studied the feasibility of utilising nanocomposite polymers in three-dimensional scaffolds for hepatocytes.
Materials and methods:
Hepatocytes (HepG2) were seeded on a flat sheet and in three-dimensional scaffolds made of a nanocomposite polymer (Polyhedral Oligomeric Silsesquioxane [POSS]-modified polycaprolactone urea urethane) alone as well as with porogen particles, i.e. glucose, sodium bicarbonate and sodium chloride. The scaffold architecture, cell attachment and morphology were studied with scanning electron microscopy, and we assessed cell viability and functionality.
Results:
Cell attachment to the scaffolds was demonstrated. The scaffold made with glucose particles as porogen showed a narrower range of pore size with higher porosity and better inter-pore communications and seemed to encourage near normal cell morphology. There was a steady increase of albumin secretion throughout the experiment while the control (monolayer cell culture) showed a steep decrease after day 7. At the end of the experiment, there was no significant difference in viability and functionality between the scaffolds and the control.
Conclusion:
In this initial study, porogen particles were used to modify the scaffolds produced from the novel polymer. Although there was no significance against the control in functionality and viability, the demonstrable attachment on scanning electron microscopy suggest potential roles for this polymer and in particular for scaffolds made with glucose particles in liver tissue engineering.
Keywords
Introduction
Deaths from chronic liver disease (CLD) have increased by eight times in men and seven times in women over the past three decades, while the immediate mortality of acute liver disease (ALD) is in the range of 25–50%, patients with fulminant hepatic failure usually die without transplantation. 1,2 Liver transplantation remains the only effective treatment for ALD and CLD, but many patients on the liver transplant list die whilst waiting for a graft. In the UK alone, between 1 April 2006 and 31 March 2007, there was a total of 1199 patients awaiting transplantation, of which only 649 patients (54%) received transplantation while 99 patients died (8%). 3 Thus, bioartificial liver (BAL) tissue-engineered replacements could have a huge impact on the outcome of liver failure. Despite many on-going clinical trials into a number of BAL devices, none of them has been approved for clinical practice. 4 –13
The importance of polymeric matrices in the process of developing three-dimensional (3D) scaffolds is further highlighted by the fact that hepatocytes are attachment-dependent and lose their liver-specific function without optimal media and extracellular matrix (ECM) composition and cell-cell contacts. 14 –21 It was observed that the 3D matrix architecture influences the function and differentiation of liver cells in vitro. Hence, combining cell transplantation with 3D, highly porous polymeric matrices became an appealing concept. 20,22 –24 Therefore, the search continues to find the ideal polymer that would allow a high density of hepatocytes to maintain their viability and function and encourage neo-tissue formation. It has been agreed that the ideal scaffold should be biocompatible and highly porous with more controllable pore size ranging from 200 to 400 µm. 7,9 –13,21,25 –41
Our laboratory has developed a novel nanocomposite biodegradable scaffold namely POSS-modified polycaprolactone urea urethane (PU) made by integrating Polyhedral Oligomeric Silsesquioxane® (POSS®) [a trademark of Hybrid Plastics (www.hybridplastics.com)], a cytocompatible polymer nanofiller with poly-ɛ-caprolactone (PCL), a biodegradable and nontoxic aliphatic polyester, that can produce highly porous scaffolds. 42 –49
This study examined the suitability of this novel polymer and its porogen modifications as potential scaffolds for bioengineered liver. The architecture and porosity of the new scaffolds were examined under scanning electron microscopy (SEM) and the anchorage, viability and functionality of seeded hepatocytes were studied on these novel scaffolds in a static culture using SEM and a number of viability and functionality assays.
Methods
Polymer preparation, coagulation and construction
Making 2D discs
Discs of polymer were formed by spreading the polymer at 15% concentration in solvent over Melinex sheets supported by stainless steel plates, coagulated by slow immersion in distilled water at room temperature and cut (the polymer attached to the Melinex sheet as PMS) at 15-mm diameter for use into 24-well tissue culture plates (TCPs). Shaped PMS pieces were kept moist and placed in covered glass Petri dishes, autoclaved and kept sterile until needed; 15 mm discs from Melinex sheets alone (Melinex) and normal TCPs were used as control.
Making 3D scaffolds
The polymer (PU) at 10% concentration in solvent and three different modifications were made by adding porogens to PU at 1:1 weight ratio to produce four different scaffolds. The combined polymer and porogens were mixed manually then on a horizontal rotator for 1–2 h to produce a polymer with glucose (PG), sodium bicarbonate (PB) and with sodium chloride (PN); 15-mm discs were made by coagulating a 4.5–5 g spread of the mixtures into 5.5 cm diameter glass Petri dishes in distilled water overnight. Each of the four mixtures was coagulated in a dedicated water bath that was changed prior to cutting to shape four times lasting 30 min each time. The discs were then shaved off from two opposite sides to allow more contact with culture media. Scaffolds were kept moist, sealed in glass Petri dishes, and autoclaved.
Cell culturing conditions and cell seeding
Cell culturing, passaging and maintenance
HepG2 cells were cultured in growth medium (GM) made of DMEM+GlutaMAX™ Media (GIBCO®, Invitrogen™) with 10% foetal bovine serum (GIBCO®, Invitrogen™) and PenStrep at concentration of 100 Unit + 100 µg/ml of penicillin and streptomycine, respectively (10,000 Unit/ml penicillin and 10,000 µg/ml streptomycin, GIBCO®, Invitrogen™). 50 GM was changed over the culture every 3–4 days and the cells were passaged at 60–80% confluence.
HepG2 cell seeding
The scaffolds were covered with GM in 24-well TCPs (Costar®, Corning Inc.) and incubated at 37℃ and 5% CO2 overnight prior to moving them to a fresh 24-well plates for cell seeding. A 0.1 ml of homogenized HepG2 cells in GM at 10 × 104 cells/100 µl calculated using a haemocytometer were injected into each of the scaffolds and left to settle for 15–30 min, then topped up with 0.9 ml GM and incubated for 24 h. They were then carefully transferred into a pre-prepared 24-well plates with four wells already seeded with 10 × 104 cells/ml of GM and kept in similar conditions to the seeded scaffolds as control in TCPs. All wells were topped up to 2 ml of GM and incubated at 37℃ and 5% CO2. The day when the seeded 3D scaffolds were transferred into the pre-prepared wells was counted as day zero. Initial naked eye observation was used to assess the adequacy of the seeding process and further confirmation was made by comparing fluorescence intensity (FI) percentage difference on alamarBlue assay from randomly selected seeded scaffolds and from control in TCP on day 1.
Characterisation of the scaffolds and the seeded hepatocytes
Porosity calculation
An estimate of porosity was calculated by the formula:
Scanning electron microscopy
Pore sizes, pore wall thickness, inter-pore communications and hepatocytes anchorage, proliferation and cell-cell attachments were evaluated and described using SEM digital photography at 40, 320, 640 and 1250 times magnifications. Samples were fixed in 1.5% glutaraldehyde for a minimum of 2 h, washed with several changes of phosphate-buffered saline and postfixed using 1% osmium tetroxide/1.5% potassium ferricyanide for 12 h. Samples were then washed with distilled water and dehydrated through graded alcohols. Control samples were fixed using graded alcohol dehydration starting at 70%. All samples were then attached to aluminium stubs with double-sided sticky tabs (TAAB) and then coated with gold using an SC500 (EMScope) sputter coater before being examined and photographed using a Philips 501 scanning electron microscope.
Assessment of hepatocytes viability, proliferation and functionality
AlamarBlue® and PicoGreen® assays
HepG2 metabolic activities, proliferation and growth and scaffold cytotoxicity were assessed using alamarBlue® assay (Molecular Probes®, Invitrogen®) on days 1, 3, 7 and 14. A standard curve was worked out experimentally which suggested 4 h incubation period for the HepG2 cell line to be the optimum timing to measure the FI for alamarBlue®. Further quantification of the cell-line proliferation was made by quantitating double-stranded DNA (dsDNA) using PicoGreen® assay (Quant-iT™ PicoGreen® dsDNA Assay Kit, Molecular Probes®, Invitrogen®) on culture D10 of experiments on PMS and on culture D7 and D14 of experiments on the 3D scaffolds.
FI was measured using a fluorescence plate reader (Fluoroskan Ascent® FL, and Ascent Software, Thermo Labsystems, Helsinki, Finland) at 530 nm excitation wavelength and 620 nm emission wavelength for alamarBlue® and at 485 nm excitation and 538 nm emission for PicoGreen®. We used the means of the actual FI measurements in plotting for the graphs and charts and the percentage difference was calculated from the following equation:

Measurement of aspartate transferase, albumin and urea in supernatant medium
Human albumin ELISA assay
Albumin secretion from 3D scaffolds and their control in TCP were measured using Human Albumin ELISA Quantification Kit (Bethyl Laboratories, Inc., Montgomery, USA) using manufacturer’s protocol.
Urea synthesis and aspartate transferase
Modular analytics clinical chemistry system (Roche Diagnostics, Basel, Switzerland) was used to measure urea and aspartate transferase (AST) levels in the GM supernatant from 3D scaffolds and their control in TCP.
Statistical analysis and software
GraphPad PRISM® Version 5.0 (GraphPad Software, Inc., San Diego, USA) was used for statistical analysis and graph illustration. Unless stated otherwise, samples were made in quadruplets (n4) and statistical analysis was performed at 95% CI. Data was initially analysed using Kruskal-Wallis test and further specific pairwise post-hoc comparisons were carried out as needed using Dunn's Multiple Comparison test or Mann Whitney U test. 51
Results
Scaffolds characterisation
Using the percentage porosity equation, we estimated the porosity of PG, PB and PN to be around 95% while that of the PU to be around 90%. The scaffold made by using glucose as porogen (PG) demonstrated a better architecture than the other scaffolds by means of better porosity with most of pore sizes above 200 µm (ranging from 100–350 µm), highly communicative porous structure and pore walls as thin as 1.2–12 µm. The other scaffolds were relatively far off the ideal scaffold architecturally. PU scaffolds had a large pore size ranging from 500 µm–2 mm, distinctly thick pore walls towards the surface of the polymer (170–650 µm) but thinner towards the lower half of the polymer (10–100 µm), with limited inter-pore communications, and pores were lined with clusters of spherical bodies ranging in size from 2 to 5 µm. PB and PN scaffolds had extremely variable pore sizes (20–750 µm and 150 µm–1.5 mm, respectively; Figure 1). Scanning electron microscopy (SEM) at (1) 40 and (2) 320 times magnifications of transverse sections of the 3D scaffolds: (a) polycaprolactone urea urethane (PU), (b) polymer with glucose (PG), (c) sodium bicarbonate (PB) and (d) sodium chloride (PN). The pores and the wall thickness are largest in PU and finest in PB while PN shows a distinct layer of fine pores on top of a layer of much larger pore sizes. Only PG demonstrated a nearly uniformal mixture of pore sizes which is neither very large nor very small, along with a narrower range of wall thickness and more interpore communications. Although PB at higher magnification demonstrated higher interpore communications, the overall pore sizes were either too small or too large, rendering their support to cells and their influence on hepatocytes’ proliferation less uniformal and hence less predictable.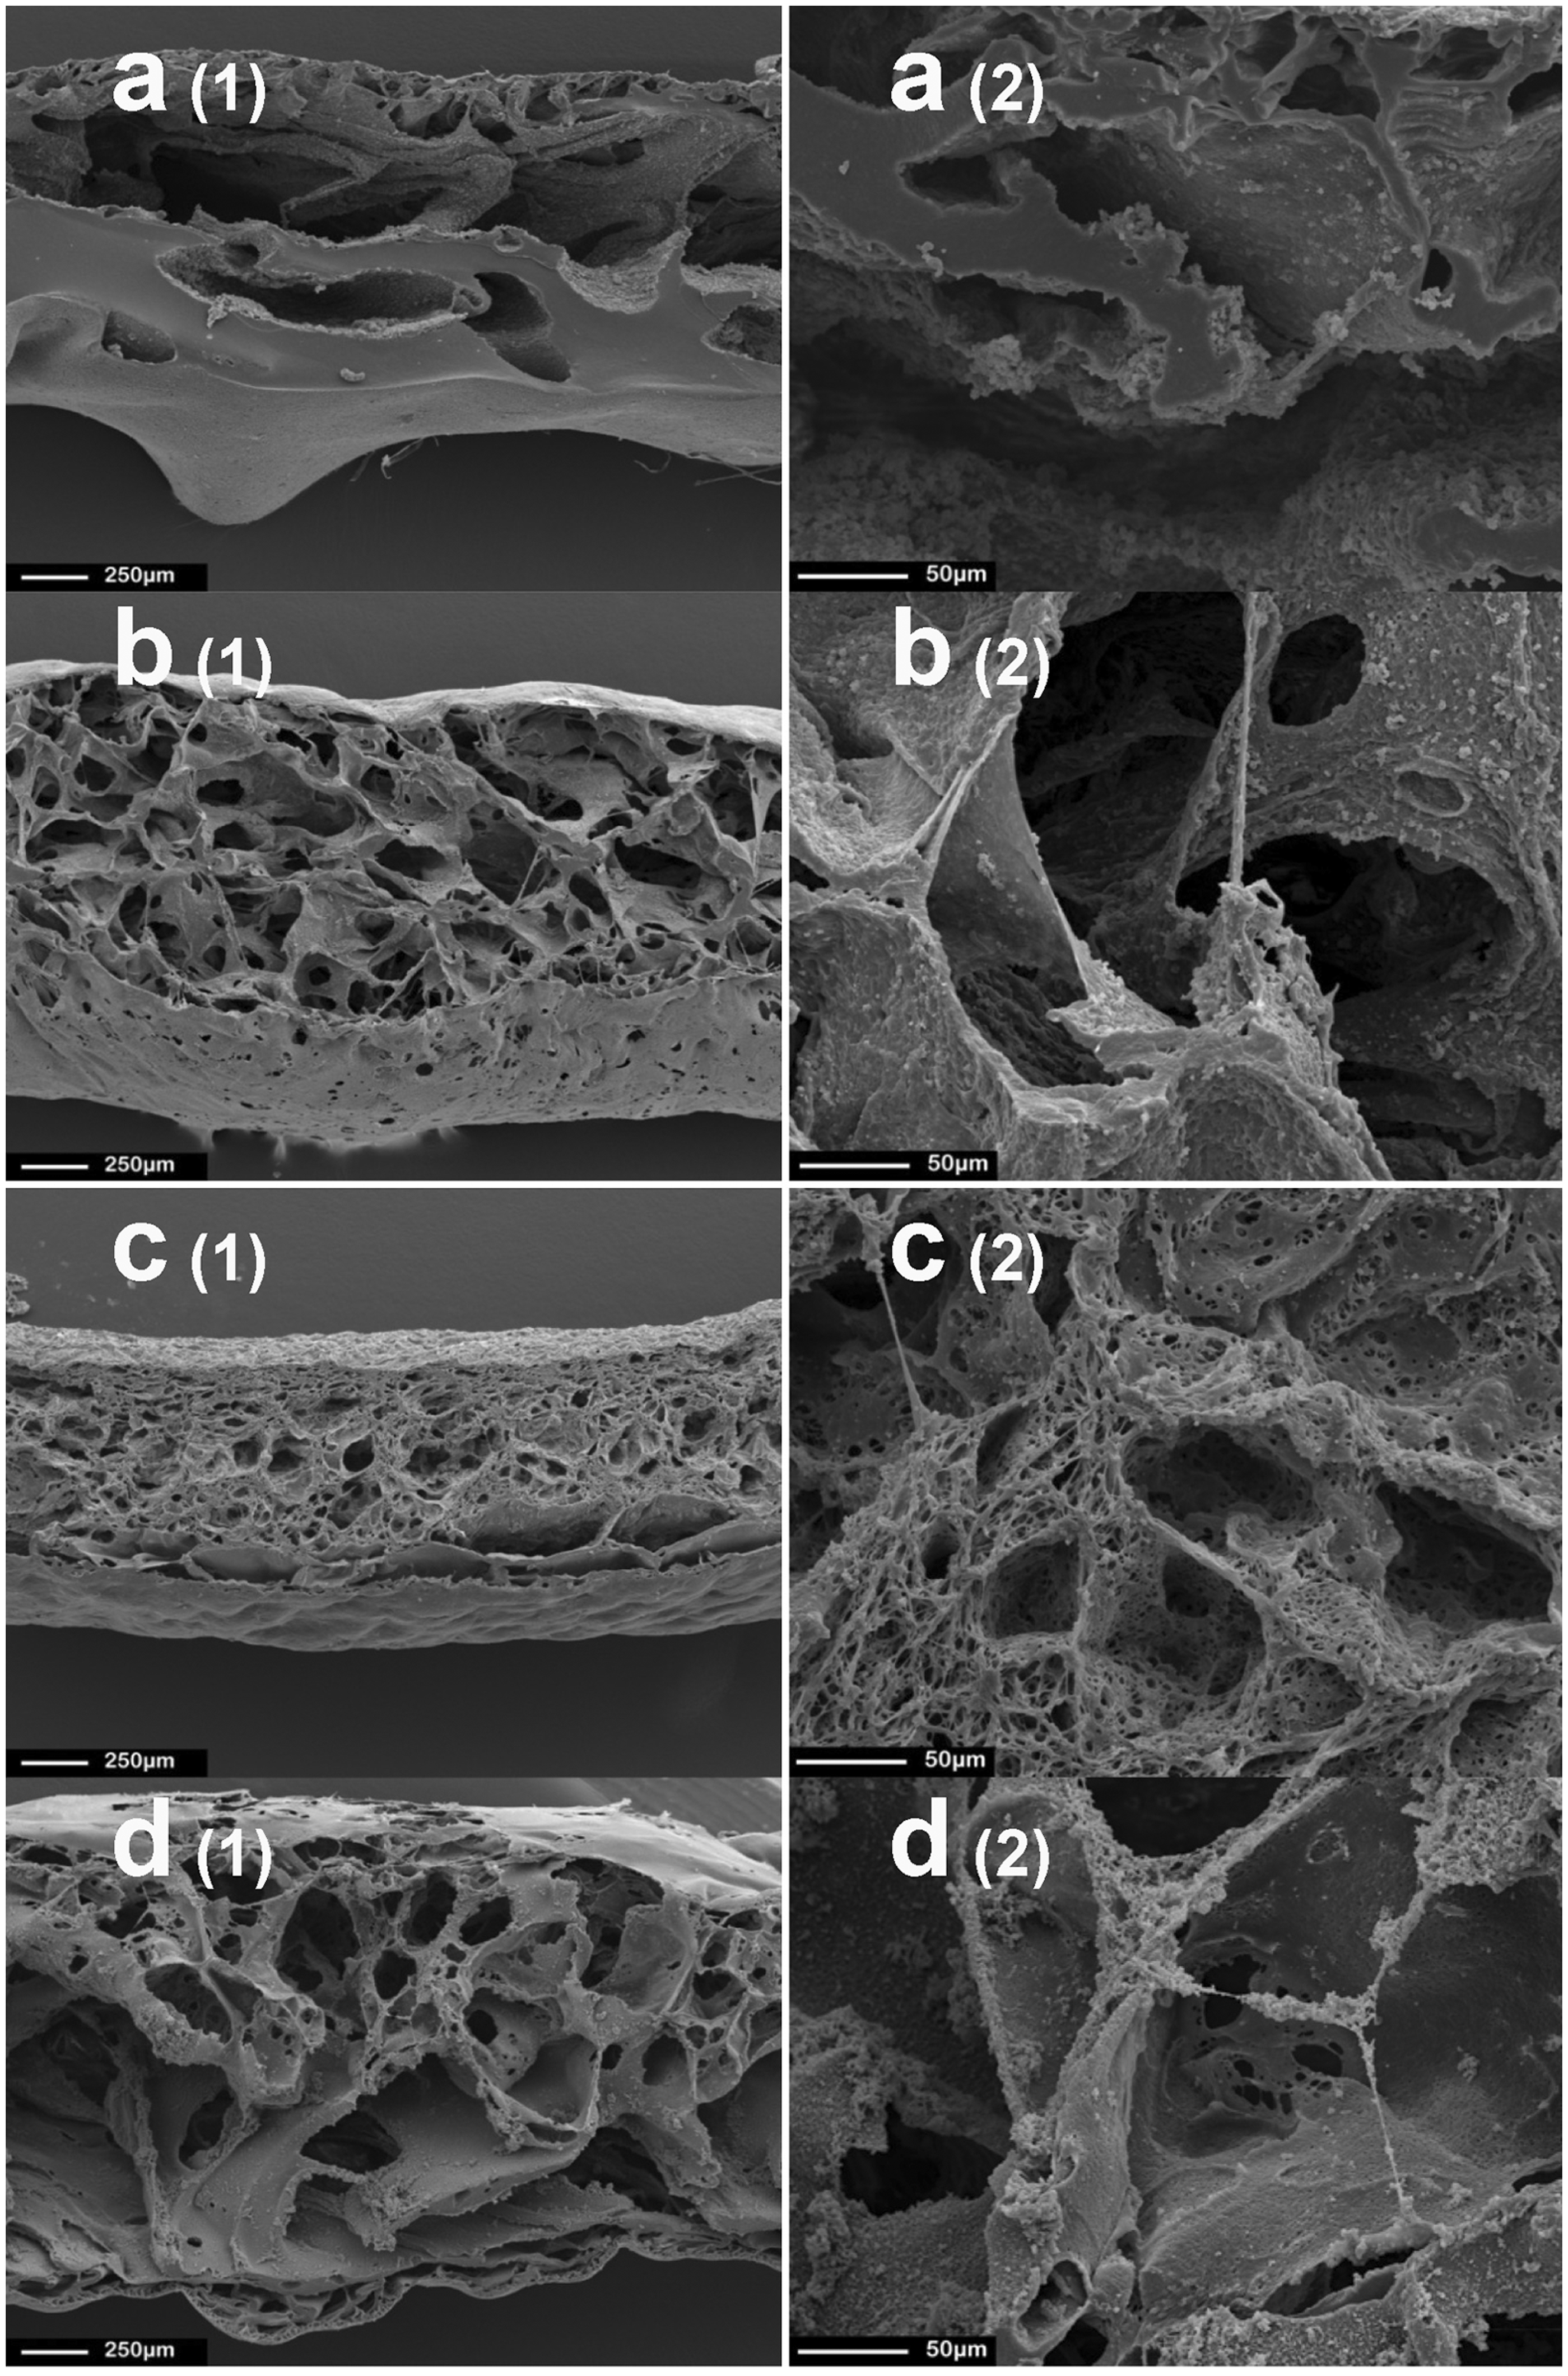
Cell seeding and cell characterisation
Complete seeding in TCP and on 2D scaffolds was observed, but a small fraction of the homogenised solution leaked from the shaved sides of the 3D scaffolds. A general estimate of this leak was extrapolated by comparing FI percentage difference on alamarBlue® assay on day 1.
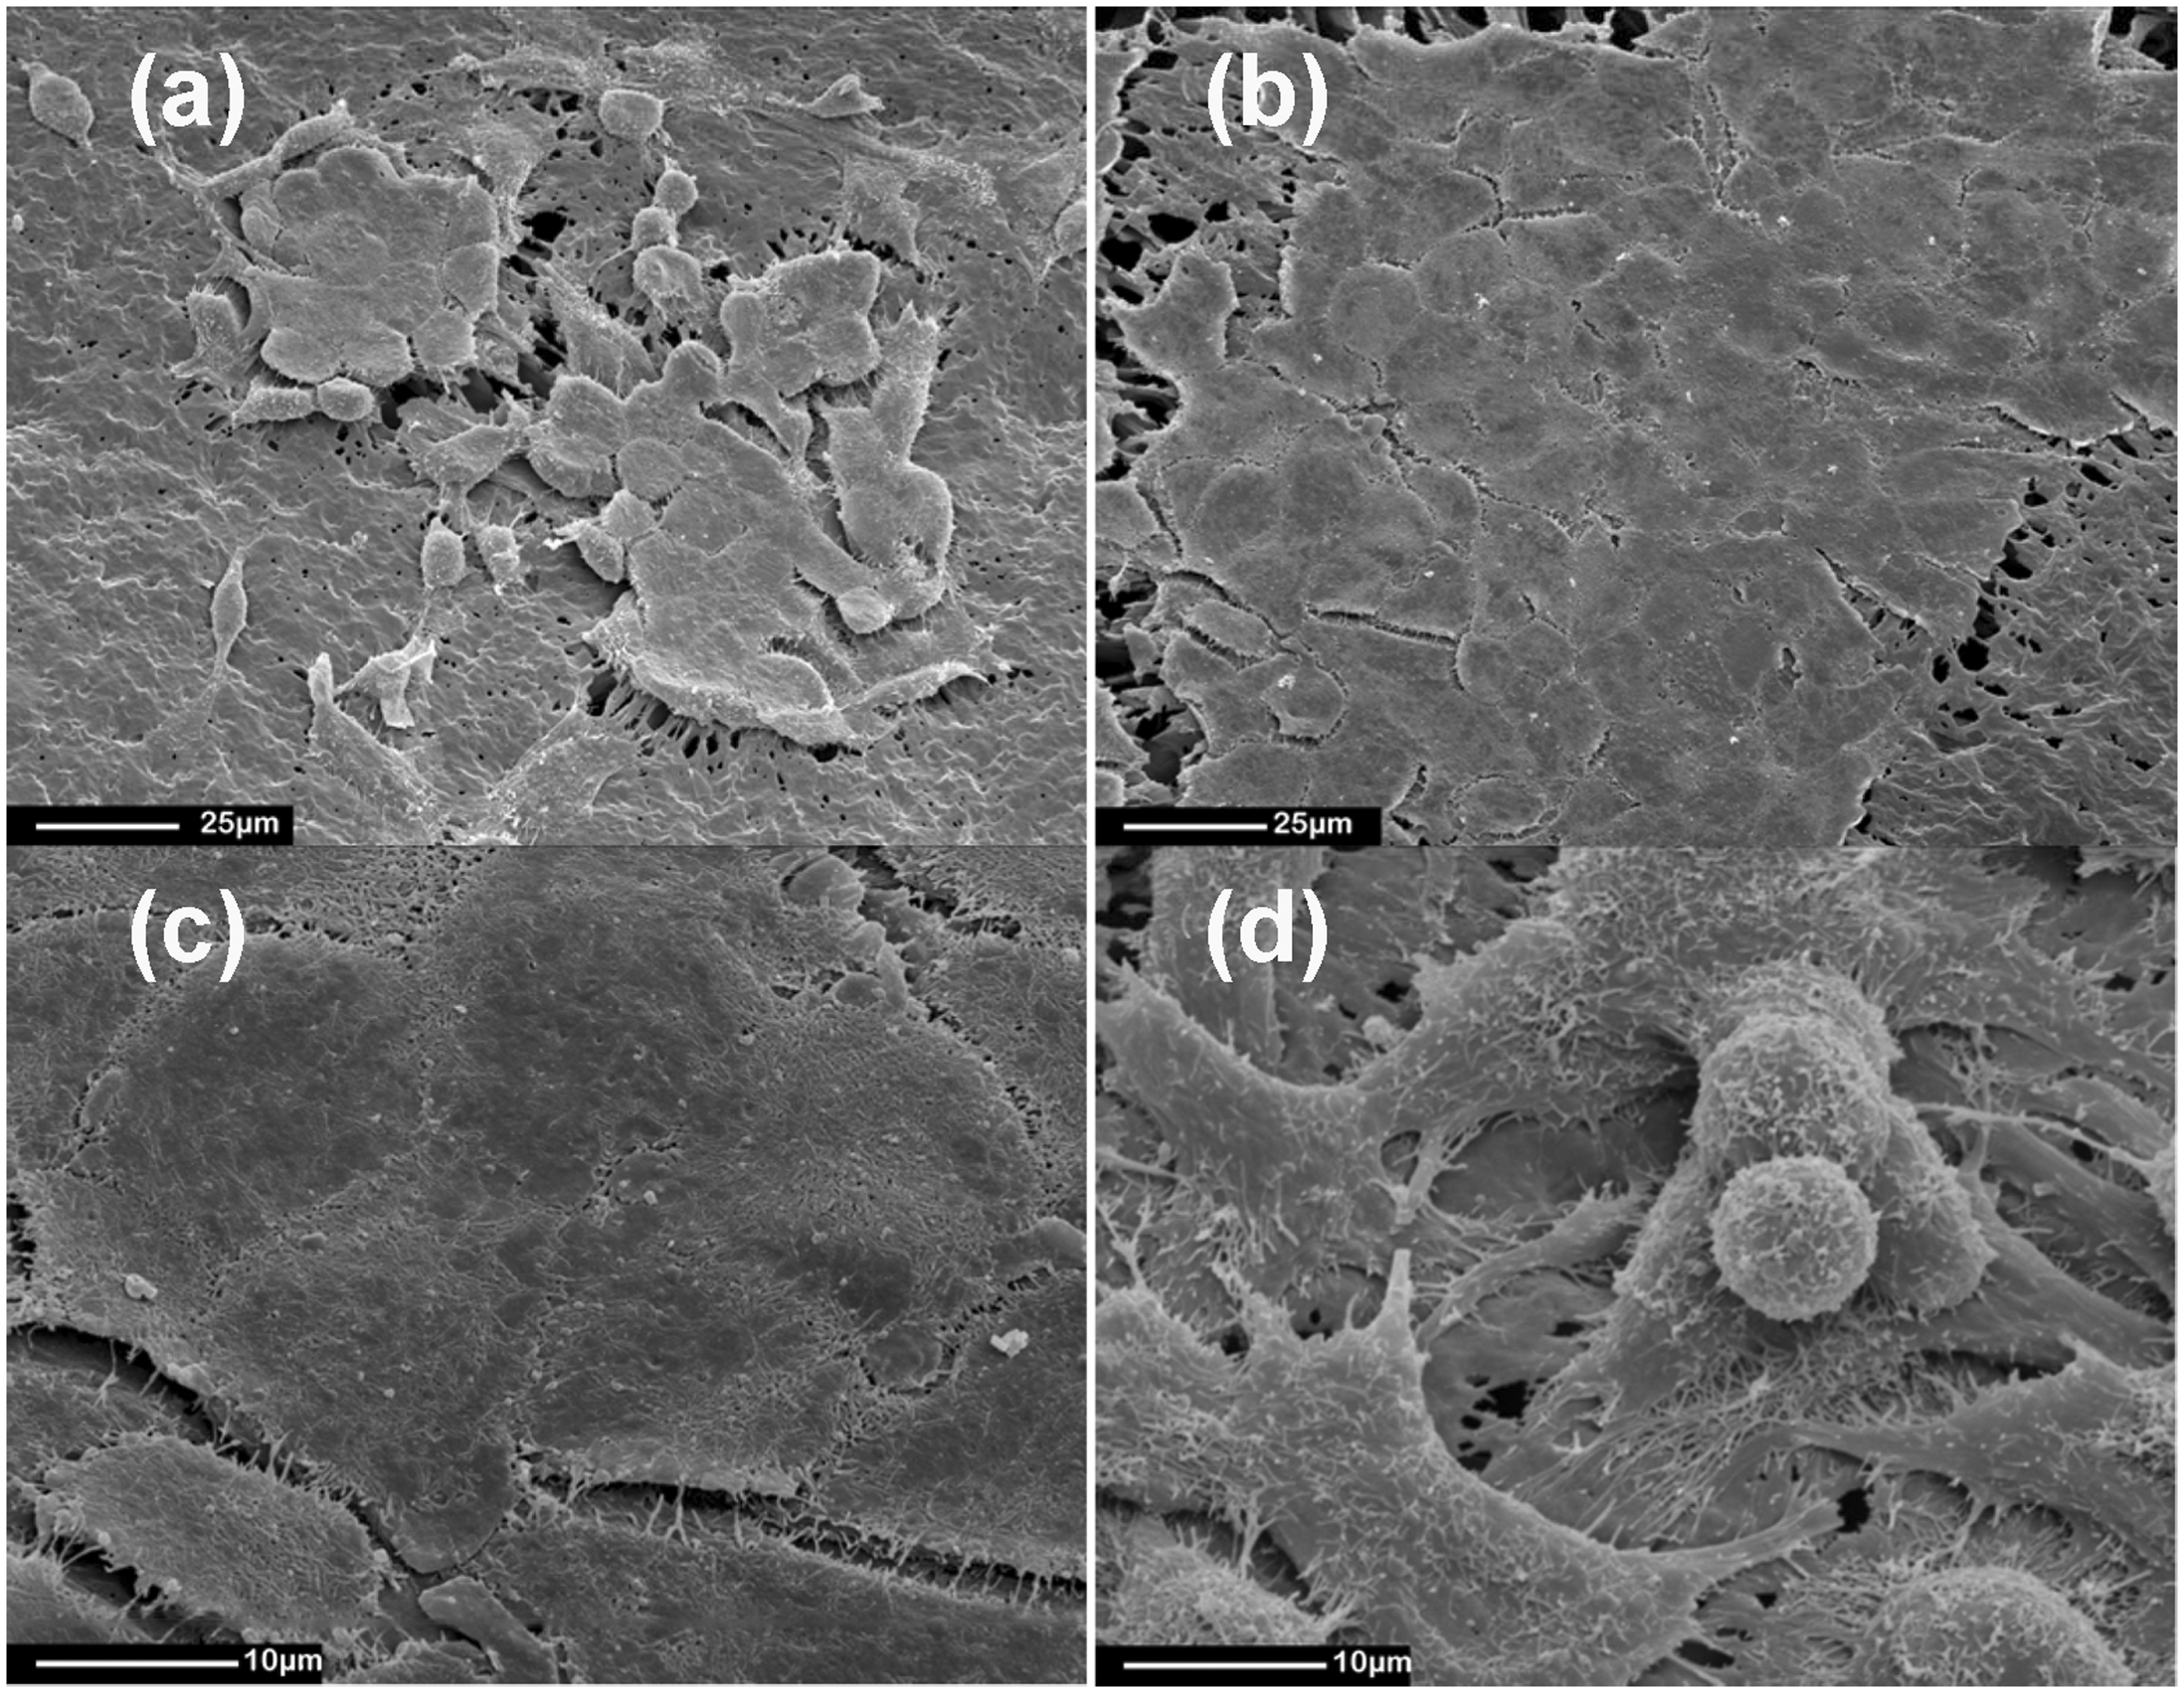
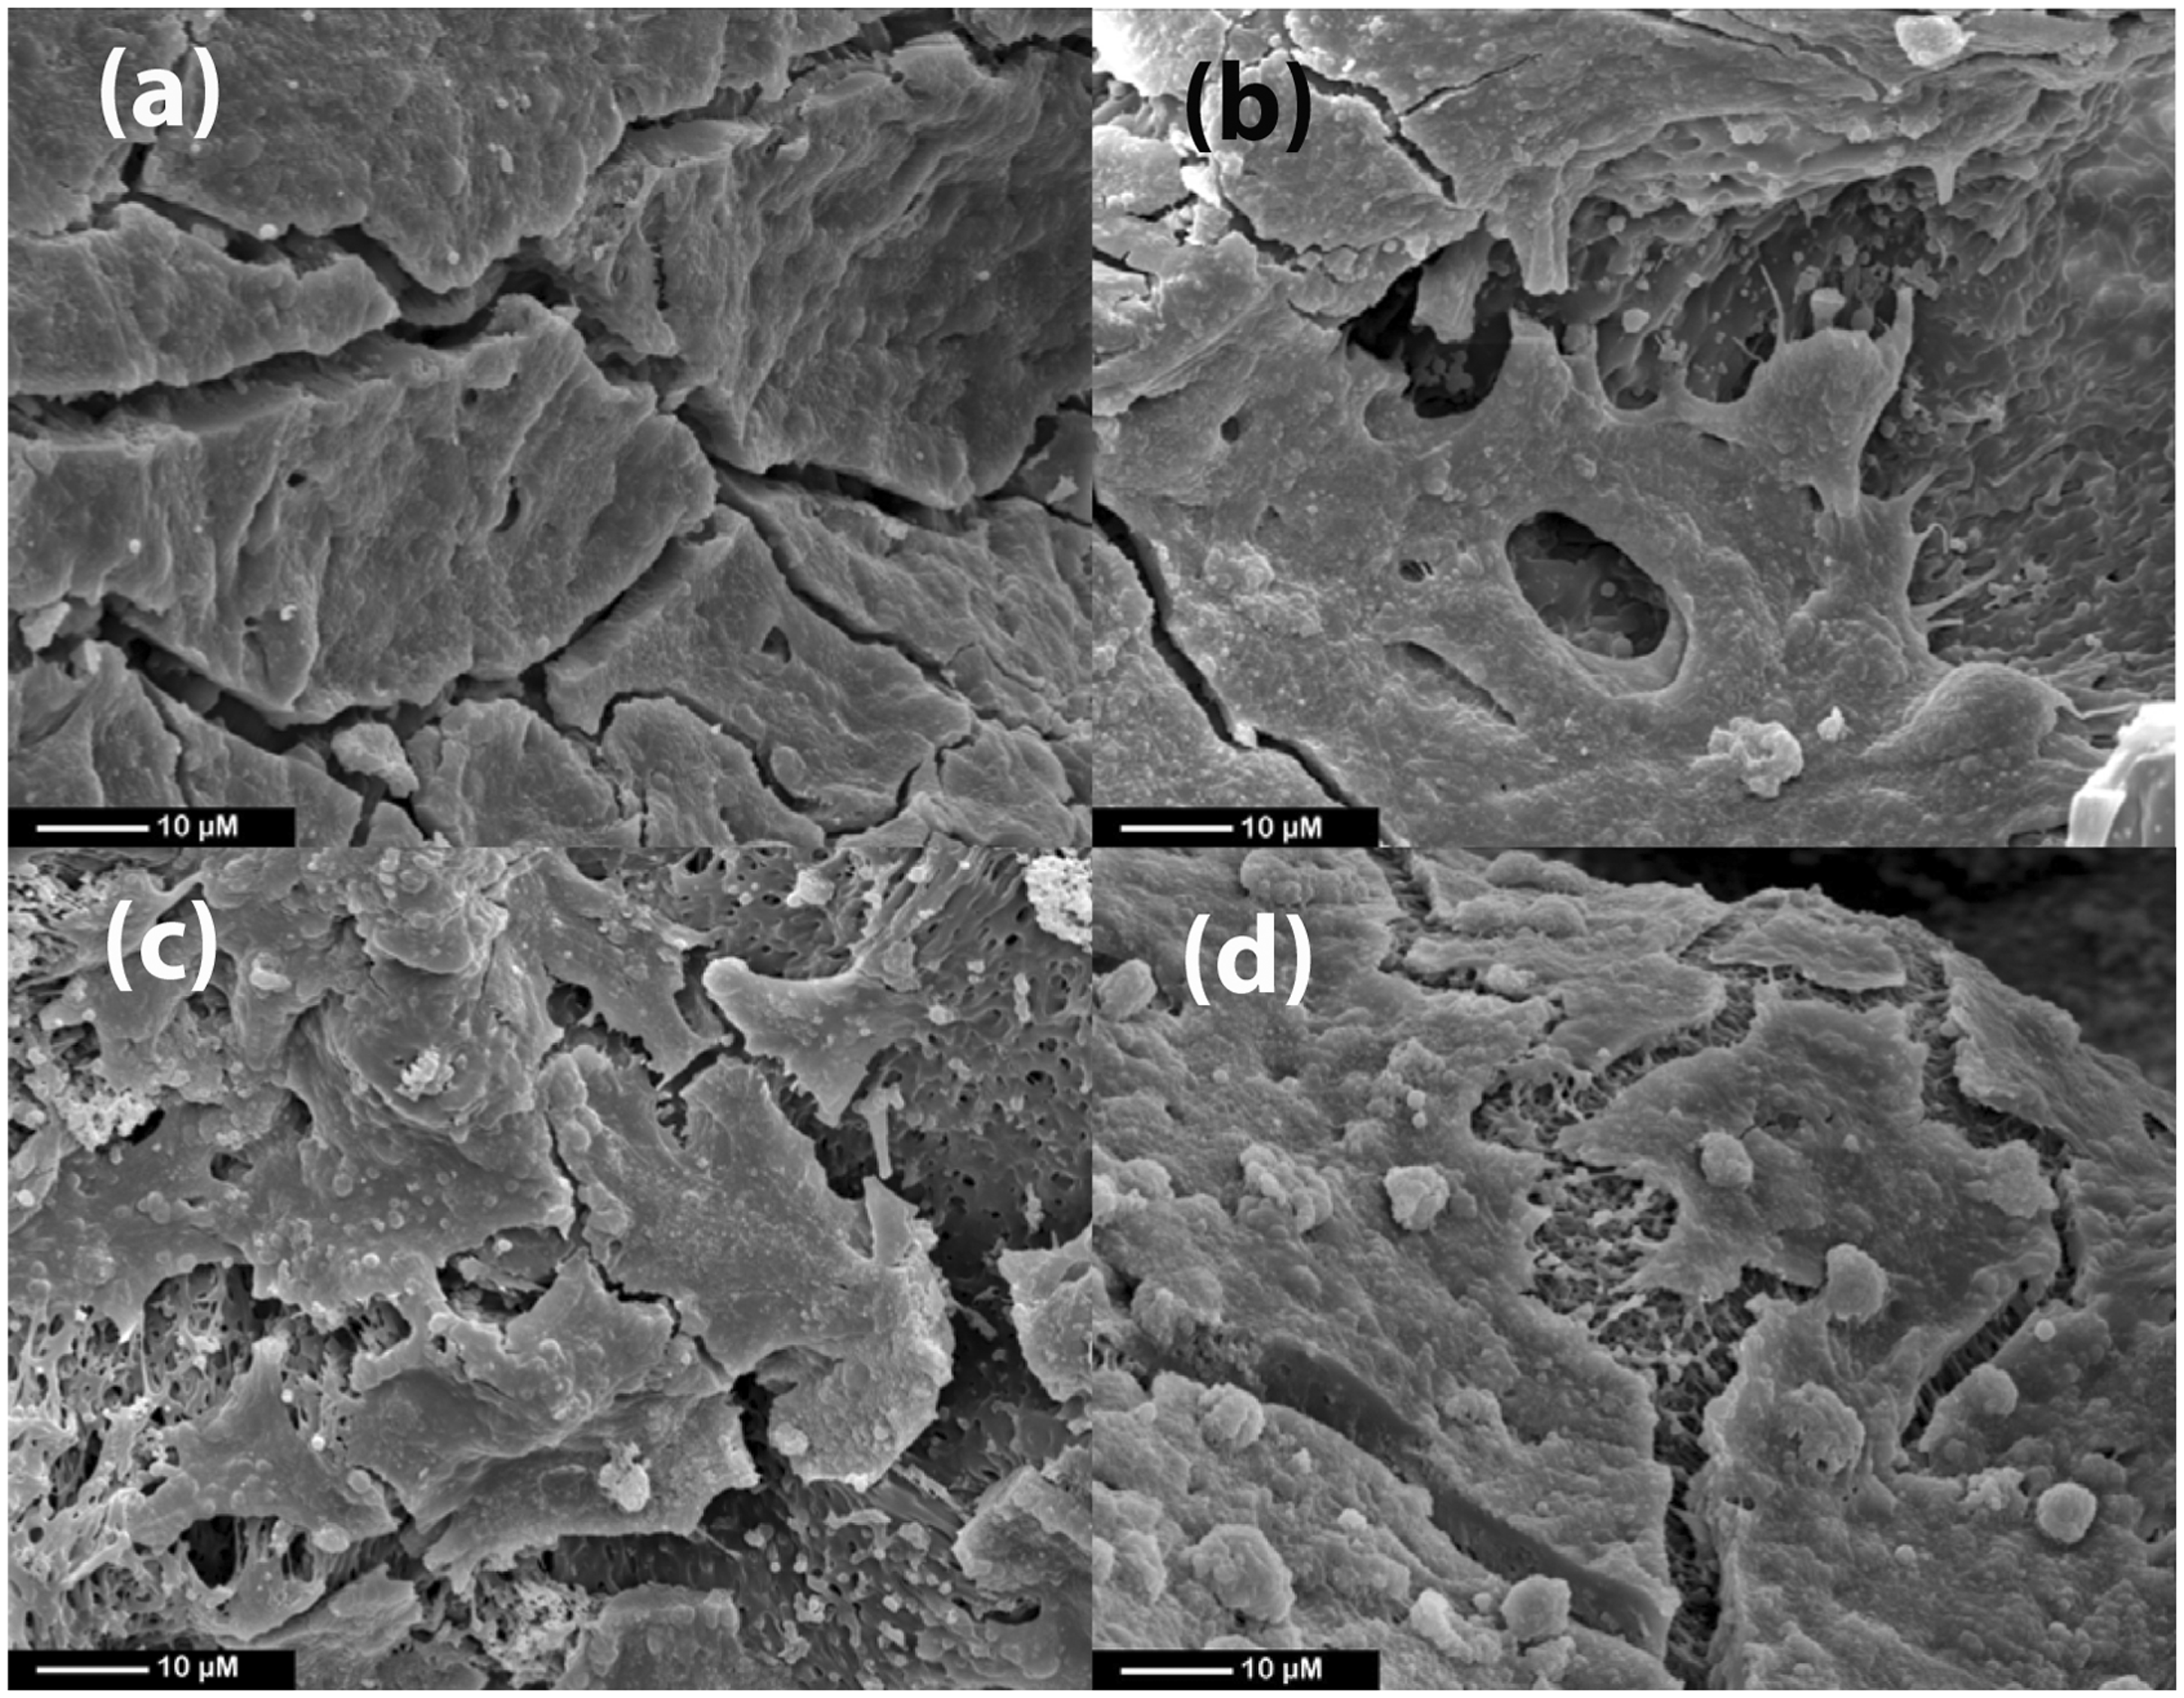
On culture D8, near-complete hepatocyte confluence was demonstrated on 2D (monolayer) culture on PMS comparable to control on Melinex (Figure 2). Hepatocytes morphology, polyhedral characterisation, cell-cell and cell-matrix attachment were observed on higher SEM magnification on 2D PMS and in 3D scaffolds with numerous cells attached to the scaffolds’ porous structures (Figure 3 and 4). Cells were observed to form healthier colonies with smoother surfaces and higher incidence of cell aggregates on PG scaffolds when compared with other scaffolds (Figure 4). Scanning electron microscopy (SEM) at 80 times magnification on Day 5, 8 and 10 (1, 2 and 3, respectively) comparing hepatocytes’ confluence and proliferation on (a) PMS and (b) Melinex. The rate of proliferation of hepatocytes on PMS seems similar if not higher than on Melinex as indicated by the near complete cell confluence on Day 8 on PMS. The cracks noted between cell aggregates on PMS on Day 8 and 10 could be a combination of the alcohol dehydration process used to prepare the slides for SEM and an overlap of cell growth. Scanning electron microscopy (SEM) at 640 (a) and (b) and at 2500 magnifications (c) and (d) on culture Day 3 on PMS. HepG2 hepatocytes seem to retain their phenotypical hexagonal appearance. Cell-cell and cell-matrix attachments on PMS can also be observed especially around the peripheries of cell clusters and with more clarity in (d). Scanning electron microscopy (SEM) at 2500 magnification demonstrating cell-cell and cell-matrix attachment on culture Day 7 of HepG2 in the three-dimensional (3D) nanocomposite scaffolds: POSS-modified polycaprolactone urea urethane (PU) (a) and its porogen modifications, i.e. with glucose particles (PG) (b), with sodium bicarbonate particles (PB) (c) and with sodium chloride particles (PN) (d). The cell surface looks smoother and has less granulation in PU and in PG. The cracks within HepG2 sheets could have been from the alcohol dehydration process during sample preparation for SEM.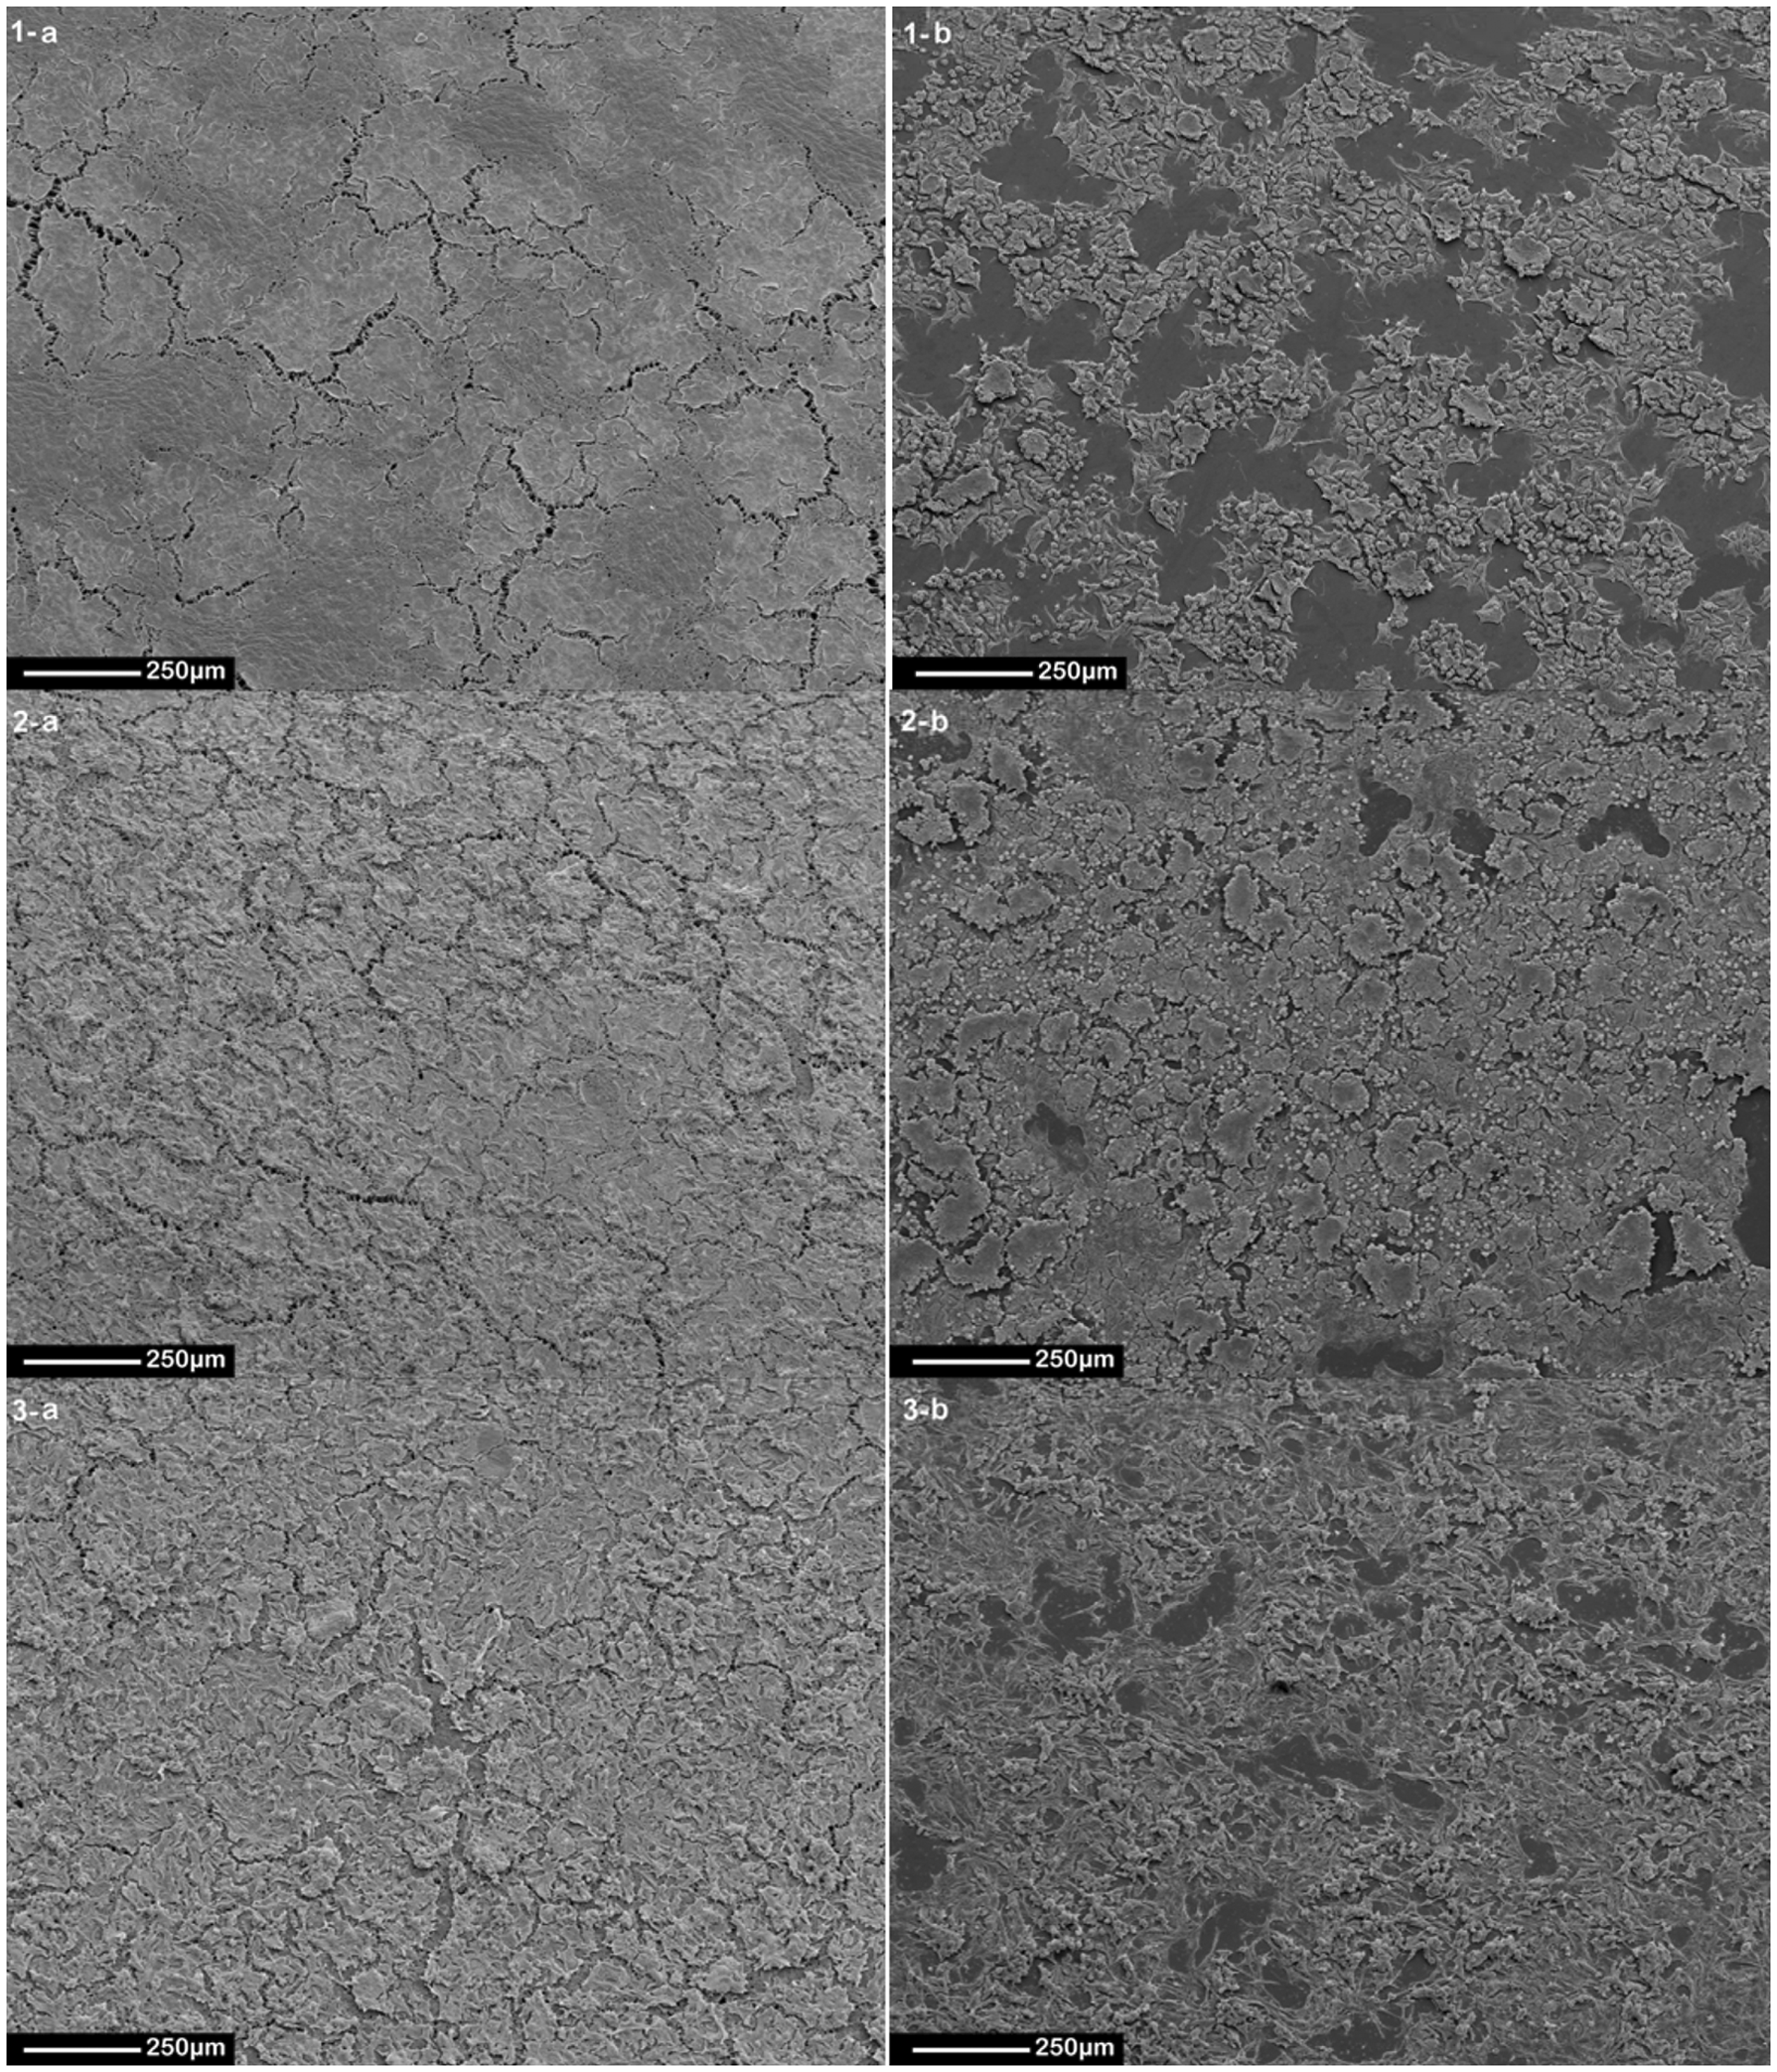
Cell viability, proliferation and functionality assessments
AlamarBlue® and PicoGreen® assays
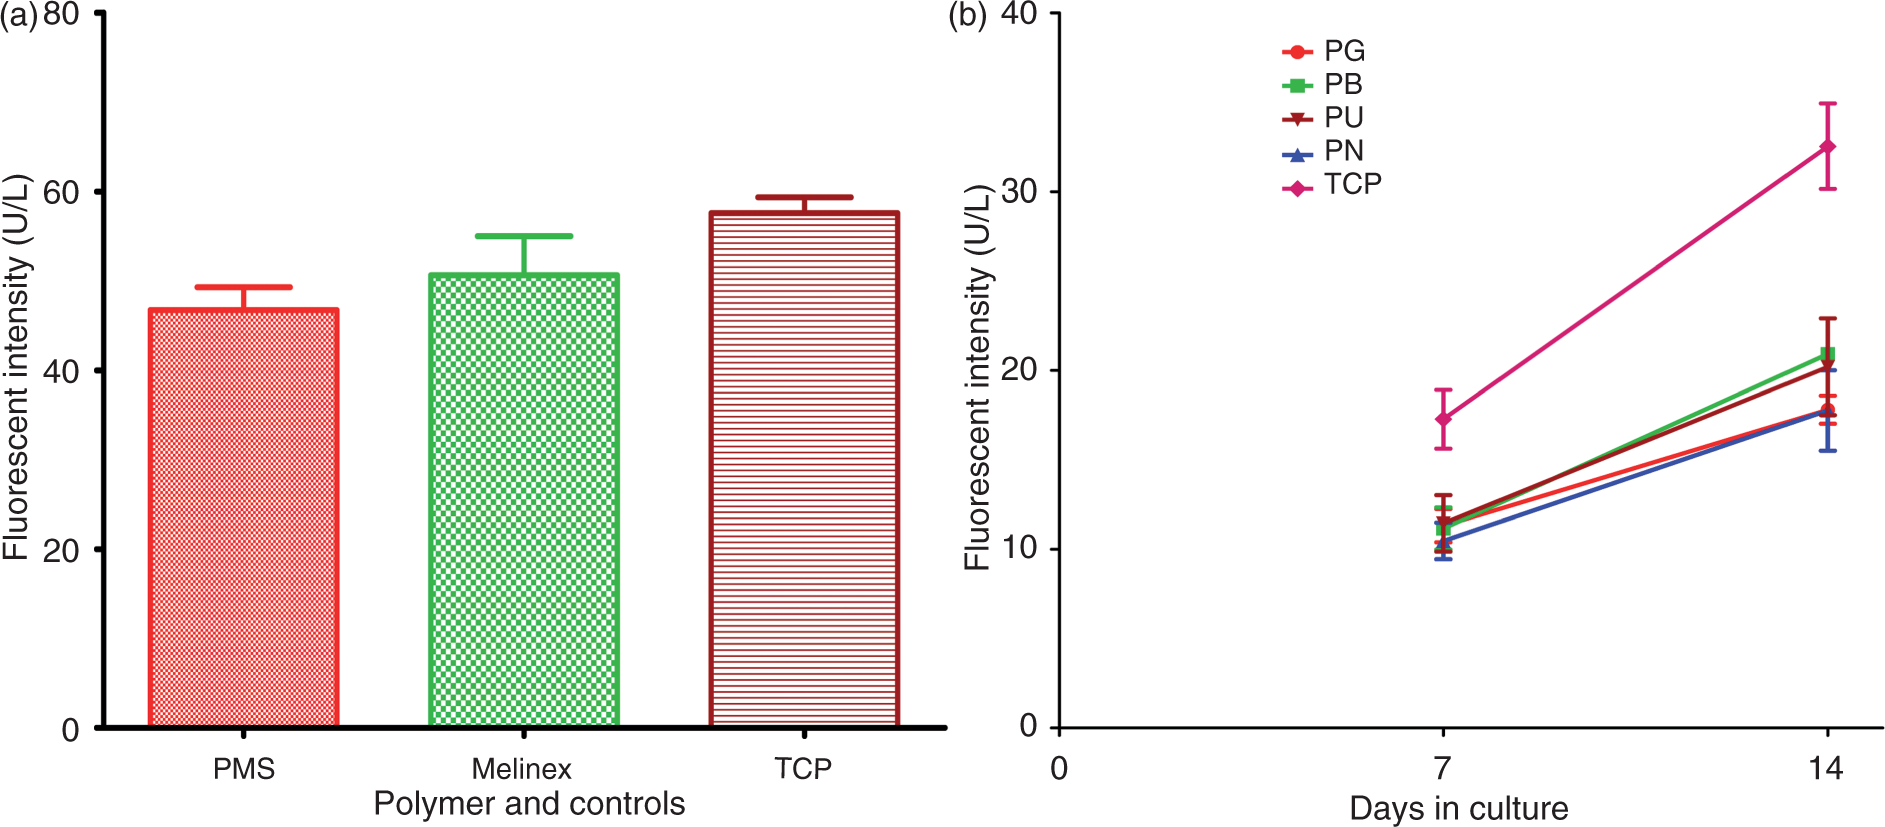
The mean FI emission from control in TCP was higher than from control in Melinex throughout on alamarBlue® assay and on culture D10 on PicoGreen® assay, but the differences were not significant and both control produced comparable graphs with matching trends on alamarBlue® suggesting that Melinex is a suitable alternative to compare with PMS in SEM evaluation. Culture on PMS demonstrated progressive FI emission in alamarBlue® assay and on culture D8 mean FI measured was significantly higher than on D2 (88.33 vs. 52.65 U/L, respectively, Mann-Whitney p = 0.0286). Although the mean FI measured from Melinex was significantly higher than from PMS on two occasions, culture D3 and D8 (Kruskal-Wallis p = 0.0207 and 0.0218, respectively; Dunn's multiple comparison test p < 0.05 for each), they produced graphs with similar trends (Graph 1(a)). On culture D10 there was little difference in mean FI emission between PMS and Melinex on PicoGreen® assay (46.74 vs. 50.65 U/L, respectively, FI percentage difference 92.28, Mann-Whitney p = 0.3429), which was not in line with the much higher difference found on alamarBlue® assay (50.94 vs. 98.40 U/L, respectively, FI percentage difference 51.77; Graphs 1(a) and 2(a). Summary graphs representing the results of alamarBlue® assay: (a) Examining PMS in 2D cultures against two different controls, in Meliniex and in tissue culture plates (TCPs). Although fluorescence intensity (FI) emissions were higher from control in Melinex and in TCP than from PMS, there was little, if any, difference between the two controls and both controls exhibit a similar graph trend, rendering control in Melinx as a suitable alternative for control in TCP, especially for scanning electron microscope (SEM) examination. FI emission from PMS was significantly higher on culture D5 and D8 when compared to D1, suggesting PMS capacity to maintain hepatocytes for that period. Although FI emissions from control in TCP were significantly higher (*) than from PMS on culture D2, D5 and D10 (mean FI percentage difference was 45.22, 57.79 and 48.54, respectively), and FI emissions from control in Melinex were significantly higher (**) than from PMS on culture D3 and D8 (mean FI percentage difference was 55.89 and 58.89, respectively), the graph trend of FI emissions exhibited from PMS is similar to that demonstrated by control in TCP and in Melinex. (b) Examining the three-dimensional (3D) scaffolds and their control in TCP, FI emissions from control in TCP were significantly higher than emissions from the scaffolds throughout the experiment, which could be explained by the leak of the homogenised cell solution at the beginning of the experiment (FI percentage difference of the means on culture D1 between TCP and polymer with glucose (PG), sodium bicarbonate (PB), sodium chloride (PN) and polycaprolactone urea urethane (PU) was 35.12, 19.31, 42.48 and 21.95, respectively). However, all 3D scaffolds continue to demonstrate FI emission on alamarBlue up to culture D14, suggesting their capacity to maintain hepatocytes for the length of the experiment. This is further supported by the reduction in the difference of FI emission (i.e. larger FI percentage difference) between most of the scaffolds and control in TCP (FI percentage difference of the means on culture D14 between TCP and PG, PB, PN and PU was 44.78, 54.33, 36.66 and 47.74, respectively). A bar chart and a graph representing PicoGreen assay reflecting the relative quantity of HepG2 cells in cultures as indicated by quantifying FI emissions of released cellular DNA’s following induced cell destruction. (a) Comparison between fluorescence intensity (FI) emission from PMS and control in tissue culture plates (TCP) and in Melinex on culture D10 (at the end of the initial experiment). Although, mean FI emission from PMS was lower than from control in Melinex and significantly lower than from control in TCP (46.74, 50.65 and 57.59 U/L respectively; Kruskal-Wallis p = 0.0183; Dunn’s multiple comparison test p < 0.05 for PMS vs. TCP), the difference between the three cultures on PicoGreen was much less than the difference found on alamarBlue (i.e. higher FI percentage difference: 92.28 for PMS vs. Melinex and 81.16 for PMS vs. TCP). (b) A graph comparing FI emissions from each of the 3D scaffolds with each other and with control in TCP on culture D7 and D14. Factoring in the initial low count of HepG2 cells at the beginning of the experiment (due to the small unquantifiable leak of the homogenised solution at the time of seeding), a higher but non-significant FI emission from control in TCP than from the scaffolds was anticipated. However, FI emissions were higher on culture D14 than on D7 across all the 3D scaffolds suggesting progressive increase in HepG2 cell count and the maintenance of viable cell culture for the duration of the experiment.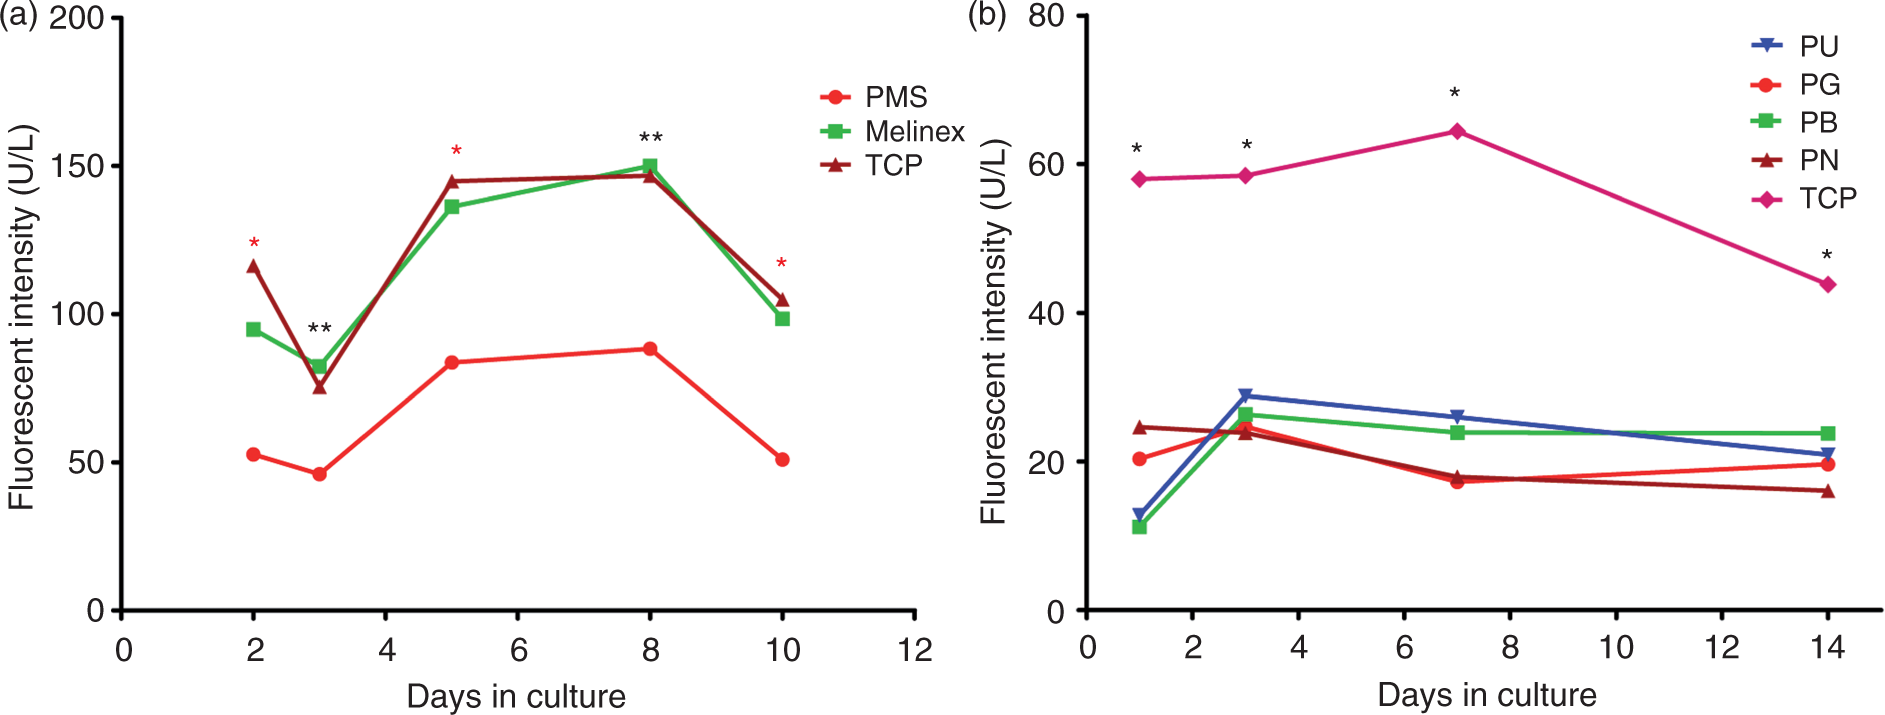
All 3D scaffolds cultures demonstrated progressive FI emission on alamarBlue® assay up to the end of the experiment on culture D14 and the higher mean FI emission from control in TCP losses its significance when compared to most of the scaffolds on culture D14 (Graph 1(b)). There was a significantly higher mean FI emission from control in TCP than from most of the scaffolds on culture D7, but the higher mean FI emission from control in TCP on PicoGreen® assay showed a narrower non-significant difference (i.e. higher FI percentage difference) than on alamarBlue® on culture D7 (Graph 2). There was a clear increase in FI emission on PicoGreen® from all the scaffolds on culture D14 as compared to D7 (Graph 2(b)).
AST secretion
Mean AST production was notably low across the board on culture D1, D3 and D14, with a transient relative increase from control in TCP and from PG scaffold on D7 when compared to other scaffolds (Graph 3(a)). Summary graphs representing aspartate transferase (AST), albumin and urea synthesis (a, b and c, respectively) from seeded 3D scaffolds on culture Day 1, 3, 7 and 14. AST is not commonly used to study static tissue culture. Unlike albumin and urea synthesis where a high level reflects progressive proliferation of functioning hepatocytes, a high AST level should indicate an increased number of damaged hepatocytes. Hence by simple deduction, continuous synthesis of AST requires progressive hepatocyte proliferation. This could explain the rapid decline following the initial steady rise. The coincidental rapid decline of albumin secretion from control in TCP detected on culture D14 after its initial increase on culture D7 would support this analogy (3.0, 14.125 and 8.0 U/L mean AST release vs. 680.81, 15,259 and 9467.95 ng/ml mean albumin secretion from control in TCP on culture D1, 7 and 14, respectively). The AST (a) and similarly albumin synthesis (b) exhibited plateau from 3D scaffolds after culture D7 would indirectly suggest progressive proliferation of functioning hepatocytes. This is further supported by the gradual increase in urea synthesis across all scaffolds (c). In all these experiments, AST, albumin secretion and urea synthesis were all higher from PG scaffolds when compared to other scaffolds (highest on culture D7). The higher levels detected from control in TCP possibly reflects the initial small unquantifiable loss of homogenised cell solution at the time of cell seeding into 3D scaffolds.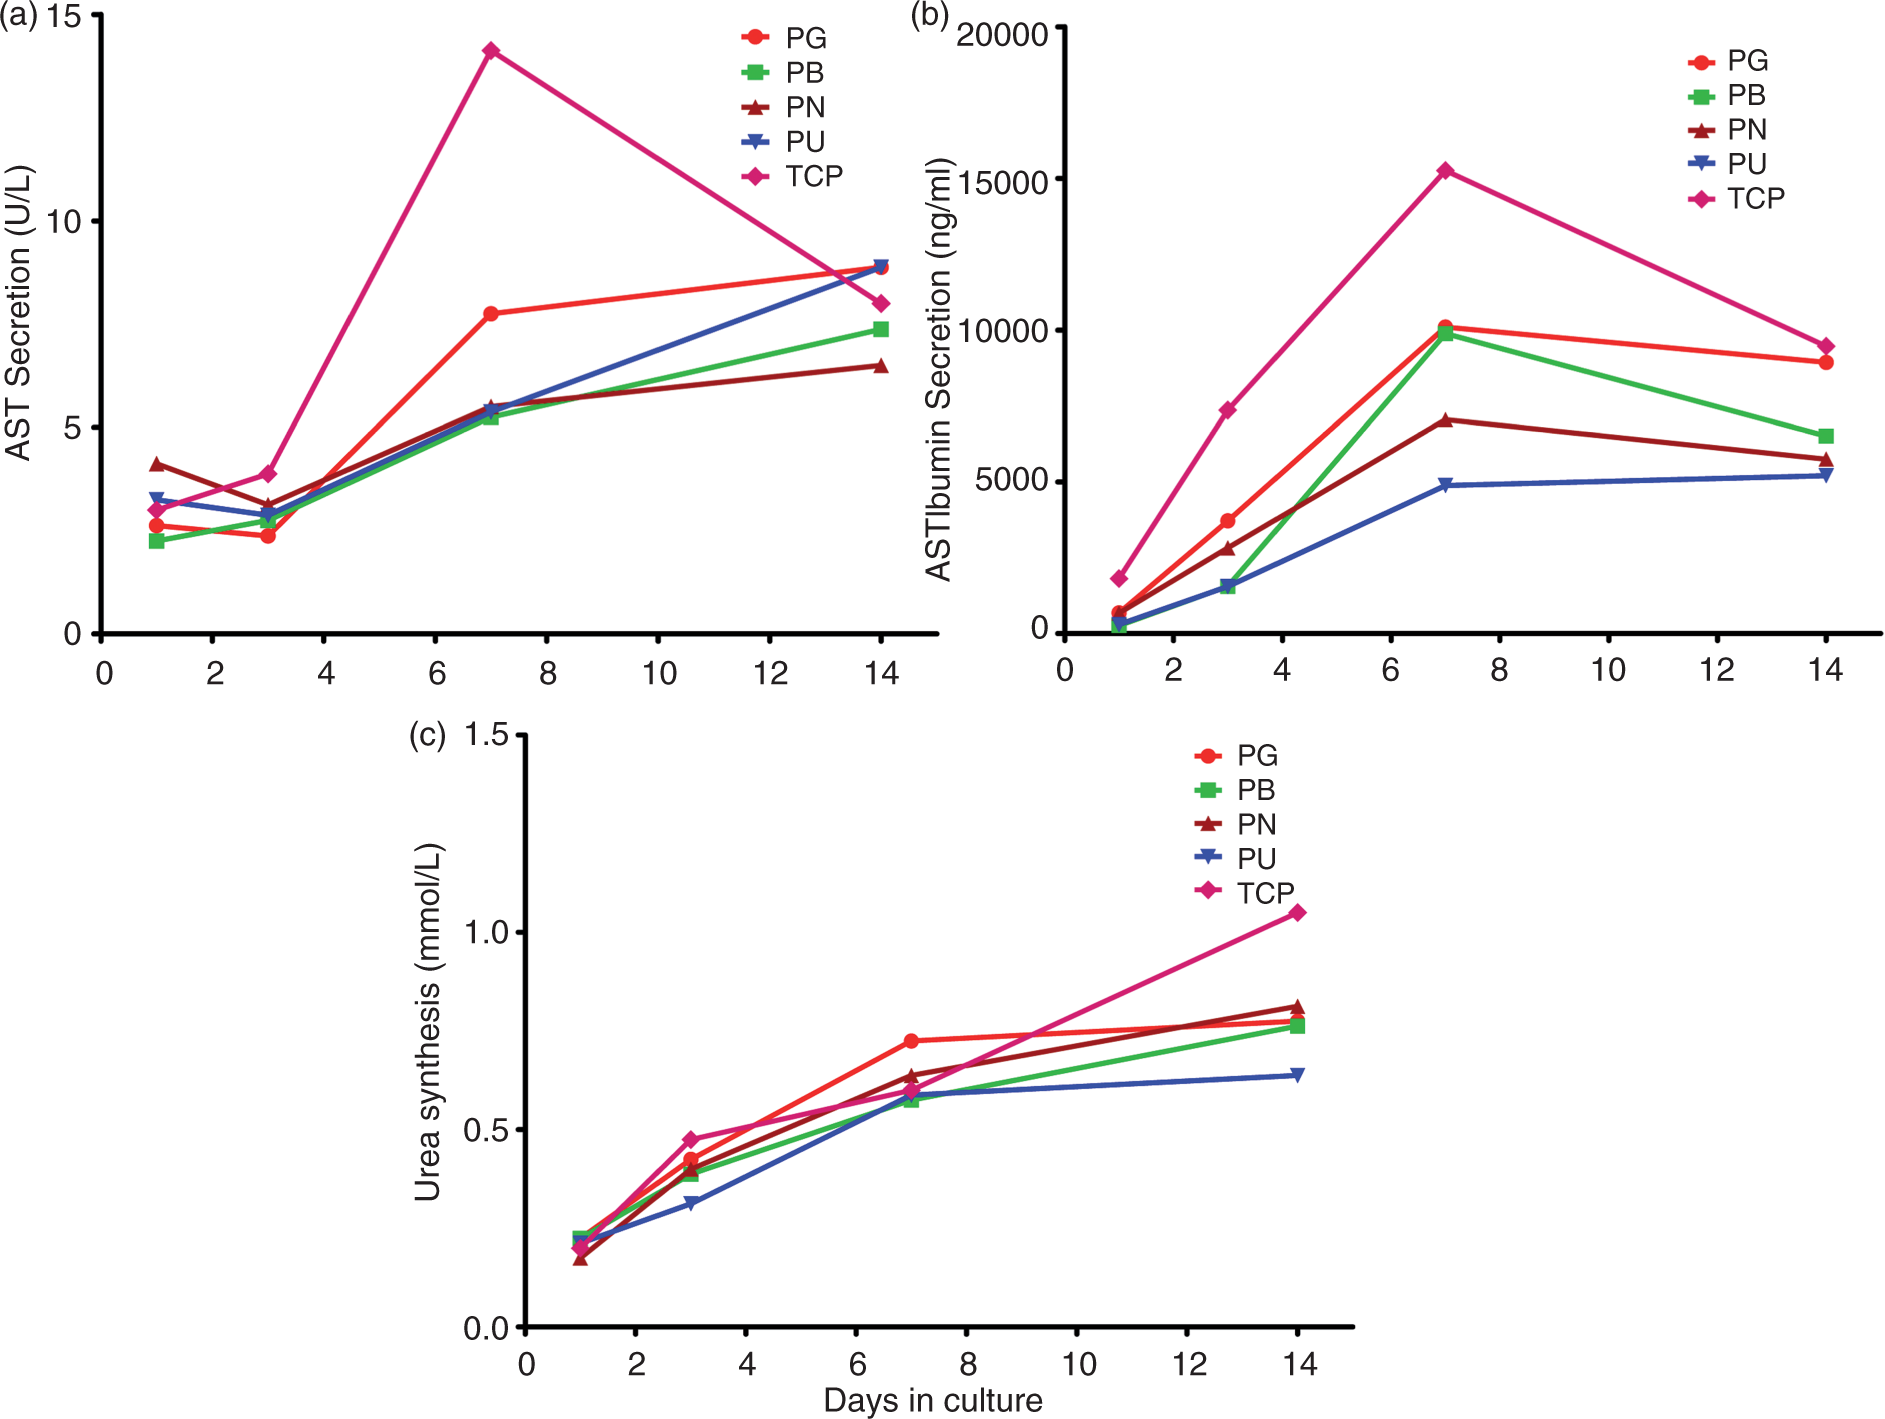
Albumin ELISA secretion
There was a significant increase in albumin production from all 3D scaffolds and their control in TCP on culture D7 and D14 as compared to D1 (Kruskal-Wallis p = 0.0030; Dunn's multiple comparison test p < 0.05), suggesting the progressive proliferation of viable hepatocytes in all the scaffolds. Albumin production peaked on culture D7 across all samples but declined across the board at the end of the experiment on D14. The decline was much greater from control in TCP than from the scaffolds of which PG showed the smallest decline (Graph 3(b)).
Urea synthesis
A significant increase of urea synthesis on culture D7 and D14 from all scaffolds and the control in TCP was observed in comparison to urea synthesis on D1 (Kruskal-Wallis p = 0.0006; Dunn's multiple comparison test p < 0.05; Graph 3(c)). Pairwise post-hoc comparison suggested a significantly higher urea synthesis on culture D14 from control in TCP in comparison to urea synthesis from PG, PB and PU scaffolds (Mann Whitney Test p = 0.0408, 0.0294 and 0.0294 for each, respectively).
Discussion
This is the first study to demonstrate the maintenance of viable and functional hepatocytes on a novel nanocomposite polymer i.e. POSS-modified polycaprolactone urea urethane. We opted to use human HepG2 cell line for their similar morphology to adult primary hepatocytes, their tendency to attach and their albumin-synthesizing capacity, although their ammonia detoxification and mixed function oxidase activities were very poor. 52 These cells also undergo cell division (which is not the case for primary hepatocytes) and therefore allowed us to assess the potential scaffolds for their ability to support increasing cell numbers. This has relevance to the future hope of being able to use stem cells or partially committed progenitor cells at scale-up to provide liver support systems. On examining polymer-coated Melinex disks (PMS) and control on Melinex disks and in TCP, there was a statistically significant higher FI emission from control in TCP and to some extent from control on Melinex than from PMS on both alamarBlue and PicoGreen; however, they all exhibited a similar trend with a matching trend on alamarBlue. This would suggest that the polymer might have a dampening effect on the fluorescence signal. In line with this possibility is the observation that the percentage difference between PMS and TCP on day 10 on PicoGreen assay was 81.17%, nearly double that of alamarBlue, which was 48.54%, for the same day and samples. Additionally, the SEM demonstrated near-complete confluence of hepatocytes by culture D8 and it showed clear cell-cell and cell-matrix attachment on PMS. The fact that hepatocytes retained their polyhedral shape and have less overriding cells when compared with Melinex further suggests that FI emission on alamarBlue assay may not have reflected the actual cellular viability and as such may not have been the most appropriate assay for this polymer. These observations were taken into account when planning for and analysing further experiments on 3D scaffolds.
The novel use of porogens in the making of these 3D scaffolds depends on the choice of non-toxic particles that would dissolve in water during the polymer coagulation process leaving behind a porous structure with more controlled range of pore sizes. Of all the three particles chosen, glucose is the one that would be the most inert for hepatocytes if it did not dissolve completely. Although all 3D scaffolds exhibit striking architectural differences, PG scaffolds showed more favouring architecture for the narrower range of their pore sizes, numerous interpore communications and their relatively thin interpore walls. While SEM examination demonstrated cell attachment on all scaffolds, hepatocytes seeded on PG scaffolds tend to have a smoother outline.
In all the experiments carried out to evaluate the viability and the functionality of the seeded hepatocytes, control in TCP had a higher rate of FI emissions in comparison to emissions from the scaffolds. However, lack of significance in the difference between control in TCP and scaffolds in the presence of demonstrable progressive increase in albumin, urea and AST production across all the scaffolds suggest that hepatocytes maintained viability and functionality within these scaffolds. A number of observations in this study suggest continuing and progressive proliferation, viability and functionality of hepatocytes when seeded onto these scaffolds, especially onto PG scaffolds. These observations include the progressive increase in cell population as evidenced by a higher FI emission on culture D14 than on D7 on PicoGreen; the clear discrepancy between FI emissions and FI percentage difference on PicoGreen when compared to that from alamarBlue; the potential dumping effect of the new polymer on FI emissions for alamarBlue assay suggested by experiments on PMS and the clear SEM demonstration of cell attachments to the porous structures of the scaffolds.
A clearer demonstration was noted with albumin secretion when the significant increase in its production on culture D7 from control in TCP was followed by a steep decline a week later, which was not matched by an equivalent reduction from the scaffolds. The scaffolds, on the other hand, continued to demonstrate progressive production of albumin throughout the experiment. Although HepG2 cells are not known for their urea synthesis ability, there was a progressive secretion at a relatively similar rate from all the scaffolds throughout the experiment. As the native polymer is based on a urea compound, its exact influence on urea level is difficult to predict and remains to be further investigated. The use of AST in evaluating in vitro hepatocyte culture albeit novel is not without difficulty in interpreting its significance. When we decided to use it we anticipated a high level to be predictive of a higher rate of hepatocyte damage. The production of AST, however, gave a similar graph shape to that of albumin secretion. On one hand it was anticipated that AST would be higher from control in TCP as cell proliferation in 2D culture is more likely to reach confluence sooner than on 3D scaffolds. On the other hand, albumin secretion peaked as AST secretion reached its highest level from control in TCP. Perhaps the sharp decline in both AST and albumin secretion from control in TCP indicated that cells in TCP had reached their maximum potential, while the steady progressive production of albumin and AST from the scaffolds was suggestive of the scaffolds’ potential to support hepatocytes’ functionality and viability in culture for a longer period and this needs further evaluation. It was notable that scaffolds made with glucose (PG) had a relatively higher rate of albumin and AST production when compared to the other scaffolds.
Conclusion
We found that the use of dissolvable porogen particles in developing 3D scaffolds from POSS-modified polycaprolactone urea urethane polymer modifies the scaffolds’ properties and allows liver cell attachment and functionality in particular when combined with glucose as a porogen. However, this is a new polymer and more work is needed to establish the best method for leaching and coagulation and the most efficient way to assess cell count and viability within the scaffold structure. We think that this polymer when combined with glucose has the potential to be used in liver tissue engineering.
Footnotes
Acknowledgements
Sample preparation and SEM examination and photography were provided by the Electron Microscopy Unit at Royal Free Hospital, Hampstead and University College London.
With help from the Department of Clinical Biochemistry at Royal Free Hampstead NHS Trust, London, The Liver Group at the Centre for Hepatology, Department of Medicine, Royal Free & University College Medical School, London. The Plate Washer and Plate Reader were provided by the Liver Group Laboratories, Centre for Hepatology, Royal Free and University College Medical School, London).
Funding
This project was carried out as part of my MSc Surgical Science degree at the Departments of Anatomy and Developmental Biology and Surgery at University College London, UK.