
Abstract
The Canadian Association of Radiologists (CAR) metabolic dysfunction-associated steatotic liver disease (MASLD) Working Group (WG) is a multidisciplinary working group composed of radiologists, hepatologists, and family physicians. In this 3-part series, we provide Delphi consensus-based guidance on clinical and imaging findings for patients with known or suspected MASLD (formerly termed non-alcoholic fatty liver disease or NAFLD). Part 1 focuses on the detection and grading of hepatic steatosis on imaging; Part 2 on risk-stratification of patients with MASLD, including a patient pathway that incorporates serological and imaging investigations; and Part 3 on the implementation of practice recommendations for quality assurance using shear wave elastography (SWE) and magnetic resonance elastography (MRE) for disease staging. In the first part of these guidelines, we provide 17 guidance statements for detection, grading, and surveillance of hepatic steatosis using ultrasound (US), CT, or MRI. In addition to conventional B-mode US, we review current evidence on semi-quantitative and quantitative US techniques and provide guidance for appropriate indications and recommended technique.
Background
Metabolic dysfunction-associated steatotic liver disease (MASLD), formerly non-alcoholic fatty liver disease (NAFLD), has become the most common cause of chronic liver disease (CLD) in the Western world with rising prevalence and mortality rates.1-3 MASLD represents a subsection of steatotic liver disease not caused by alcohol use and is associated with cardiometabolic risk factors such as obesity, type 2 diabetes, hypertension, and hypertriglyceridemia. 4 MASLD represents a spectrum of disease, ranging from isolated abnormal fat accumulation in the liver (metabolic dysfunction-associated steatotic liver or MASL, formerly termed NAFL), through abnormal hepatocellular ballooning and lobular inflammation (metabolic dysfunction-associated steatohepatitis or MASH, formerly termed nonalcoholic steatohepatitis or NASH), which can progress to hepatic fibrosis. Fibrosis is staged histopathologically using multiple scoring systems, generally correlated to a stage between 1 and 4 depending on the extent of perisinusoidal and/or periportal fibrosis (F1 or F2), bridging fibrosis (F3), or cirrhosis (F4). Staging is often simplified to significant fibrosis (F ≥ 2) and advanced fibrosis (F ≥ 3) with a fibrosis stage of 2 or higher associated with worse liver-related outcomes.5-8 In North America, an estimated 30% of the general population have some form of MASLD, with approximately 6% demonstrating features of MASH and approximately 3% deemed to be MASH patients with F ≥ 2 at-risk for liver-related events such as liver failure, complications of portal hypertension and/or hepatocellular carcinoma (HCC).4,9-11
Early detection and risk stratification of patients with MASLD can help identify patients at risk for liver-related events.8,10,11 These patients may benefit from lifestyle and medical intervention to prevent and even reverse early stages of CLD.11,12 The traditional gold standard to identify patients with advanced CLD is liver biopsy; however, biopsy is associated with several limitations, including patient access, tissue under-sampling, need for post-biopsy observation, cost, and potential complications such as bleeding. Given the high prevalence of MASLD, biopsy is also impractical for risk-stratifying this patient population. As such, it has become increasingly recognized that non-invasive screening, surveillance, and risk stratification of this patient population is needed. Several recent American and European guidelines have recommended such approaches to detect, risk-stratify, and monitor patients with MASLD.1,13-15 Most guidelines remain clinically focused, with limited or no involvement from radiologists in guideline development. At present, no known guidelines provide recommendations for identifying hepatic steatosis and risk stratifying MASLD with multiple imaging modalities. Hence there is a need for comprehensive recommendations encompassing commonly used imaging modalities for detection, grading, risk stratification, and monitoring of patients within the spectrum of MASLD. 16
The Canadian Association of Radiologists (CAR) MASLD Working Group (WG) was established in 2024 through the Canadian Society of Abdominal Radiologists (CSAR) and comprises radiologists, hepatologists, family physicians, a radiology trainee, and an ultrasound technologist from across Canada. The WG was convened to provide unified practice recommendations in patients with MASLD. In this 3-part series, we provide consensus guidance on clinical and imaging recommendations for patients with known or suspected MASLD. In Part 1, we focus on the detection and grading of hepatic steatosis on imaging; Part 2 on risk stratification of patients with MASLD, including a patient pathway that incorporates serological and imaging investigations; and Part 3 on the implementation of practice recommendations for quality assurance using shear wave elastography (SWE) and magnetic resonance elastography (MRE) for disease staging.
Methodology
The CAR MASLD WG was established through the CSAR with members invited by the WG co-chairs (MPW, CF). The final group consisted of 11 radiologists from across the country (MPW, AT, GL, AFC, EP, SC, AM, JD, NM, AK, CF), 2 expert hepatologists in the subject matter (AS, MS), 2 family physicians (VL, DF), 1 radiology trainee (LXZ), 1 ultrasound technologist (TW), and 1 expert in Delphi methodology (CH). Following an introductory meeting, an initial list of guidance statements were developed by one WG co-chair (MPW) and edited by the other (CF). A multi-round Delphi methodology with a 5-point Likert scale was applied to the list of initial guidance statements. Guidance statements receiving a score of ≥4.0 by ≥60% of the WG received consensus. Scores of 1.0 to 2.9 by ≥60% of the WG were insufficient to make a guidance statement and scores of 3.0 to 3.9 were re-worded or edited before undergoing another round of WG review.
This article represents Part 1 of the series. A list of 17 guidance statements were developed, with a total of 36 sections or subsections for members to score, comment, or edit. Twenty-nine sections or subsections reached consensus in the first round, with all but one achieving consensus upon completion of the second round of WG review. Following the second round of review, a meeting was held with all members to discuss the remaining guidance statement, where consensus for modification was reached. Wording revisions for clarity were made based on individual feedback and revision suggestions, and a finalized list of guidance statements was approved by all members.
Part 1: Hepatic Steatosis Imaging Guidance Statements
A complete list of 17 guidance statements for detecting and grading hepatic steatosis using ultrasound (US), CT, or MRI are shown in Table 1. Of these, 11 US guidance statements, 3 CT guidance statements, and 3 MRI guidance statements are provided.
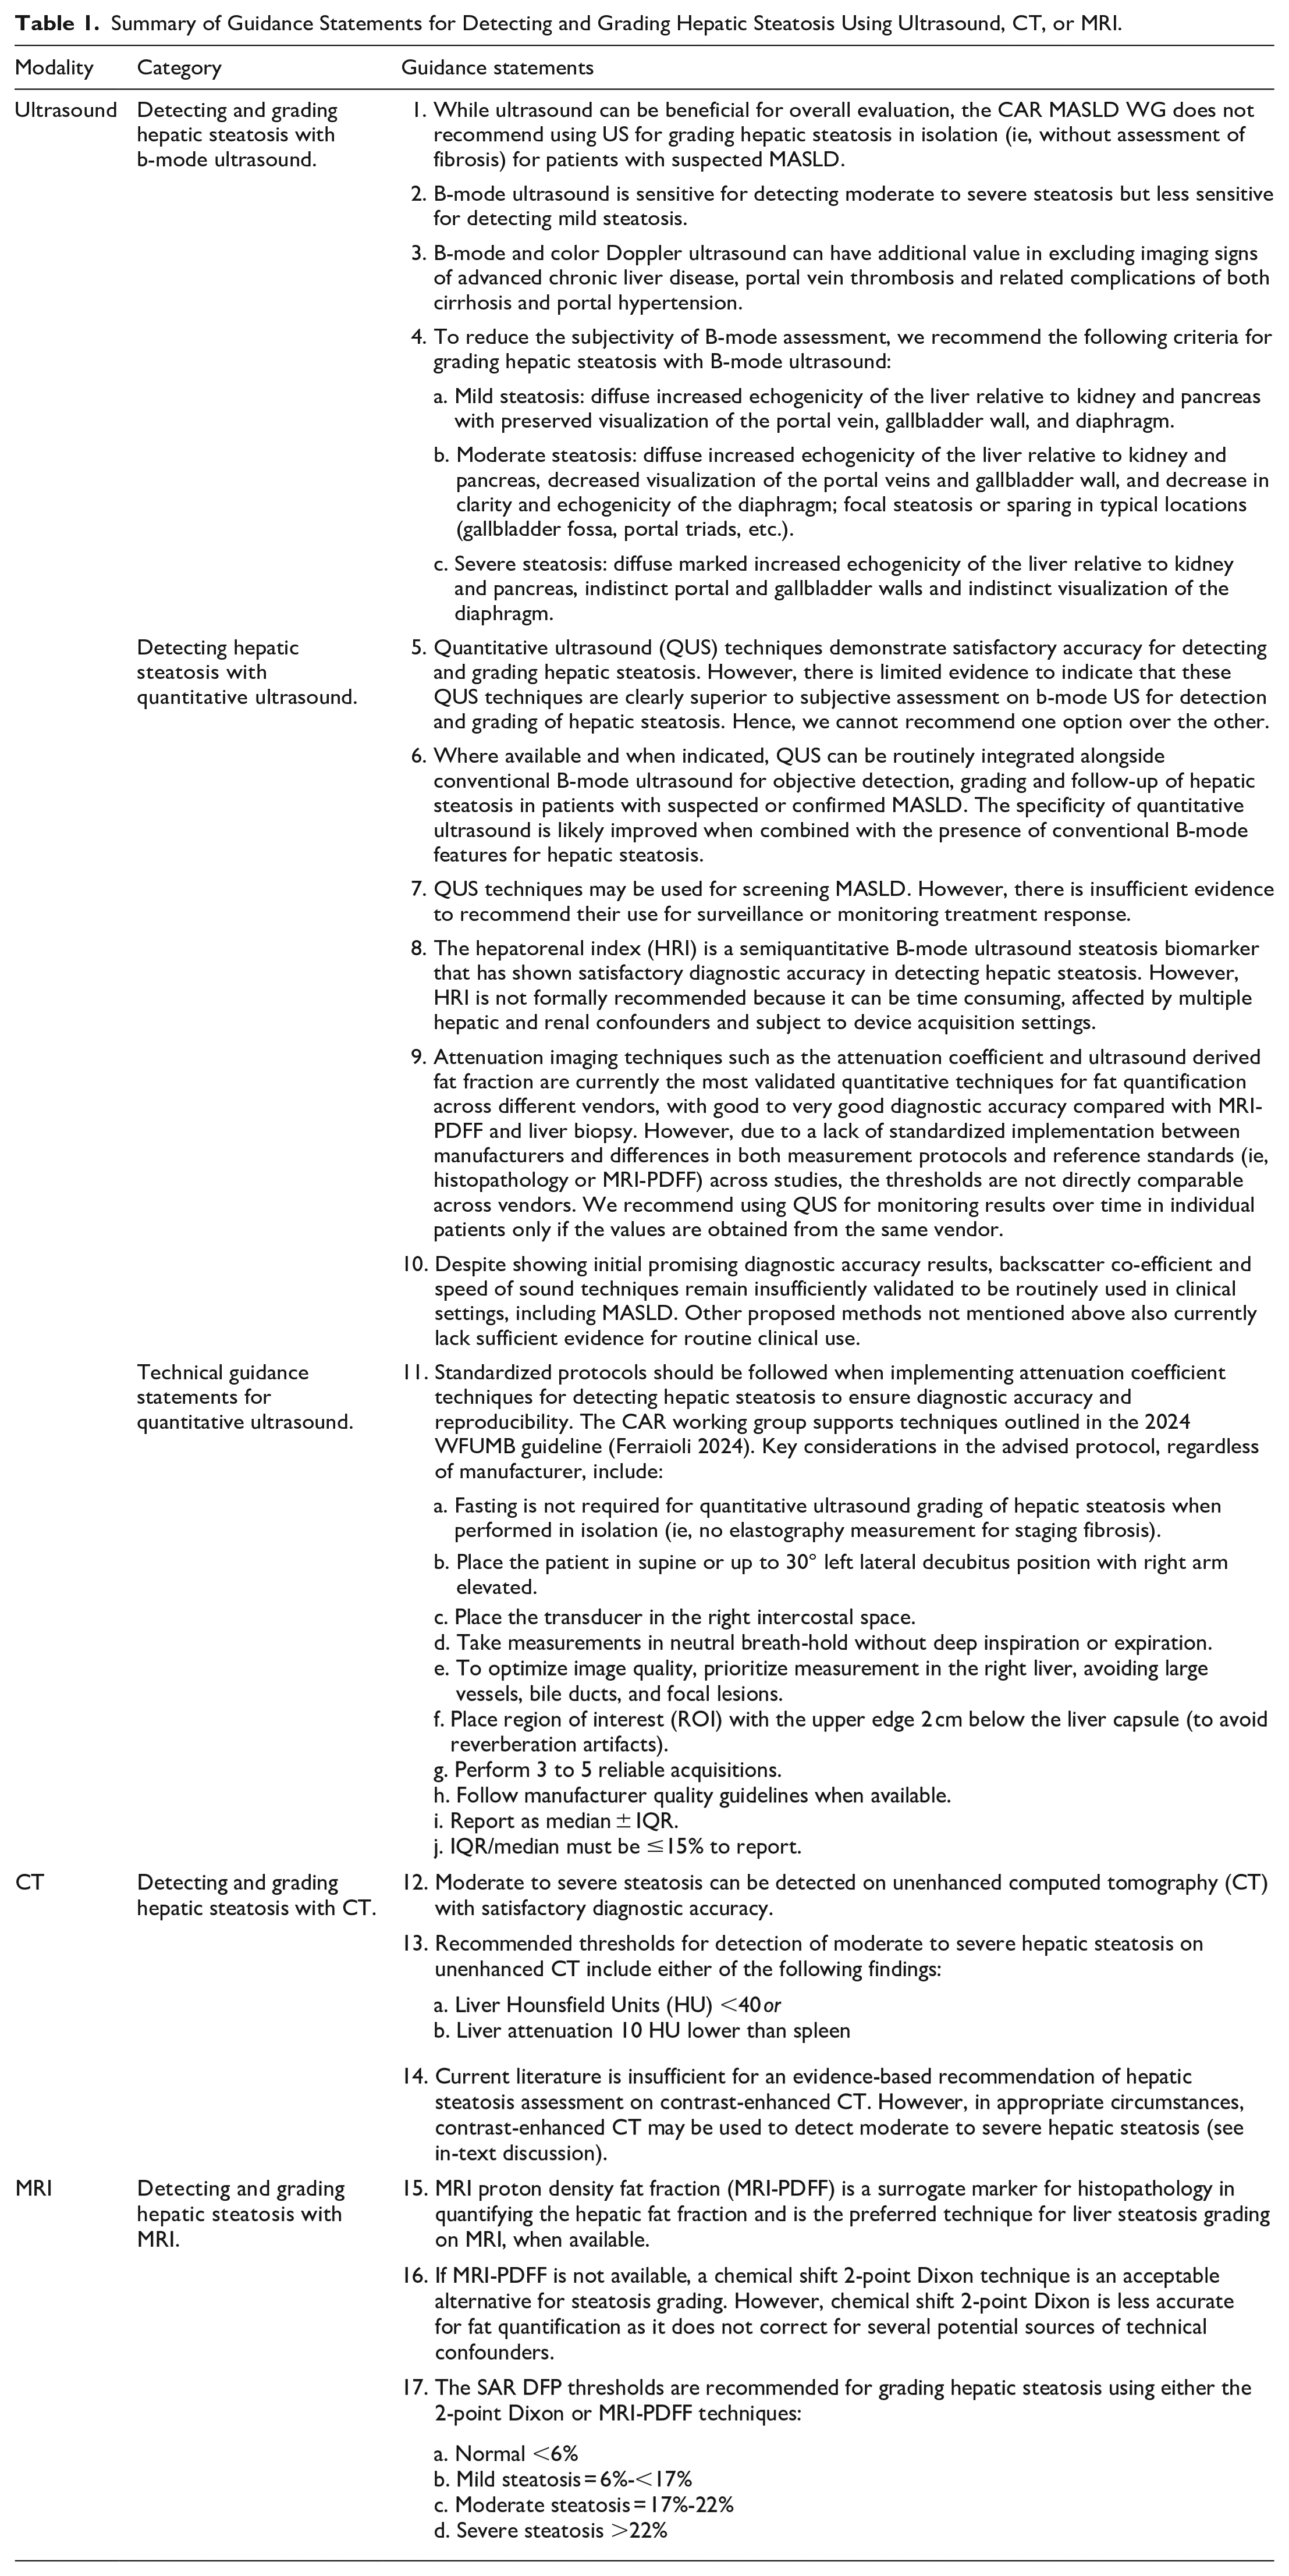
Summary of Guidance Statements for Detecting and Grading Hepatic Steatosis Using Ultrasound, CT, or MRI.
Part 1A: Ultrasound for Detecting and Grading Hepatic Steatosis
Rationale: Conventional B-mode US remains widely used for the initial detection of steatosis across Canada, with the CAR Incidental Findings Working Group recommending a qualitative grading scale to assess hepatic steatosis severity on B-mode US. 17 While the presence of MASLD has been shown to be associated with all-cause mortality, evidence has clearly shown that the degree of associated hepatic fibrosis is the strongest predictor of patient overall and liver-related morbidity and mortality risk.8,18-20 Hepatic steatosis without significant hepatic fibrosis (F ≥ 2) has not demonstrated clear association with negative liver-related outcomes.6-8 Recent studies have suggested that correlating serum biochemical markers with B-mode US can improve screening strategies, though the implication of such screening strategies relies on the underlying pathophysiologic changes in the hepatocytes associated with MASLD more than the sonographic findings, rendering the addition of biochemistry more relevant. 21 As such, conventional B-mode US can be useful for identifying patients with hepatic steatosis and initiating appropriate clinical evaluation, though it is not currently indicated for the purpose of grading hepatic steatosis alone.
Rationale: The sensitivity and specificity for detecting moderate to severe hepatic steatosis with B-mode US have been shown to range from 80% to 89% and 87% to 94%, respectively.22-28 However, accuracy is significantly lower for detecting mild steatosis (S1: 5%-33% hepatocyte fat infiltration) and is limited by considerable interobserver variability.10,22-28 The sensitivity of B-mode US for detecting steatosis may also be lower in obese patients and potentially other populations with higher pretest probabilities than the general population. 29 Assuming a 30% prevalence of steatosis in adult patients in Canada, the negative predictive value of B-mode US is around 90%. 27 The negative predictive value decreases as the pre-test probability of the subset patient population increases.
Rationale: Morphological and vascular features on conventional B-mode and color Doppler US improve the specificity for detecting advanced hepatic fibrosis (F ≥ 3) and cirrhosis (F = 4). 30 In an analysis of 300 patients with various etiologies resulting in CLD, the presence of surface nodularity, caudate lobe hypertrophy and changes in hepatic vein phasicity (defined as biphasic or monophasic waveforms in the right hepatic vein, 6 to 8 cm away from the confluence of the hepatic vein, at the end of normal expiration) demonstrated specificities of 95% (95% CI 92%-98%), 91% (87%-95%), and 76% (70%-92%), respectively, with a specificity of 98% (96%-100%) when all 3 features were present. 30 The sensitivity of these findings was shown to be poor, with the absence of these features sensitivities range between 51% and 57% for excluding advanced hepatic fibrosis and cirrhosis.
In addition to identifying patients with advanced hepatic fibrosis and cirrhosis, B-mode and color Doppler US can also be used to identify features associated with advanced CLD. These can include a variety of liver-related events including the presence of HCC and features or complications of portal hypertension. 31
First, B-mode US is specific but not sensitive for identifying HCC in patients with CLD.30,32,33 In a meta-analysis evaluating nearly 13 000 patients with cirrhosis, US identified a pooled sensitivity of 84% (95% CI 76%-92%) for all stages but a sensitivity of only 47% (33%-61%) for early stage detection of HCC (defined as one observation <5 cm or up to 3 observations each measuring <3 cm), though the sensitivity was shown to improve in newer studies published after the year 2000. 32 In an individual retrospective study of 200 consecutive cirrhotic patients evaluated with US, sensitivities for detecting HCC were shown to be 21% (20/96) for observations <2 cm, 62% (44/71) for observations between 2 and 4 cm, and 85% (28/33) for observations ≥4 cm. 33 The overall per-nodule sensitivity was 46% (92/200) and the per-patient sensitivity was 64% (88/138) in this study. The detection rate may be worse when liver visualization is limited in patients with more advanced steatosis. 34
Second, B-mode and color Doppler US can also be used for detecting features or complications of portal hypertension. Features which can be associated with portal hypertension include increased portal vein diameter, reduced or reversed portal vein velocity, presence of portosystemic collateral veins (such as a recanalized umbilical vein or splenorenal varices), splenomegaly or ascites.31,35 A portal vein diameter >13 to 16 mm has been suggested to be associated with portal hypertension, although supporting literature is lacking and there is no current consensus on size threshold.31,36 A study of 174 cirrhotic patients showed an additional increased risk of portal vein thrombosis (PVT) when portal vein size measured >13 mm. 37 A mean portal vein flow velocity <15 cm/s in cirrhotic patients has also been shown to have an increased risk of PVT.38,39
The presence of portosystemic shunts on imaging can be predictive of other complications including increased risk of developing HCC 40 and other liver-related events in patients with advanced CLD. 41 For example, the presence of portosystemic shunts can be directly associated with complications including hepatic encephalopathy and mortality. 42
Spleen size >13 cm has been suggested to be a specific but non-sensitive sign of portal hypertension in patients with advanced CLD, although the underlying literature supporting this claim is lacking.35,43 Within the last 10 years, models using combinations of spleen size, liver stiffness measurement (LSM) and platelet count have been shown to be highly correlated with clinically significant portal hypertension (hepatic venous pressure gradient [HVPG] ≥10 mmHg).44,45
Finally, the presence of ascites also supports the presence of portal hypertension in patients with CLD, with increasing volume of ascites directly correlated with both portal hypertension (HVPG ≥5 mmHg) and clinically significant portal hypertension (HVPG ≥10 mmHg).31,46,47
a. Mild steatosis: diffuse increased echogenicity of the liver relative to kidney and pancreas with preserved visualization of the portal vein, gallbladder wall, and diaphragm.
b. Moderate steatosis: diffuse increased echogenicity of the liver relative to kidney and pancreas, decreased visualization of the portal veins and gallbladder wall, and decrease in clarity and echogenicity of the diaphragm; focal steatosis or sparing in typical locations (gallbladder fossa, portal triads, etc.).
c. Severe steatosis: diffuse marked increased echogenicity of the liver relative to kidney and pancreas, indistinct portal and gallbladder walls and indistinct visualization of the diaphragm.
Rationale: The CAR Incidental Findings Working Group published a qualitative grading scale for hepatic steatosis in a 2020 publication on incidental hepatobiliary findings with a similar framework. 17 In their initial guidelines, the liver served as an internal frame of reference without standardized comparison to kidney or pancreas. A more recent review by Fetzer et al has endorsed a proposed grading system used in an interval scoring system for differentiating MASL from MASH by comparing the liver parenchyma echogenicity to other structures including the kidney, pancreas, and other intra-hepatic structures.48,49 The CAR MASLD WG recommends a modified grading system, noting that a particular limitation of the original CAR guidelines was poor accuracy for detecting mild hepatic steatosis. Additionally, focal fatty sparing or steatosis in typical locations such as adjacent to the gallbladder fossa, falciform ligament or portal vein serves as a specific marker for hepatic steatosis. 49
Rationale: Several QUS techniques have been proposed for objective detection and grading of hepatic steatosis (see Table 1 from Ozturk et al, Radiology 2023). 50 Individual technique details including basic physical properties for these techniques are described elsewhere.23,50 The most studied QUS techniques measure attenuation, backscatter, speed of sound (SoS), or a combination of these techniques. Based on existing literature, several of these QUS techniques provide high diagnostic accuracy, with reported area under the receiver operating characteristic curve (AUC) > 0.80 for detection (ie, S0 vs S1-S2-S3) and for grading of steatosis (ie, S0-S1 vs S2-S3 or S0-S1-S2 vs S3) where steatosis is graded histologically as absent (S0), mild (S1), moderate (S2), or severe (S3), based on the percentage of hepatocytes containing lipid accumulation (see Table 1 from Zhang et al, AJR 2024). 23 However, to our knowledge, no study has compared head-to-head the accuracy of qualitative assessment of B-mode US with QUS techniques for detection and grading of hepatic steatosis.
A pilot study assessing the diagnostic performance of investigational attenuation and backscatter techniques indicates that these QUS techniques may be more accurate than B-mode US for grading steatosis. The accuracy was 62% and 68% for attenuation and backscatter coefficient-derived scores, respectively, compared to 52% for B-mode US. 51 In another study, results showed a strong correlation between US-guided attenuation parameter (UGAP) and visual grades of hepatic steatosis on B-mode US, with correlation coefficients of .845 and .850, respectively. 52 This suggests that while QUS techniques may offer improved reproducibility and diagnostic performance, there is limited evidence to clearly establish their superiority over subjective B-mode US assessments.
Rationale: As discussed in Guidance Statement #5, QUS techniques provide objective measurements that complement B-mode imaging and demonstrate overall satisfactory diagnostic accuracy. Multiple studies have further shown good to excellent intra- and inter-reader agreement with intraclass coefficients (ICC) exceeding 0.80. 53 As such, QUS may be a useful tool to supplement qualitative US when available for objective detection, grading and surveillance. 53 However, it is the opinion of the WG that, while the objective measurements provided by QUS techniques hold potential for disease monitoring, their accuracy and clinical usefulness for this purpose remain insufficiently validated (see Guidance Statement #7). Furthermore, due to differences in parameters, units, and implementations between proprietary techniques from different manufacturers, longitudinal monitoring remains challenging (see Guidance Statement #9). If QUS is used for surveillance, it is important to use the same system and protocol for the same patient over time to ensure consistency.
Rationale: Despite their promising diagnostic accuracy and reliability, the use of QUS techniques for surveillance and monitoring treatment response in MASLD remains less established. Most studies using QUS techniques are cross-sectional, with limited data on their reliability for monitoring treatment response and the long-term prognostic value of QUS fat quantification in MASLD patients. Additionally, due to a lack of correlation between the degree of hepatic steatosis and patient outcome (see Guidance Statement #1), the benefit for and frequency of steatosis surveillance should be dependent on other clinical and imaging parameters (including LSM surveillance) in addition to regional practice patterns. Although LSM has been validated for predicting liver-related events and monitoring fibrosis progression, further evidence is needed to support the routine use of QUS techniques for monitoring purposes. 54
Rationale: The hepatorenal index (HRI) is the ratio of mean image brightness in a liver region of interest (ROI) to a mean image brightness in a nearby kidney cortex ROI acquired at the same image depth.55,56 ROIs within the liver should not include large ducts or vessels, masses, or cysts. ROIs within the kidney should include only renal cortex and medulla and should not include masses, cysts, collecting system or extra-renal tissue. This semi-quantitative steatosis biomarker had shown initial promise for detection and grading of liver steatosis with an AUC as high as 0.92 (95% CI 0.87-0.97) and sensitivity as high as 100% for detecting the presence of steatosis (S0 vs S1-S2-S3) with a retrospective threshold of ≥1.28, though results of more recent studies have been less encouraging (AUCs of 0.68 and 0.79 for S0 vs S1-S2-S3).55,57 HRI can be affected by several factors including hepatic and renal confounders which alter individual organ echogenicity and with changes in device acquisition settings. HRI has also not been vetted for reliability across different systems. In addition, it is time consuming when compared to qualitative assessment and is therefore not widely used in clinical practice. 17
Rationale: Attenuation imaging techniques are currently the most validated techniques for fat quantification across different vendors, with good to very good diagnostic performance compared with MRI-PDFF and liver biopsy. There are a number of implementations by different manufacturers (see Table 1 from Zhang et al, AJR 2024), 23 with some techniques more widely validated than others. For instance, a meta-analysis including 13 studies with different attenuation-based techniques has reported pooled sensitivity and specificity for diagnosing steatosis of 76% (95% CI 73%-80%) and 84% (77%-89%), respectively, for S0 versus S1-S2-S3, and 87% (83%-91%) and 79% (75%-83%), respectively, for S0-S1 versus S2-S3. 58 Another recent large individual patient data meta-analysis across 11 studies with an externally validated cohort has reported AUCs of 0.86 for S0 versus S1-S2-S3, 0.94 for S0-S1 versus S2-S3, and 0.97 for S0-S1-S2 versus S3 for the attenuation imaging (ATI) technique. 59 Techniques combining attenuation and backscatter, such as ultrasound-derived fat fraction (UDFF) and ultrasound fat fraction (USFF), have also shown very good diagnostic accuracy results, although in a smaller number of studies.60,61
Conversely, there is significant variability in the implementation of these techniques across different manufacturers. For instance, Ferraioli et al highlighted substantial differences in attenuation coefficient values obtained with different ultrasound systems, limiting their interchangeability for diagnostic and follow-up imaging. 62 This variability is in part due to differences in measurement protocols and reference standards (eg, histopathology or MRI-PDFF) used across studies. Given these discrepancies, it is essential to interpret results over time in each individual patient using values obtained from the same ultrasound system to ensure accuracy and reliable longitudinal assessment. In this context, we also recommend referring to key studies outlining each vendor’s diagnostic thresholds for identifying and grading steatosis.
Rationale: Backscatter coefficient (BSC) is primarily limited by the dependency of backscatter measurements with depth.63,64 Additionally, quantitative BSC measurement reflecting local scatterer physical characteristics requires compensation for total attenuation, and though a few approaches have been proposed, an optimal method still needs to be developed. 65 Backscatter measurements may also be affected by other liver conditions, such as concomitant fibrosis.
When using SoS techniques to quantify steatosis, precise measurement is essential due to the relatively small percentage change in disease states compared to normal, and measurement variability represents a potential limitation. 66 Additionally, biological confounders such as liver heterogeneity, inflammation, and fibrosis, along with technical factors like subcutaneous fat thickness and depth, can directly impact measurements.49,67,68 Further studies are needed to standardize measurements, improve the accuracy of correlations with reference hepatic fat quantities, and establish cut-off values for differentiating steatosis grades.
Other investigative ultrasound-based quantitative methods have been proposed, as outlined in Table 1 of Ozturk et al, though limited studies are available and these remain investigational at present time. 50
a. Fasting is not required for quantitative ultrasound grading of hepatic steatosis when performed in isolation (ie, no elastography measurement for staging fibrosis).
b. Place the patient in supine or up to 30° left lateral decubitus position with right arm elevated.
c. Place the transducer in the right intercostal space.
d. Take measurements in neutral breath-hold without deep inspiration or expiration.
e. To optimize image quality, prioritize measurement in the right liver, avoiding large vessels, bile ducts, and focal lesions.
f. Place region of interest (ROI) with the upper edge 2 cm below the liver capsule (to avoid reverberation artifacts).
g. Perform 3 to 5 reliable acquisitions.
h. Follow manufacturer quality guidelines when available.
i. Report as median ± IQR.
j. IQR/median must be ≤15% to report.
Rationale: As noted in Guidance Statement #9, discrepancies between manufacturers including underlying value acquisitions and measurement protocols necessitate patient surveillance to be performed with the same ultrasound system to ensure reliability. Furthermore, consistency in technique is essential for which the CAR MASLD WG supports recent WFUMB recommendations for establishing a reproducible technique. 53 The technique primarily matches those recommended for SWE acquisition (see Part 2, Recommendation #8) with the exception that fasting is not required when a LSM measurement is not obtained.15,69 For attenuation coefficient techniques, 3 to 5 reliable acquisitions are needed and interquartile range (IQR) must be ≤15% to report.
Part 1B: CT for Detecting and Grading Hepatic Steatosis
Rationale: A recent meta-analysis including 15 articles and 5983 patients demonstrated a pooled 82% (95% CI 67%-91%) sensitivity and 94% (88%-97%) specificity when using noncontrast CT for detecting moderate to severe hepatic steatosis (S0-S1 vs S2-S3) with either biopsy or derived proton density fat fraction (PDFF) as the reference standard. 70 In contrast, the same meta-analysis included 17 articles with 8304 patients and demonstrated a reduced 72% (61%-80%) sensitivity and 88% (81%-93%) specificity for detecting any degree of steatosis (S0 vs S1-S2-S3). Individual studies used one or more of liver attenuation, liver-spleen attenuation difference, or liver to spleen attenuation ratio for their diagnostic thresholds. Most studies used optimal retrospective thresholds. The collated literature indicates that acceptable diagnostic accuracy including a high specificity can be achieved when detecting at least moderate hepatic steatosis with noncontrast CT.
a. Liver Hounsfield Units (HU) <40 or
b. Liver attenuation 10 HU lower than spleen
Rationale: An original study of 315 asymptomatic patients undergoing same-day noncontrast CT and liver biopsy identified a specificity of 100% for detecting moderate to severe hepatic steatosis with a threshold of <48 Hounsfield units (HU). 71 In combination with other studies and allowing for some variability between vendors, the authors suggested a more conservative threshold of <40 HU as diagnostic for hepatic steatosis on noncontrast CT. A recent meta-analysis has supported this threshold across multiple studies since. 70 Other thresholds used in large sample size studies included liver-spleen attenuation differences less than −5 to 0 HU and a liver to spleen attenuation ratio under 0.9 to 1, each showing a high specificity (87%-97%) for detecting hepatic steatosis.70,72-75 Of these, liver attenuation and liver-spleen attenuation difference are the 2 most validated across multiple studies. In an effort to ensure high specificity, the CAR MASLD WG supports diagnostic criteria including a liver attenuation <40 HU or a liver-spleen attenuation difference less than −10 HU.
Some studies have also evaluated subjective signs, including fat sparing near the gallbladder fossa and visibility of hepatic vessels, or compared liver attenuation with muscle attenuation. These studies demonstrated high specificities but low sensitivities with these techniques.70,76-78
Rationale: In the same meta-analysis discussed in Guidance Statement #12, a pooled sensitivity of 68% (26%-93%) and specificity of 93% (88%-96%) were achieved with contrast-enhanced CT (CECT) for detecting moderate to severe hepatic steatosis when compared to a biopsy or PDFF reference standard. 70 The pooled sensitivity and specificity for detecting any degree of steatosis with CECT using the same reference standard was 66% (50%-79%) and 90% (84%-93%), respectively. However, when excluding studies which include unenhanced CT in their reference standard, only three studies were used in these analyses including a total of only 77 to 231 patients in any single sensitivity and specificity analysis. While demonstrating promising specificity, the evidence remains limited to date with the meta-analysis concluding “although the literature on the value of CECT for the detection of steatosis is encouraging, more data are needed to support their use.” 70 The authors further concluded that there is insufficient evidence to establish a recommended threshold. Based on the limited number of studies to date, a liver-spleen attenuation difference of <−20 HU on portal venous phase imaging appears as though it will represent highly specific threshold for detecting moderate to severe hepatic steatosis using CECT (specificity >95%).79-81
Part 1C: MRI for Detecting and Grading Hepatic Steatosis
Rationale: The MRI methods of choice for the non-invasive fat quantification in MASLD include magnetic resonance spectroscopy derived proton density fat fraction (MRS-PDFF) and magnetic resonance imaging derived proton density fat fraction (MRI-PDFF). The PDFF is calculated using the formula PDFF = F/(F + W) where F and W represent the unconfounded MR signals of mobile fat and water protons, respectively. These techniques have been validated against histology and show a strong correlation with each other.82-89 While MRS-PDFF has been traditionally regarded as the imaging reference standard for liver fat quantification, it suffers from limited spatial coverage leading to sampling variability. In contrast, state-of-the-art confounder-corrected chemical shift MRI-PDFF techniques have the capacity to sample the entire liver volume in a single breath-hold. 90 As such, MRI-PDFF is generally preferred to MRS-PDFF for use in clinical trials. 91 A multicenter study involving 9 participating sites that included 27 MR scanners (10 at 1.5 T and 17 at 3 T) and 3 vendor platforms (GE, Siemens, and Philips) found that MRI-PDFF was accurate and reproducible across different sites, field strengths, pulse sequences, and vendor platforms when evaluated against a commercial phantom. 92 The Non-invasive Biomarkers of Metabolic Liver Disease (NIMBLE) consortium performed a study to determine the different day same-scanner repeatability of imaging biomarkers in 17 MASLD patients that underwent up to 7 MR examinations across 2 sessions within 7 days apart and found that for MRI-PDFF, a threshold of 1.2% to 1.6% suggested a real change beyond that of measurement error. 93 A meta-analysis involving 6 studies and 635 patients with MASLD found that MRI-PDFF had pooled sensitivities and specificities of 0.93 and 0.94 for differentiating S0 versus S1-3, 0.74 and 0.90 for S0-1 versus S2-3, and 0.74 and 0.87 for S0-2 versus S3, respectively. 94 Because of these and other results, MRI-PDFF is now considered a surrogate marker for histopathology and should be preferentially used for quantifying hepatic steatosis, when available.
Rationale: In practice, many centers in Canada lack access to MRS-PDFF or MRI-PDFF. As a compromise, an approximate liver fat fraction may be obtained using the chemical shift 2-point Dixon method on T1 in-phase (IP) and opposed-phase (OP) MR images. This involves manually placing ROIs over both lobes of the liver (at least 1 in each lobe) on corresponding locations on the IP and OP images taking care to avoid the liver margin, large vessels, large bile ducts, and the gallbladder fossa. 95 The fat fraction (FF) is calculated using the formula FF = (IP − OP)/(2 × IP). 96 FF estimates on 2-point Dixon often underestimate liver fat content due to confounders such as B0 inhomogeneity, spectral complexity of fat, T2* effects, T1 bias, noise bias, J-coupling, and eddy currents.96,97 A major limitation of the technique is that it cannot be used to estimate liver fat in the presence of iron overload as fat and iron have opposing effects on liver signal on the chemical shift MR sequences. A preliminary single-center study in 62 patients found that when patients with iron overload were excluded from the analysis, FF estimates on 2-point Dixon showed an excellent correlation (≥.95) and a strong linear relationship with MRI-PDFF and MRS-PDFF (P < .001). 97 In evaluating the grade of steatosis, 2-point Dixon was found to be better at classifying severe steatosis (AUC = 0.96) compared to moderate (AUC = 0.72) or mild steatosis (AUC = 0.75). 97
a. Normal <6%
b. Mild steatosis = 6%-<17%
c. Moderate steatosis = 17%-22%
d. Severe steatosis >22%
Rationale: The most commonly used histopathological standard for grading hepatic steatosis is a 4-point scale ranging from S0 to S3 (S0: <5%; S1: 5%-33%; S2: 34%-66%; S3: >66%).98,99 While MRI-PDFF is used as a surrogate marker for histopathology, it is recognized that a linear relationship with histology exists up to 5% steatosis, after which a considerable divergence occurs with histology exceeding PDFF by up to 3.4-fold. 98 Using a specificity threshold of 90%, a 2023 meta-analysis of 9 studies identified optimal PDFF thresholds of ≥5.75% for ≥S1, ≥15.5% for ≥S2, and ≥21.35% for S3. 98 As such, and despite recognizing that there is minor variability between established PDFF thresholds in the literature, the Society of Abdominal Radiologists (SAR) Liver Fibrosis Disease-Focused Panel (DFP) and members of other European Society of Radiology have agreed to endorse a standardized grading system of: S0 (normal) <6%; S1 (mild steatosis) 6% to <17%; S2 (moderate steatosis) 17% to 22%; and S3 (severe steatosis) >22%. 100 For uniformity in practice, the CAR MASLD WG supports this recommendation and suggests these thresholds also be used for values obtained with a 2-point Dixon technique when MRI-PDFF is not available.
Some limitations of MRI-based fat quantification may exist. First, for some MRI systems, MRI-PDFF ROI values may be scaled by a factor of 10. This can be determined by placing a ROI on subcutaneous fat, which should have an MRI-PDFF value nearing 100%. These values are independent of field strength and do not require adjustment. ROIs should also not be placed in areas of fat-water swap, a limitation of chemical shift which can be a mischaracterization of fat and water signal at computation. When MRI-PDFF is not available, and the 2-point Dixon technique is used, special attention to several limitations documented in Guidance Statement #16 section should be noted. Specifically, the 2-point Dixon technique should not be used in patients with known liver iron deposition.
Conclusion
Part 1 of the CAR MASLD WG guidelines outlines 17 guidance statements for best practices multimodality (US, CT, MRI) detection, grading and surveillance of hepatic steatosis including discussing evolving quantitative ultrasound techniques. The current literature was thoroughly evaluated with guidance statements based on best available evidence and expert opinion. With the exception of more limited sets of recommendations previously provided by the World Federation for Ultrasound in Medicine and Biology (WFUMB) and Society of Abdominal Radiology (SAR) Disease-focused panel (DFP) discussed in this article, we are not aware of a similar equally comprehensive guideline for imaging hepatic steatosis available to date. These Guidance Statements serve as the foundation for guidance in Part 2 on risk stratification of MASLD patients and Part 3 on best practices for SWE and MRE program implementation and quality assurance.69,101
Footnotes
Abbreviations
AUC area under the receiver operating characteristic curve
CAR Canadian Association of Radiologists
CLD chronic liver disease
CSAR Canadian Society of Abdominal Radiologists
CT computed tomography
HCC hepatocellular carcinoma
HRI hepatorenal index
HU Hounsfield units
HVPG hepatic venous pressure gradient
IP in-phase
LSM liver stiffness measurement
MASH metabolic dysfunction-associated steatohepatitis
MASLD metabolic dysfunction-associated steatotic liver disease
MRE magnetic resonance elastography
MRI magnetic resonance imaging
MRS magnetic resonance spectroscopy
NAFLD nonalcoholic fatty liver disease
NIMBLE Non-invasive Biomarkers of Metabolic Liver Disease
OP out-of-phase
PDFF proton density fat fraction
PVT portal vein thrombosis
QUS quantitative ultrasound
SAR DFP Society of Abdominal Radiology Disease-Focused Panel
SWE shear wave elastography
US ultrasound
WFUMB World Federation for Ultrasound in Medicine and BiologyWG working group
ORCID iDs
Funding
The author(s) received no financial support for the research, authorship, and/or publication of this article.
Declaration of Conflicting Interests
The author(s) declared no potential conflicts of interest with respect to the research, authorship, and/or publication of this article.