
Abstract
Introduction
In biomedical research, including imaging research, published studies are often incompletely reported,1-5 hindering the reader’s ability to evaluate the strengths and limitations of the study, determine the generalizability of the results, and predict reproducibility.6-9 Furthermore, insufficient reporting of key study details imposes challenges on researchers conducting systematic reviews, as critical information required for proper analysis and risk of bias assessment may be absent.10-12 Incomplete reporting also influences patient outcomes. Although clinical decision making is largely directed by guidelines, clinicians will refer to current literature for assistance in specific cases.13,14
In 2015, The STAndards for Reporting of Diagnostic Accuracy Studies (STARD) group updated its reporting guidelines. STARD 2015 contains a 30-item checklist that applies to all types of diagnostic accuracy research, including diagnostic imaging, microbiology, laboratory tests, physical exams, and screening questionnaires. 15 A study published by Hong et al evaluated the adherence of diagnostic accuracy imaging research published in 2016 to the updated STARD 2015 guideline. 16 Of the 142 included studies, it determined an adherence rate of 55% (with 16.6/30 items being reported on average). In addition, new STARD items (such as sample size calculation and protocol details) were infrequently reported. 16 Hong et al’s objective was to evaluate and establish a baseline level of completeness of reporting to allow for measurement of improvement over time. Since then, several efforts toward promoting knowledge translation have been implemented by the STARD group: an Explanation and Elaboration was published with detailed instructions and examples of how to report each item 17 ; endorsement and dissemination of the updated guideline was promoted via the EQUATOR network 18 ; and increasing numbers of journals, such as the Canadian Medical Association Journal (CMAJ), have endorsed STARD 2015 reporting guideline as part of their manuscript submission guidelines for authors.19,20
The purpose of this study is to evaluate the current adherence of diagnostic accuracy studies recently published in imaging journals to STARD 2015 to assess for potential improvement in adherence.
Methods
This study is an update of the baseline evaluation performed by Hong et al 16 in 2016; methods are based on those established in the “baseline” evaluation, 16 following the guidelines from the Text Recycling Project, 21 to permit comparison between cohorts. The protocol was registered on the Open Science Frame (OSF): (link).
Literature Search
We performed an electronic literature search on MEDLINE (Appendix A); this was modelled after the search strategy used in the study conducted by Hong et al. 16 The search encompassed diagnostic accuracy studies published in imaging journals with a previously published search filter for diagnostic accuracy studies restricted to 136 imaging journals as defined by Thomson Reuters’ Journal Citation Reports.22,23 No new journals were added in the literature search. With the exception of the date of the search, the literature search remained identical to the original study to ensure a fair comparison. The timespan of the search was modulated to achieve a minimum sample size of 100 included studies by restricting the scope of studies to those published between May and June of 2024, with the search expanded to gradually earlier dates as required based on sample size requirements. Our sample size calculations were based on a study by Stahl et al. 24 With 66 studies, their group was able to find a significant difference with medium effect sizes of 0.24 to 0.54. Based on an estimated medium effect size of 0.5, it was determined that for 80% power and .05 significance, a minimum sample size of 63 articles was required. Moreover, our goal was to achieve a sample size similar to the study conducted by Hong et al, 16 which was 142. We included studies from the most recent study published backward until we had the desired sample size.
Study Selection
The study selection criteria, besides the publication date, remained identical to the original study to maximize comparability and minimize variability. Articles were included if they met the following inclusion criteria: (1) reporting on a study in which the diagnostic accuracy of one or more imaging index tests was evaluated against a reference standard in human subjects, and (2) reporting at least one estimate of diagnostic accuracy (eg, sensitivity, specificity, predictive values, likelihood ratios, and/or area under the ROC curve). We excluded studies on the predictive or prognostic accuracy of tests, reviews, short reports, and articles published in languages other than English.
Two reviewers independently screened the titles and abstracts of the retrieved articles to evaluate their potential relevance. Full texts of all potentially relevant articles were assessed independently and in duplicate by 2 reviewers. Disagreements were discussed and resolved in consensus meetings and, if necessary, by consultation of a third reviewer. A third reviewer was available for resolving any complex conflicts, it was rarely (<2% of entries) necessary as the initial 2 reviewers were typically able to come to an agreement.
Data Extraction
The following baseline characteristics were extracted from each study report: first author, country of corresponding author’s institution, journal, journal impact factor (Thomson Reuters’ 2023 Journal Citation Report), journal STARD adoption status, study design (prospective vs retrospective), imaging modality (eg, MRI, CT, ultrasound, X-ray), and subspecialty area (eg, neuroradiology, chest imaging, cardiovascular). In November of 2024, we evaluated STARD adoption status by looking at each journal’s instructions for authors; a journal was considered a STARD adopter if its instructions for authors explicitly recommended adherence to STARD and/or STARD 2015.
Adherence to STARD 2015
The assessment of adherence was in line with the baseline evaluation by Hong et al. In the case that STARD 2015 items had more than one component (eg, Item 8: where and when potentially eligible participants were identified [setting, location, and dates]), the item was divided into subitems (eg, 8.1 setting, 8.2 location, and 8.3 dates) that were scored independently. In addition, items regarding test methods with potential aspects unique to imaging research were divided into multiple subitems. Each item had a weight of 1 point out of 30. If there were sub-items for any specific item, they were assigned equal weight such that all sub-items added up to 1 point.
Before STARD scoring, all extractors performed pilot scoring on 3 studies. The final list of items scored with associated descriptors/criteria is provided in Appendix B. Two reviewers used the final list of items to independently score STARD adherence for each included study. Each reporting requirement was rated as “Yes,” “No,” or “N/A.” Any disagreements were resolved by consensus. If a consensus was not reached, a third reviewer made the final decision.
Data Analysis
The overall adherence to STARD 2015 was measured using the total number of STARD items reported for each study, which could range from 0 (none of the items sufficiently reported) to 30 (all the items sufficiently reported). Items rated as “N/A” were scored as a “Yes” regarding adherence and therefore received 1 point. Items with multiple subitems were scored with a total of 1 point with equal fractional points awarded for each sub-item. An arbitrary classification about reporting adherence was devised as follows: items reported in <33% of studies were considered “infrequently reported,” those reported in 33% to 66% of studies were considered “moderately reported,” and those reported in >66% of studies were considered “frequently reported.”
Univariable Poisson Regression was used to evaluate differences in the number of reported STARD items related to journal of publication, imaging modality, study design, country of corresponding author, and imaging subspecialty area. A multivariable Poisson Regression was used to evaluate the effect of each variable independently on STARD item adherence. A two-tailed student’s t-test was used to compare STARD adherence between the baseline study and current study to evaluate differences in overall STARD adherence relative to factors including journal impact factor (median split) and STARD adoption status (adopter vs nonadopter). The level of statistical significance was set at P < .05. All statistical analyses were performed using SAS OnDemand for Academics and R (R Core Team (2023)).
Results
Study Selection
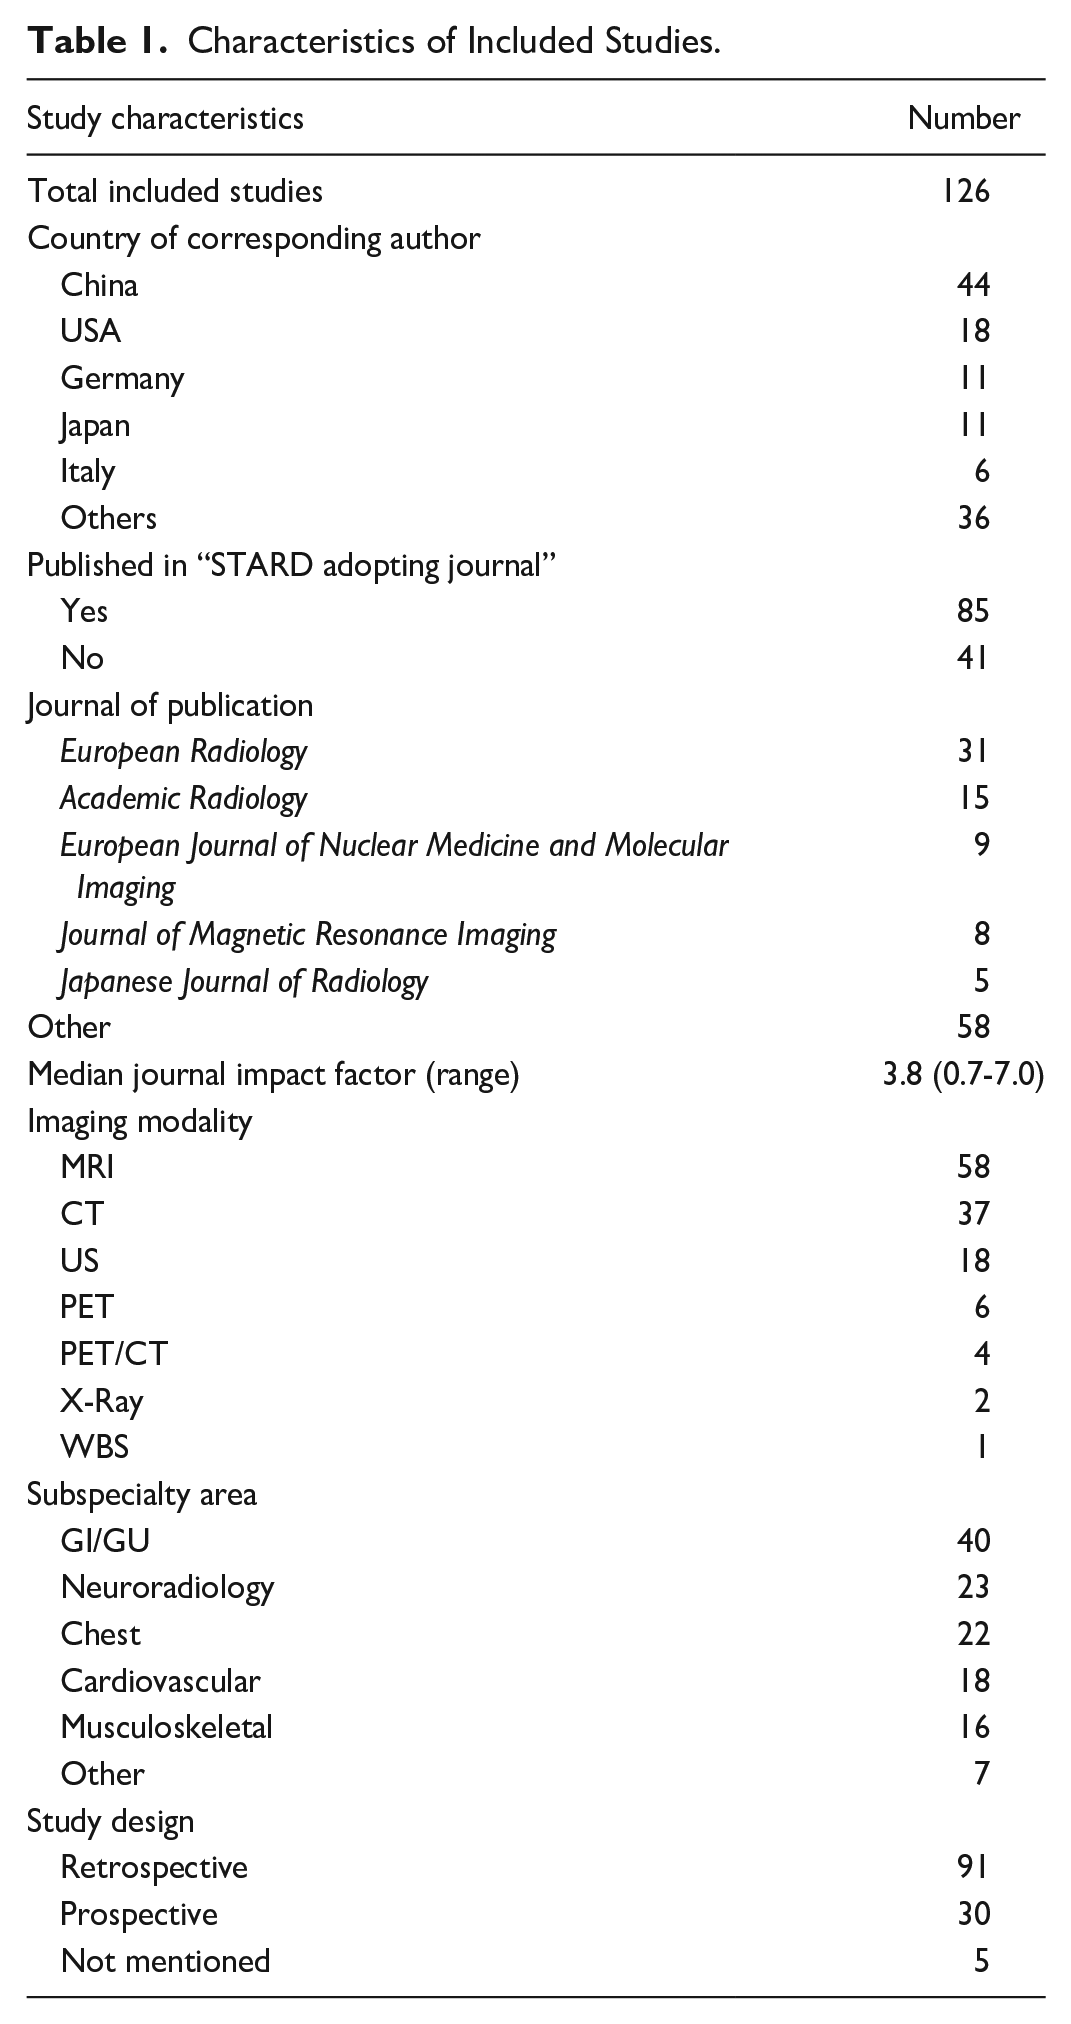
One hundred twenty-six studies were included in the final analysis. The selection process and total number of studies screened can be found in Figure 1. The characteristics of the included studies are outlined in Table 1.
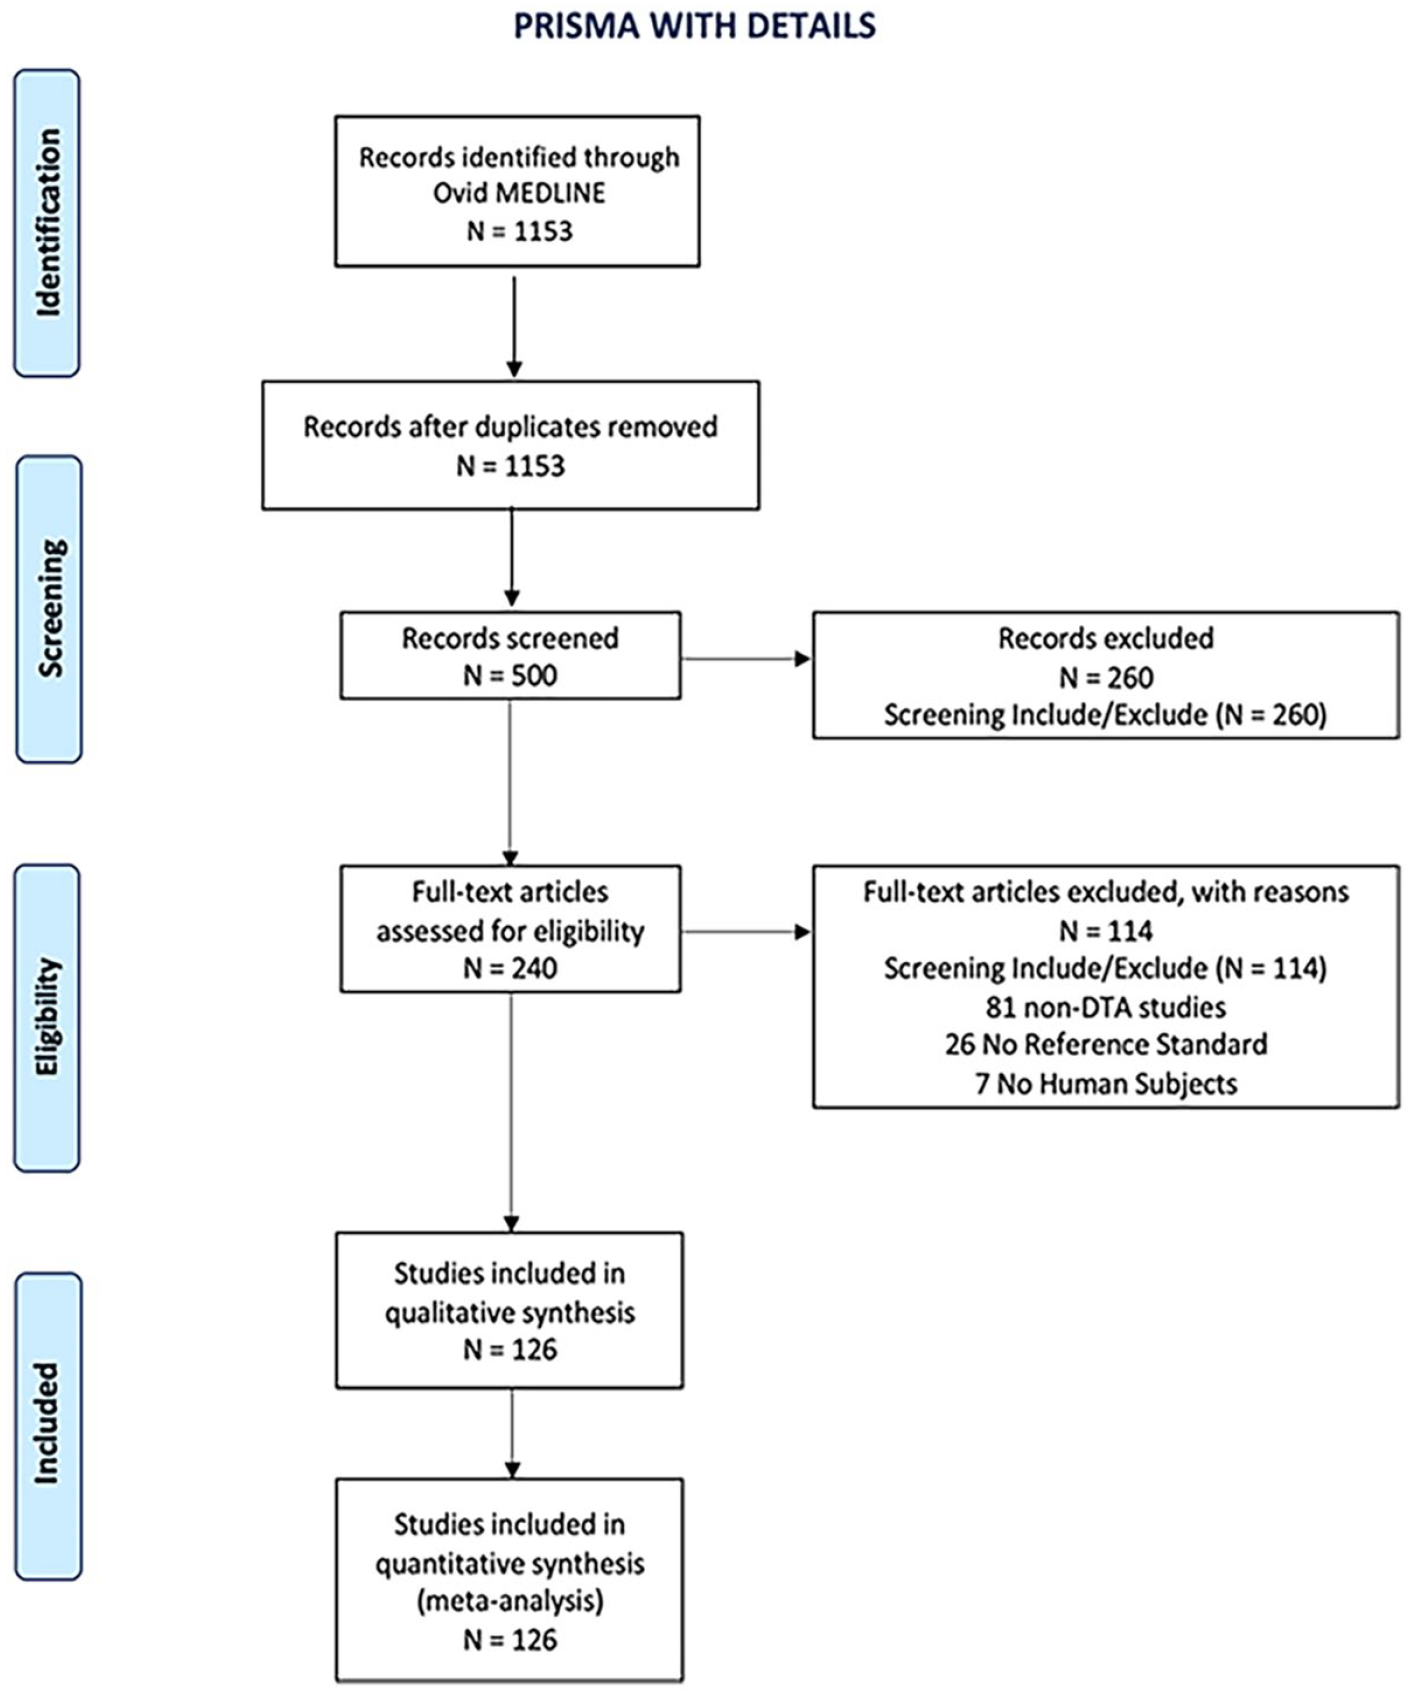
PRISMA flow diagram of included studies.
Characteristics of Included Studies.
STARD 2015 Statement Adherence
Of the 126 included studies, overall adherence to STARD 2015 was 61% (18.3/30 items SD = 2.9), higher than that reported in the baseline study by Hong et al at 55% (16.6/30 items SD = 2.2; P < .0001). STARD item adherence ranged from 12.1 to 26.0 items. The itemized STARD adherence rates can be found in Table 2. The complete list of included studies with overall STARD adherence is provided in Appendix C.
Reporting Frequency of STARD 2015 Items.
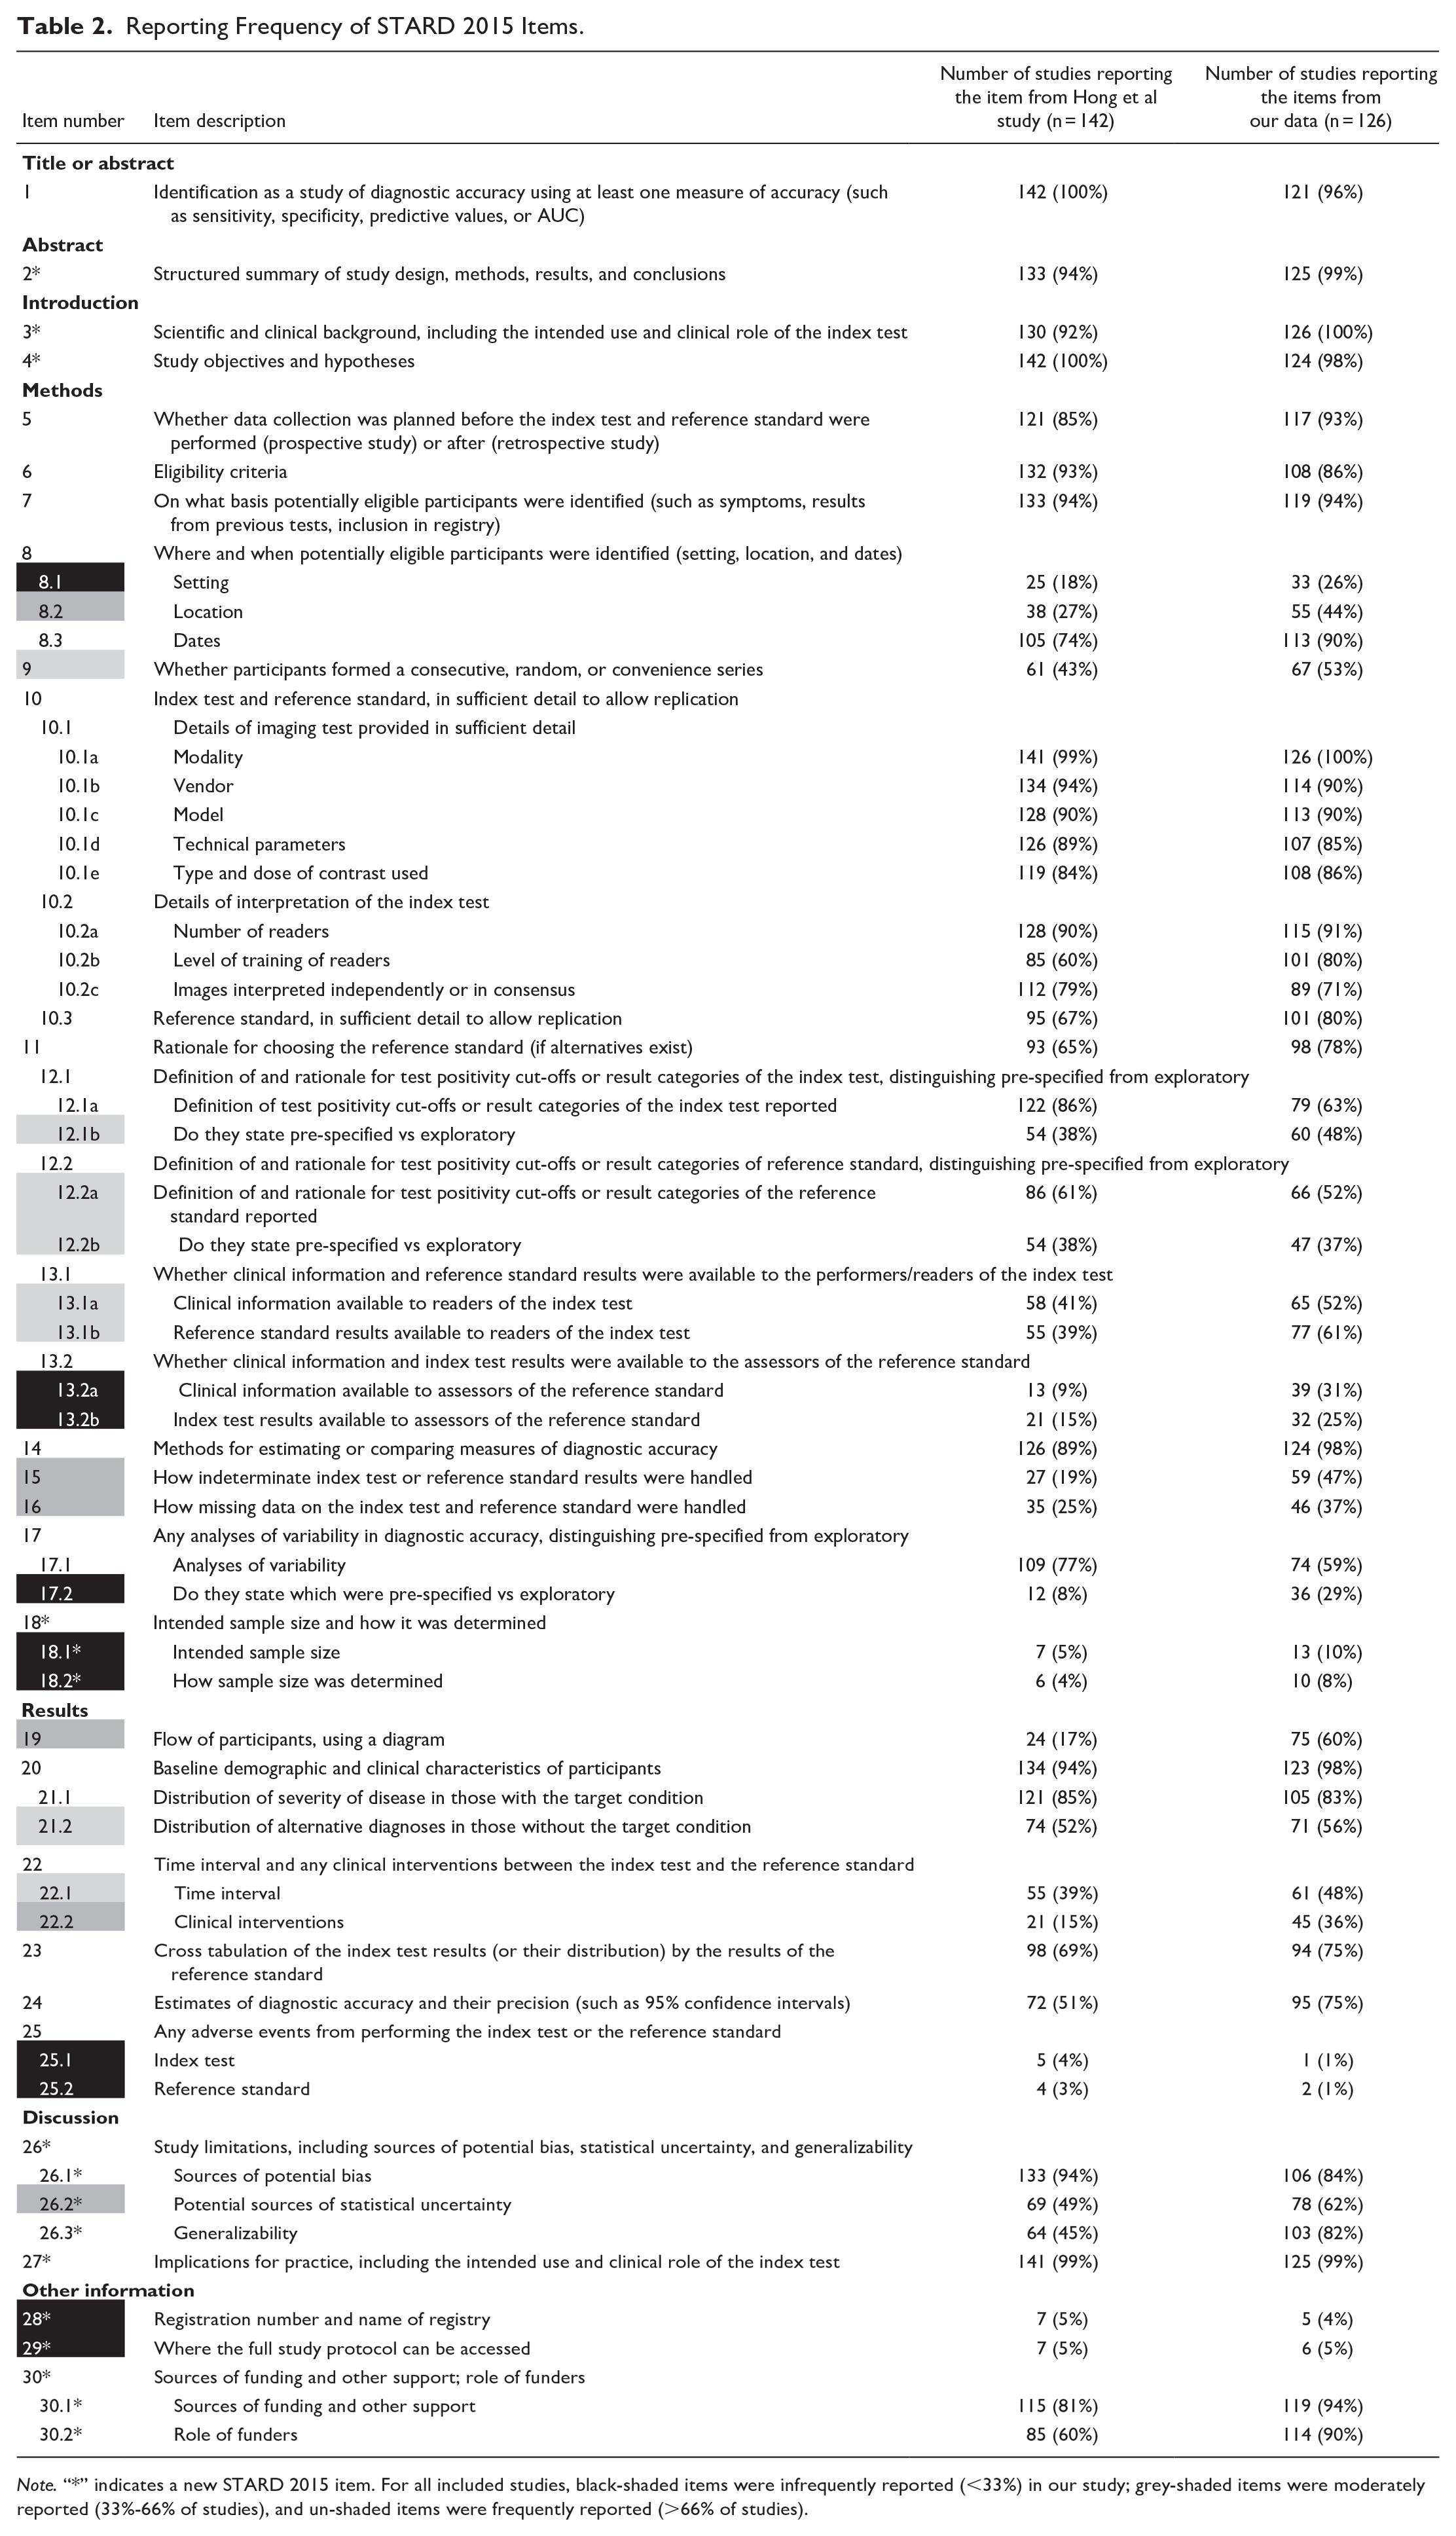
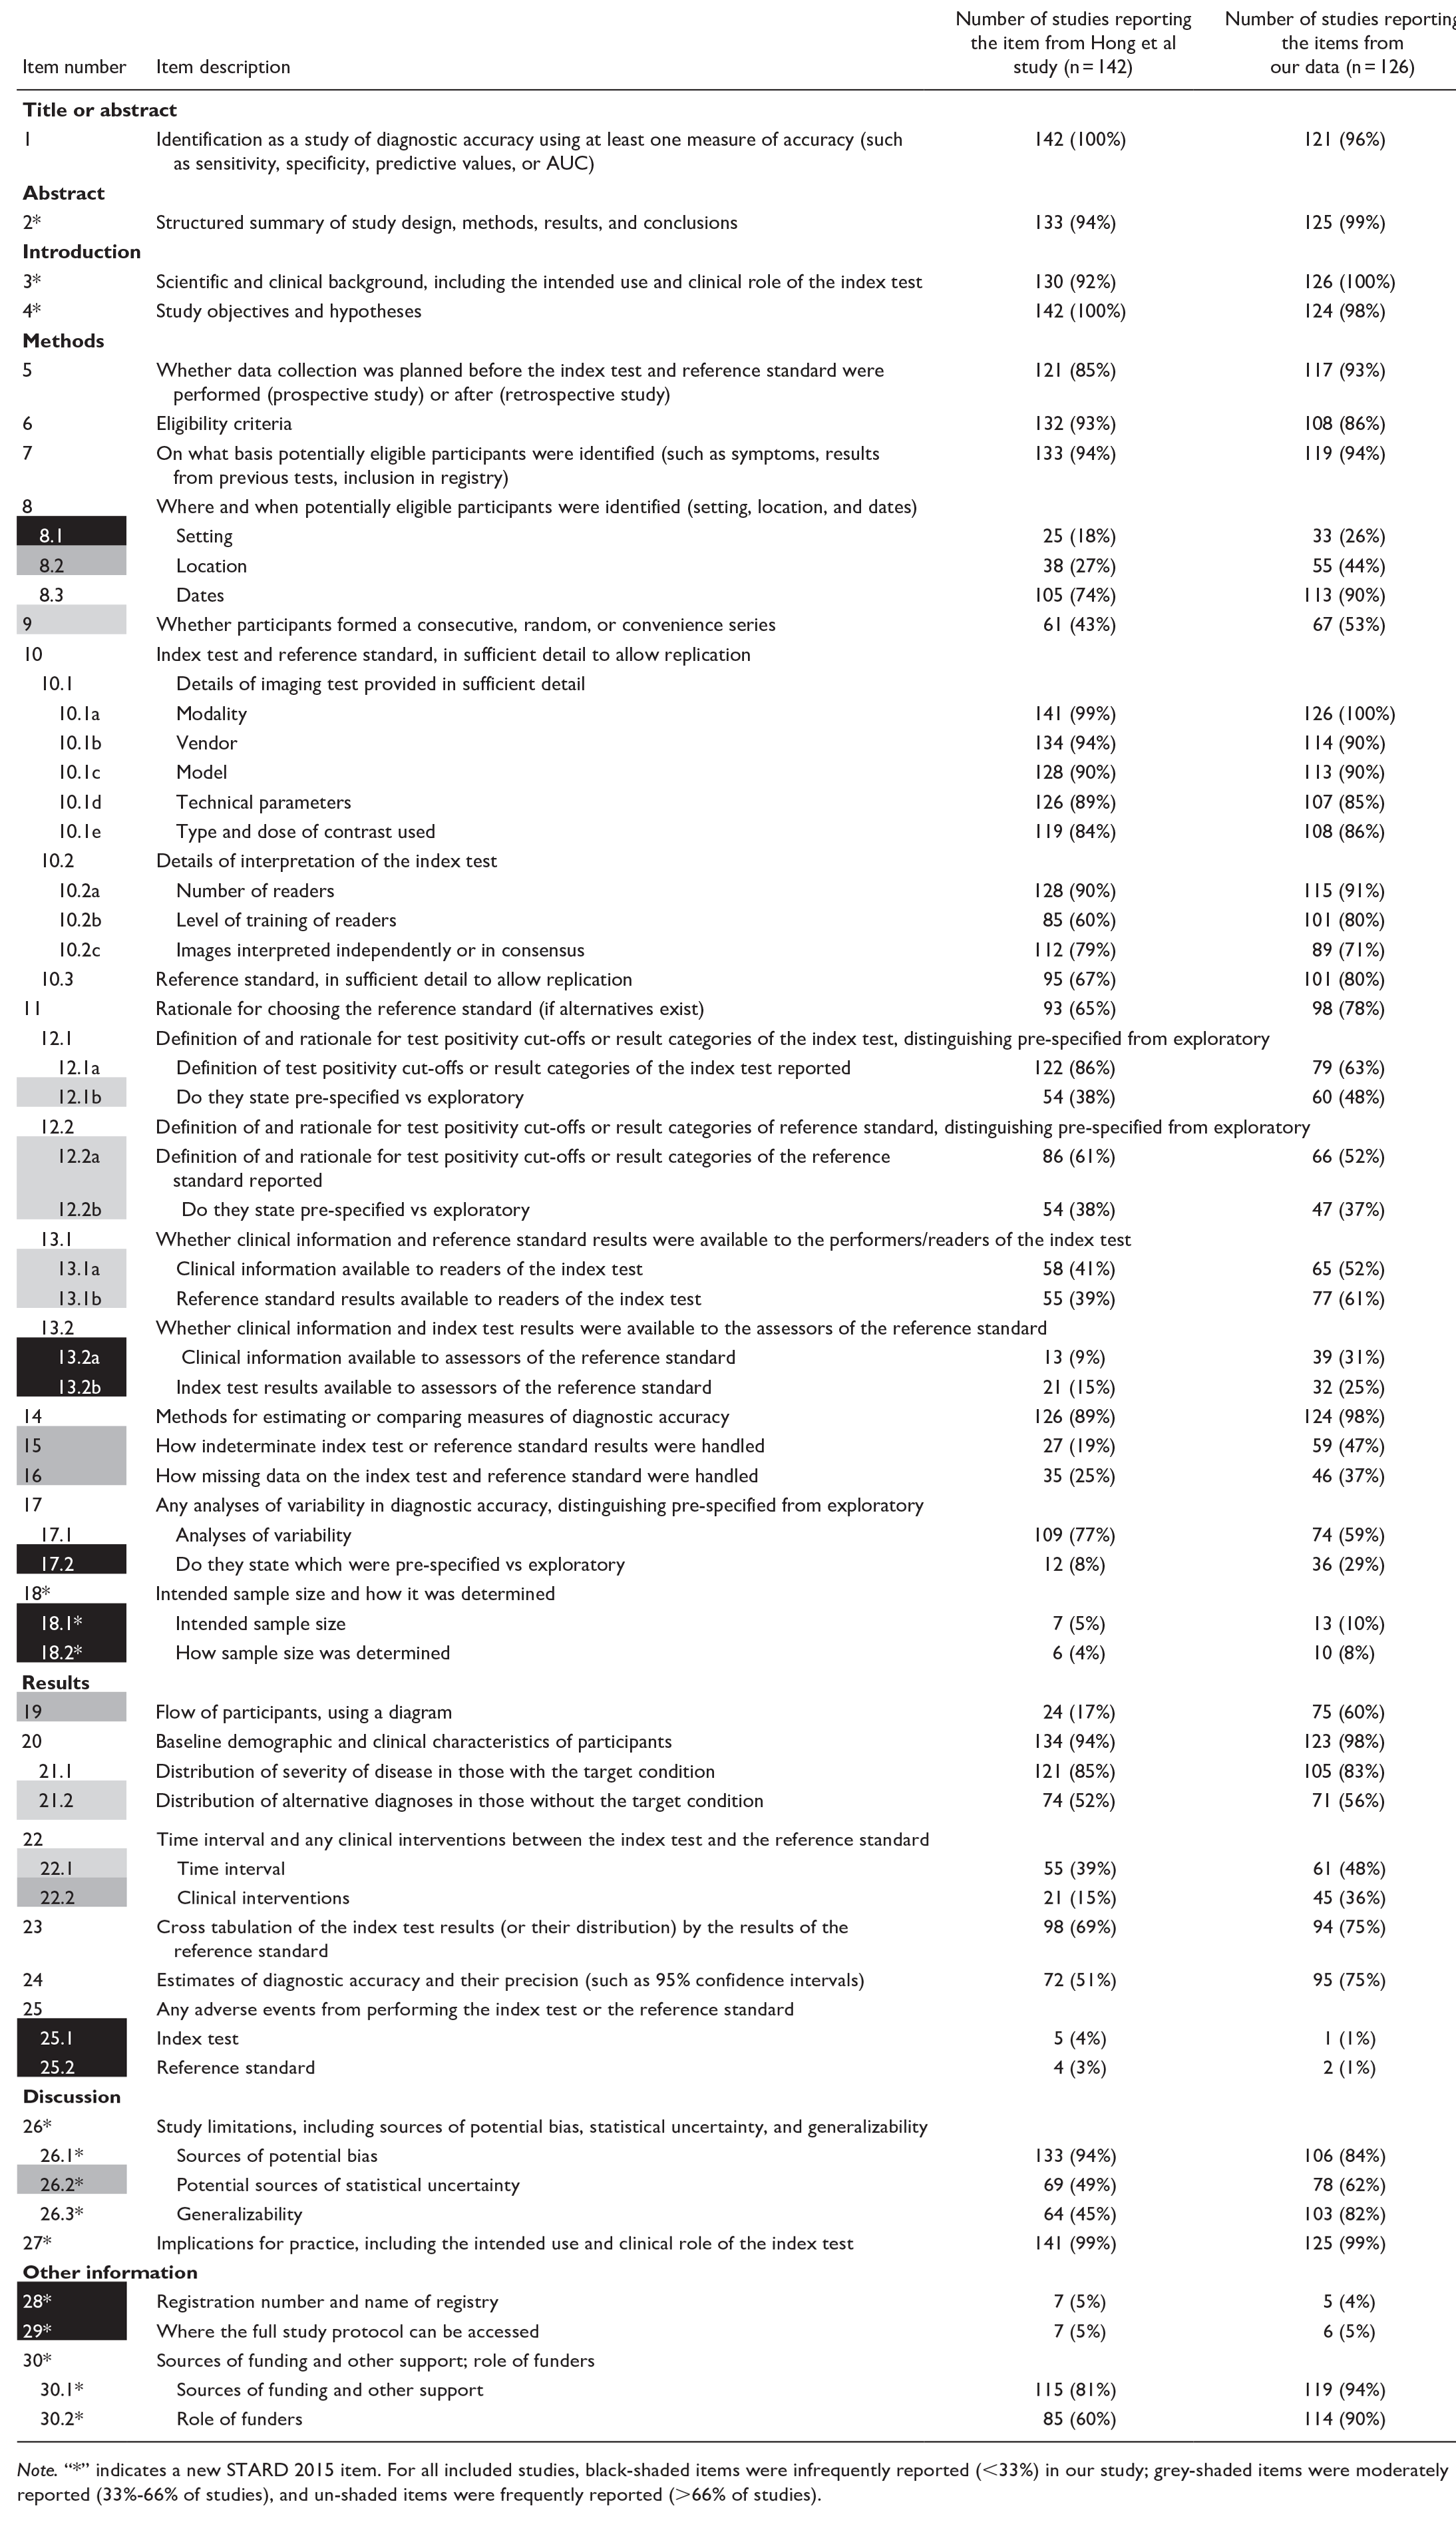
Note. “*” indicates a new STARD 2015 item. For all included studies, black-shaded items were infrequently reported (<33%) in our study; grey-shaded items were moderately reported (33%-66% of studies), and un-shaded items were frequently reported (>66% of studies).
There were 26 frequently reported items or sub-items (reported by >66% of studies), 18 moderately reported (reported by 33%-66% of studies), and 10 infrequently reported (reported by <33% of studies). In comparison, in the baseline by Hong et al, there were 25 frequently reported items or sub-items, 16 moderately reported, and 13 infrequently reported. A visual representation of adherence rates between our study and Hong’s study can be found in Figures 2 to 4.
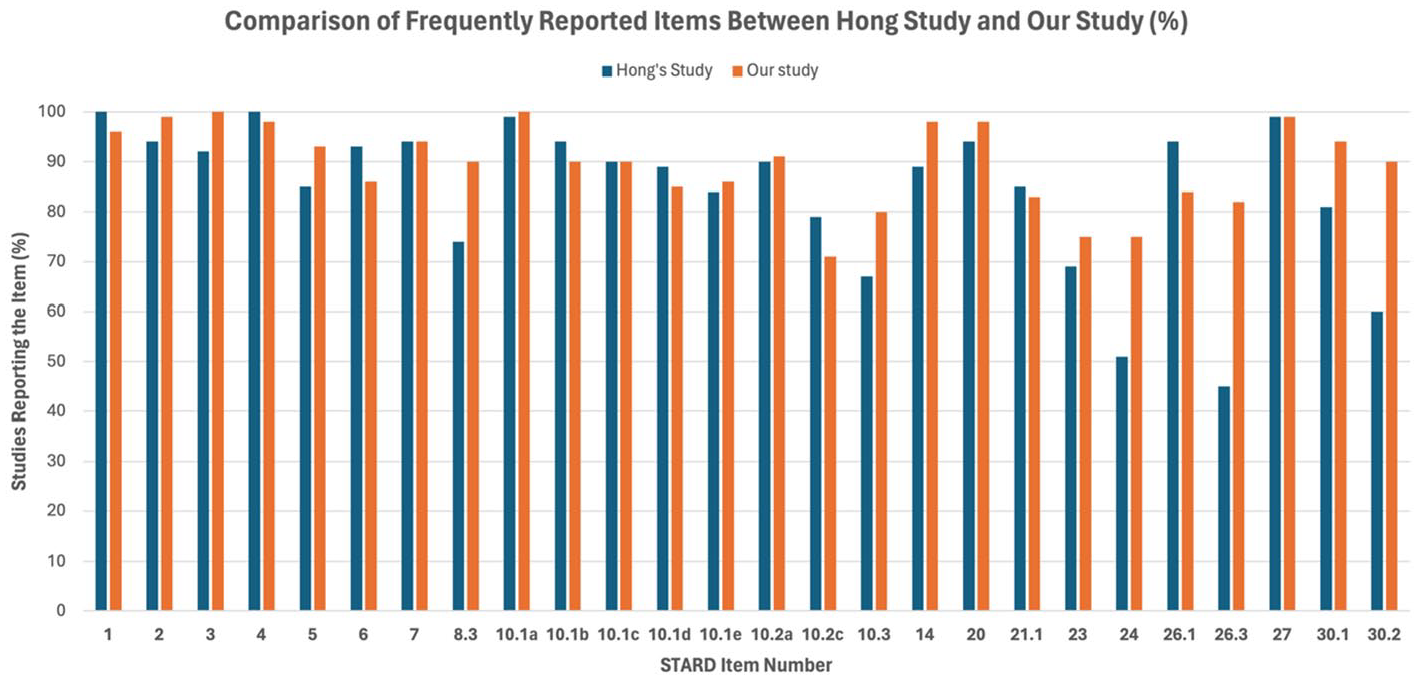
Comparison of frequently reported items between Hong’s study and our study (%). This bar chart shows the percentage of studies reporting specific STARD items that were frequently reported in our study. Percentages are shown on the Y-axis, with each item number listed on the X-axis.
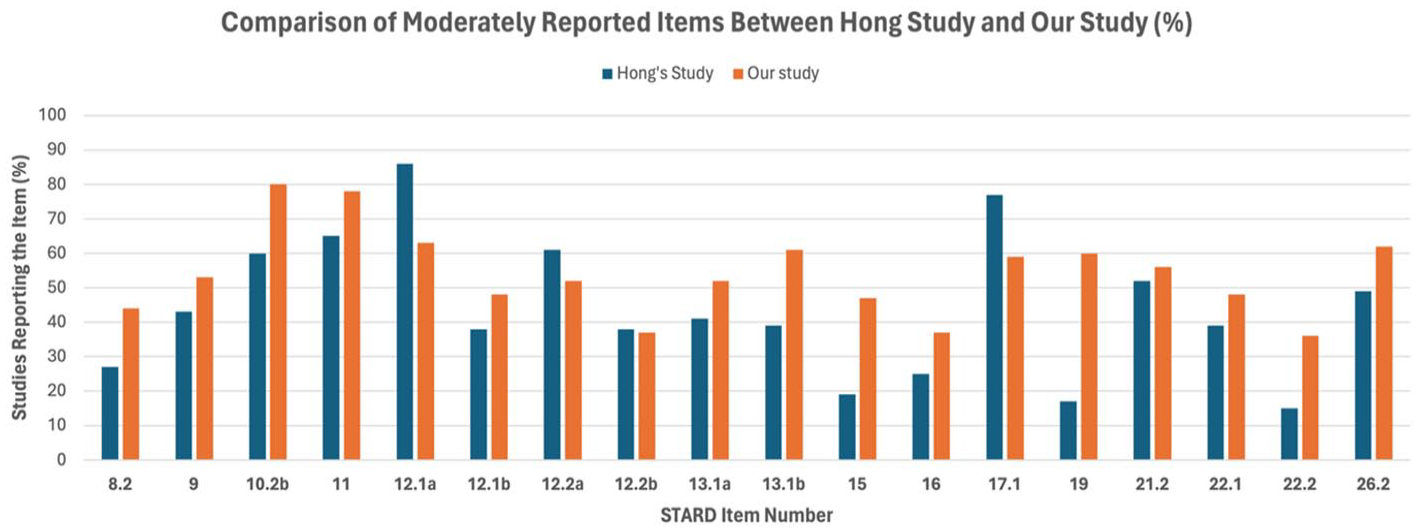
Comparison of moderately reported items between Hong’s Study and our Study (%). This bar chart shows the percentage of studies reporting specific STARD items that were frequently reported in our study. Percentages are shown on the Y-axis, with each item number listed on the X-axis.
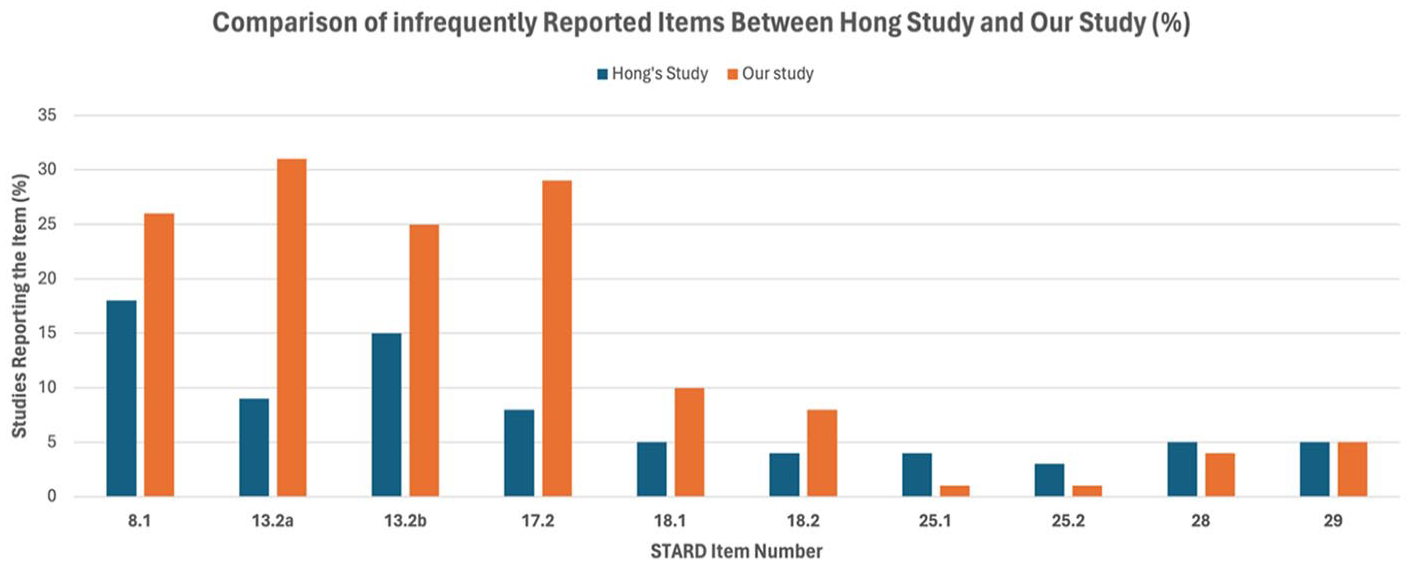
Comparison of infrequently reported items between Hong’s Study and our Study (%). This bar chart shows the percentage of studies reporting specific STARD items that were infrequently reported in our study. Percentages are shown on the Y-axis, with each item number listed on the X-axis.
Notable adherence improvement was observed for item 19 “Flow of participants” (from 17% to 60%), item 10.2b “Level of training of readers” (from 60% to 80%), item 26.3 “Generalizability” (from 45% to 82%), and item 15 “Handling of indeterminate results” (from 19% to 47%). In contrast, notable decline in adherence was observed for item 12.1.a “Definition of test positivity cut-offs or result categories of the index test reported” (from 86% to 63%).
Subgroup Analysis
A summary of the subgroup analyses can be found in Table 3. Studies published in higher impact factor journals (impact factor >3.8) reported more items than lower impact journals: 20.6 versus 18.4 (P < .0001, Appendix I). There was no difference in STARD reporting between retrospective and prospective study designs; however, studies that did not report their study design had significantly lower STARD adherence (P = .002, Appendix F). There was no correlation between journal STARD adoption status and STARD reporting adherence (P = .55, Appendix J). All other sub-group analyses such as imaging modalities, imaging subspecialty, journal, or country of publication showed no significant difference in STARD reporting (Appendix D, E, G, H).
Summary of Subgroup Analyses Performed.
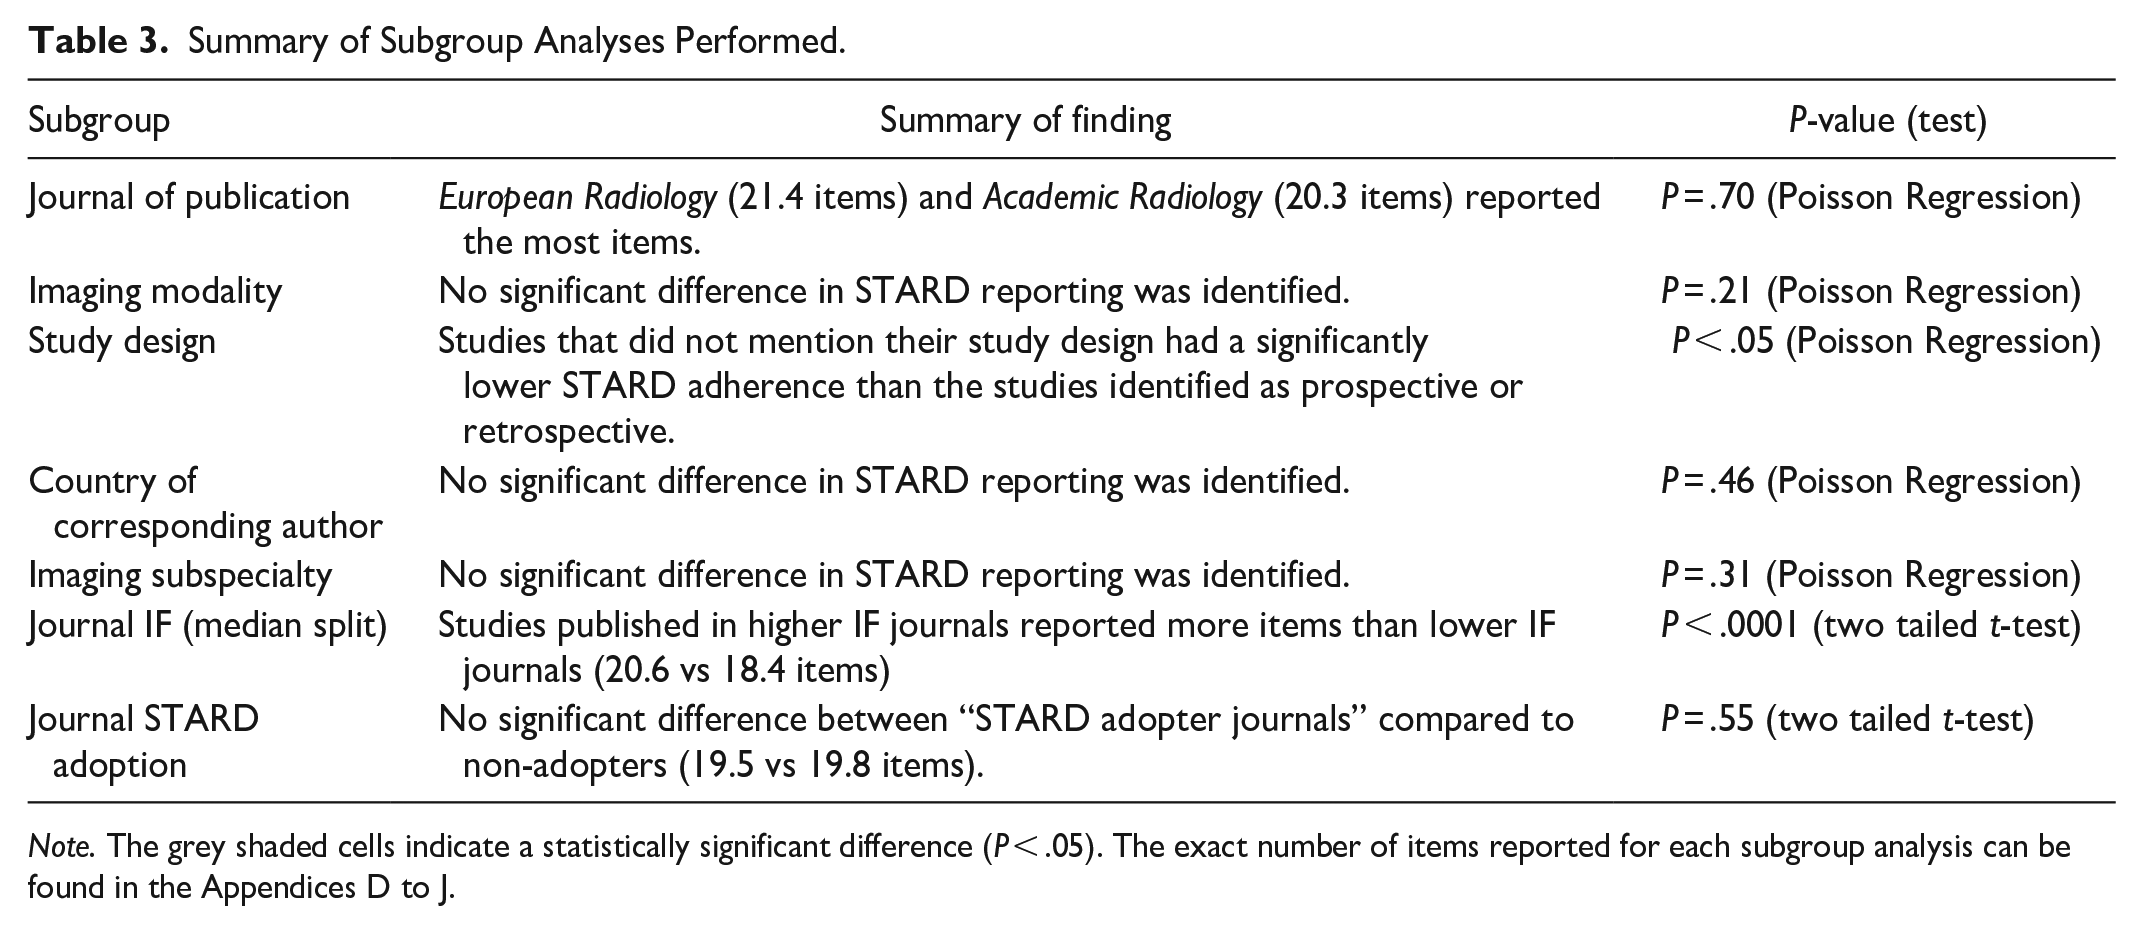
Note. The grey shaded cells indicate a statistically significant difference (P < .05). The exact number of items reported for each subgroup analysis can be found in the Appendices D to J.
Discussion
Recently published diagnostic accuracy studies showed a small improvement in STARD 2015 adherence compared to studies published in 2016 (from 55% to 61%). Similar to the baseline study, studies published in journals with a higher impact factor reported more STARD items than journals with a lower impact factor (20.6 vs 18.4). This indicates a possible relationship between journal resources and their ability to ensure complete reporting. The significant improvements in adherence observed in high-impact journals underscore the importance of journal-level policies and editorial practices in promoting the use of standardized reporting guidelines. Nonetheless, contrary to baseline results, we did not find a significant difference in reporting adherence when stratified by STARD adoption status. This finding is surprising and reveals that journals, under the title of STARD adopters, still do not strictly enforce adherence to guidelines. In addition, mentioning the STARD guidelines under “Instruction to Authors” alone is insufficient. Alternatively, it may help to incorporate active implementation during the editorial and peer review process. In our study, 68% of the articles were published in journals that were STARD adopters. In contrast, in the original study, 14 only 23% of the articles were published in journals that were STARD adopters. Furthermore, the original study 14 revealed that studies published in journals that were considered STARD adopters had a higher level of STARD adherence compared to articles published in non-adopters. This variability in journals’ enforcement of STARD 2015 adherence may be partially addressed by possibly encouraging journals to adopt a more stringent, defined threshold for the minimum number of items that must be reported to allow for publication consideration, as currently, authors may be more inclined to view the checklist as a loose recommendation for how to improve the quality of their study. Furthermore, an ongoing study by Speich et al is looking at the impact of short versions of reporting guidelines for peer reviewers to improve reporting, as the complete checklist might be overwhelming for reviewers to use for the evaluation of every study. 25 Depending on the findings of this study, it may be beneficial to create a shortened STARD item list as a supplement, which could include a smaller list of the most important and infrequently reported STARD items. The shortened list could serve as a simplified rubric for evaluators to provide feedback to authors. Another study conducted by Blanco et al revealed that involving a reporting guideline expert on the editorial board had a significant impact on the completeness of reporting. 26 Such an intervention was performed in the British Medical Jounal (BMJ), where a number of editorial board members have expertise in reporting guidelines, such as Dr. Duan and Dr. Dwan. 26 This may be a preferred approach, although more resource-intensive, compared to mentioning reporting guidelines under the “instruction to authors” section on journal websites alone.
Our study had some limitations. Many items in the STARD checklist are open to subjective interpretation. We tried to mitigate this issue by conducting every step in duplicate. In addition, we conducted pilot assessments to ensure reviewers adequately understood the STARD checklist items. After the pilot studies were completed, the reviewers met and discussed their conflicts to ensure a consistent method of evaluation. Our methods aimed to acquire a random sample of journals from a comprehensive list of 136 imaging journals. As a result of this randomization, some high impact factor journals were not captured in this study, such as Radiology and the Canadian Association of Radiologist Journal. Other journals, such as. European Radiology and Academic Radiology could be considered over-represented. However, our sub-analysis reveals that STARD adherence did not differ based on the journal of publication (P = .70, Poisson Regression).
In terms of study strengths, the present study included a variety of journals, modalities, subspecialties, and countries in the analysis to ensure a representative sample of the available literature. In addition, the study methods was followed stringently, to allow for an accurate evaluation for any changes in adherence.
The small change in the completeness of reporting of STARD items over 9 years indicates that the current knowledge translation strategies employed are insufficient, which is similarly seen for other types of studies, such as randomized trials (CONSORT guideline) and systematic reviews (PRISMA guideline), for which evaluations have also shown improvements over time but still substandard reporting for a considerable number of studies/journals. New methods should be evaluated in experimental studies to determine how completeness of reporting might be improved to improve the quality of research published in the domain of diagnostic accuracy studies. In addition, there is a need for more interventional studies on knowledge translation strategies.
Footnotes
Appendices
Subgroup Analysis of STARD Adoption by Journal.
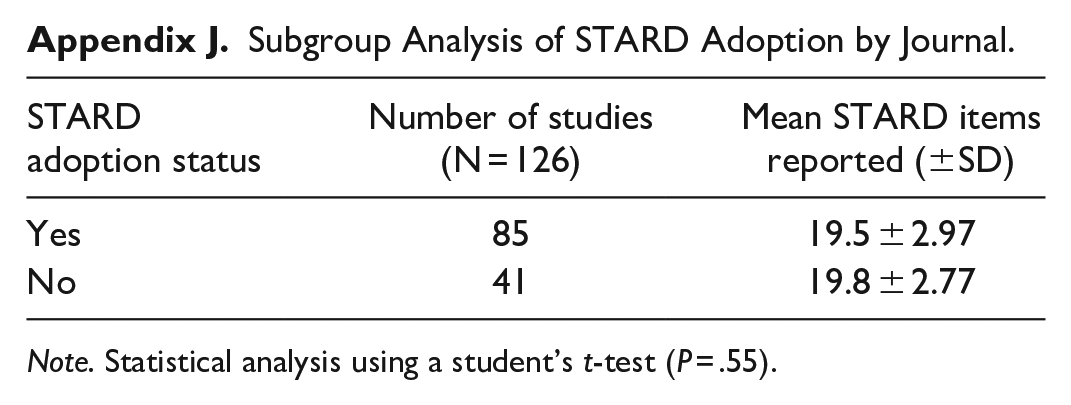
| STARD adoption status | Number of studies (N = 126) | Mean STARD items reported (±SD) |
|---|---|---|
| Yes | 85 | 19.5 ± 2.97 |
| No | 41 | 19.8 ± 2.77 |
Note. Statistical analysis using a student’s t-test (P = .55).
Data Sharing
Relevant data and code will be posted on our research group’s Open Science Framework Page.
Declaration of Conflicting Interests
The author(s) declared no potential conflicts of interest with respect to the research, authorship, and/or publication of this article.
Funding
The author(s) disclosed receipt of the following financial support for the research, authorship, and/or publication of this article: Dr. McInnes is supported by the University of Ottawa Department of Radiology Research Stipend Program. The project is also supported by the University of Ottawa Medical Student Summer Research Program.