
Abstract
Introduction
Community-acquired pneumonia (CAP) is a significant cause of morbidity in the emergency department (ED), with an incidence of 50.1 episodes per 1000 person-years in Canada. 1 Effective decisions regarding patient admission or discharge are critical to optimizing clinical outcomes and managing ED resources. 2
Artificial intelligence (AI) tools, particularly those for chest X-ray (CXR) interpretation, have shown potential to improve diagnostic accuracy and reduce reading times by up to 31% which has potential in streamlining clinical workflows.3,4 However, while these tools have demonstrated their ability to detect pathology, there is limited evidence supporting their use for improving health system measures such as decreasing time to discharge or diagnosis. This is especially relevant in ED populations like CAP patients, where admission and discharge decisions are time-sensitive and can impact both patient care and resource allocation.5-8
A commercial tool for prediction of admission or discharge in patients with pneumonia was previously developed by a third-party (under review), which our site sought to evaluate in order to inform deployment. Prior studies with other tools have evaluated AI’s role in predicting outcomes for ED patients, such as ICU admission or mortality in CAP or COVID-19 patients.9-11 All of these studies were internal retrospective validations, which tend to overestimate AI model performance, as they do not account for the variability in data quality and the diversity of patient populations encountered in real-world clinical settings. To bridge this gap, external validations are necessary to provide a more accurate assessment of an AI tool’s clinical effectiveness in predicting outcomes. To our knowledge, no prospective external validations have assessed AI tools for predicting admission outcomes in CAP patients within the ED.
The primary goal of this study was to evaluate whether the third-party AI tool designed to predict patient disposition in CAP cases could be safely and effectively deployed in our clinical setting. To achieve this, we conducted both retrospective and prospective evaluations, focusing on optimizing the model for real-world use by adjusting threshold values and evaluating performance across different subgroups.
Ensuring the tool’s safety involves determining its ability to support clinical decision-making without leading to inappropriate admissions or discharges that could compromise patient outcomes. Equally important is the tool’s effectiveness, which pertains to its capacity to provide accurate predictions that streamline clinical workflows, alleviate ED congestion, and enhance resource utilization.
Although regulatory clearance allows for marketing of AI products, it does not ensure that tools will generalize effectively across diverse patient populations. A recent systematic review found that 81% of 86 deep learning algorithms experienced performance declines in real-world settings, underscoring the importance of prospective validation. 12 This highlights the importance of prospective validation, as recommended by the 2024 multi-society statement from RSNA, ACR, CAR, and ESR. 13
To optimize the AI tool for deployment, we also performed subgroup analyses to identify potential biases and ensure equitable outcomes across different patient populations. This approach, as emphasized by Liu et al’s Medical Algorithmic Audit, is critical for ensuring that AI tools perform fairly and equitably across demographic and clinical subgroups. 14 By conducting this prospective evaluation on local data, our goal was to determine whether to deploy the model and how to optimize it for real-world use.
Materials and Methods
Study Design
This study involved retrospective and prospective external validation of an AI model predicting admission for CAP patients in the ED across 2 sites within a single hospital system. First, we conducted a retrospective external validation to establish baseline metrics. Following this, we performed a prospective cohort study with a shadow deployment of the AI model. Both validations received approval from the Research Ethics Board of Trillium Health Partners.
Model Architecture
This external model was a deep neural network based on a standard 2D CNN InceptionNet architecture developed by a collaboration of external researchers and a Canadian company (under review). The model was pre-trained with ImageNet weights and fine-tuned on an external dataset of 14 103 CXRs pre-processed to be 512 × 512 pixels from a large Canadian Academic Hospital. Details regarding the training datasets were treated as proprietary and were not disclosed. The model produces a continuous score between 0 (no admission) and 1 (admission). Threshold for classification was set by the vendor.
Study Cohorts
Both the retrospective and prospective cohorts were selected using the same predefined criteria for “suspected CAP,” with the only difference being the study period. The prospective cohort included a subset of all adults (n = 3062) presenting to the ED from January 1st to 31st, 2023, who met pre-defined criteria for “suspected CAP” and obtained a CXR at 2 community hospital sites in Canada, Credit Valley Hospital and Mississauga Hospital. The retrospective cohort included all adults (n = 17 689) from November 1st, 2020 to June 30th 2021.
Patients were suspected to have CAP (“suspected CAP”) if they presented with any chief complaint (including fever, cough, shortness of breath, or chest pain), as comprehensively outlined in Appendix A. The chief complaints were selected through expert review to ensure that even remotely related presentations were included, accounting for variations in how ED physicians document initial clinical indications. This broad approach aimed to capture all potential CAP cases, acknowledging that the diagnosis is not known at the time of presentation. Appendix B outlines the patient inclusion process in the prospective cohort in January 2023.
Shadow Deployment and Model Evaluation
Any CXR studies containing either AP or PA views from the ED were de-identified and forwarded in real-time to the prospective study pipeline at Trillium Health Partners. Data from the electronic health record (ie, admission status) were extracted at the end of the prospective shadow deployment period to provide ground truth labels.
Descriptive characteristics of both cohorts were calculated. The model’s calibration was assessed using a calibration curve, which compares the predicted probabilities generated by the model to the actual observed outcomes, providing insight into how well the predicted risk aligns with real-world results. Standard binary classification evaluation metrics were calculated, including sensitivity, specificity, positive predictive value, negative predictive value, F1 score, and accuracy. To determine these metrics, the model output was binarized using the vendor’s specified threshold for each X-ray view (AP = 0.89, PA = 0.45) to establish the final outcome. P-values were calculated for sensitivity and specificity values for all subgroups.
Subgroup Analysis
Subgroup analyses were performed on multiple subgroups. Demographic subgroups included age, with younger defined as less than 31 years of age and older defined as greater than 86 years of age (lowest and highest 10th percentiles, respectively), sex, and combinations of both age and sex. Analysis by CXR projection (PA or AP), and X-ray modality type (portable scanner or a standard fixed room) was also performed.
Results
Baseline Patient Demographics
Overall, a total of 3062 ED visits of patients with “suspected CAP” over 30 days were included in the prospective validation cohort (Table 1). The cohort had a median age of 67 and 43% of patients received AP orientation CXR and 57% received PA CXRs. There was an equal proportion of males to females (1.01:1). Of all presenting patients, 46% were admitted in the prospective cohort, a high pretest probability reflecting the “suspected CAP” cohort definition.
Baseline Demographics in Prospective and Retrospective Validation Cohorts.
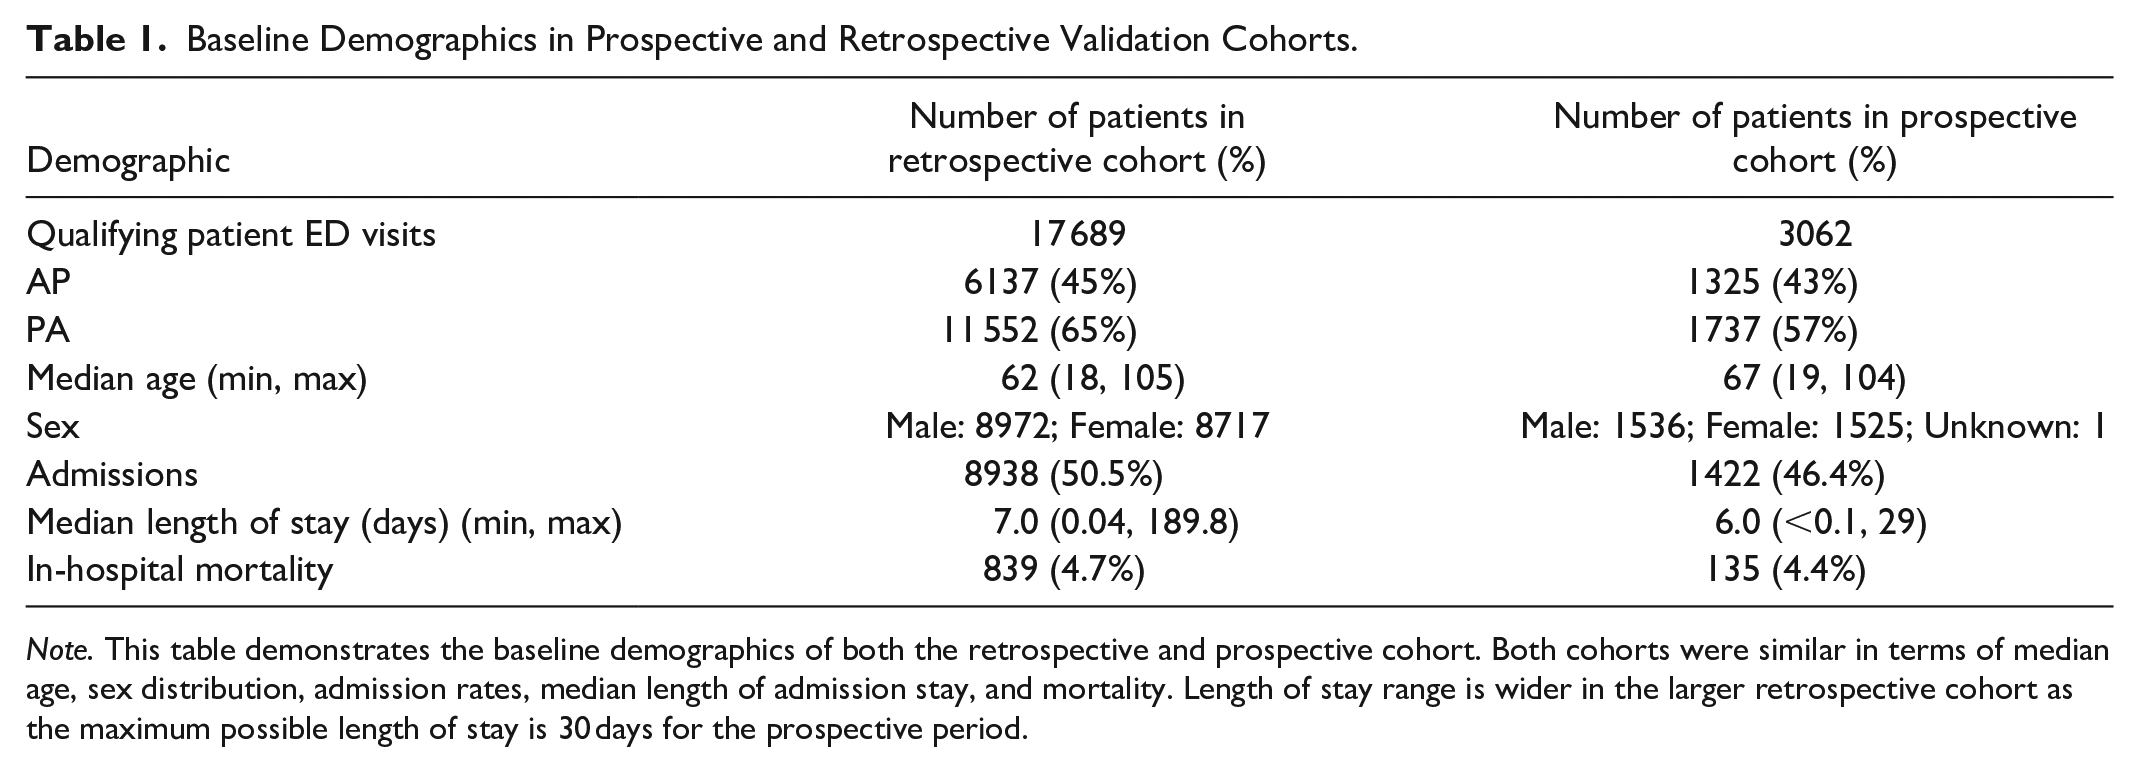
Note. This table demonstrates the baseline demographics of both the retrospective and prospective cohort. Both cohorts were similar in terms of median age, sex distribution, admission rates, median length of admission stay, and mortality. Length of stay range is wider in the larger retrospective cohort as the maximum possible length of stay is 30 days for the prospective period.
In the retrospective cohort, 17 689 ED visits over 242 days were included (Table 1). It is worth noting that in this cohort, 2665 (15.1%) were concurrently COVID positive (2 waves December 2020, and April 2021). 15 The cohort had a median age of 62 and 45% of patients received AP orientation CXR and 65% received PA CXRs. There was an equal proportion of males to females (1.03:1). Of all presenting patients, similar to the prospective cohort, 51% were admitted to hospital in the retrospective cohort.
Prospective and Retrospective Model Validations and Receiver Operator Curves
In the prospective validation, the model demonstrated a moderate AUC of 67% with a moderate sensitivity, specificity, PPV, and NPV of 65%, 68%, 64%, and 70%, respectively (Figures 1 and 2). The overall false negative rate and false positive rate were 35% and 32% in the prospective cohort, respectively. The retrospective cohort consisted of 17 689 ED visits with a similar model AUC of 67%, and a lower sensitivity (59%), higher specificity (74%), and similar PPV (64%) and NPV (70%; Figures 1 and 2). Figure 3A and B demonstrate the confusion matrices for each cohort.
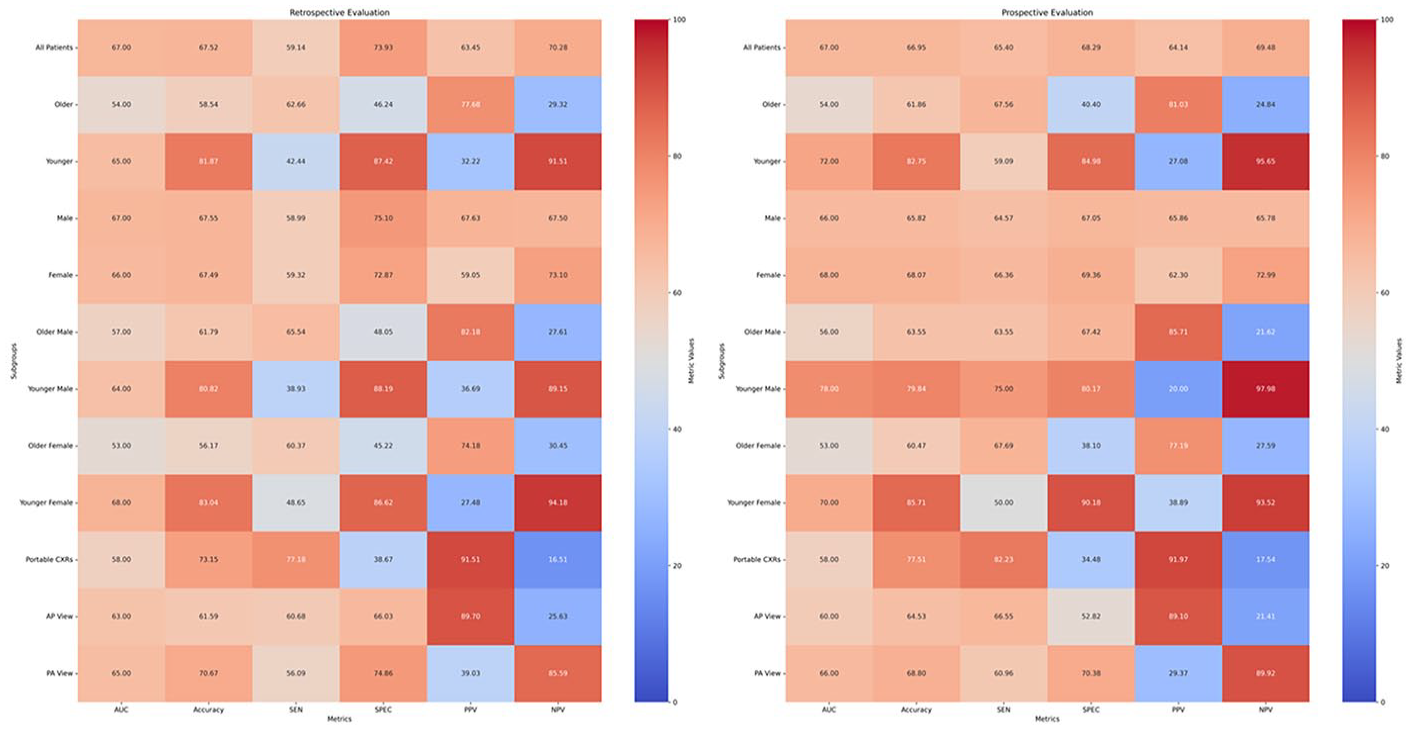
Heatmap comparison of retrospective and prospective evaluations across metrics and subgroups.
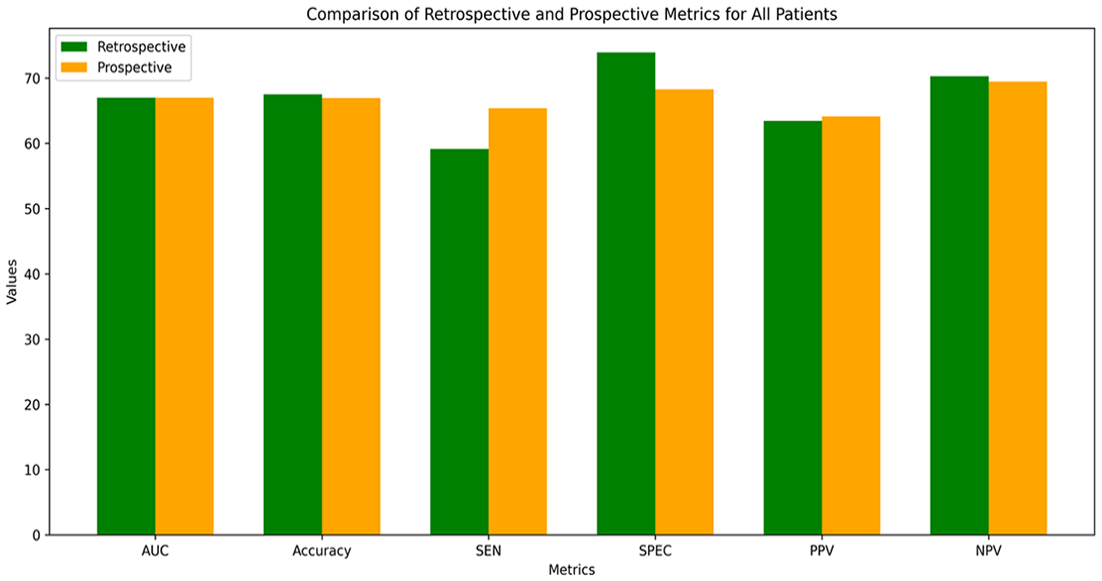
Comparison of model performance in retrospective and prospective validations.
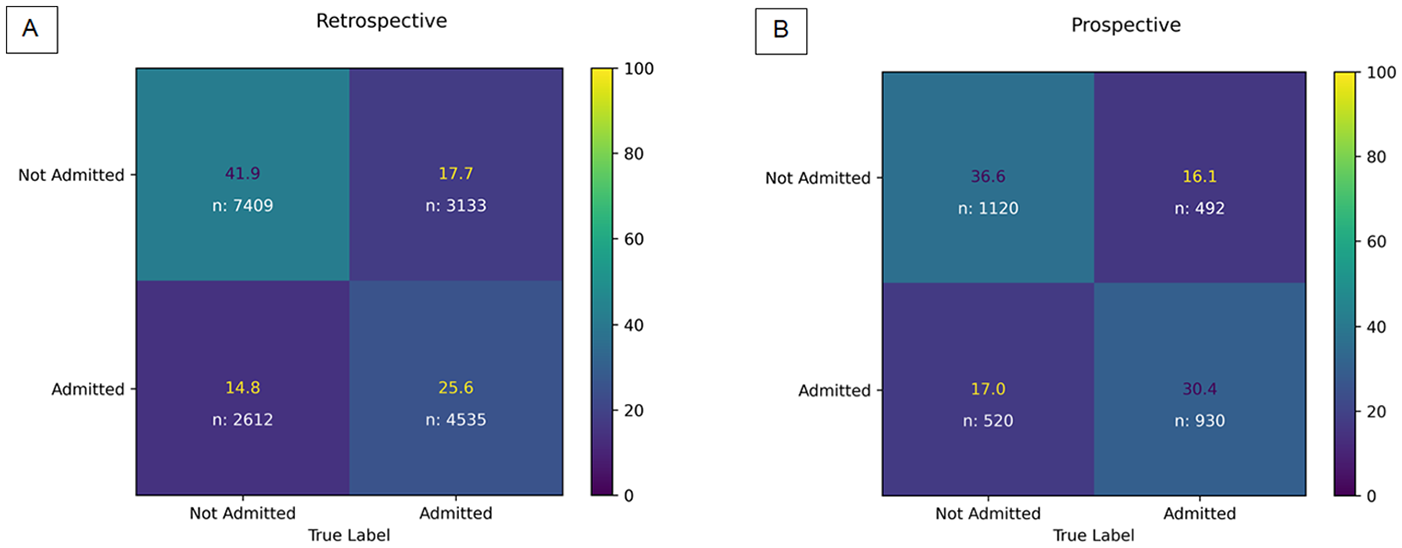
Comparison of normalized retrospective and prospective confusion matrices.
Calibration Curves
The calibration curve demonstrates that the model consistently underpredicts the risk of admission, particularly in the 0.3–0.7 probability range (Figure 4). The Brier score quantifies the accuracy of probabilistic predictions on a 0 to 1 scale, where 0 indicates perfect accuracy and higher values reflect greater deviations from actual outcomes. The Brier scores of 0.18 (retrospective) and 0.17 (prospective) suggest good skill.
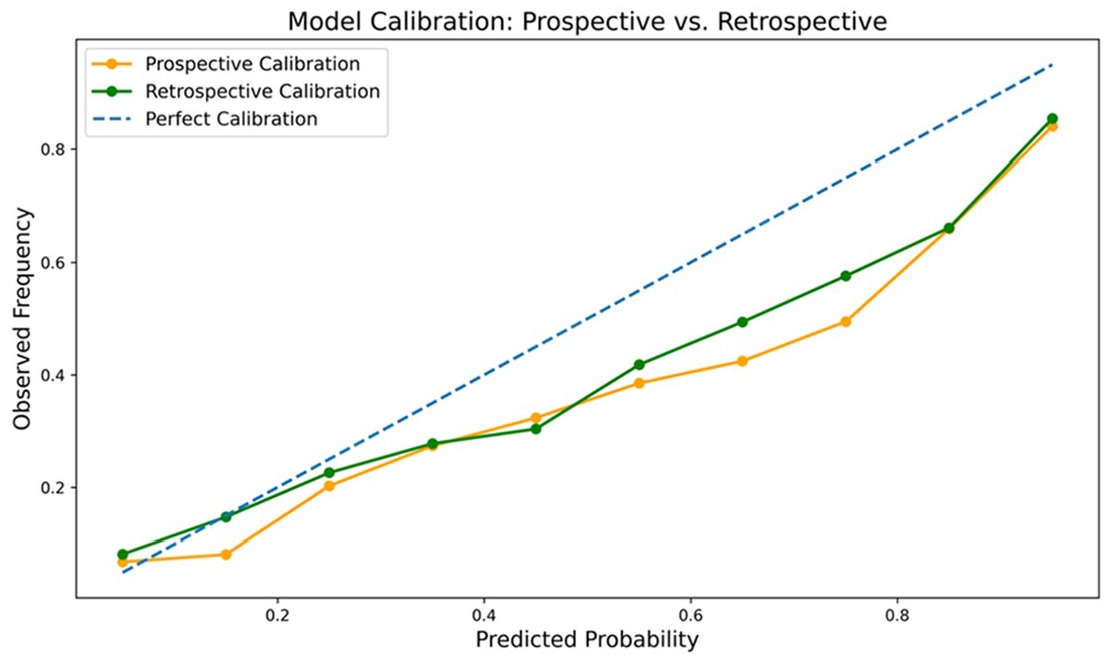
Comparison of retrospective (green) and prospective (orange) calibration curves.
Subgroup Performance
In the prospective cohort, the model demonstrated significantly lower specificity on older patients (>86 years) compared to younger patients (<31 years): 40% versus 85%, respectively (P < .001). Conversely, the model exhibited a significantly lower sensitivity in the younger cohort compared to the older cohort: 59% versus 68%, respectively (P < .05; Figure 5). Similarly, the positive predictive value (PPV) was significantly higher in older patients compared to younger patients (81% vs 27%, respectively). The negative predictive value (NPV) was significantly higher in younger patients compared to older patients: 96% versus 25%, respectively.
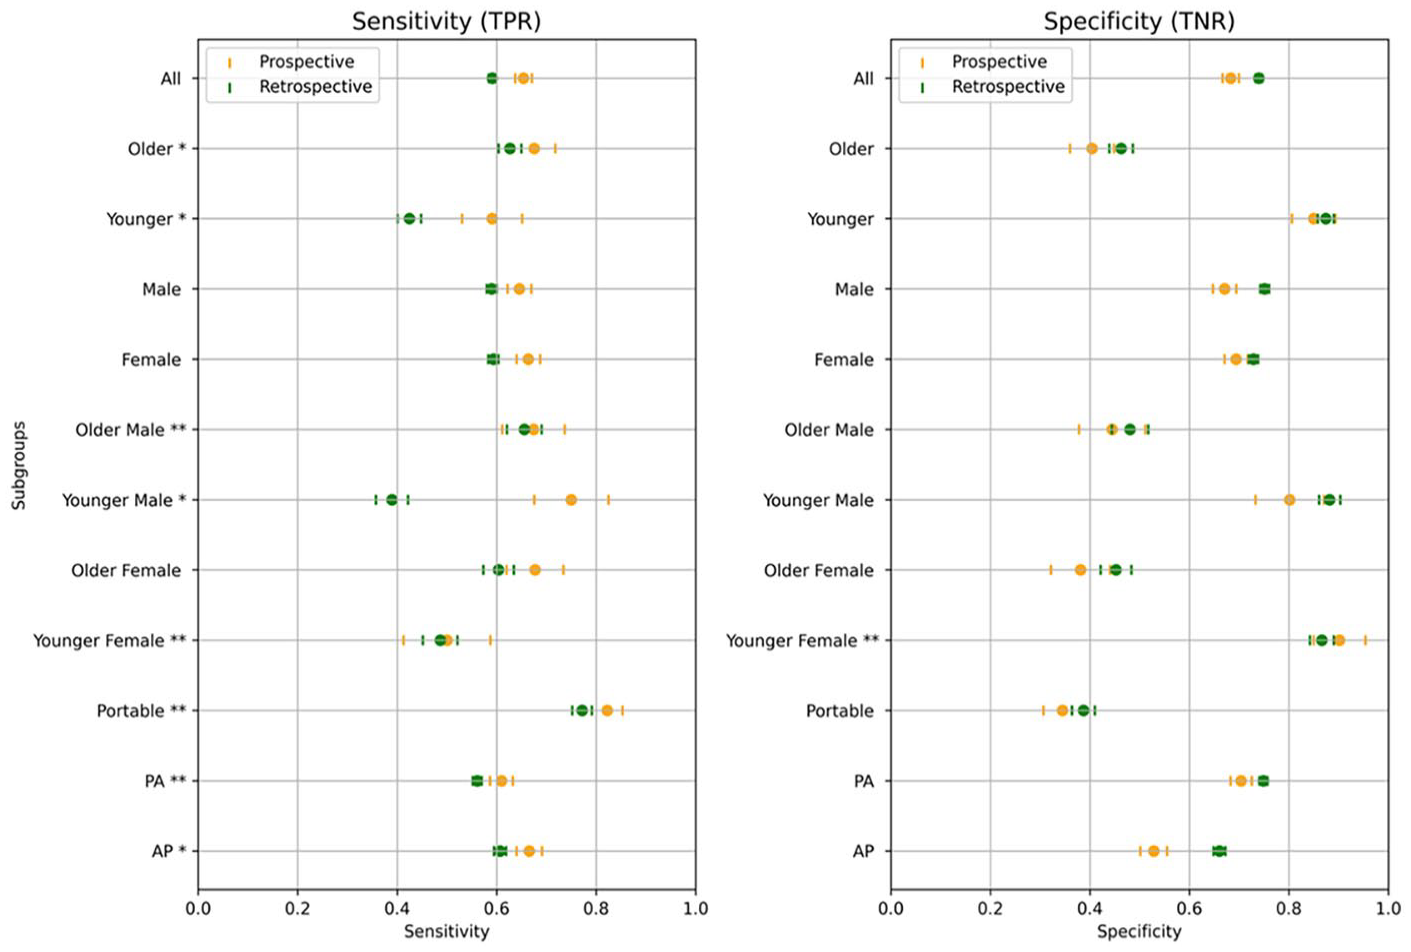
Sensitivity and specificity across demographic subgroups in retrospective and prospective cohorts.
Younger females had a significantly lower sensitivity compared to younger males (50% vs 75%, P < .001). Furthermore, the model had a higher false negative rate with younger females compared to the overall and younger male cohorts (50% vs 35% and 25%, Table 2). Conversely, older females had a lower specificity compared to older males (38% vs 67%, P < .001) and a higher false positive rate compared to the overall and older male cohorts (62% vs 32% and 56%, Table 2). Subgroup performance trends were similar in the retrospective evaluation (Figure 1).
False Negative and Positive Rates (FNR/FPR) in Prospective Cohort Subgroups.
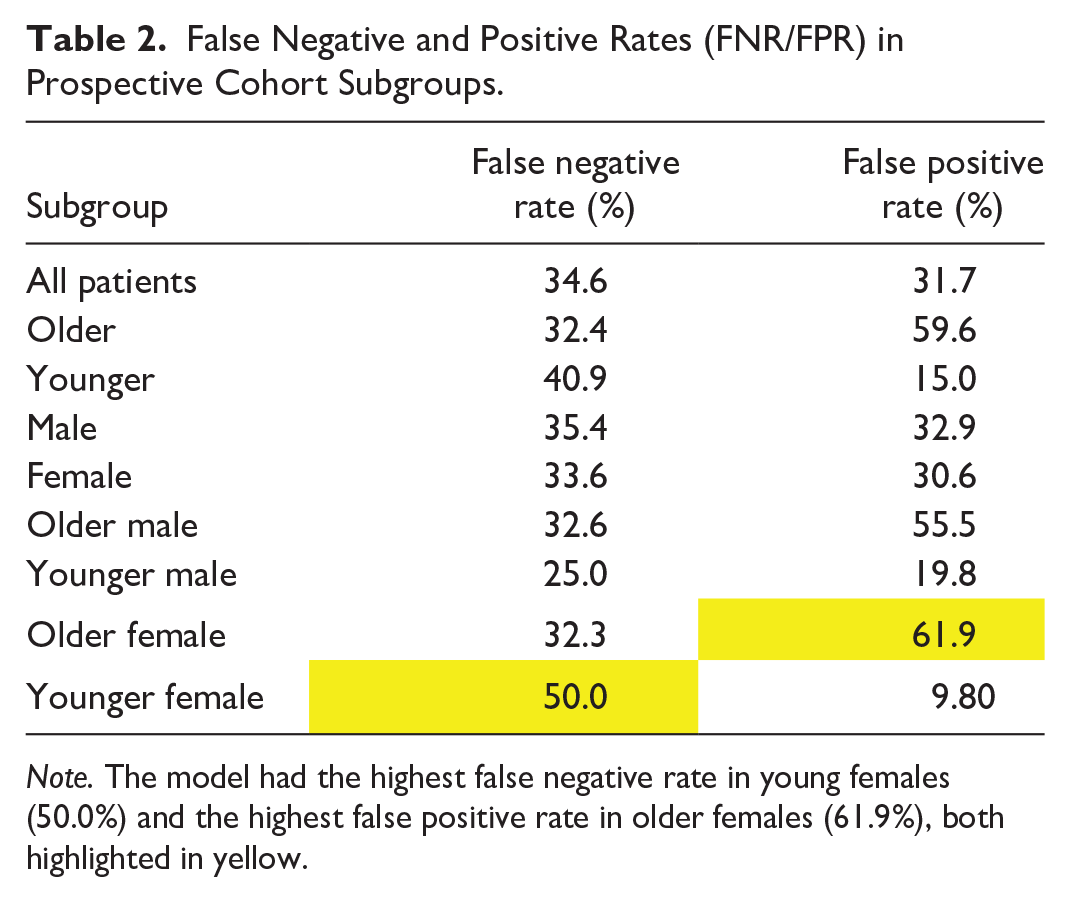
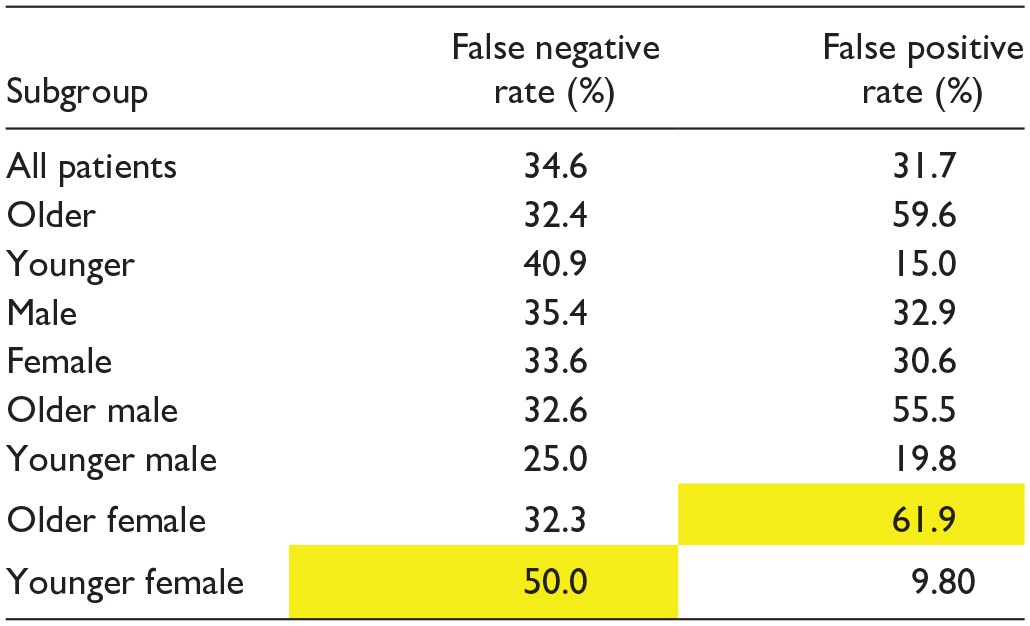
Note. The model had the highest false negative rate in young females (50.0%) and the highest false positive rate in older females (61.9%), both highlighted in yellow.
Discussion
This study evaluated the real-world deployment potential of an externally developed AI model designed to predict patient disposition in the emergency department (ED) for patients with community-acquired pneumonia (CAP) based on chest X-rays (CXR). Retrospective and prospective validations were conducted to assess the model’s performance across various settings and patient subgroups. While the retrospective validation provided an initial benchmark, retrospective studies often overestimate model performance due to controlled conditions and reliance on historical data. In contrast, prospective validations in real-world settings offer more accurate insights into operational performance, which is crucial for determining whether the model is viable for deployment. 13 Subgroup analysis also permits deployment workflow decision-making: high PPV and sensitivity would be required to accelerate admission; high NPV and specificity would be required for accelerated safe discharge. Despite these efforts, our findings revealed several limitations and challenges, leading us to the decision not to deploy the model in real-world clinical practice at this time.
The importance of prospective and external validation is recommended by multiple radiology societies and is critical for meeting high quality and safety standards for clinical AI tools. 13 This study, which included a shadow deployment after the initial retrospective validation, aligns with guidelines, while also offering an opportunity for direct comparison between the 2 validation approaches. No previous studies have reported both retrospective and prospective and external validations for CAP-related admission prediction tools in the ED.
In the retrospective validation, including 17 689 ED visits, the model achieved an AUC of 67%, with specificity at 74%. This indicates moderate performance in predicting admission outcomes, particularly in ruling out patients who did not require admission. The algorithm performed in a comparable range when compared to other evaluations of CXR-based outcome prediction models. For example, a retrospective, multisite evaluation of a model predicting disease severity and ICU admission from initial ED CXR for COVID patients in 2021 had a similar AUC of 73% and a sensitivity and specificity of 66% and 70%, respectively. 16 A newer, similar such evaluation demonstrated a significantly higher AUC of 87%. 17 However, it was exclusively trained and validated on patients confirmed to have COVID rather than being applied on a real-world population that would consist of both positive and negative cases. While not specific to CAP or COVID, a recent retrospective validation of a CNN predicting age based on CXR and subsequent all-cause mortality also demonstrated a similar AUC of 71%. 18
In contrast, the prospective validation included 3062 ED visits over 30 days, with the model demonstrating a moderate AUC of 67% and moderate overall metrics, including a sensitivity of 65%, a lower specificity of 68%, positive predictive value (PPV) of 64%, and negative predictive value (NPV) of 70%. 19 Overall, the differences between the 2 validations were non-significant and relatively consistent, which may indicate that both types of validations may not always be required to accurately evaluate an AI tool. This approach could lead to reduced computational resources, as fewer training cycles decrease computational load; time efficiency, with faster validation processes accelerating development; and a simplified workflow, making implementation and maintenance easier.
Only one previous study has specifically compared retrospective and prospective metrics for the same CXR outcome prediction model. In this study, a CXR-based CNN predicting mortality in CAP demonstrated an AUC of 79% in a single-month prospective validation (n = 315), with a comparable sensitivity and specificity of 77% and 67%. 11 However, their retrospective evaluation (n = 1948) yielded a higher AUC of 88%. Interestingly, with the addition of clinical tools such as CURB-65 and the Pneumonia Severity Index (PSI), the model’s prospective AUC rose to 83% to 84%. 11 This indicates that integrating clinical data moderately enhances the performance of outcome prediction models at this stage and may be considered for future models.
Subgroup analysis in both validations revealed that the model showed notable variations in performance based on age and sex. The model demonstrated significantly lower specificity and higher positive predictive value in older patients, while showing significantly lower sensitivity and higher negative predictive value in younger patients. These trends were consistent with the prospective validation, suggesting that the model may be more effective for predicting safe discharge in younger patients and for predicting the need for admission in older patients. This finding underscores the model’s potential to facilitate age-stratified clinical decision-making, optimizing resource allocation by minimizing unnecessary admissions in younger populations while ensuring timely intervention for older, higher-risk patients; that is, the same model can be used for different use cases in different populations. How to deploy this practically in the real-world would require careful implementation science considerations.
Sex-based differences were also observed, especially when stratified by age. The model demonstrated lower sensitivity and a higher false negative rate in younger females compared to younger males and the overall cohort, suggesting it was less effective in predicting admissions for younger females. Conversely, older females exhibited lower specificity, and a higher false positive rate compared to older males and the overall cohort, indicating the model’s reduced performance in accurately identifying non-admissions among older females. Some of these findings are consistent with known biases in AI models, which have been observed in other large datasets such as CheXpert, NIH, and MIMIC-CXR, where underdiagnosis in younger females is attributed to bias amplification from clinical records. 20
These variations in performance have important implications for the deployment of the model. The higher specificity and NPV in younger patients suggest that the model could be particularly useful for predicting safe discharge in this population. On the other hand, the higher sensitivity and PPV in older patients indicate that the model may be more effective at identifying those who require admission. Threshold adjustments can be made to further improve the model’s performance for specific tasks; for example, if it is decided to focus on predicting safe discharges new threshold modifications can optimize the model’s effectiveness for that purpose.
In a study by Ahluwalia et al, similar trends were observed in a CXR classifier tool. They suggested that CXR models may demonstrate higher specificity and PPV in older patients as the disease prevalence is higher in this group. 21 Furthermore, the performance disparities observed in younger and older females raise concerns about potential biases, which must be addressed before clinical deployment. Further refinement of the model, including adjusting thresholds for specific subgroups and additional training to reduce bias, may be necessary to improve performance across all demographics.
This study had several limitations. The prospective evaluation was conducted over a relatively short period of 30 days, which may not fully capture the variability of patient presentations or clinical workflows over time. Additionally, the study was limited to 2 hospital sites within a single health system, potentially restricting the generalizability of the findings to broader healthcare settings. The shadow deployment of the model itself was also a limitation, as it was not fully integrated into real-time clinical decision-making. While this allowed for performance evaluation, it did not account for how the model’s predictions might influence clinician behaviour, such as whether it would increase admissions or reduce discharges. Furthermore, the study included both anteroposterior (AP) and posteroanterior (PA) chest X-rays, known to vary in quality, particularly in critically ill or older patients. However, the impact of image quality on the model’s performance was not extensively analyzed, despite the potential for low-quality images, such as portable AP X-rays from bed-bound patients, to reduce predictive accuracy. Additionally, the study did not include data from clinical prediction tools like CURB-65 or the Pneumonia Severity Index (PSI) that have been shown to improve model performance in previous studies. Another important factor to consider was the inclusion of COVID-19 patients in the retrospective evaluation, which may have affected model performance due to altered admission patterns and workflows during the pandemic. Lastly, the baseline admission rate in the typical North American ED settings is generally around 13%. 22 In our cohort, which included patients with a chief complaint listed in Appendix A and those who had a CXR, the baseline admission rate was 46.4%. This design decision by the vendor enhances the algorithm’s utility in the desired cohort, reducing false alerts in irrelevant settings. However, the trade-off for such a custom deployment is that direct comparisons with other models is challenging and broader applicability is limited.
Conclusion
This study highlights the value of prospective external validation for clinical AI model deployment. This approach demonstrated moderate, consistent performance on retrospective and prospective validations, suggesting that both evaluations may not be required in all scenarios, potentially reducing the length of time required to accurately evaluate a model. Finally, we show how subgroup analysis can help decide workflow integrations of an AI prediction tool; in this case, the tool may be helpful to accelerate discharge in younger patients (high NPV) and admission in older patients (high PPV).
Footnotes
Appendix A
List of ED Chief Complaints to Define “Suspected CAP” in Prospective and Retrospective Cohort.
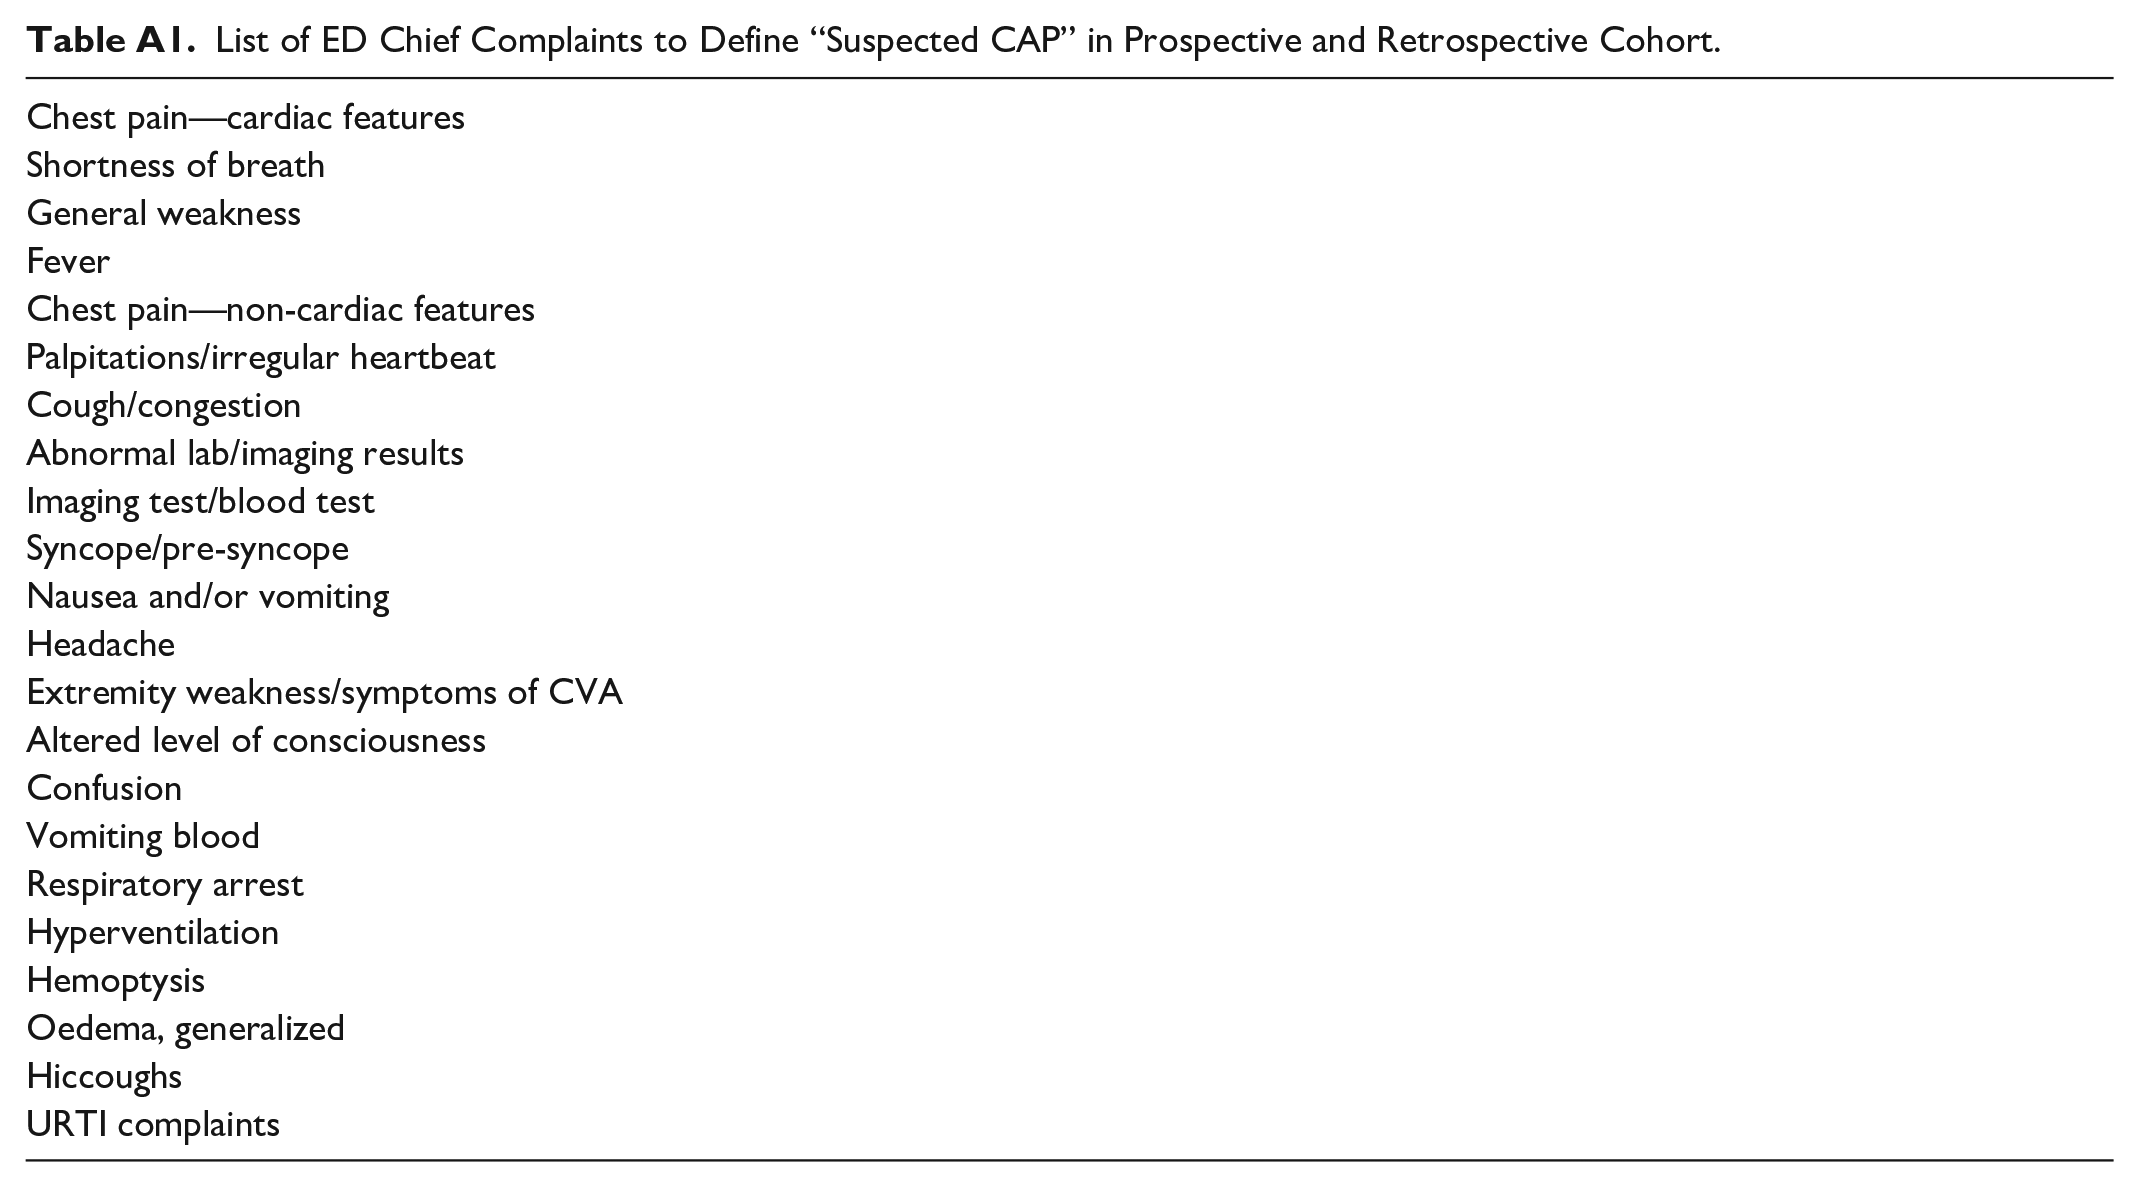
| Chest pain—cardiac features |
| Shortness of breath |
| General weakness |
| Fever |
| Chest pain—non-cardiac features |
| Palpitations/irregular heartbeat |
| Cough/congestion |
| Abnormal lab/imaging results |
| Imaging test/blood test |
| Syncope/pre-syncope |
| Nausea and/or vomiting |
| Headache |
| Extremity weakness/symptoms of CVA |
| Altered level of consciousness |
| Confusion |
| Vomiting blood |
| Respiratory arrest |
| Hyperventilation |
| Hemoptysis |
| Oedema, generalized |
| Hiccoughs |
| URTI complaints |
Appendix B
Appendix C
Acknowledgements
Dr. Felipe Torres University Health Network and Altis Labs for providing the CXR AI tool that was evaluated.
Declaration of Conflicting Interests
The author(s) declared no potential conflicts of interest with respect to the research, authorship, and/or publication of this article.
Funding
The author(s) received no financial support for the research, authorship, and/or publication of this article.