
Abstract
Introduction
The Liver Imaging Reporting and Data System (LI-RADS, LR) is a framework to standardize the reporting and data collection of liver imaging results in patients at risk of hepatocellular carcinoma (HCC). 1 The CT/MRI LI-RADS diagnostic algorithms consist of 5 major features and 21 ancillary features. The American Association for the Study of Liver Diseases (AASLD) as well as the Organ Procurement and Transplantation Network (OPTN) have endorsed LI-RADS v2018 for diagnostic evaluation of individuals with liver lesions at-risk for HCC.2,3
LI-RADS v2018 is currently applied to all “at-risk” individuals to non-invasively diagnose HCC. Similarly, other recent guidelines and societies such as those from the AASLD, European Association for the Study of Liver Disease (EASL), Japan Society of Hepatology (JSH), Asian Pacific Association for the Study of the Liver (APASL), and Korean Liver Cancer Association-National Cancer Center Korea (KLCSG-NCC), also support the non-invasive diagnoses of HCC based on imaging features.4-6 However, each society uses slightly different risk factors to define the threshold for individual populations where they recommend imaging as a non-invasive HCC diagnosis (risk above threshold), which leads to different non-invasive diagnostic thresholds when compared to the approach of LI-RADS v2018. 7
In particular, the AASLD recommends using LI-RADS imaging features to non-invasively diagnose HCC in individuals with cirrhosis from any etiology, and those with chronic hepatitis B Virus (HBV) at “high-risk” of HCC. The AASLD uses the PAGE-B score to stratify individuals into “high-risk” (PAGE >9) or “low-risk” (PAGE-B <9) categories. The PAGE-B scoring system considers platelet count, age, and gender for HBV individuals (PAGE-B) to stratify the 5-year risk of developing HCC.2,8-12 However, AASLD recommends that “low-risk” individuals (PAGE-B ≤9) require an invasive biopsy to diagnose HCC. 13 Contrary to these recent guidelines, LI-RADS permits a non-invasive diagnosis of HCC in “at-risk” populations which is defined as all individuals with chronic HBV, cirrhosis, or a personal history of HCC.2,14 In summary, recent guidelines recommend that “low-risk” HBV-positive individuals should have a biopsy for HCC diagnosis, while LI-RADS allows for non-invasive diagnosis of HCC in these individuals.
There are many risk factors for HCC that potentially influence the association of LI-RADS imaging features with HCC that are not included in stratification frameworks. Factors such as excess alcohol consumption, metabolic dysfunction-associated steatotic liver disease (MASLD), family history of HCC, obesity, type 2 diabetes mellitus, and smoking among others, outlined in Tang et al, 2018, are not consistently used by major societies as risk factors when stratifying an individuals’ risk of developing HCC across North America, Asia, and Europe. 7 Additionally, these major societies concur that the primary risk factor for HCC is cirrhosis caused by chronic HBV or chronic hepatitis C virus (HCV).7,15,16 In the Eastern hemisphere, the primary risk factor for HCC emerges as cirrhosis secondary to chronic HBV, whereas in the Western hemisphere, the primary risk factors for HCC include cirrhosis secondary to chronic HCV as well as excess alcohol consumption and MASLD. 17
Cirrhosis is the leading risk factor for HCC, with a 5-year cumulative risk of 5% to 30%. 18 However, other non-liver disease risk factors, such as older age and male sex, are also strongly associated with HCC risk across various liver disease etiologies.19,20 Additional risk factors have been incorporated into risk stratification models including obesity, type 2 diabetes mellitus, liver disease etiology, and alcohol consumption, among others. 7 However, LI-RADS does not currently apply to other at-risk patient groups, such as those with vascular causes of cirrhosis like Fontan-associated heart disease or Budd-Chiari syndrome. Hence, analyzing a wider pool of HCC risk factors can enhance our understanding of the positive or negative associations of LI-RADS major features with HCC, which is crucial to refining tools, like LI-RADS, intended for diverse populations. 21
The purpose of this study was to evaluate the association between HCC risk factors and each CT/MRI LI-RADS major feature among individuals “at-risk” for HCC. Specifically, it explored the association between LI-RADS major features both with a subset of HCC risk factors in the PAGE-B score, such as age and sex, as well as a broader scope of risk factors, such as cirrhosis and geographic location.
Methods
The LI-RADS individual participant data (IPD) database was leveraged from previous publications8,22-28 in accordance with the Text Recycling Project. 29 There is no overlap with prior or ongoing studies’ objectives. This study is distinct from previous analyses conducted with our IPD database as it includes additional data from recently updated searches, employs different inclusion criteria, and follows a unique primary objective.
This study was approved by the institutional review board (IRB) at (The Ottawa Hospital). A protocol was posted on the Open Science Framework before initiating the study (https://osf.io/tdv7j/). Personal health information was not shared with the project team. Optimal methodological practices for diagnostic test accuracy of systematic reviews were employed.30,31 Reporting was conducted via the Preferred Reporting Items for a Systematic Review and Meta-analysis of Individual Participant Data (PRISMA-IPD) and PRISMA for Diagnostic Test Accuracy (DTA) statements.32-34 Data were collected and analyzed on a per-observation basis. Protocol deviations are listed in Supplemental Appendix E1.
Eligibility Criteria
The included CT/MRI studies reported major features as well as the percentage of HCC, overall malignancy for LI-RADS categories 1 to 5, LR-TIV (tumour in vein), and LR-M (probably or definitely malignant, not HCC specific) in individuals at-risk for HCC. CT and MRI techniques were evaluated for each study to ensure compliance with LI-RADS technical imaging guidelines. 35 Only liver observations categorized according to CT/MRI LI-RADS v2014/v2017/v2018 were included.14,24,36,37 Participants were only those at-risk of HCC, as defined by LI-RADS, which encompasses individuals with cirrhosis, chronic hepatitis B viral infection, or a personal history of current or prior HCC. 4 A reference standard was established to assess bias risk (Supplemental Appendix E2). 22 Studies eligible for inclusion were evaluated by 2 authors (EL and JPS) using DistillerSR. 38
Study Selection and Data Collection
The search strategy, study selection, and data collection process are provided at https://osf.io/rpg8x and van der Pol et al, 2022. 22 A previous search from January 2014 to December 2019 was combined with an updated search from January 2020 to January 2022 (Figure 1). Study data were stored and managed into a master individual participant database using Research Electronic Data Capture (REDCap) tools hosted at (The Ottawa Hospital).39,40 IPD from corresponding study investigators and published reports were compared for each study. Data validation was performed by a research assistant (EL), graduate student (EL and JPS), and board-certified abdominal radiologist with experience in applying LI-RADS (AC). If data were unclear or inconsistent, investigators were contacted to resolve the differences. If data from multiple readers were available, data from one reader were chosen at random. The LI-RADS IPD steering committee was consulted regarding any issues related to LI-RADS applications and discussions regarding preliminary results.
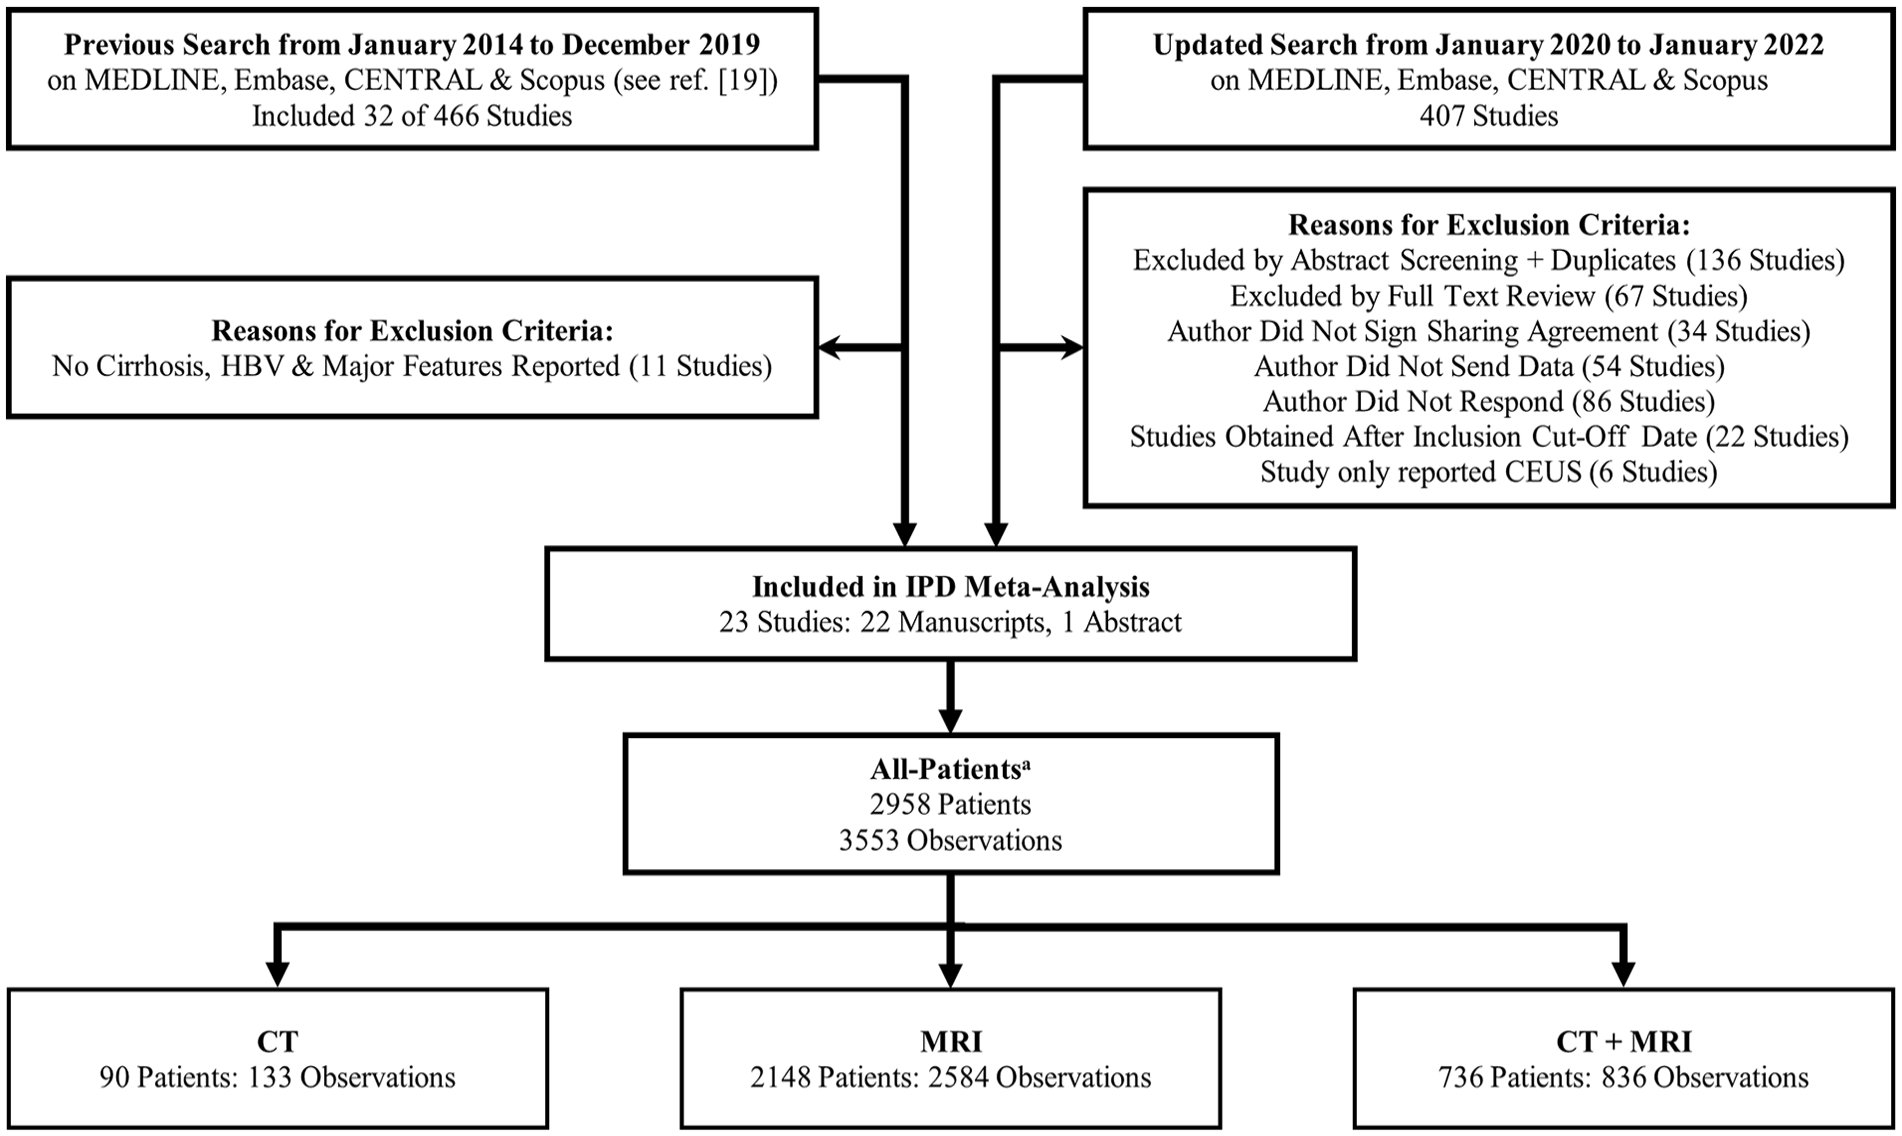
Flow diagram shows search results, study review, and exclusion criteria.
Risk of Bias and Applicability
The Quality Assessment of Diagnostic Accuracy Studies 2 (QUADAS-2) tool was adapted for application to LI-RADS, which categorized potential sources of bias into 4 domains: patient selection, index test, reference standard, and flow and timing.22,34 The risk of bias and applicability assessment was conducted in duplicate and independently by 2 authors (JPS, CvdP), each with experience conducting risk of bias assessments for diagnostic test accuracy studies. Differences between the independent authors were resolved by discussion with a third author (MDFM). A pilot of one study with subsequent discussion was performed by the 3 authors to improve the inter-observer agreement. A preferred composite reference standard was established to assess the risk of bias (Supplemental Appendix E2). 22
Outcome Measures
Multivariable outcomes were used to evaluate whether risk factors for HCC impacted the association of LI-RADS major features with HCC. The diagnosis of HCC was primarily based on histopathological findings from either a core needle biopsy, hepatectomy, or explant. If these were not available, a composite reference standard was utilized as detailed in Supplemental Appendix E2. The primary outcomes assessed in the patient population were multivariable-adjusted odds ratios (ORs) of major features with and without that HCC risk factor. These were used to determine the independent association of HCC with CT/MRI LI-RADS major features (size, arterial phase hyperenhancement [APHE], enhancing capsule, and washout) and their interaction with the following risk factors for HCC: age (1-year increase compared to the mean age of 59), sex, cirrhosis history, chronic HBV history, and study-location (North America, Asia, or Europe). Personal history of HCC and threshold growth were not included in the analysis due to limited data available in our database. Although our previous IPD meta-analysis did not find an independent association between threshold growth and HCC, 22 differing results have been shown in a recent single-centre study by Choi et al, 2023. 41 Despite this finding, threshold growth was not included in this study since our dataset had a limited sample size, which prevented us from obtaining meaningful results as the models did not converge. Notably, since platelet count was not reported in our data, we could not evaluate all risk factors included in the PAGE-B score, which has been proposed to identify “high-risk” individuals for LI-RADS diagnosis of HCC.
Statistical Analysis
To determine whether the multivariable-adjusted ORs reflecting the association of major features with HCC were impacted by risk factors for HCC, IPD were pooled across studies and modelled simultaneously with one-stage meta-regressions by interacting each of the following HCC risk factors: age, sex, cirrhosis history, chronic HBV history, and study location, individually, with CT/MRI LI-RADS major features. More specifically, a multivariable generalized linear model with mixed-effects (GLMM), clustering for patient, observation, and study level correlation effects, was used to create a “simple” model including the HCC risk factor and LI-RADS major feature variables. Then, separate GLMMs were created to add interaction effects between all major features and each risk factor (one GLMM per risk factor). To compare the goodness-of-fit between the multivariable GLMMs with and without interactions, and to see if it is beneficial to include interaction terms in our model, the likelihood ratio test (LRT) was used.
Adjusted ORs for all the variables for HCC were calculated with 95% confidence intervals (CIs). The strength of the independent association of the variables and interactions with the outcome of interest was determined based on the statistical significance and the magnitude of the adjusted ORs derived in the multivariable models. Differences between adjusted ORs of major feature association to HCC with and without HCC risk factors were determined by z-test.
Publication bias was not assessed as per contemporary guidance for DTA systematic reviews. 33 Tau 2 , the estimate of between-study variance, was calculated using a maximum-likelihood estimator. All analyses were performed using the “lme4” package in R (R Core Team, version 4.2.2; R Foundation for Statistical Computing).42-44 The level of significance was set at P < .05.
Sensitivity Analyses
A sensitivity analysis was performed by limiting the same analyses to studies at an overall low risk of bias. Results were reported if the number of positive observations allowed for the GLMM to converge and obtain stable estimates.
Results
Study Selection and Characteristics
Of the 873 unique studies that were initially identified, 23 were selected for the final population because they reported risk factors for HCC, such as age, sex, cirrhosis history, chronic HBV history, and study location, and evaluated CT/MRI LI-RADS major features. 22 These 23 studies comprised 22 full manuscripts and one published conference abstract. Characteristics of the included studies are in Table 1 and Supplemental Appendix E3. There were 2958 total patients with 3553 observations: 90 patients (133 observations) were imaged with CT, 2148 patients (2584 observations) were imaged with MRI, and 736 patients (836 observations) were imaged with both CT and MRI as seen in Figure 1. The prevalence of overall HCC, malignancy, and benign lesions for each modality and the study population are in Table 2.
Characteristics of Included Studies in Terms of Study Details, Imaging Technique, and Observation Data.
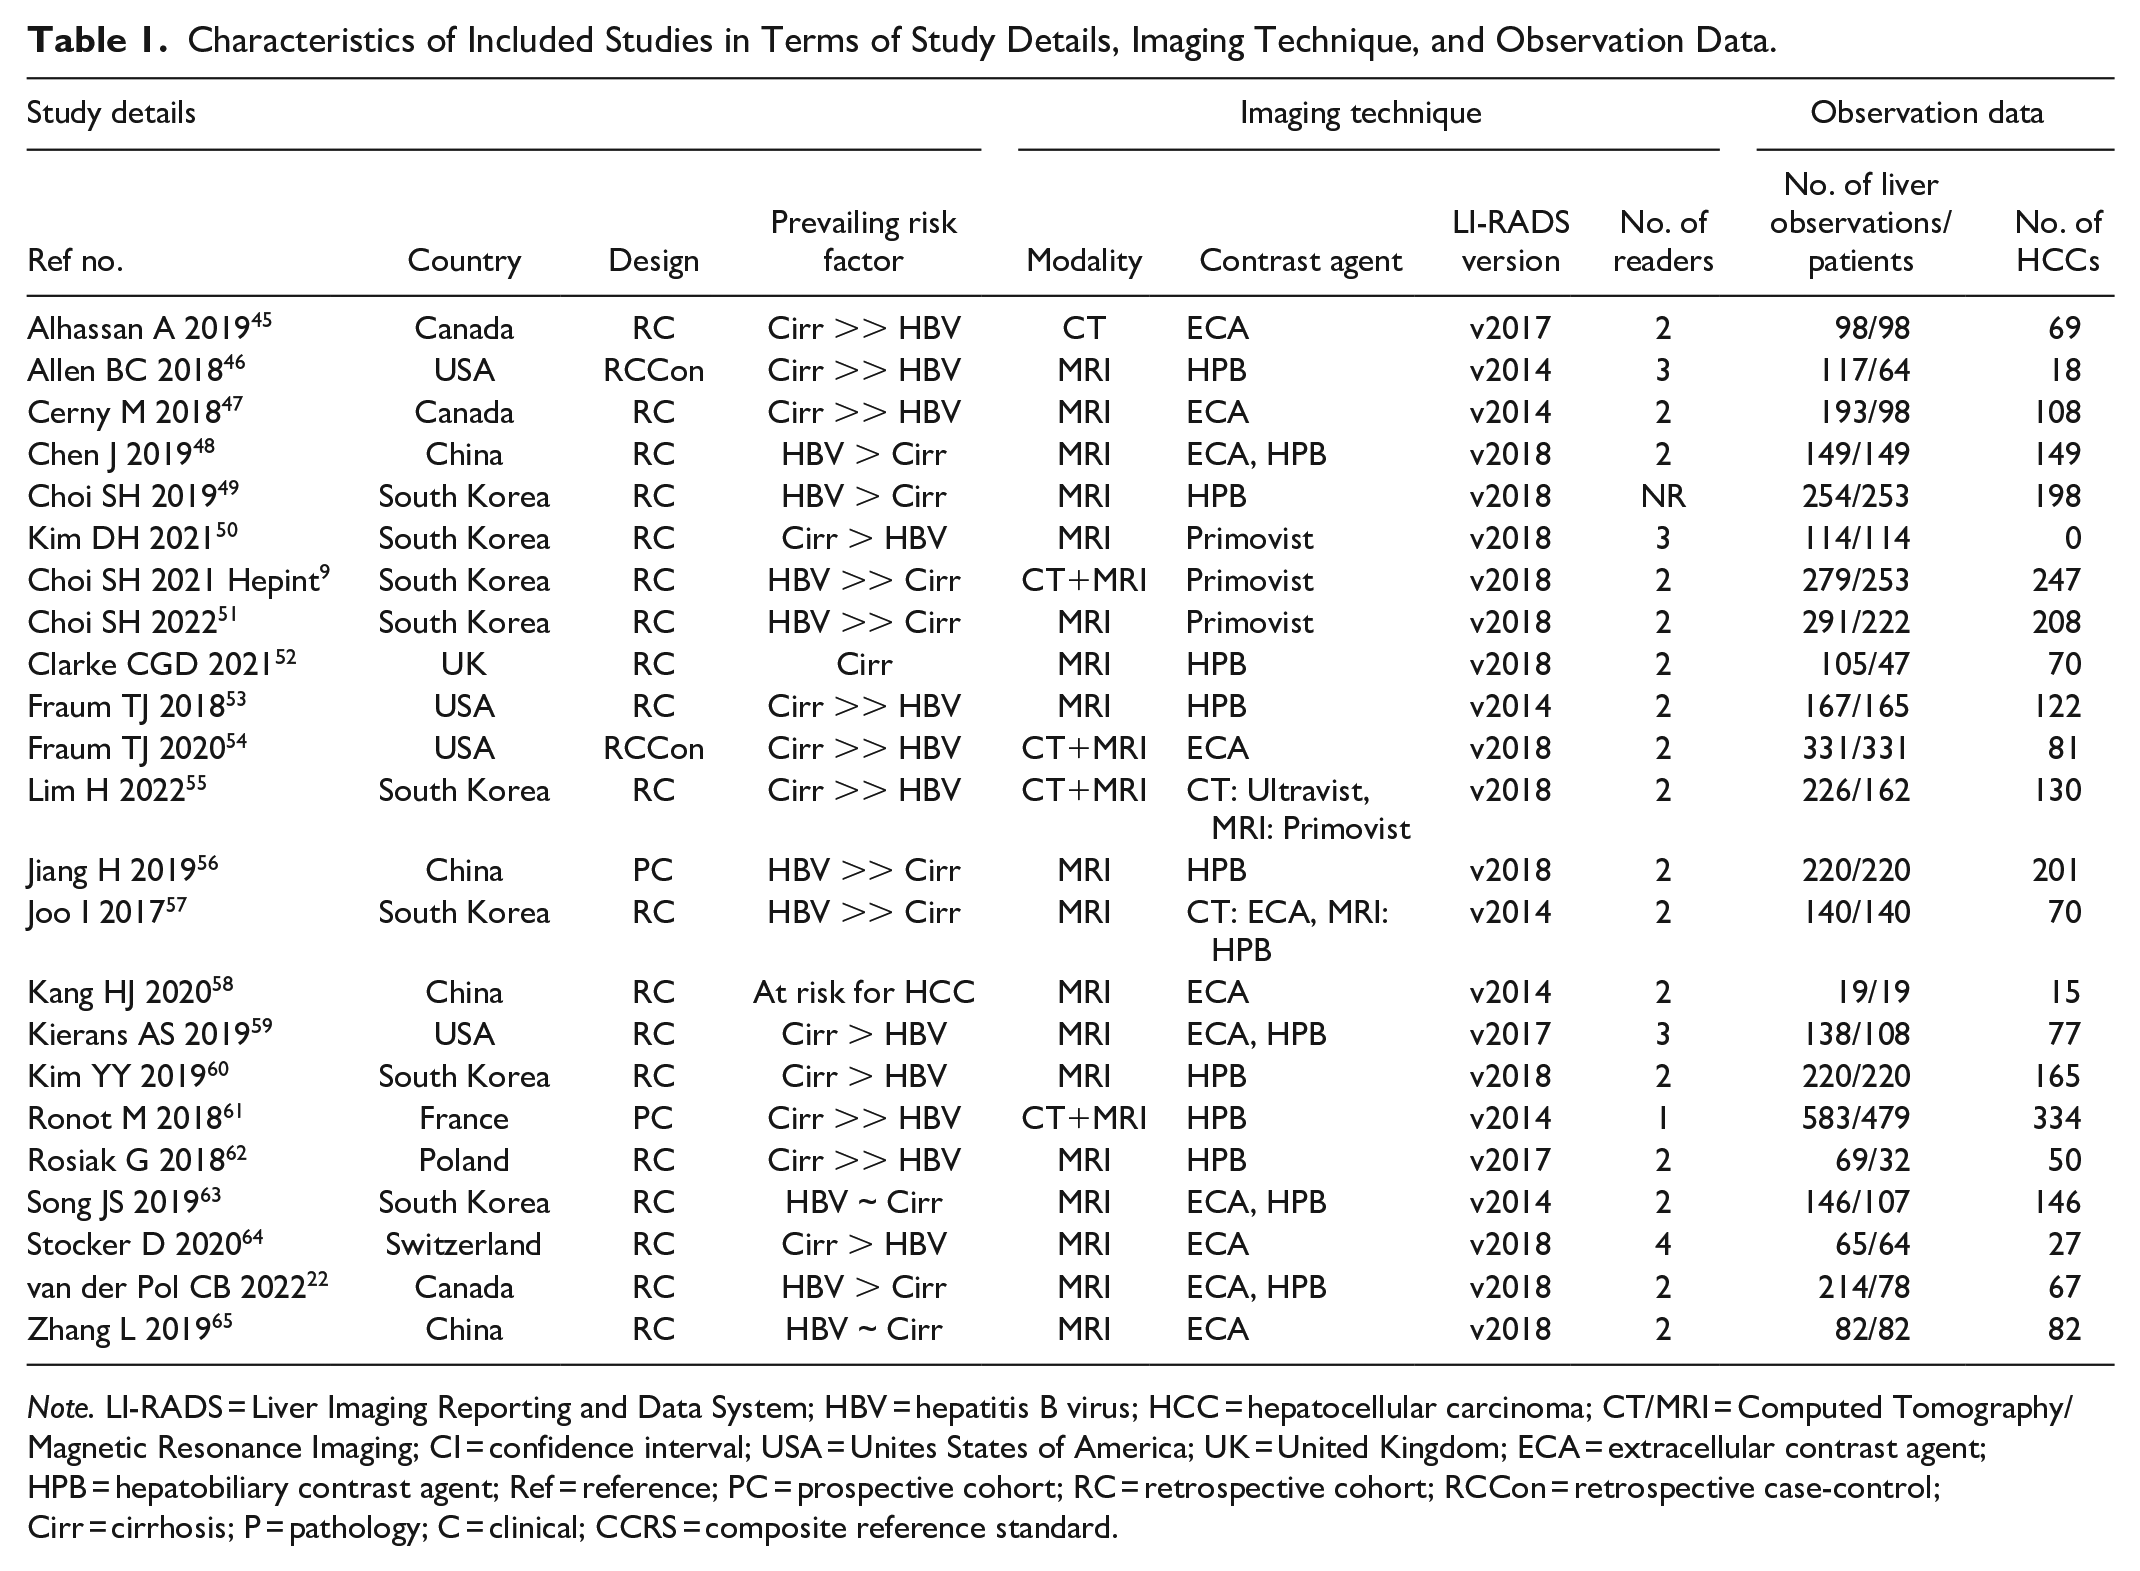
Note. LI-RADS = Liver Imaging Reporting and Data System; HBV = hepatitis B virus; HCC = hepatocellular carcinoma; CT/MRI = Computed Tomography/Magnetic Resonance Imaging; CI = confidence interval; USA = Unites States of America; UK = United Kingdom; ECA = extracellular contrast agent; HPB = hepatobiliary contrast agent; Ref = reference; PC = prospective cohort; RC = retrospective cohort; RCCon = retrospective case-control; Cirr = cirrhosis; P = pathology; C = clinical; CCRS = composite reference standard.
Overall Characteristics of All Patients for CT/MRI LI-RADS Categories.
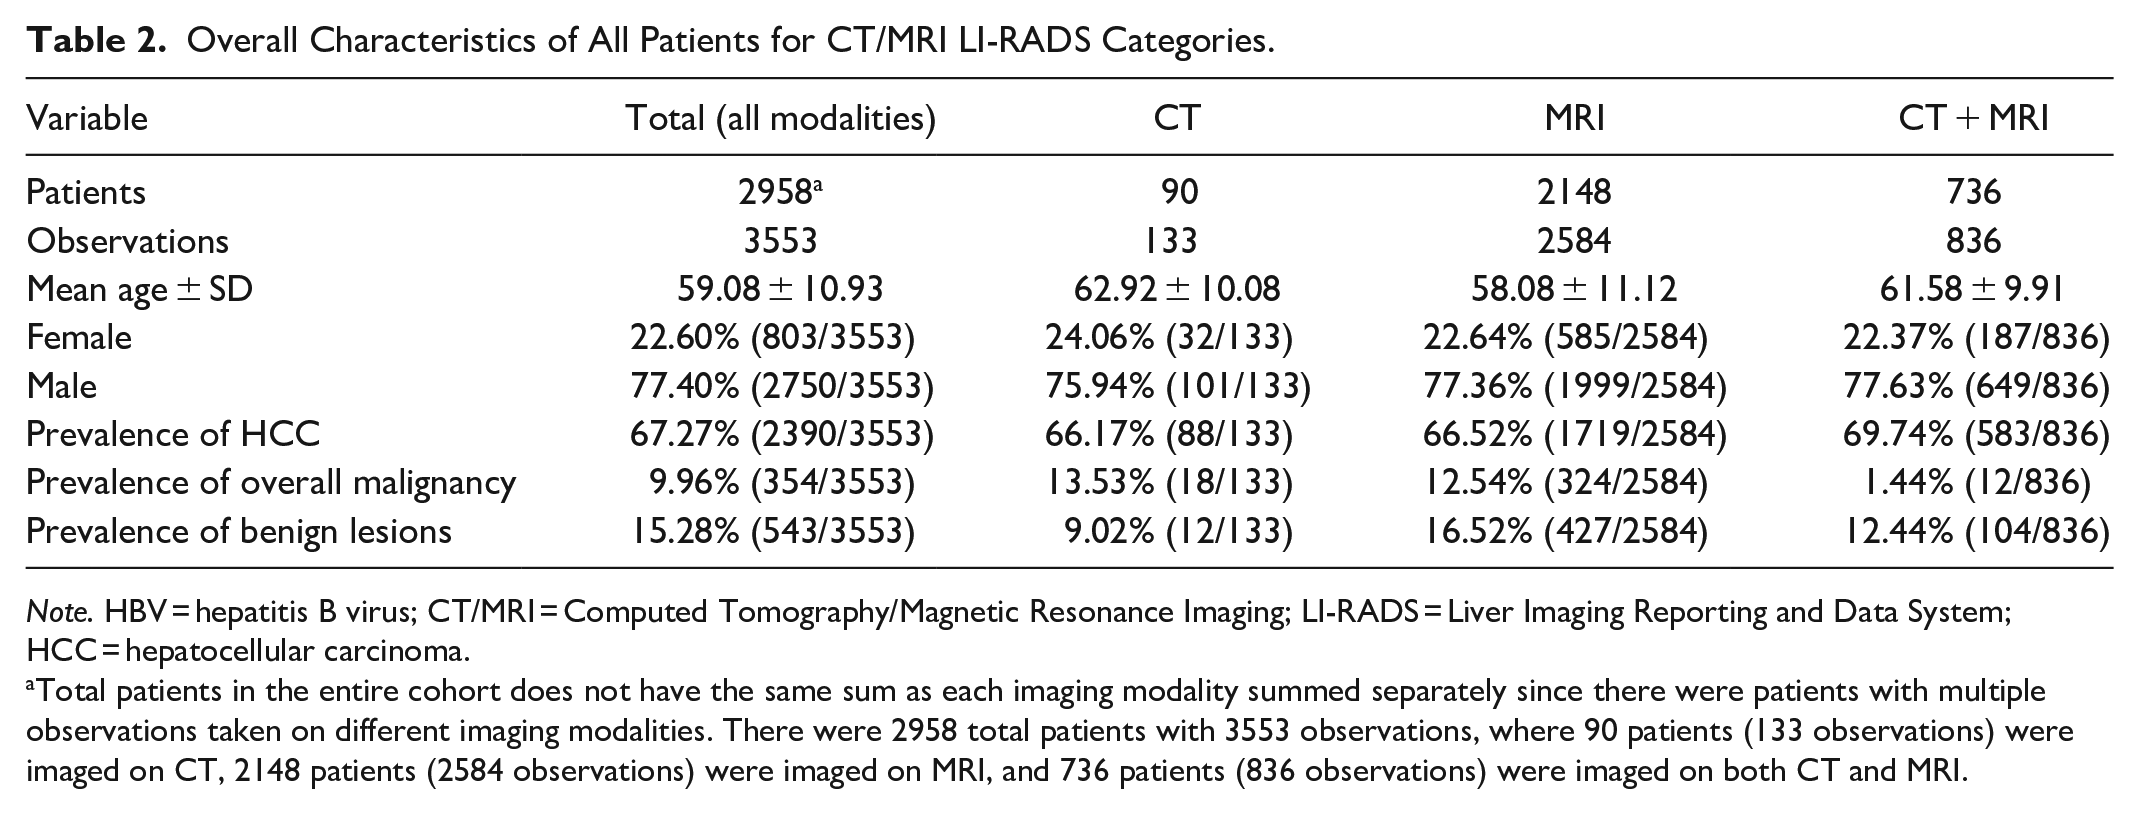
Note. HBV = hepatitis B virus; CT/MRI = Computed Tomography/Magnetic Resonance Imaging; LI-RADS = Liver Imaging Reporting and Data System; HCC = hepatocellular carcinoma.
Total patients in the entire cohort does not have the same sum as each imaging modality summed separately since there were patients with multiple observations taken on different imaging modalities. There were 2958 total patients with 3553 observations, where 90 patients (133 observations) were imaged on CT, 2148 patients (2584 observations) were imaged on MRI, and 736 patients (836 observations) were imaged on both CT and MRI.
Risk of Bias and Applicability
Of the 23 included studies, 17% (4/23) were at low risk of bias, and 96% (22/23) had low applicability concerns (Figure 2 and Supplemental Appendix E4). The overall assessment determined that 83% (19/23) of studies were at high risk of bias with 63% (12/19) of those studies being at high risk of bias in more than one domain. The domain most often at risk for bias was study flow and timing (65% of included studies, 15/23), which were primarily due to inappropriate or unclear intervals between the index test and reference standard (33% of these studies, 5/15). Specifically, 2 studies had an index imaging to pathological reference standard time interval ranging from zero to greater than 2 years for HCC (25, 32). Patient and observation selection were unclear or at high risk of bias for 65% (15/23) of included studies due to case-control study design. The reference standard domains were at low risk of bias for 78% (18/23) of studies.
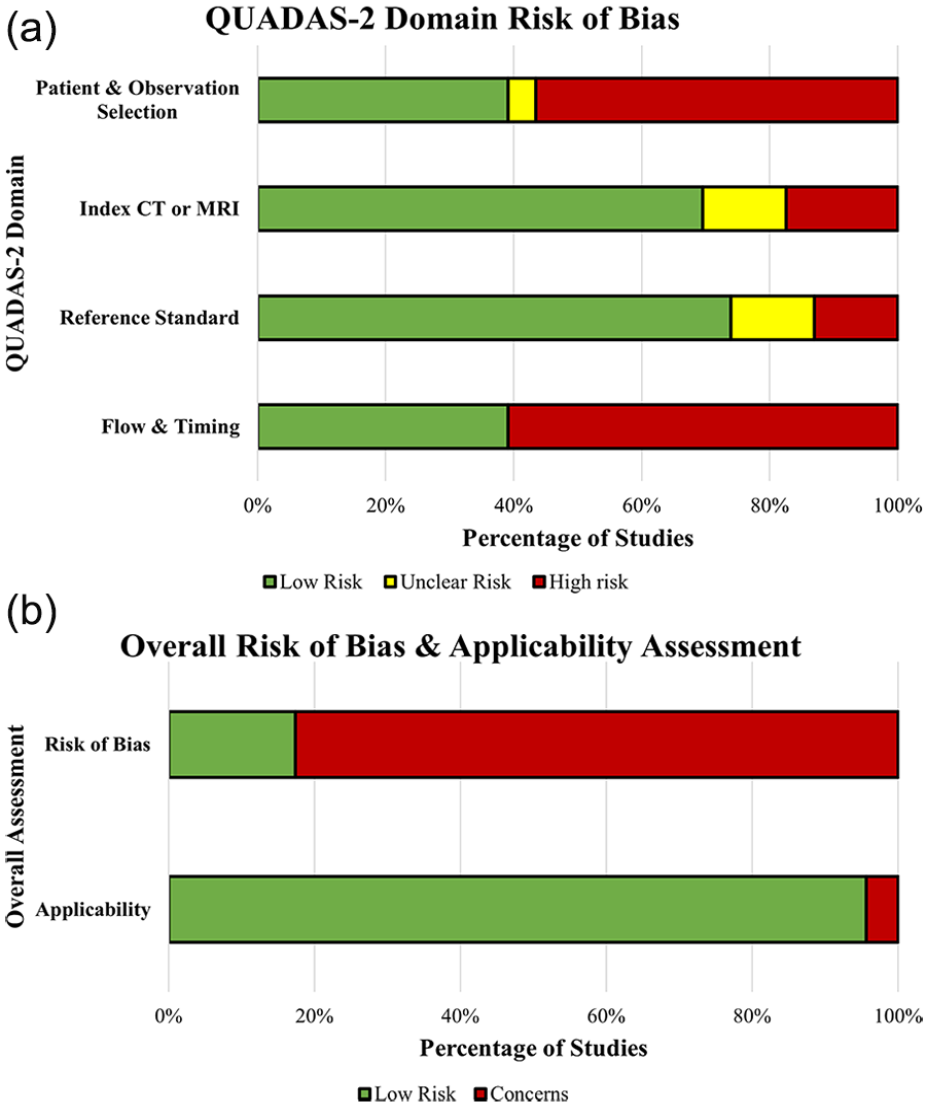
Risk of bias assessment for 23 included studies using the Quality Assessment of Diagnostic Accuracy Studies 2 (QUADAS-2) tool which consists of 4 domains.
Association Between Major Features and Risk Factors on CT/MRI With HCC
The adjusted ORs for the associations between CT/MRI major features with HCC risk factors compared to the reference risk factor level are presented in Table 3. When comparing the GLMMs that included interactions between major features to patient age, sex, and HBV history to the GLMM without interactions, no significant differences were found in the associations of major features and risk factors with HCC to the associations of major features alone (P-value = .13, P-value = .22, and P-value = .35, respectively). GLMMs that included interactions between major features and cirrhosis and study location showed significantly greater accuracy to the IPD compared to GLMMs without these interactions (P-value = .04 and P < .01, respectively; Supplemental Appendices E5 and E6). The “P-value range” represents the range of P-values for a specific risk factor across the major features as shown in Table 3. For the following risk factors, no differences in association of major features with HCC were identified: increase in age (1-year increase compared to the mean patient age of 59, P-value range = .88-.99), sex (male vs female, P-value range = .63-.97), cirrhosis status (patients with vs without cirrhosis, P-value range = .30-.77), chronic HBV status (patients with vs without chronic HBV, P-value range = .41-.98), and study location (studies conducted in Asia or Europe vs those in North America, P-value range = .09-.98 and P-value range = .23-.98, respectively).
Multivariable Logistic Regression With Mixed-Effects and Interaction Analysis for CT/MRI LI-RADS Major Features, Except Threshold Growth, and Risk Factors Influencing the Association to HCC. Models Included 2958 Total Patients With 3553 Observations.
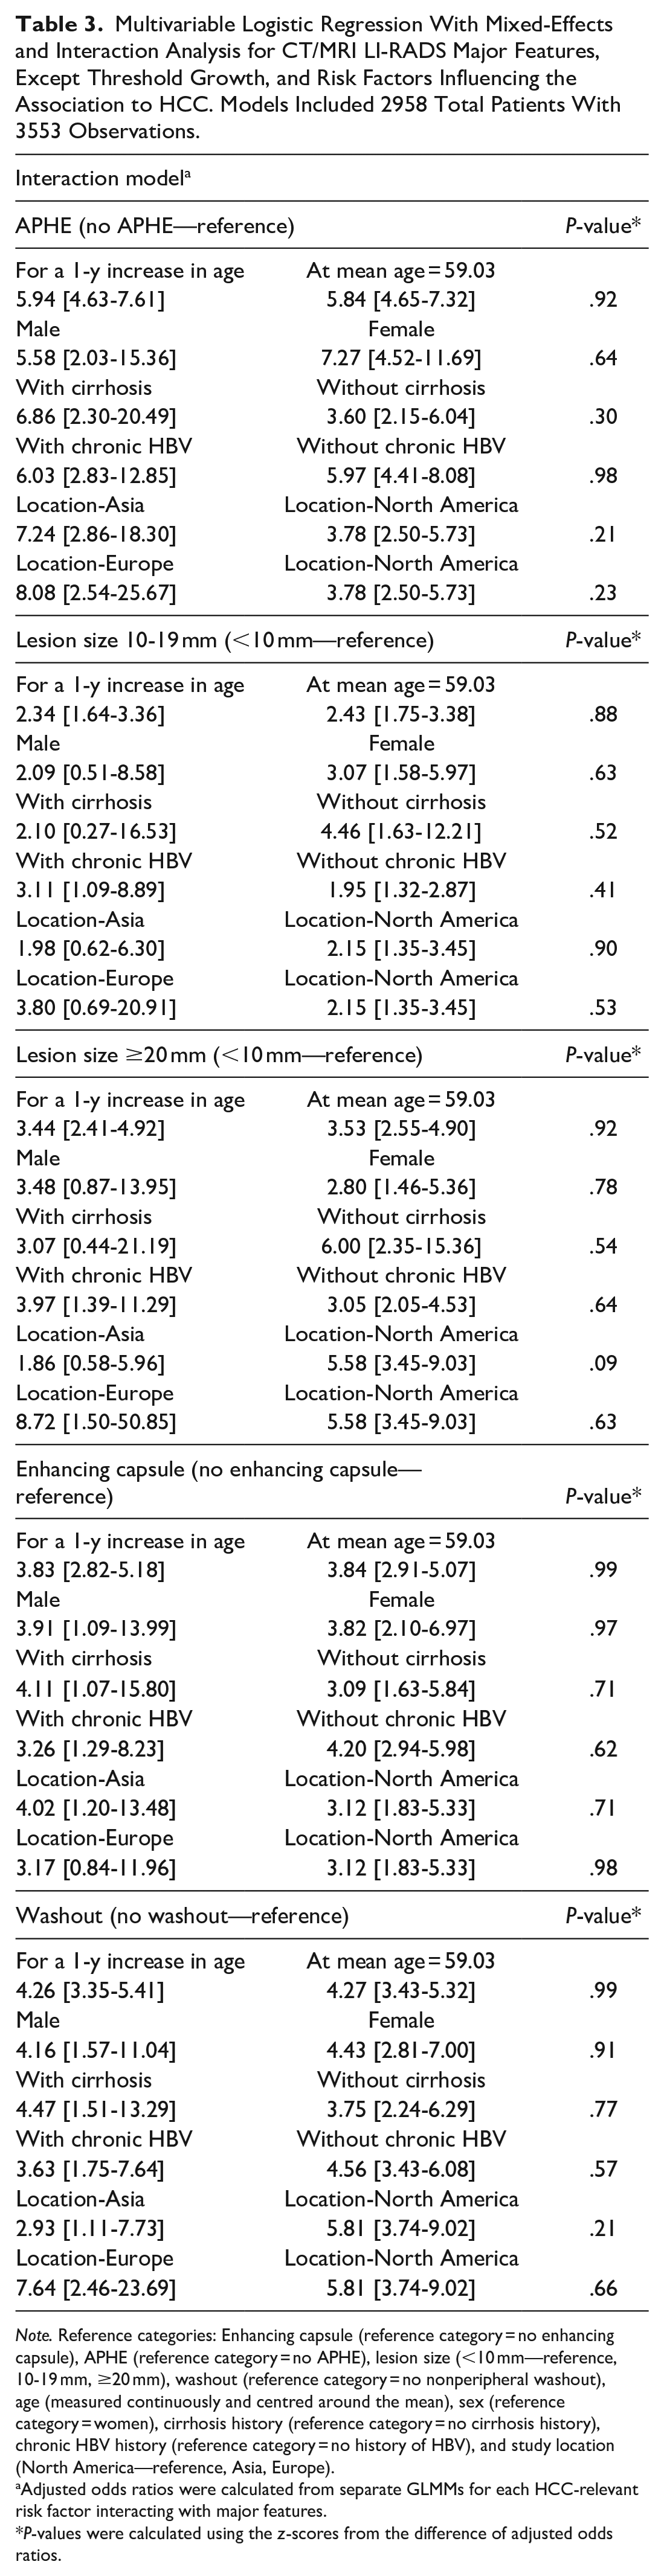
Note. Reference categories: Enhancing capsule (reference category = no enhancing capsule), APHE (reference category = no APHE), lesion size (<10 mm—reference, 10-19 mm, ≥20 mm), washout (reference category = no nonperipheral washout), age (measured continuously and centred around the mean), sex (reference category = women), cirrhosis history (reference category = no cirrhosis history), chronic HBV history (reference category = no history of HBV), and study location (North America—reference, Asia, Europe).
Adjusted odds ratios were calculated from separate GLMMs for each HCC-relevant risk factor interacting with major features.
P-values were calculated using the z-scores from the difference of adjusted odds ratios.
Sensitivity Analyses
When restricting analyses to 4 studies considered low-risk of bias (Supplemental Appendices E9 and E13), the low-risk population (695 patients, 862 observations) showed no difference between adjusted ORs of major features with and without HCC risk factors: increase in age (1-year increase compared to the mean patient age of 59, P-value range = .88-1.00), sex (male vs female patients, P-value range = .31-.73), chronic HBV status (patients with vs without chronic HBV, P-value range = .30-.99), and study location (studies conducted in Europe vs those in North America, P-value range = .37-1.00). Results for the study location-Asia variable could not be obtained as there were no low-risk of bias studies originating from this study region. Additionally, P-values for the difference between adjusted ORs with and without cirrhosis could not be obtained due to the small sample size and wide confidence intervals ranging from 0 to infinity. Considerable variability persists in this sensitivity analysis, as indicated by the range of τ 2 for interactions being 1.92 to 2.31 (Supplemental Appendix E11).
Discussion
This IPD meta-analysis of more than 3000 observations found that the assessed risk factors (age, sex, cirrhosis history, chronic HBV history, and study location) did not influence the strength of association of CT/MRI LI-RADS major features with HCC. Importantly, this finding persisted in a sensitivity analysis of the risk of bias studies, suggesting that the CT/MRI LI-RADS major features are associated with HCC independent of the assessed risk factors. Guidelines that recommend altering LI-RADS application based on patient risk factors should consider this evidence.
Prior studies have assessed risk factors for HCC. Based on the risk factors with sufficient data in our IPD analysis, Tang et al, 2018, identified increased age, male sex, cirrhosis, and chronic HBV as risk factors that increased the incidence of HCC. Additionally, they found that the age-standardized incidence rate of HCC was highest in Asia (20 cases per 100 000), lower in North America (10-15 cases per 100 000), and lowest in Southern and Western Europe (10 cases per 100 000). 7 Although these factors are associated with HCC risk, our study importantly demonstrated that these HCC risk factors do not influence the strength of the association between CT/MRI LI-RADS major features and the diagnosis of HCC. Therefore, irrespective of an individual’s HCC risk factors, LI-RADS 5 (Definite HCC) criteria can be applied to all individuals considered “at-risk” for developing HCC.
Using the QUADAS-2 tool, most studies (19 of 23) had a high risk of bias. However, a sensitivity analysis with a low risk of bias yielded the same outcomes, suggesting that the association of CT/MRI LI-RADS major features with HCC is not influenced by HCC risk factors. Despite this, we acknowledge that the high proportion of high risk of bias studies dampens the strength of conclusions. The authors note that at present, there is no other body of evidence at a low risk of bias to refer to as an alternative. This should serve as a call to liver imaging researchers to strive for more high-quality research based on the areas identified as commonly at risk of bias.27,66 The main sources of bias were patient and observation selection as well as flow and timing, as a considerable proportion of the observations were at high risk or unclear. Patient selection bias can occur when patients are included based on imaging and pathology availability, which leads to potentially excluding those meeting LI-RADS criteria but managed conservatively without pathology. Observation selection bias may arise when inclusion or exclusion criteria favour liver observations with a high suspicion of malignancy (LI-RADS 5), potentially underrepresenting less suspicious lesions (LI-RADS 3). Moreover, many studies had an inappropriate interval between multiphase CT, MRI, and reference standard. In future research, it is crucial to address these sources of bias to ensure more robust results.
Our study had important limitations in addition to the risk of bias concerns described above. First, many datasets were unavailable for analysis (less than half of the eligible data sets were made available by their original authors), which precluded more detailed analyses. In addition, a lack of clarity regarding patient risk factors further precluded the use of several data sets. As per our protocol, we intend to conduct a follow-up report for CEUS once we collect more data that facilitates meaningful analysis. Additionally, threshold growth, while not frequently evaluated in the literature, was not included as a major feature in this multivariable analysis due to the low sample size. However, in our prior IPD analysis, threshold growth was not independently associated with HCC. 22 Furthermore, there is variation in surveillance recommendations in non-HBV patients with advanced fibrosis in the absence of cirrhosis. We found the presence of cirrhosis did not impact the association of LI-RADS major features but this analysis included patients with HBV infection. We did not have sufficient numbers to evaluate non-cirrhotic metabolic dysfunction-associated steatotic liver disease (MASLD) or HCV infection, and this serves as an area for future research on LI-RADS. 67 Moreover, although the inclusion of certain at-risk patients, such as those with vascular causes of cirrhosis, in the LI-RADS framework is beyond the scope of this study, our findings suggest that these populations might warrant consideration in future research to expand the LI-RADS framework. Finally, at present, the LI-RADS IPD does not have data on platelet count, which prevents the calculation of PAGE-B scores and comparison of diagnostic performance in the lower-risk HBV population (PAGE-B ≤9) and other at-risk populations. Therefore, a direct assessment of the AASLD-recommended exclusion of the PAGE-B ≤9 cohort from the LI-RADS application could not be performed.2,3 Notably, 2 of the 3 variables that contribute to the PAGE-B score (age and sex) were not associated with differences in the utility of major features.
In conclusion, risk factors for HCC do not impact the strength of the association between CT/MRI LI-RADS major features and the diagnosis of HCC. However, a high proportion of the studies included were susceptible to bias, and we could not conduct an analysis stratified by PAGE-B score. These represent opportunities for further research. Nevertheless, this study suggests that the LI-RADS v2018 CT/MRI approach to evaluating major features applies to all populations currently deemed at-risk by LI-RADS. Notably, patients at low risk for HCC, for whom LI-RADS is not presently applicable, were not included and generalizations to this population cannot be made based on the results of this study.
Supplemental Material
sj-docx-1-caj-10.1177_08465371241306297 – Supplemental material for Do Risk Factors for HCC Impact the Association of CT/MRI LIRADS Major Features With HCC? An Individual Participant Data Meta-Analysis
Supplemental material, sj-docx-1-caj-10.1177_08465371241306297 for Do Risk Factors for HCC Impact the Association of CT/MRI LIRADS Major Features With HCC? An Individual Participant Data Meta-Analysis by Robert G. Adamo, Eric Lam, Jean-Paul Salameh, Christian B. van der Pol, Stacy M. Goins, Haben Dawit, Andreu F. Costa, Brooke Levis, Amit G. Singal, Victoria Chernyak, Claude B. Sirlin, Mustafa R. Bashir, An Tang, Ayman Alhasan, Brian C. Allen, Caecilia S. Reiner, Christopher Clarke, Daniel R. Ludwig, Milena Cerny, Jin Wang, Sang Hyun Choi, Tyler J. Fraum, Bin Song, Ijin Joo, So Yeon Kim, Heejin Kwon, Hanyu Jiang, Hyo-Jin Kang, Andrea S. Kierans, Yeun-Yoon Kim, Maxime Ronot, Joanna Podgórska, Grzegorz Rosiak, Ji Soo Song and Matthew D. F. McInnes in Canadian Association of Radiologists Journal
Footnotes
Declaration of Conflicting Interests
The author(s) declared the following potential conflicts of interest with respect to the research, authorship, and/or publication of this article: Amit Singal has served as a consultant or on advisory boards for Genentech, AztraZeneca, Eisai, Exelixis, Bayer, Elevar, Boston Scientific, Sirtex, Histosonics, FujiFilm Medical Sciences, Exact Sciences, Roche, Abbott, Glycotest, Freenome, and GRAIL.
Funding
The author(s) disclosed receipt of the following financial support for the research, authorship, and/or publication of this article: CIHR Operating Research Grant, Radiological Society of North America (RSNA) R&E Foundation Research Scholar Grant, Mach-Gaensslen Foundation of Canada Grant, Fonds de recherche du Québec en Santé (FRQS #298509 to Dr. An Tang), National Institute of Health (hU01 CA283935 to Dr. Amit Singal).
Supplemental Material
Supplemental material for this article is available online.
References
Supplementary Material
Please find the following supplemental material available below.
For Open Access articles published under a Creative Commons License, all supplemental material carries the same license as the article it is associated with.
For non-Open Access articles published, all supplemental material carries a non-exclusive license, and permission requests for re-use of supplemental material or any part of supplemental material shall be sent directly to the copyright owner as specified in the copyright notice associated with the article.