
Abstract
Objectives:
To evaluate the interobserver agreement between radiologists using the Ultrasound Liver Reporting And Data System (US LI-RADS) visualization score and assess association between visualization score and cause of liver disease, sex, and body mass index (BMI).
Methods:
This retrospective, single institution, cross-sectional study evaluated 237 consecutive hepatocellular carcinoma surveillance US examinations between March 4, 2017 and September 4, 2017. Five abdominal radiologists independently assigned a US LI-RADS visualization score (A, no or minimal limitations; B, moderate limitations; C, severe limitations). Interobserver agreement was assessed with a weighted Kappa statistic. Association between US visualization score (A vs B or C) and cause of liver disease, sex, and BMI (< or ≥ 25 kg/m2) was evaluated using univariate and multivariate analyses.
Results:
The average weighted Kappa statistic for all raters was 0.51. A score of either B or C was assigned by the majority of radiologists in 148/237 cases and was significantly associated with cause of liver disease (P = 0.014) and elevated BMI (P < 0.001). Subjects with viral liver disease were 3.32 times (95% CI: 1.44-8.38) more likely to have a score of A than those with non-alcoholic steatohepatitis (P = 0.007). The adjusted odds ratio of visualization score A was 0.249 (95% CI: 0.13-0.48) among those whose BMI was ≥25 kg/m2 vs. BMI < 25 kg/m2.
Conclusion:
Interobserver agreement between radiologists using US LI-RADS score was moderate. The majority of US examinations were scored as having moderate or severe limitations, and this was significantly associated with non-alcoholic steatohepatitis and increased BMI.
Introduction
Hepatocellular carcinoma (HCC) is the second most common cause of cancer-related death worldwide. 1 It most often occurs in the setting of chronic liver disease, commonly hepatitis B and C viruses, but cirrhosis of any etiology is a major risk factor. 2 Given the latency in progression of liver disease to HCC, and the curability of early HCC with surgical resection and other techniques, surveillance programs have been developed to identify early HCC in at-risk populations for prompt diagnosis and intervention.
Ultrasonography (US) with or without serum biomarkers (i.e. alpha-fetoprotein) is the most widely used method for HCC surveillance. 3 In 2004, the first prospective randomized controlled trial evaluating the efficacy of this approach was published (4). These data showed screening at 6-month intervals with ultrasound and serum alpha-fetoprotein facilitated timely identification of HCC in patients with chronic hepatitis B and ultimately reduced HCC-related deaths by 37%. 4 Since this study, US surveillance has been recommended by all major liver societies, and standards have been established for image interpretation and clinical management.5-8 However, the effectiveness of US for HCC surveillance in Western societies has been debated in the literature due to variations in disease profiles and patient size compared to the Asian populations initially studied.9-13 Although hepatitis B and C have historically been the most common causes of chronic liver disease predisposing to HCC, non-alcoholic steatohepatitis (NASH) is rapidly increasing in incidence worldwide.14,15 and is an increasingly important cause of HCC. 16 In general, subjects with NASH have a larger body habitus and more hepatic steatosis, making them less suited to sonographic evaluation.17,18
The American College of Radiology’s US Liver Imaging Reporting and Data System (LI-RADS) is a standardized system for imaging technique, interpretation, reporting, and data collection for surveillance ultrasound exams in patients at risk for developing HCC. 19 US LI-RADS includes assignment of an US visualization score, which provides a measure of the exam quality and expected sensitivity. The visualization scores are as follows: A, no or minimal limitations; B, moderate limitations; and C, severe limitations. Although US LI-RADS provides clear definitions detailing these 3 distinct US visualization scores, there is inherent subjectivity to this system. There are little data regarding interobserver agreement between radiologists using US LI-RADS visualization scores and clinical factors associated with US visualization scores.20,21 Therefore, the objectives of this study were to a) evaluate the interobserver agreement between radiologists using the LI-RADS US visualization score and b) assess for the association between US visualization score and cause of liver disease, sex, and body mass index (BMI).
Methods
This was a retrospective, single institution, cross-sectional study conducted at an academic tertiary referral center. Research ethics board approval and waiver of informed consent were obtained. Study procedures were performed in compliance with the Personal Health Information Act. Subjects were identified by searching the Picture Archiving and Communication System archive for consecutive HCC surveillance US scans between March 4, 2017 and September 4, 2017. This 6-month timeframe was selected in order to avoid duplicate subjects, as our local practice follow guidelines recommending US surveillance every 6 months. US examinations were performed by sonographers using either a General Electric LOGIQ E9 (General Electric Healthcare, Milwaukee, WI, USA) or a Philips IU 22 (Philips Healthcare, Cleveland, OH, USA).
Each subject’s medical record was reviewed and the underlying cause of liver disease, sex, and BMI were recorded. BMI (kg/m2) was categorized as follows: 22 <18.5 underweight, 18.5 to 24.9 normal or healthy, 25.0 to 29.9 overweight and >30 obese. During the study period, there was no standard lexicon or template for reporting of HCC surveillance ultrasounds and the decision to comment about technical limitations or suboptimal image quality was left to discretion of the reporting radiologist. Although US LI-RADS was not routinely used at our institution in 2017, the original radiologist’s report for each US examination was reviewed, and any comment regarding imaging quality was recorded. This was done to compare the historical practice of reporting imaging quality at our institution with the ratings derived by the subspecialist radiologists in this study.
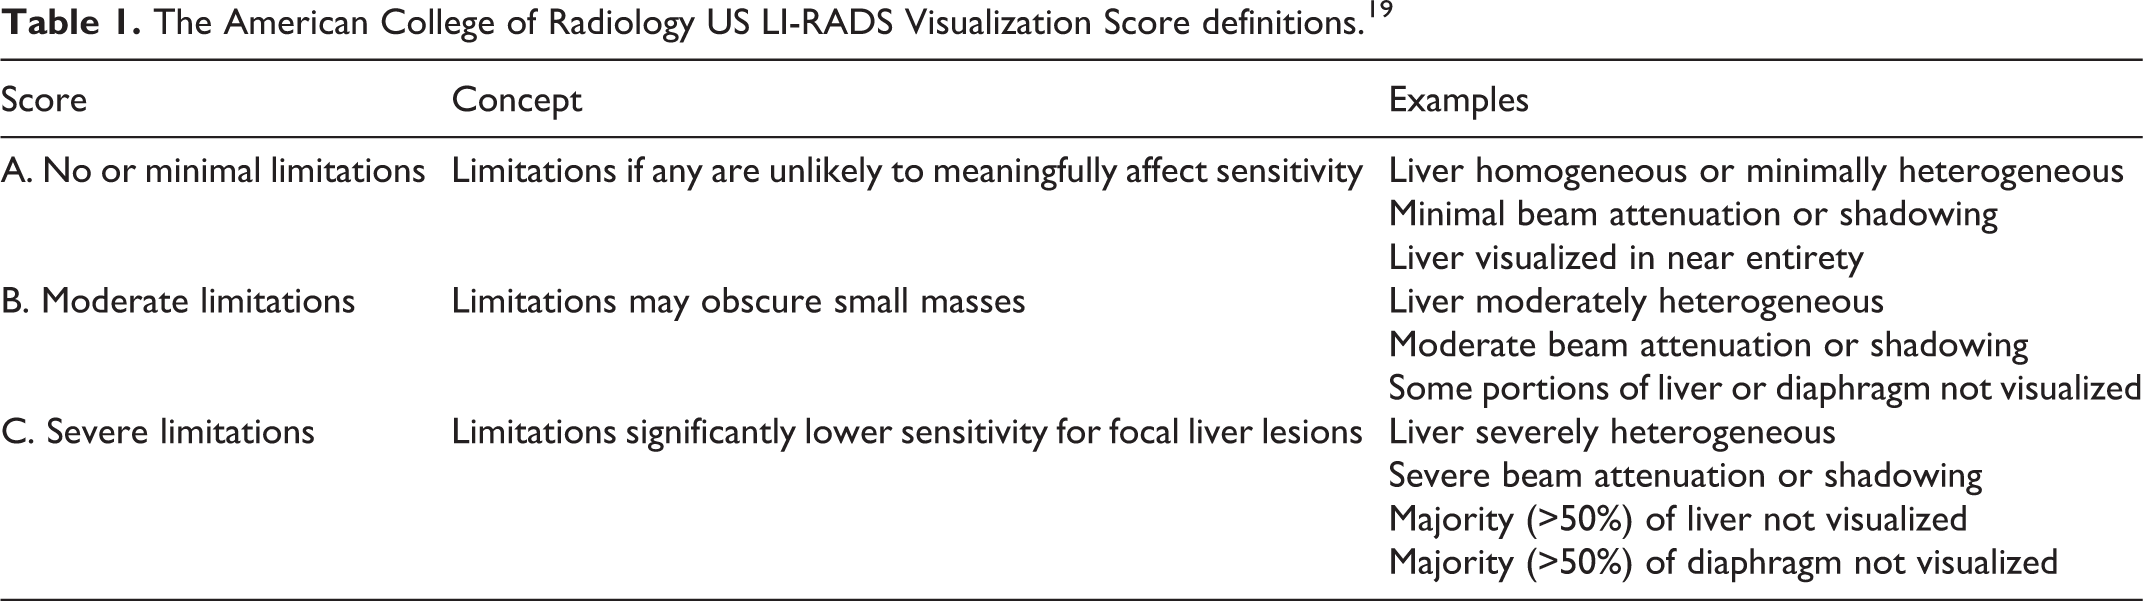
US surveillance examinations were anonymized and reviewed independently by 5 fellowship-trained sub-specialty abdominal radiologists. The mean number of years’ experience of the abdominal radiologists was 12 (range 5-18). Prior to independent review, the radiologists were familiarized with the US LI-RADS lexicon (Table 1) and reviewed a training set of 20 local example cases with US LI-RADS scores assigned in consensus by 2 radiologists (AC and SC). The training cases were not included in the study. For each US examination, the radiologists assigned an US LI-RADS visualization score and were blinded to the clinical report, sonographer comments and patient demographics, including age, sex, cause of liver disease and BMI.
The American College of Radiology US LI-RADS Visualization Score definitions. 19
Statistical Analysis
Descriptive statistics presented for continuous variables were expressed as mean ± standard deviation and ranges and for categorical variables as numbers and percentages. Interobserver variability on the US LI-RADS visualization score was evaluated using a weighted multi-reader Kappa statistic, using the following categories: 0 to 0.20 as slight, 0.21 to 0.40 as fair, 0.41 to 0.60 as moderate, 0.61 to 0.80 as substantial, and 0.81 to 1 as almost perfect agreement. 23 Univariate and multivariate logistic regression analyses were used to evaluate the association between US visualization score (score A vs. B or C) and cause of liver disease, sex and BMI. For univariate and multivariate analyses, the US LI-RADS visualization score used was the mode of the 5 radiologists’ scores. The cause of liver disease was grouped into NASH, viral, and other (which included alcohol, as well as rare, unknown, and multifactorial causes of liver disease as detailed in Table 2) to consolidate the low frequency liver disease categories into a single category for logistic regression analysis. Statistical analyses were performed using R language for statistical computing. 24 A P value <.05 was considered significant. Confidence intervals (CIs) were set at 95%.
Summary of Patient Characteristics.
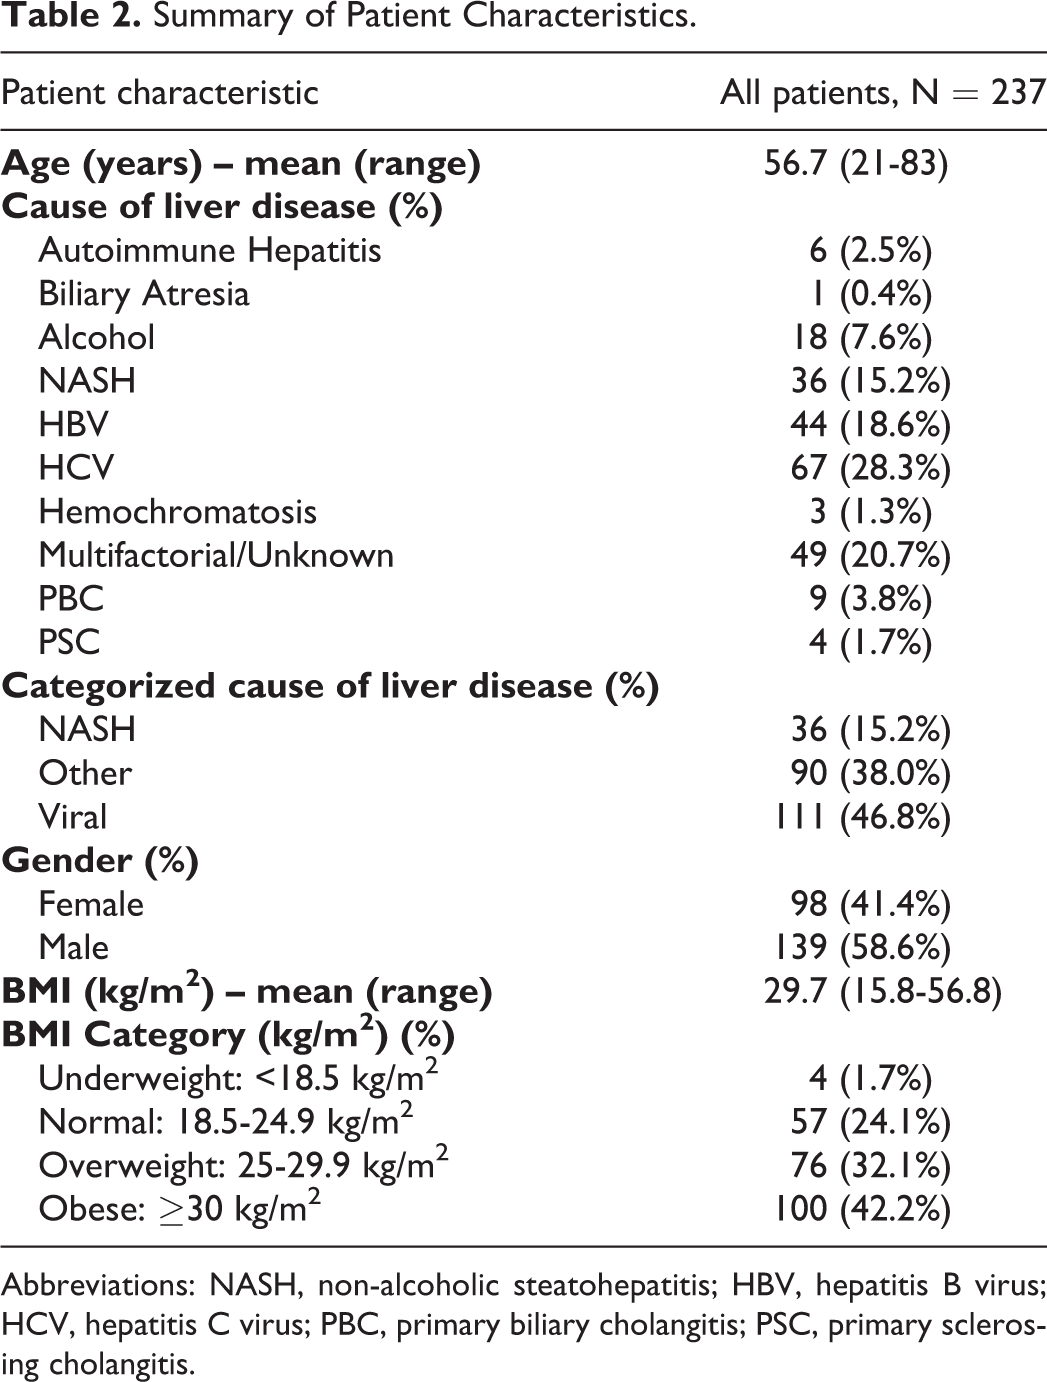
Abbreviations: NASH, non-alcoholic steatohepatitis; HBV, hepatitis B virus; HCV, hepatitis C virus; PBC, primary biliary cholangitis; PSC, primary sclerosing cholangitis.
Results
In total, 253 US screening or surveillance scans for 253 individual subjects were identified. 16 subjects were excluded because BMI was unavailable, leaving 237 subjects for analysis (Figure 1). There were 98 female and 139 male subjects with an average age and BMI of 56.7 years and 29.7 kg/m2, respectively. 176/237 (74.3%) of the subjects had a BMI ≥ 25 kg/m2. The study population demographics are summarized in Table 2. The clinical report mentioned technical difficulty acquiring diagnostic quality images in 22/237 (9.2%) cases; in 4/237 (1.7%) cases, the exam was considered non-diagnostic or suboptimal by the reporting radiologist.
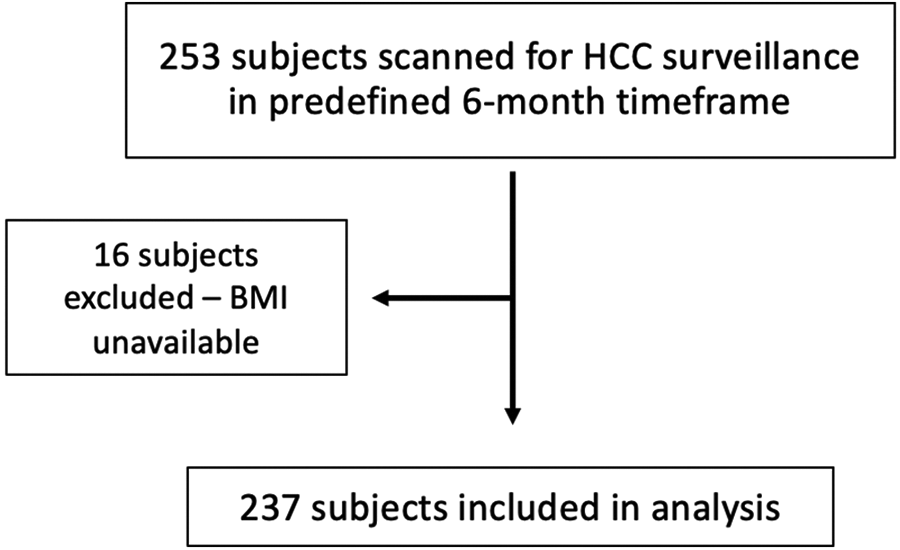
Chart illustrating the flow of participants through the study.
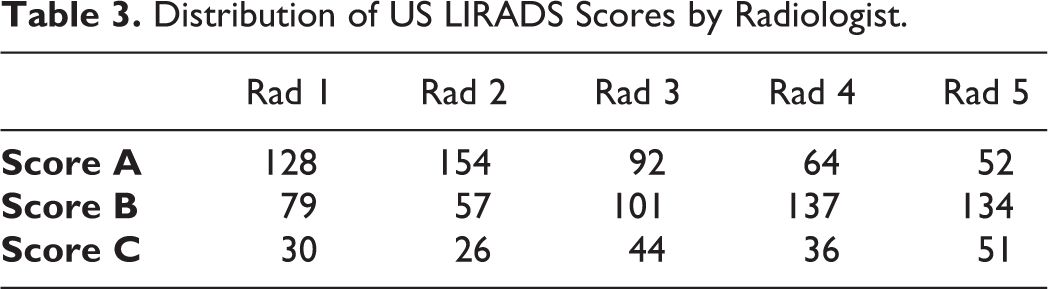
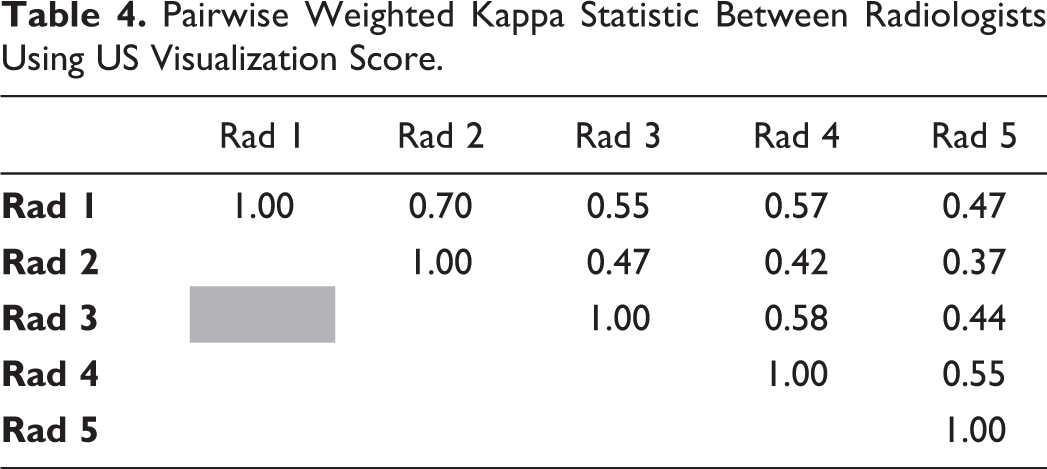
The distribution of visualization scores by each radiologist is documented in Table 3. The average weighted Kappa for all raters was 0.51 (moderate agreement). Pairwise weighted Kappa ranged from 0.37 (fair agreement) to 0.70 (substantial agreement) and are shown in Table 4.
Distribution of US LIRADS Scores by Radiologist.
Pairwise Weighted Kappa Statistic Between Radiologists Using US Visualization Score.
The majority of radiologists (3 or more) gave a visualization score of C to 30/237 (12.7%) cases, a score of B to 99/237 (41.8%) and a score of either B or C to 148/237 (62.4%) cases. Only 89/237 cases (37.6%) were scored as A by the majority of radiologists. All 5 radiologists gave a visualization score of C to 6/237 (2.5%) cases, a score of B to 13/237 (5.5%) and a score of either B or C to 67/237 (28.3%) cases. A visualization score of A was unanimously assigned to 33/237 (13.9%) of cases. Figures 2-4 show example cases where all radiologists agreed on a visualization score of A, B and C, respectively.
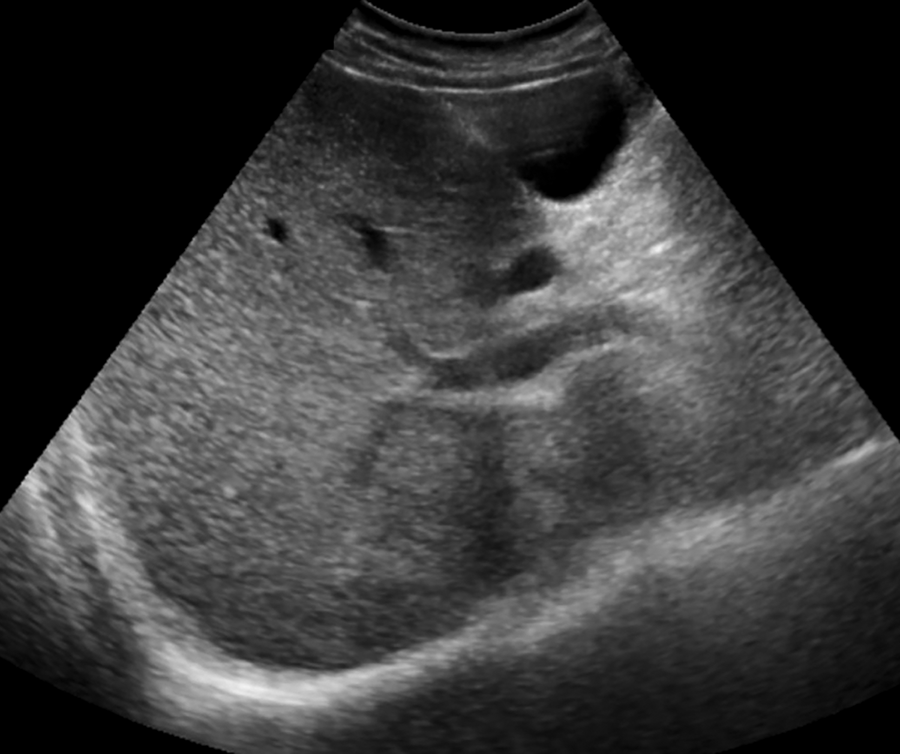
A 48-year-old man with multifactorial chronic liver disease. A representative transverse sonographic image of the right lobe shows good visualization of the liver parenchyma and hemidiaphragm. This examination was given visualization score of A by all 5 radiologists.
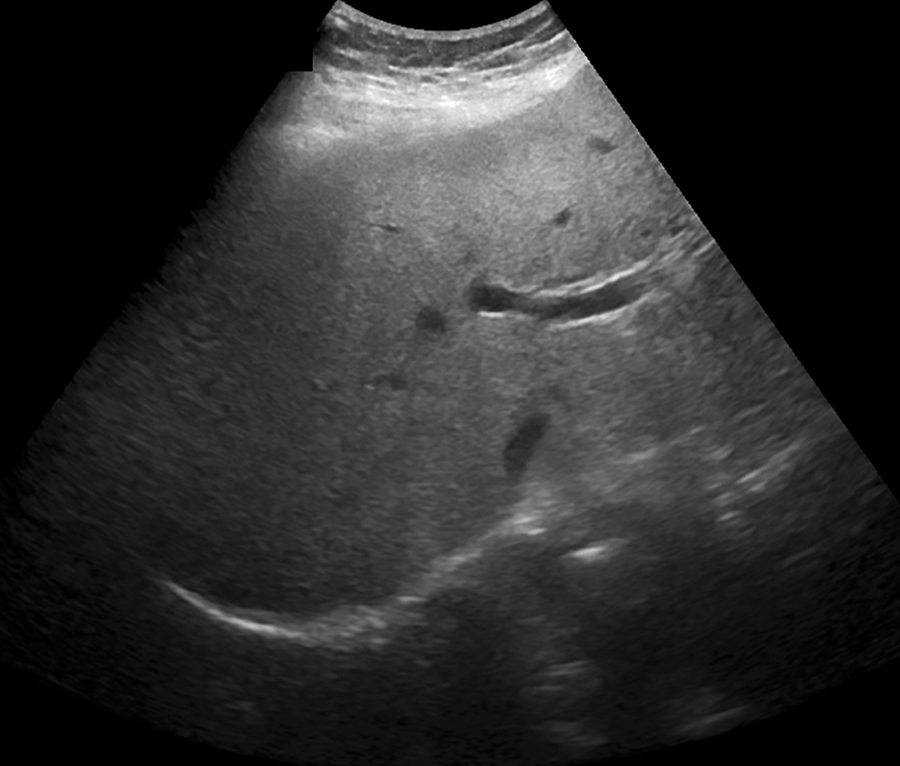
A 60-year-old woman with NASH. A representative sonographic image of the right lobe of the liver demonstrates that some parts of the deeper right lobe are not well seen. All 5 radiologists gave this examination a visualization score of B.
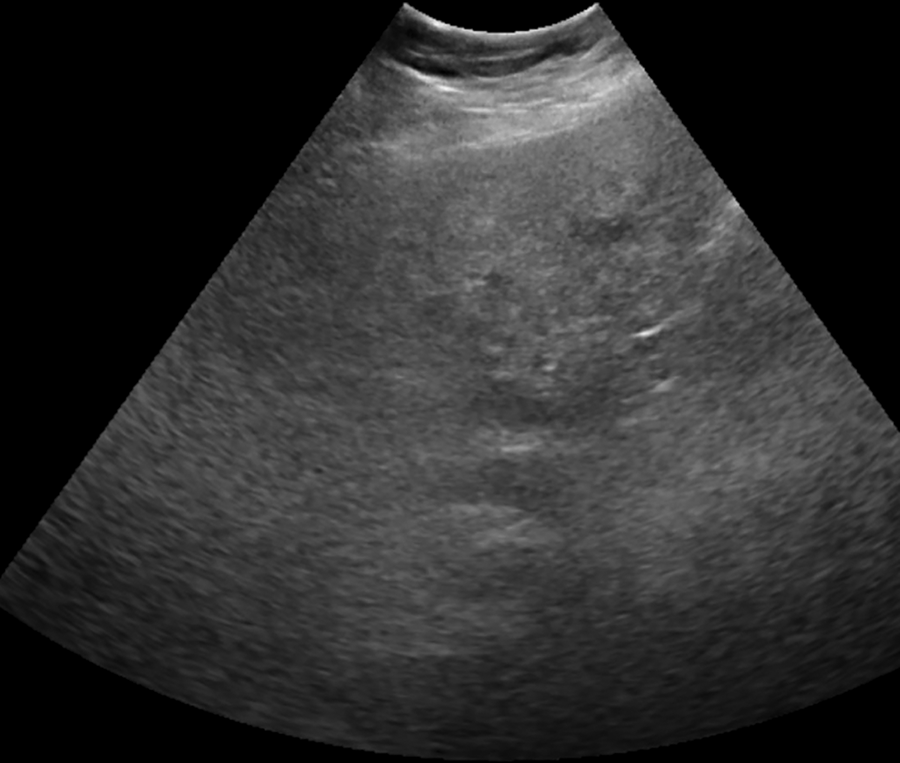
A 67-year-old woman with multifactorial chronic liver disease. A transverse sonographic image of the right lobe shows that the majority of the right lobe is not well seen and the hemidiaphragm is not visualized. All 5 radiologists assigned this examination a visualization score of C.
Univariate logistic regression analysis (Table 5) showed that cause of liver disease (P = 0.014) was statistically significantly associated with visualization (US LI-RADS score of B or C). Subjects with viral liver disease were 3.32 times (95% CI: 1.44-8.38) more likely to have a score of A (no limitations) compared to those with NASH (P = 0.007). Subjects with other causes of liver disease were 2.23 times (95% CI: 0.94-5.74) as likely to be assigned a score of A than those with NASH, although this was not statistically significant (P = 0.079). Univariate analysis also showed a significant association between limited visualization and BMI (P < 0.001). Subjects with BMI ≥ 25 kg/m2 were 0.23 (95% CI: 0.12-0.42) times as likely to have a score of A than those who with BMI < 25 kg/m2. There was no statistically significant association between limited visualization and sex (P = 0.811) on univariate analysis.
Results of Univariate and Multivariate Logistic Regression Assessing Association Between US Visualization Score and Clinical Factors.
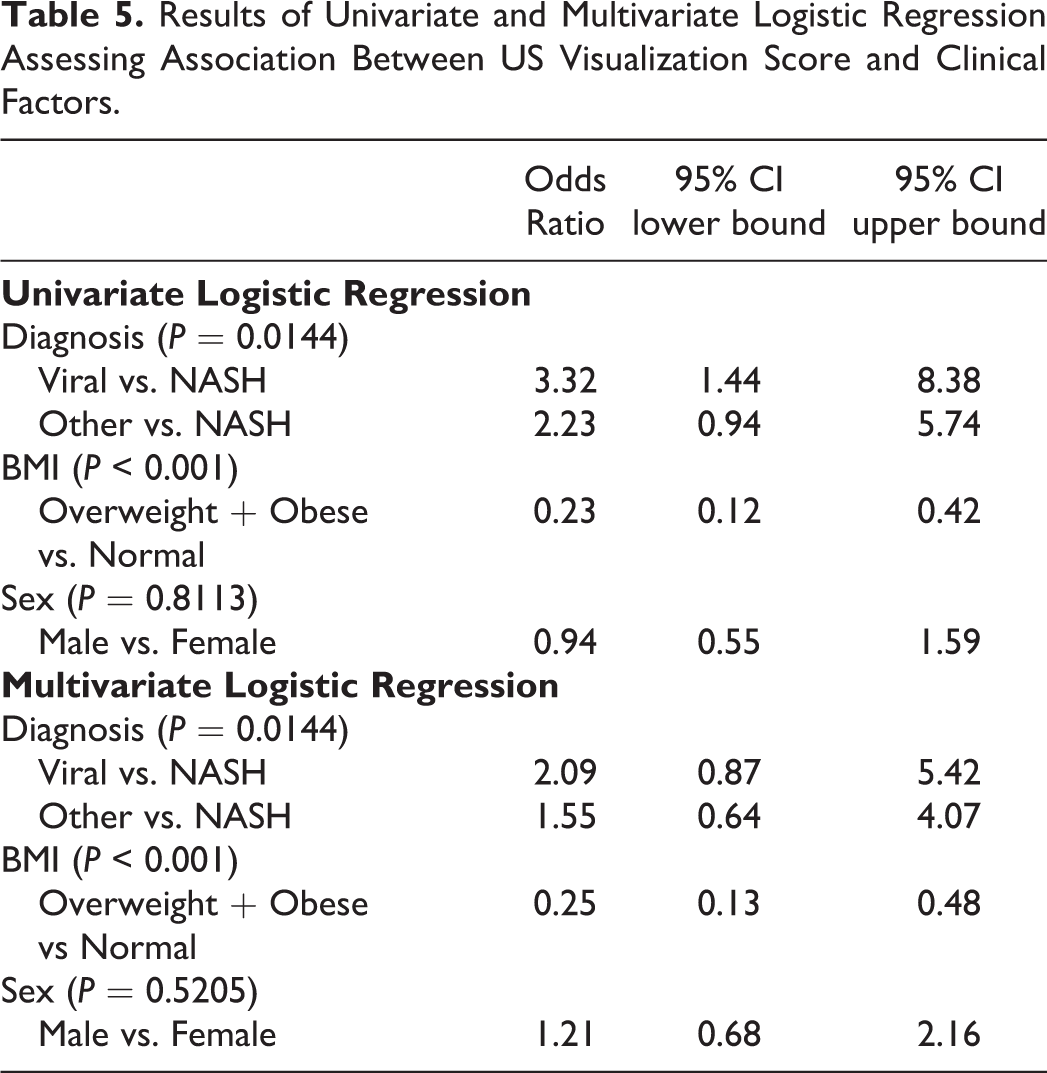
Multivariate logistic regression analysis (Table 5) showed that visualization was significantly associated with the cause of liver disease (P = 0.014) and BMI (overweight or obese subjects vs. normal or underweight; P < 0.001). There was no association between sex and visualization (P = 0.521). The adjusted odds of visualization score A was 0.249 (95% CI: 0.13-0.48) among those who are overweight and obese (P < 0.001) compared to those who were normal or underweight.
Discussion
This study showed that, among 5 subspecialist abdominal radiologists, there was moderate interobserver agreement using the US LI-RADS visualization score. Visualization score was significantly associated with NASH etiology of liver disease and overweight or obese BMI. On multivariate analysis, BMI ≥ 25 kg/m2 emerged as an independent risk factor for a visualization score of B or C. These results imply that sensitivity of HCC surveillance US may be reduced in patients with NASH cirrhosis and/or increased BMI due to high frequency of moderately or severely limited sonographic visualization.
The percentage of cases with moderate or severe limitations (visualization score B or C), as determined by the majority of the radiologists, was substantial at 66%. In fact, 30% of cases were deemed to have moderate or severe visualization limitations by all 5 radiologists. This is in stark contrast to the low percentage (9.2%) of clinical reports that mentioned technical limitations or suboptimal image quality. These findings indicate that reporting radiologists are often not communicating limitations of US surveillance examinations to referring physicians. The implication of a moderately or severely limited US examination is that the sensitivity of the examination is likely decreased; this can result in delayed diagnosis and missed opportunity for curative treatment of HCC. Our results reinforce the value of the US LI-RADS lexicon to improve communication between radiologists, patients and referring physicians.
The criteria for US LI-RADS visualization score are general and therefore a degree of interobserver variability was expected; however, our results revealed a wider range of interobserver agreement than previously reported. No other studies of US visualization score with more than 2 reviewers were found in the literature. In the study by Son et al. 21 the Kappa statistic between 2 experienced abdominal radiologists was 0.7, which represents the upper limit of the pairwise weighted Kappa coefficients in our analysis. This difference may, in part, be due to the fact that in that study, the radiologists performed the ultrasound examination themselves rather than relying on still images provided by sonographers.
In our study, the percentage of cases with visualization scores of B or C is higher than previously reported by Millet et al. 20 and Choi et al. 25 In the study by Millet et al., US visualization scores B and C were 388/2050 (18.9%) and 87/2050 (4.2%) of cases, respectively, for a total of 23.2%. Choi et al. found visualization score B in 22% and C in 3% of the cases. Our results are similar to Son et al., where cases with US visualization score B and C were 114/407 (28.0%) and 112/407 (27.5%), respectively, for a total of 55.5%. 21 It is noted that the US visualization scores were determined differently in each study, which could account for some of the variability. In Millet et al. 20 and Choi et al. 25 the US score was extracted from clinical reports, in Son et al. 21 it was assessed by subspecialty radiologists performing the sonographic examination. In our study, the score was retrospectively assigned by subspecialty radiologists blinded to sonographer comments.
The results of univariate and multivariate analyses revealed that liver disease and BMI are significantly associated with visualization (US LI-RADS score of B or C) in subjects undergoing HCC surveillance US at our institution. Son et al. also found that BMI was associated with the visualization score on univariate analysis but did not show a significant association between the cause of liver disease and the visualization score. 21 It is noted that Son et al. compared US visualization score A or B vs C, whereas we compared A vs B or C, which may, in part, explain this difference. Another potential factor contributing to these discrepant findings is the differing population demographics - 80% of the subjects in that study had viral hepatitis and less than 7% had NASH, compared to 47% viral hepatitis and 15% NASH in our study. The average and range of BMIs in Son et al. were lower and more narrowly distributed compared to our study with an average of 24.3 kg/m2 (range of 22.4-26.8 kg/m2) vs. 29.7 kg/m2 (range 15.8-56.8 kg/m2), respectively. 21 This is consistent with the larger proportion of subjects with NASH, which is associated with obesity and the metabolic syndrome, in our study. Conversely, Millet et al. found that NASH as the etiology of cirrhosis was a significant independent risk factor of moderate to severe limitations in visualization. 20 The distribution of viral hepatitis and NASH (58% and 11% of cases, respectively) was closer to the percentages that we have reported. BMI was not included in their analysis. Although a study by Simmons et al. predated US LI-RADS, multivariate analysis showed that body mass index category as well as alcohol-related and NASH cirrhosis were associated with inadequate ultrasound quality in surveillance US examinations. 18
A particularly difficult management question is how to follow a patient whose ultrasound exam is considered to be severely limited (visualization score C). The US visualization score is currently not incorporated in the management algorithm of the US LI-RADS tool. To date, there is no consensus as to a surveillance strategy that is clinically appropriate and economically sustainable in such patients, including whether recommendation of additional imaging with contrast-enhanced multiphasic imaging is warranted. 19 Other investigators have argued for the use of abbreviated liver MRI for HCC surveillance, given the increasing rates of obesity and challenges associated with US imaging of obese patients. 26 Future areas of research could include determining the impact of US visualization score on sensitivity for HCC detection, stage at diagnosis and overall survival. The efficacy of alternative surveillance strategies for subjects with poor visualization scores should be explored.
Our study had limitations. This study was performed at a single academic center and results may not be generalizable to institutions with different demographics; for example, our study population had a larger number of NASH subjects and a higher BMI than reported elsewhere.21,25 At our center, sonographers typically record whether the exam was routine or technically difficult, and if so, for what reason. In this study, the radiologists were blinded to the sonographers’ comments in order to reduce bias, although this is dissimilar from clinical practice and may have overestimated the degree of inter-reader variability. Finally, the reasons for poor visualization were not recorded. Factors affecting ultrasound visualization can be categorized as extrinsic or intrinsic to the liver. Intrinsic factors are unlikely to change over time and include severe hepatic steatosis or parenchymal heterogeneity. Extrinsic factors, such as inability to cooperate with breath-holding, limited mobility, or overlying bowel gas may potentially change between examinations and with ultrasound scanning technique. Future work could incorporate these reasons in conjunction with prospective evaluation of sonographer experience.
In conclusion, our study found that the interobserver agreement between radiologists assigning US LI-RADS visualization scores was moderate. Examinations with moderate or severe limitations in visualization were common in our study population but mention of these limitations were infrequently included in the original surveillance US report. Adoption of the US LI-RADS visualization score may improve communication between radiologists, patients and referring physicians. Worse visualization was significantly associated with NASH and higher BMI. The implication of this finding is that the sensitivity of US may be reduced in these patient populations, and thereby result in diagnostic delays and potentially missed opportunities for treatment with curative intent.
Footnotes
Abbreviations
Declaration of Conflicting Interests
The author(s) declared the following potential conflicts of interest with respect to the research, authorship, and/or publication of this article: Dr. Clarke acknowledges research funding from GE Healthcare for an unrelated project.
Funding
The author(s) received no financial support for the research, authorship, and/or publication of this article.