
Abstract
This is a visual representation of the abstract.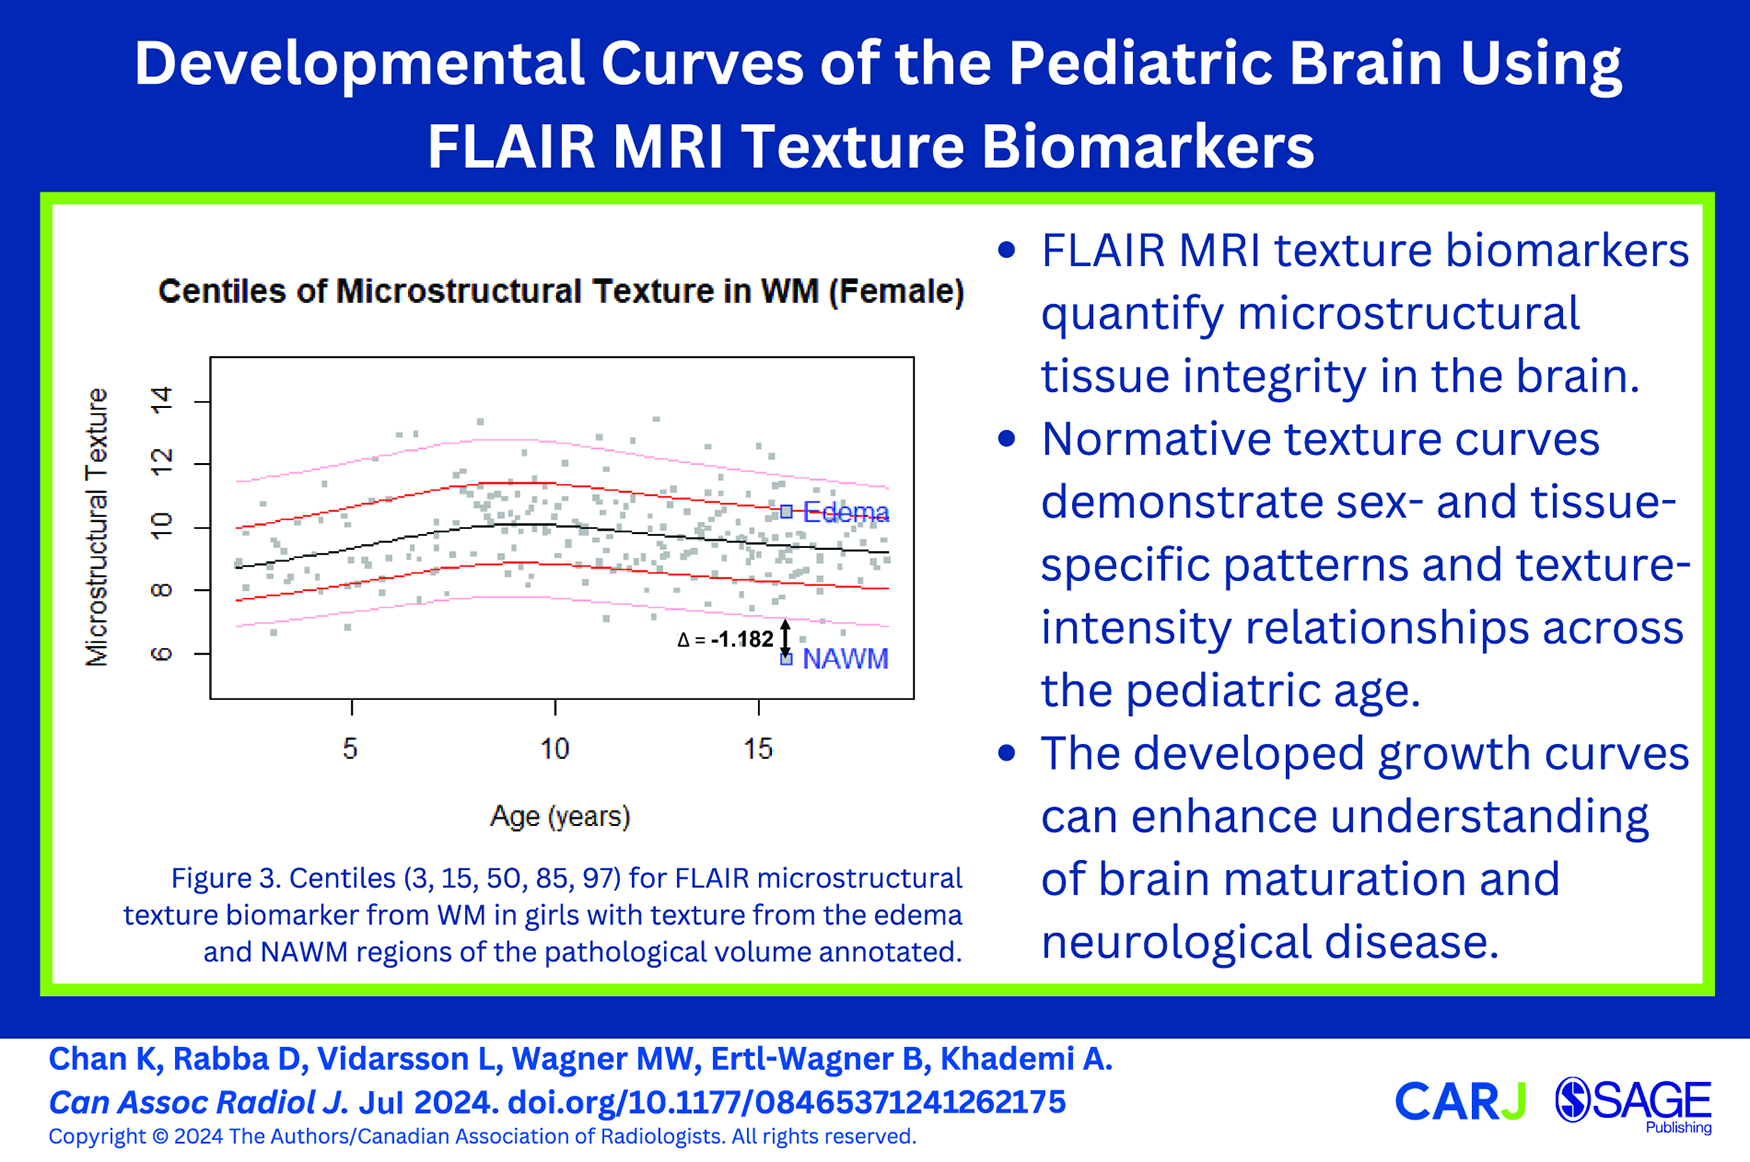
Introduction
Abnormal brain development in children is seen in various diseases and disorders, including autism spectrum disorder, attention deficit/hyperactivity disorder, and epilepsy. 1 Maturation curves can be used to identify children with typical, delayed, or abnormal brain development. Normative maturation trajectories have been established for various MR imaging sequences in the paediatric age range.2-4 However, FLAIR sequences, although a mainstay of brain imaging, have limited information on maturation trajectories because signal intensities vary across MRI scanners and sequences. This work applies the FLAIR signal intensity standardization algorithm presented in a previous study 5 to overcome this variability. FLAIR signal intensities have shown to be related to lipid and water content 6 and may serve as indicators of maturation-related structural brain development.
Previous studies have shown that FLAIR texture parameters, which measure regional fluctuations in signal intensity, are related to cognition and robustly discriminate between neurodegenerative diseases in adults.7,8 FLAIR texture was correlated to MD and FA in adult populations, indicating that FLAIR texture is related to water content and diffusion.7,8 We hypothesize that FLAIR texture biomarkers can add value to maturation curves of the paediatric brain as they may provide supplementary information on tissue microstructure.
Percentile reference curves are standard tools describing the normal range of a parameter with respect to age. In clinical practice, physicians use percentile curves to evaluate measured values of patients. Comparing measurements to a reference standard aids in quantifying abnormalities against normative values. A limited set of percentile curves exist for paediatric parameters related to neurodevelopment, including brain volume, cortical thickness, total surface area, and head circumference.9-11 The World Health Organization (WHO) publishes internationally accepted growth curves for children younger than 5 years, including head circumference reference values for age and sex. 9 A study by Zhang et al quantified annual changes of cortical thickness and subcortical volume of developing children between 1 and 6 years old using growth curve models. 10 Lastly, Bethlehem et al aggregated 123 984 MRI scans between 115 days post-conception to 100 years of age. This provided brain curves over the human lifespan for regional volumes, mean cortical thickness, and total surface area which identified previously unreported neurodevelopmental milestones. 11
In this work, we aimed to assess a novel texture biomarker from T2-weighted FLAIR MR imaging in individuals 2 to 19 years of age without structural abnormalities to establish age- and sex-specific normative developmental curves.
Materials and Methods
Data
This study was approved by the local institutional review boards of a large Canadian university and hospital. Due to the retrospective nature of the study, informed consent was waived by the local research ethics board (2021-430-3). T2-weighted FLAIR and 3D T1-weighted MRI sequences were acquired in the clinical setting. All brain MRIs were reported as unremarkable by a paediatric neuroradiologist (M.W.). Imaging was acquired across MRI scanners from two vendors (Achieva, Philips Healthcare; Magnetom Skyra, Siemens), at field strengths of 1.5 T or 3 T. FLAIR sequences had section thicknesses of 3 to 5 mm and in-plane voxel dimensions of 0.6 to 1 mm, and TR, TI, and TE of 7 to 10 s, 2.3 to 2.9 s, and 85 to 150 ms respectively. 3D T1-weighted sequences had section thickness of 1 to 2 mm, in-plane voxel dimension of 1 mm, and TR, TE, and flip angle of 6 to 10 ms, 2 to 5 ms, and 7° to 15°, respectively.
Image Processing
FLAIR volumes were registered to the T1 space using the Advanced Normalization Tools symmetric normalization, 12 bias field-corrected, 13 and intensity normalized.5,14 FreeSurfer Version 7.2 15 was used to segment WM and GM regions on 3D T1-weighted images, and the masks were verified by a paediatric neuroradiologist (M.W.). GM subregions, deep GM (dGM), and cortical GM (cGM) were also segmented and verified. Segmentations were used to mask the respective regions of the FLAIR images and biomarkers were extracted from each region.
The texture biomarker extraction pipeline is demonstrated in Figure S1. FLAIR texture was investigated to measure the amount of local variations in signal intensity in a small window and a modified version of the microstructural marker in Bahsoun et al 7 was used. For each slice, a local texture metric was computed as the average difference in signal intensity between the central window pixel and its neighbouring pixels (Supplementary Equation (1)). For regions with heterogeneous texture, there are rapid fluctuations in signal intensity and a large variation which result in a large value for texture. In smooth regions, the intensities are similar to one another, resulting in small variations and texture values. To analyze fine texture, the texture volume was Otsu thresholded 16 and only the low amplitude variations were considered. 7 The fine texture volumes were then masked per region to analyze texture in the WM and GM (cGM/dGM) regions separately. To maximize signal, as in Bahsoun et al, 7 each regional texture volume was voxel-wise averaged across slices to yield mean 2D texture maps for GM, WM, dGM, and cGM. The median value of each regional texture map was taken as the final texture biomarker of the region.
FLAIR signal intensity and volume biomarkers were also extracted from each region investigate the correlations between texture and the 2 clinically established biomarkers. The FreeSurfer segmentations were used to mask the respective regions and the FLAIR signal intensity was obtained by computing the mean standardized FLAIR signal intensities per region. The volume biomarker was computed by summing up the voxels in each region and multiplying by the voxel resolution. To consider differences in head size, volumes were normalized by the intracranial volume (ICV).
Statistical Analysis
ANOVA was used to investigate differences in texture biomarker means between age groups with a significance level of P < .05. Growth curves were fitted using Generalized Additive Models for Location, Scale, and Shape (GAMLSS). Pearson’s correlation analyses were performed to investigate relationships between the texture biomarker and signal intensity and volume per tissue, with significance level set at P < .05.
The GAMLSS model was used as the standard for creating percentile curves according to the WHO. 17 It uses P-spline functions for estimating the mean, variance, skewness, and kurtosis distribution parameters of the measured variable with respect to age.18,19 As in the methods in Nagy et al, 20 all possible GAMLSS distributions were evaluated using the Akaike Information Criterion (AIC) estimator. The distribution with the lowest AIC score was chosen as the best fit model. The best-fit model was further verified through the model residuals—a model is well fit if the residuals are standard normal, or linear on its Q-Q plot. Percentile curves were plotted according to WHO standards, showing centiles 3, 15, 50, 85, and 97. 21 Growth curves were modelled by tissue type and sex.
Proof-of-Concept Using Pathological Data
To examine the clinical applicability of the proposed growth curves in detecting abnormal neurodevelopment, a pre-operative MRI of a 15-year-old with a paediatric low-grade glioma was analyzed as proof-of-concept of real-world diagnostic and monitoring utility. We extracted texture and intensity biomarkers from the normal appearing white matter (NAWM) and the edema region surrounding the tumour, and plotted the biomarkers on the normative WM growth curves.
Results
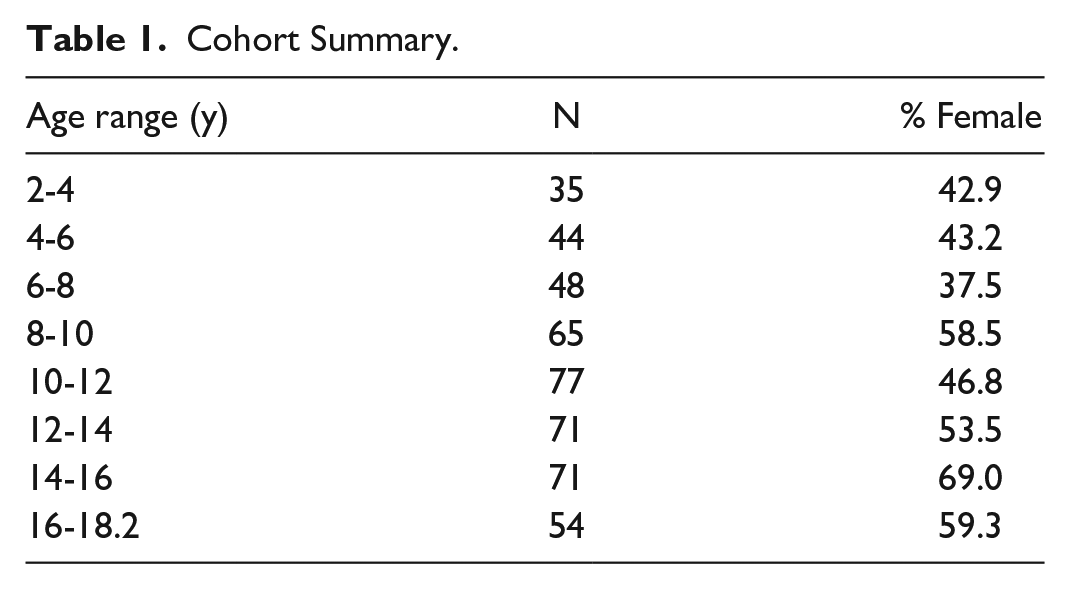
Axial FLAIR and sagittal 3D T1-weighted FLAIR sequences of 512 children between 2 and 19 years of age were included in the study. Forty-seven data sets with marked registration errors and poor segmentation masks were excluded, leading to a final data set of 465 FLAIR and T1-weighted sequences (mean age of 10.65 years and 220/245 male/female split), summarized in Table 1.
Cohort Summary.
FLAIR Biomarker Extraction
Summary statistics of the biomarkers extracted from the paediatric MRI are shown in Tables S1 to S3. The mean 2D texture maps of the GM, WM, cGM, and dGM of different ages are shown in Figure 1. ANOVA tests demonstrated significant differences (P < .01) in texture biomarker means between age groups for all tissue regions (Table S1). Boxplots showing the difference in texture biomarkers over the paediatric age range can also be found in Figure S2.
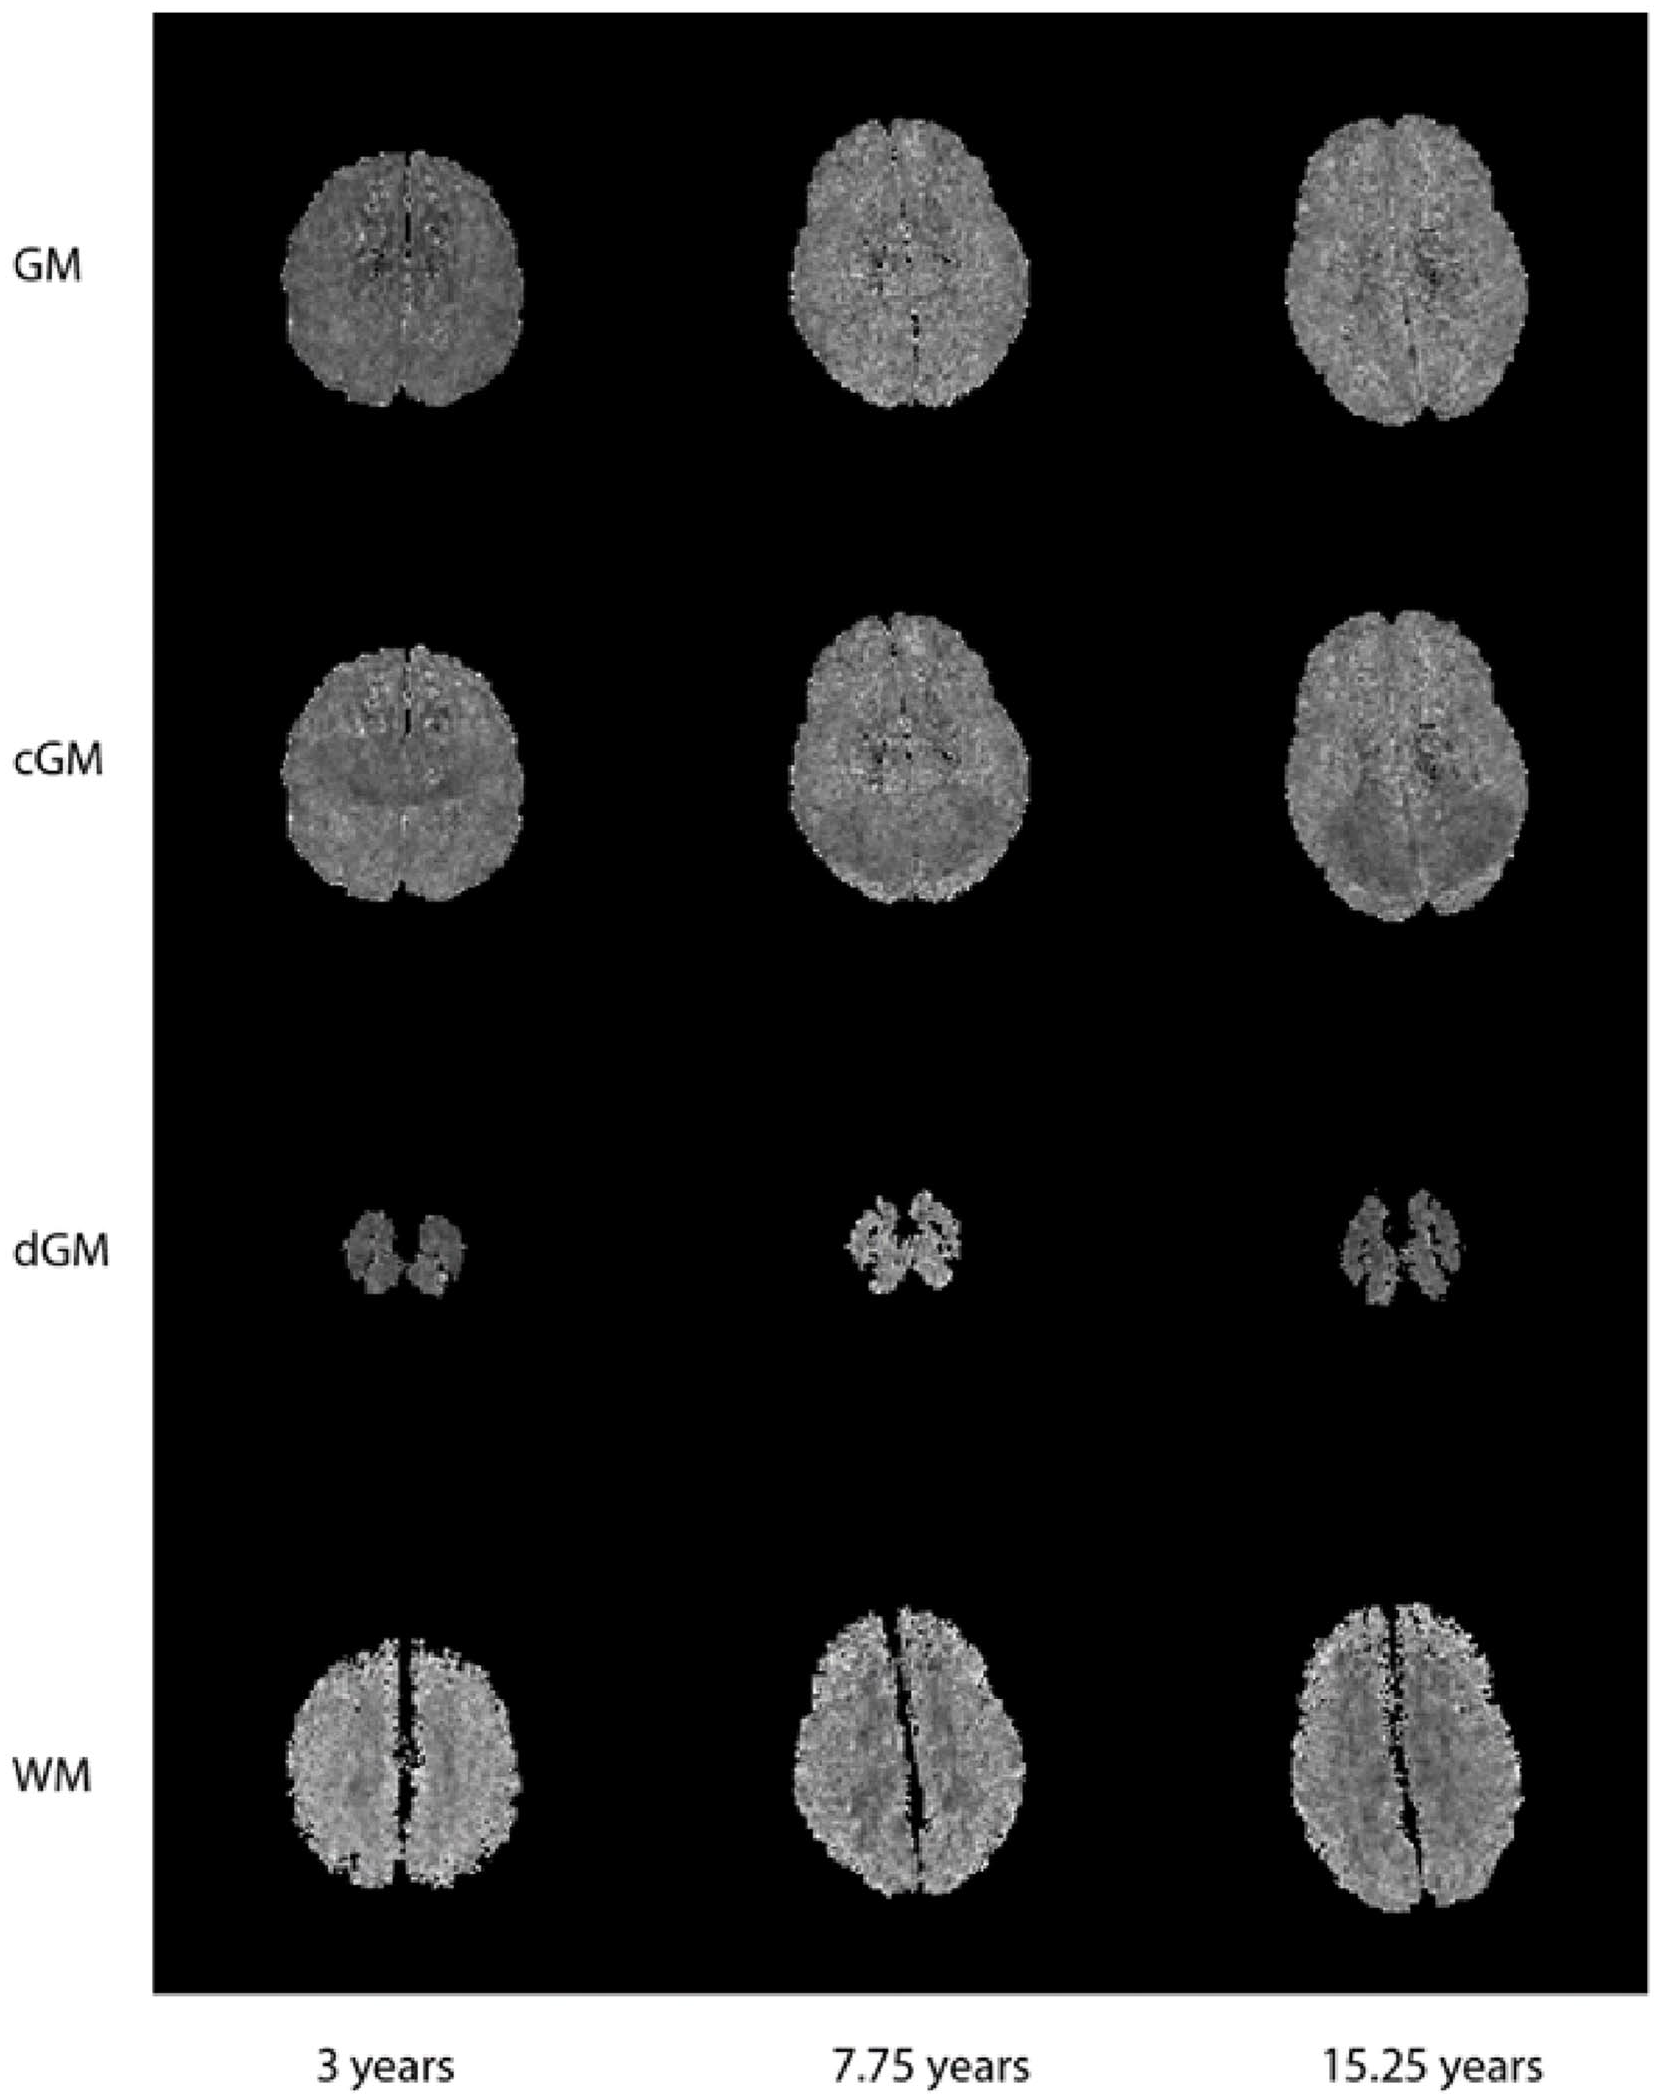
Sample mean 2D texture maps of the GM, cGM, dGM, and WM of different ages.
Growth Curves
GAMLSS growth curves were developed for the texture biomarker of each region. The parameters found for the best fit models are shown in Table S4. All residuals were found to be standard normal distributions in the proposed models, and the corresponding residual plots can be found in Figure S3. The final texture growth curves of girls and boys for GM and WM are shown in Figure 2. Plots for the entire population sample along with cGM and dGM curves are shown in Figures S4 and S5. For completeness, and examination of the pathological case, the WM intensity growth curve results are also shown in Figure S6 and Table S5.
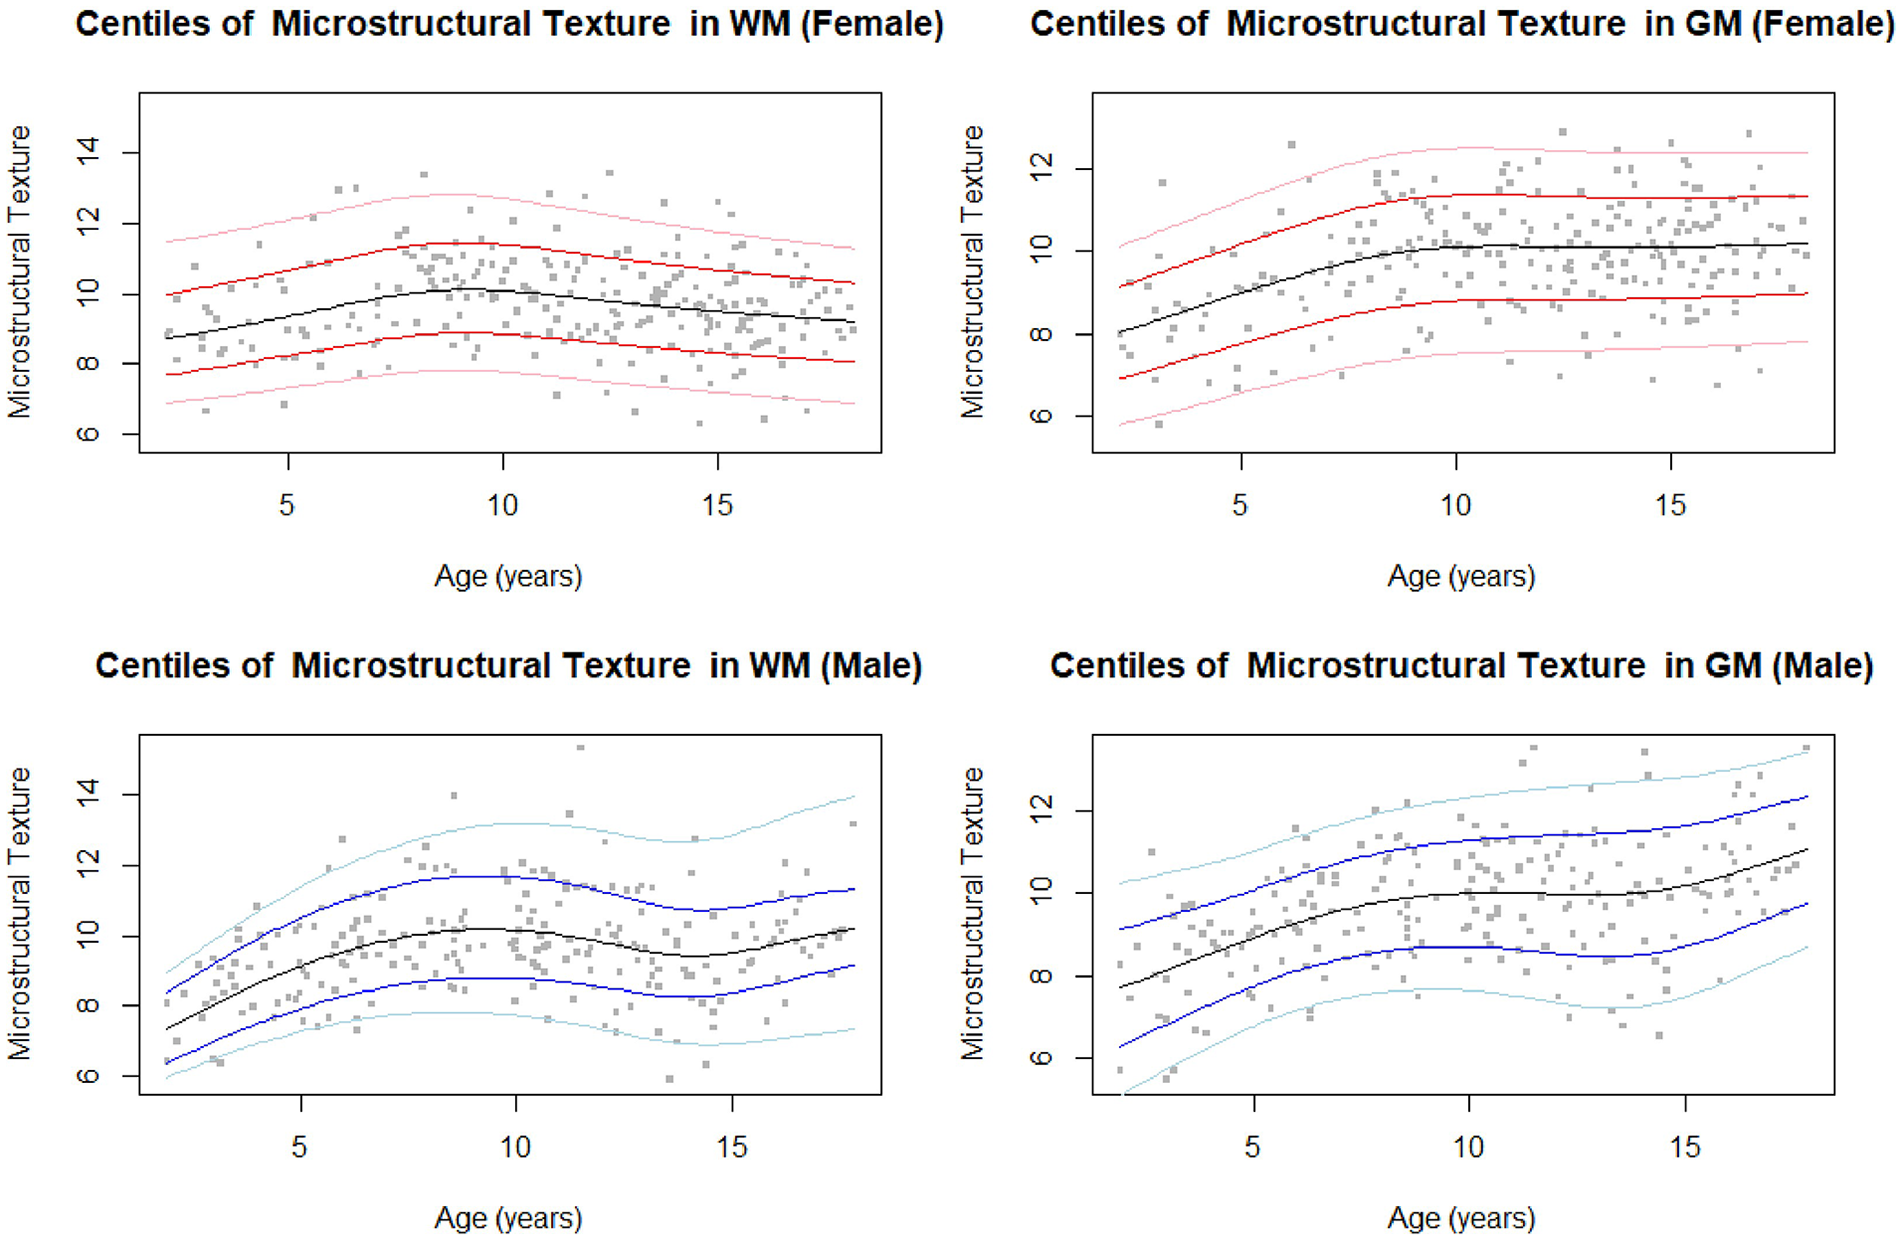
Centiles (3, 15, 50, 85, 97) for FLAIR microstructural texture biomarker from GM and WM in girls (top) and boys (bottom).
For WM tissue regions, the texture feature demonstrated a maximum “roughness” at approximately 10 years of age for both girls and boys. The WM texture for girls demonstrated a slight constant decrease after 10 years, while boys demonstrated an increasing texture trend in adolescence after 14 years of age. In GM, FLAIR texture increased with age for both boys and girls, with a peak around 10 years of age. As was found in a previous study, 5 the patterns of the GM closely resembled those of the cGM, with dGM showing slightly different patterns. The dGM texture curve in females was relatively constant, while the dGM texture curve in males demonstrated slight increase in texture with age.
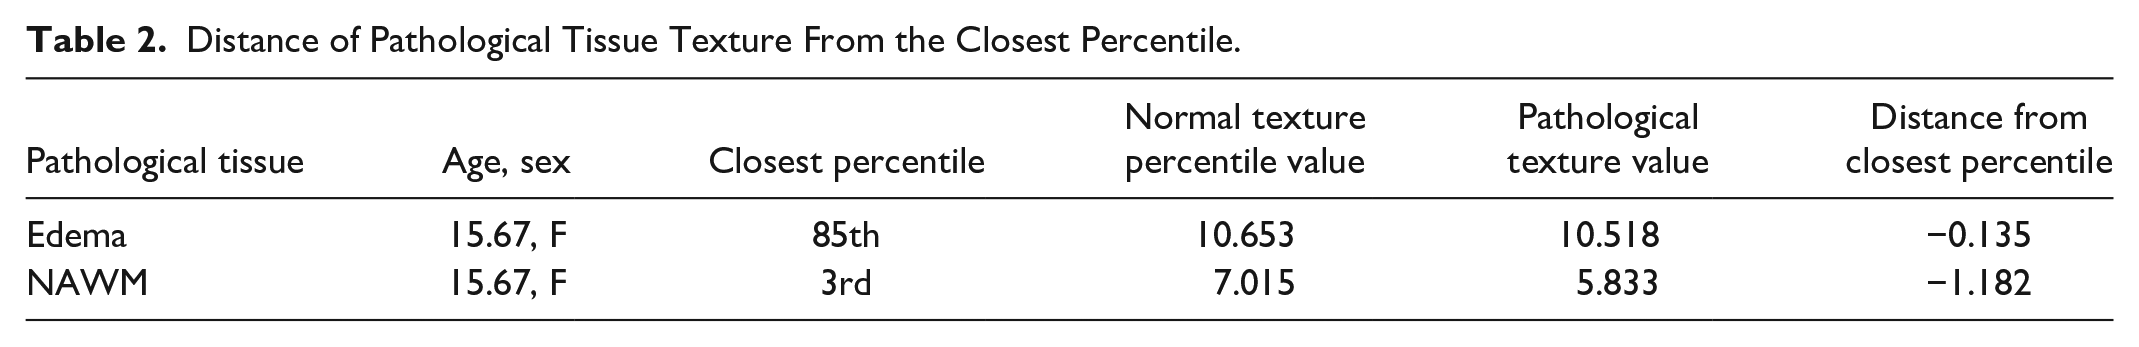
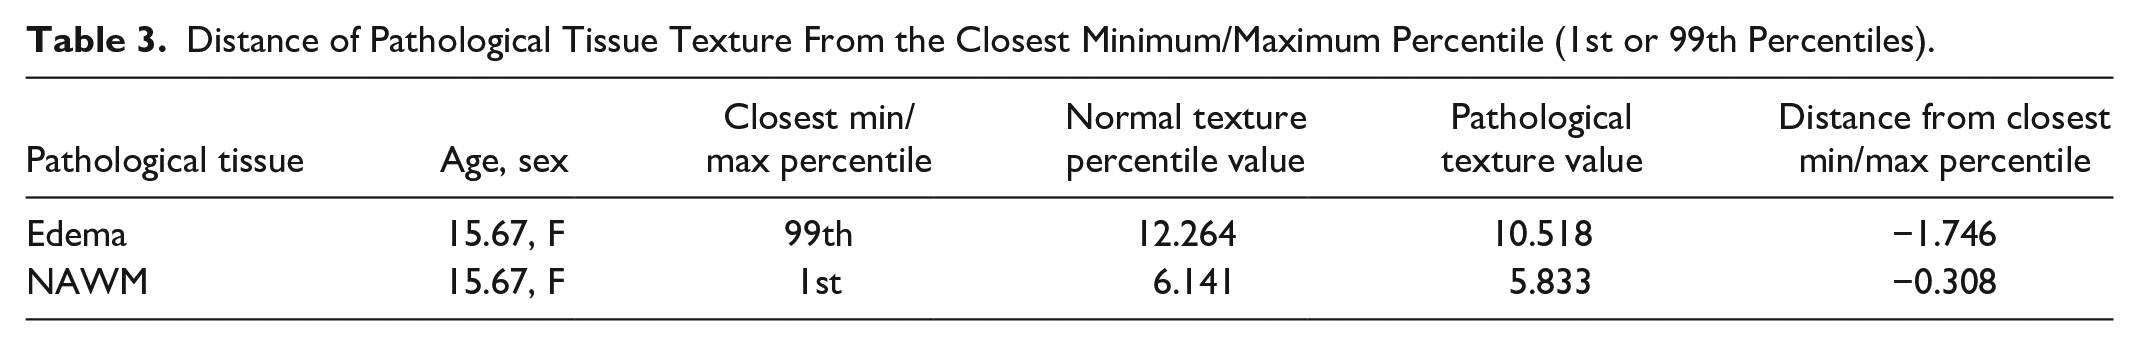
Figure S7 demonstrates images of a paediatric low-grade glioma with biomarkers from the surrounding edema and the NAWM to demonstrate proof of concept. The texture of the edema falls around the 85th percentile on the WM curve, while the NAWM demonstrated a texture value outside of the normative curves, 0.308 lower than the 1st percentile for that age (Figure 3, Tables 2 and 3). On the intensity growth curve, the edema demonstrated abnormally high signal intensity, while the NAWM intensity was around the 85th centile (Figure S6).
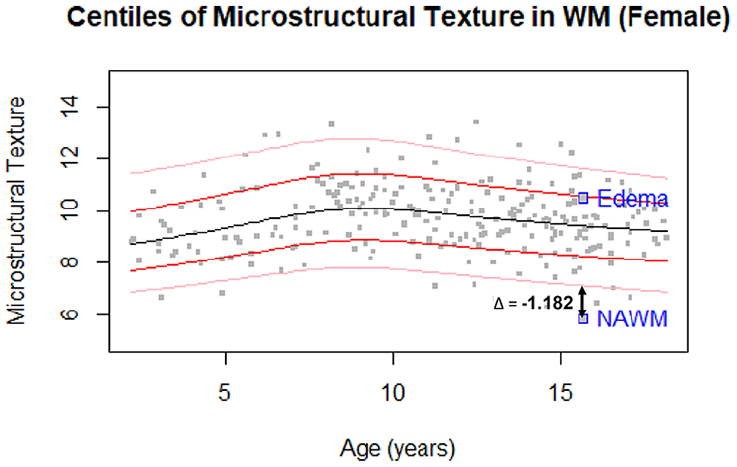
Centiles (3, 15, 50, 85, 97) for FLAIR microstructural texture biomarker from WM in girls with texture from the edema and NAWM regions of the pathological volume annotated.
Distance of Pathological Tissue Texture From the Closest Percentile.
Distance of Pathological Tissue Texture From the Closest Minimum/Maximum Percentile (1st or 99th Percentiles).
Texture, Signal Intensity, and Volume/ICV Correlations
To further analyze the relationship of texture biomarkers with respect to signal intensity and volume, Pearson’s correlation tests were performed as seen in Figure S8. Tabulated results are found in Tables S6 and S7. Texture was strongly negatively correlated (P < .001) with signal intensity in the WM and dGM regions for all age groups. Only the 2 to 6 year age group for GM and 2 to 6 and 10 to 14 year age groups for cGM showed significant (P < .05) correlations between texture and signal intensity. cGM texture showed significant (P < .05) negative correlations with volume in 2 to 6, 6 to 10, and 10 to 14 year age groups. In the WM region only the 10 to 14 year age group showed significant (P < .05) negative correlations with volume. Interestingly, in the dGM, the 14 to 18 year age group showed a significant (P < .05) positive correlation between texture and volume.
Discussion
We used FLAIR texture of the brain to develop normative growth curves for children over the paediatric age range. Growth curves for the brains of normal children have strong clinical utility, as they can be used to quantitatively monitor neurodevelopment of children, and to assess pathological disease. We analyzed a novel FLAIR texture biomarker in 465 children and adolescents between 2 and 19 years of age.
In the WM, we found the FLAIR texture marker to increase from 2 to 19 years of age, with nonlinear trajectories. Texture increased to around 10 years of age, and then slightly decreased in adolescence while remaining higher than in early years. Low values for FLAIR texture indicate the WM region to have locally smooth (homogeneous) characteristics, while higher values indicate localized roughness (rapid fluctuations of signal intensity in a smaller window or heterogeneity). Previous studies have shown FLAIR texture and signal intensity to be related to water content, with strong correlations to mean diffusivity (MD), and to a lesser degree the organization of tissue, with moderate correlations to fractional anisotropy (FA).7,8 Therefore, signal intensity, and fluctuations in signal intensity as measured by the proposed FLAIR texture marker, may be related to tissue organization and presence of water.
Texture in the WM across age groups was found to be significantly different over the paediatric age range, with texture having a strong negative correlation with signal intensity in all age groups The texture marker increased to a maximum at approximately 10 years of age, consistent with biphasic patterns across the age range found in previous studies. 5 These results also agree with existing diffusion tensor imaging (DTI) studies in 2- to 10-year-old children that demonstrated an increase in FA and corresponding decrease in MD. 22 Studies have shown that there is high water content in the WM at 2 years of age which decreases with myelination. 23 This is represented as an increase in FLAIR texture within this age range, suggesting that FLAIR texture may be capturing increased edge information related to myelination of fibre tract axons. After the age of 10 years, FLAIR texture decreased slightly. Studies have shown that axonal maturation occurs in this age range, when axonal bundles begin to thicken, and the lipid components increase. 24 This may indicate that FLAIR biomarkers also capture the process of axonal thickening and packing, in which FLAIR texture demonstrates more homogeneity with higher lipid content.
When assessing girls and boys separately, the texture marker for girls decreased after 10 years, while it reached a local peak around 10 years of age and increased again at around 14 years in boys. It has been found that boys aged 5 to 18 years demonstrate greater variance and rates of increase in WM volume compared to girls, 25 which may be a source of the difference in texture trends between sexes. Additionally, studies have found axonal thickening and density to increase around puberty, 24 which occurs earlier for girls than for boys, and which may also contribute to the observed difference in trends at the 14-year mark.
As a proof-of-concept, we assessed the biomarkers from a 15-year-old girl with paediatric low-grade glioma. The signal intensity and texture in the edema and NAWM regions were computed and compared to the WM normative curves for females. The edema had abnormally high signal intensity and relatively normal texture values, while the NAWM showed abnormally low texture and normal signal intensity. Abnormally low texture in the NAWM may be related to reduced myelination, less tightly packed axons, and more leakage of interstitial fluid in a pathological brain. 26 In contrast, the signal intensity of the NAWM falls within the normative curve, suggesting the texture marker may provide additional information on tissue microstructure and injury. Interestingly, the edematous region falls in the 85th percentile of the normative WM texture curve, which suggests compared to the average subject at this age, there is more heterogeneity in this tissue region. These findings demonstrate the potential utility of normative growth curves and the proposed texture biomarker.
The biomarkers in the GM followed the same trends as the cGM, since cGM is the dominant volume in the GM region. cGM texture of the whole sample increased over the paediatric age. Interestingly, texture was only negatively correlated to intensity in the 2 to 6 and 10 to 14 year age groups. Conversely, texture in the cGM was strongly negatively correlated to volume in all but the 14 to 18 year age group. Previous studies have found GM volume and cortical thickness reduction from childhood through adolescence due to neuronal pruning. 27 Additionally, compaction from WM myelination causes GM density to increase while volume decreases with age. 27 As Ribeiro et al 28 had found a significant correlation between neuronal density and gyrification in the GM, increase in FLAIR texture may be related to cortical folding, as the local signal intensity variations captured by the texture marker would increase for more complex surfaces.
For females, a steep increase in GM texture was seen from 2 to 10 years, after which texture remained relatively constant. For males, there was a continuous increase in texture across the entire age range. This corresponds to existing studies which found faster cortical maturation in females than in males, possibly corresponding to age differences at puberty.29,30 Texture in the dGM increased slightly over the age range for the whole sample and was strongly inversely correlated to signal intensity. Interestingly, texture in the dGM also demonstrated a significant positive correlation with volume in the 14 to 18 year age group. This may be related to myelination of the basal ganglia, which differs from the development of cortical GM.
There are several limitations of our study. First, while the sample size of the whole group is large and well-distributed over the age range, the ratio of boys to girls varies between age groups, which could make growth curves more susceptible to outliers. Another limitation pertains to the analysis of GM and WM tissues as global regions. While this is useful for constructing growth curves as a proof-of-concept, studies have found different GM and WM regions vary in their developmental trends. Future work will need to investigate parcellations of each region further. Further, DTI imaging would have been useful in correlating the proposed FLAIR biomarkers with validated tissue integrity such as MD and FA, but these sequences were unavailable for our sample. Future work may benefit from the acquisition of DTI for further investigation of the FLAIR biomarkers. Lastly, larger cohorts of pathological volumes should be investigated in future work, to validate the clinical relevance of the proposed texture biomarkers and growth curves in abnormal neurodevelopment tracking and disease detection, beyond the proof-of-concept in this work.
This study proposes a set of developmental curves created using novel FLAIR texture biomarkers to assess neurodevelopment in children and adolescents. The texture biomarker assesses local signal intensity fluctuations, which may reflect microstructural changes. In the WM, texture demonstrated an inverse relationship with intensity, which may be reflective of myelination, axonal packing, and water content. In the GM, texture was found to increase continually demonstrating an inverse relationship with volume. NAWM and edema in a pathological brain exhibited abnormal texture values outside of the normative growth curve range, demonstrating the clinical utility of biomarker growth curves. In contrast to previous studies that focused primarily on intensity standardization and biomarkers, 5 this work introduces a novel FLAIR texture measure and growth curves, providing additional insight into microstructural tissue development beyond intensity-based approaches.
Supplemental Material
sj-pdf-1-caj-10.1177_08465371241262175 – Supplemental material for Developmental Curves of the Paediatric Brain Using FLAIR MRI Texture Biomarkers
Supplemental material, sj-pdf-1-caj-10.1177_08465371241262175 for Developmental Curves of the Paediatric Brain Using FLAIR MRI Texture Biomarkers by Karissa Chan, Dania Rabba, Logi Vidarsson, Matthias W. Wagner, Birgit B. Ertl-Wagner and April Khademi in Canadian Association of Radiologists Journal
Footnotes
Declaration of Conflicting Interests
The author(s) declared no potential conflicts of interest with respect to the research, authorship, and/or publication of this article.
Funding
The author(s) disclosed receipt of the following financial support for the research, authorship, and/or publication of this article: This study has received funding by the Natural Sciences and Engineering Research Council of Canada (NSERC).
Supplemental Material
Supplemental material for this article is available online.
References
Supplementary Material
Please find the following supplemental material available below.
For Open Access articles published under a Creative Commons License, all supplemental material carries the same license as the article it is associated with.
For non-Open Access articles published, all supplemental material carries a non-exclusive license, and permission requests for re-use of supplemental material or any part of supplemental material shall be sent directly to the copyright owner as specified in the copyright notice associated with the article.