
Abstract
Objective:
Ultrasound is one of the most commonly used imaging modalities, though some populations face barriers in accessing ultrasound services, potentially resulting in disparities in utilization. The objective of this study was to assess the association between sociodemographic and geographic factors and non-obstetrical ultrasound utilization in the province of Saskatchewan, Canada.
Methods:
All non-obstetrical ultrasound exams performed from 2014 to 2018 in Saskatchewan, Canada were retrospectively identified from province-wide databases. Univariate and multivariate Poisson regression analyses were performed to assess the association between ultrasound utilization and sex, age, First Nations status, Charlson Comorbidity Index, urban vs. rural residence, geographic remoteness, and neighborhood income.
Results:
A total of 1,324,846 individuals (5,857,044 person-years) were included in the analysis. Female sex (adjusted incidence rate ratio [aIRR], 2.20; 95% confidence interval [CI], 2.19-2.22), age (aIRR, 4.97; 95% CI, 4.90-5.05 for ≥57 years vs. <11 years), comorbidities (aIRR, 4.36 for Charlson Comorbidity Index >10 vs. 0; 95% CI, 3.78-5.03), and higher neighborhood income (aIRR, 1.04; 95% CI, 1.02-1.05 for highest vs. lowest quintile) were associated with higher rates of ultrasound utilization. Individuals who were status First Nations (aIRR, 0.91; 95% CI, 0.90-0.92) or resided in geographically remote areas (aIRR, 0.87 for most vs. least remote; 95% CI, 0.83-0.91) had lower rates of ultrasound utilization. Individuals who lived in a rural area also had lower rates of ultrasound utilization (aIRR, 0.93; 95% CI, 0.92-0.94).
Conclusion:
Substantial disparities exist in non-obstetrical ultrasound utilization among individuals in low-income neighborhoods, status First Nations individuals, and individuals in rural and remote communities.
Introduction
Ultrasound imaging is one of the most commonly used medical imaging modalities. 1 Despite its importance in clinical care, ultrasound is not available in many rural and remote communities in Canada and around the world, creating inequities in access to this important imaging modality. 2
While disparities in access to ultrasound imaging among specific sociodemographic groups—including individuals in rural and remote communities—have been reported, 2 it is less clear how disparities in access to ultrasound imaging impact utilization of non-obstetrical ultrasound imaging. One of the most frequently cited theoretical models of healthcare utilization, first described by Andersen in 1968, proposes that healthcare utilization can be predicted by an individuals’ predisposition to use services, factors which enable or impede use, and individuals’ perceived and evaluated need for care.3,4 Factors which enable or impede use reflect many dimensions of accessibility to healthcare services, described by Levesque et al. as approachability, acceptability, availability and accommodation, affordability, and appropriateness. 5
A number of sociodemographic factors, such as age, race, income, and education level, have been found to be predictors of healthcare utilization in general.6-13 Less research has focused on sociodemographic and geographic predictors of imaging utilization, including utilization of ultrasound. Our previous research found that status First Nations individuals, individuals residing in rural and remote areas, and individuals in low-income neighborhoods were less likely to have a second trimester obstetrical ultrasound. 14 However, it is unclear whether these factors are also associated with non-obstetrical ultrasound, which is commonly used as a diagnostic tool for specific clinical symptoms, in contrast to second trimester obstetrical ultrasound which is recommended for all pregnant patients. 15
Multiple studies have demonstrated benefits of medical imaging such as reduced rates of unnecessary surgeries and reduced length of hospital stays, underscoring the importance of equitable access to and utilization of imaging.16,17 Additionally, lack of imaging could result in delays in diagnosis and treatment, potentially leading to increased utilization of other healthcare services. 18 As such, it is critical to consider disparities in imaging utilization which may reflect barriers patients face in accessing imaging services. Thus, the objective of this study was to assess the association between sociodemographic and geographic factors and non-obstetrical diagnostic ultrasound utilization.
Methods
This study was determined to be exempt from research ethics approval by the University of Saskatchewan Research Ethics Board. Access to data used in this study was facilitated through a data sharing agreement between the Saskatchewan Health Quality Council, eHealth Saskatchewan, Saskatchewan Health Authority, Ministry of Health, and University of Saskatchewan.
Study Cohort
All individuals registered for medical services in Saskatchewan, Canada between January 1, 2014 and December 31, 2018 (the “study period”) were eligible for inclusion. Individuals who were registered for medical services in Saskatchewan for less than 180 days during the study period (as a result of birth, death, or relocation to or from Saskatchewan) were excluded. Individuals were identified from the Saskatchewan Personal Health Registration System and individual-level records were linked across province-wide administrative health databases (Table 1).
Description of Databases.
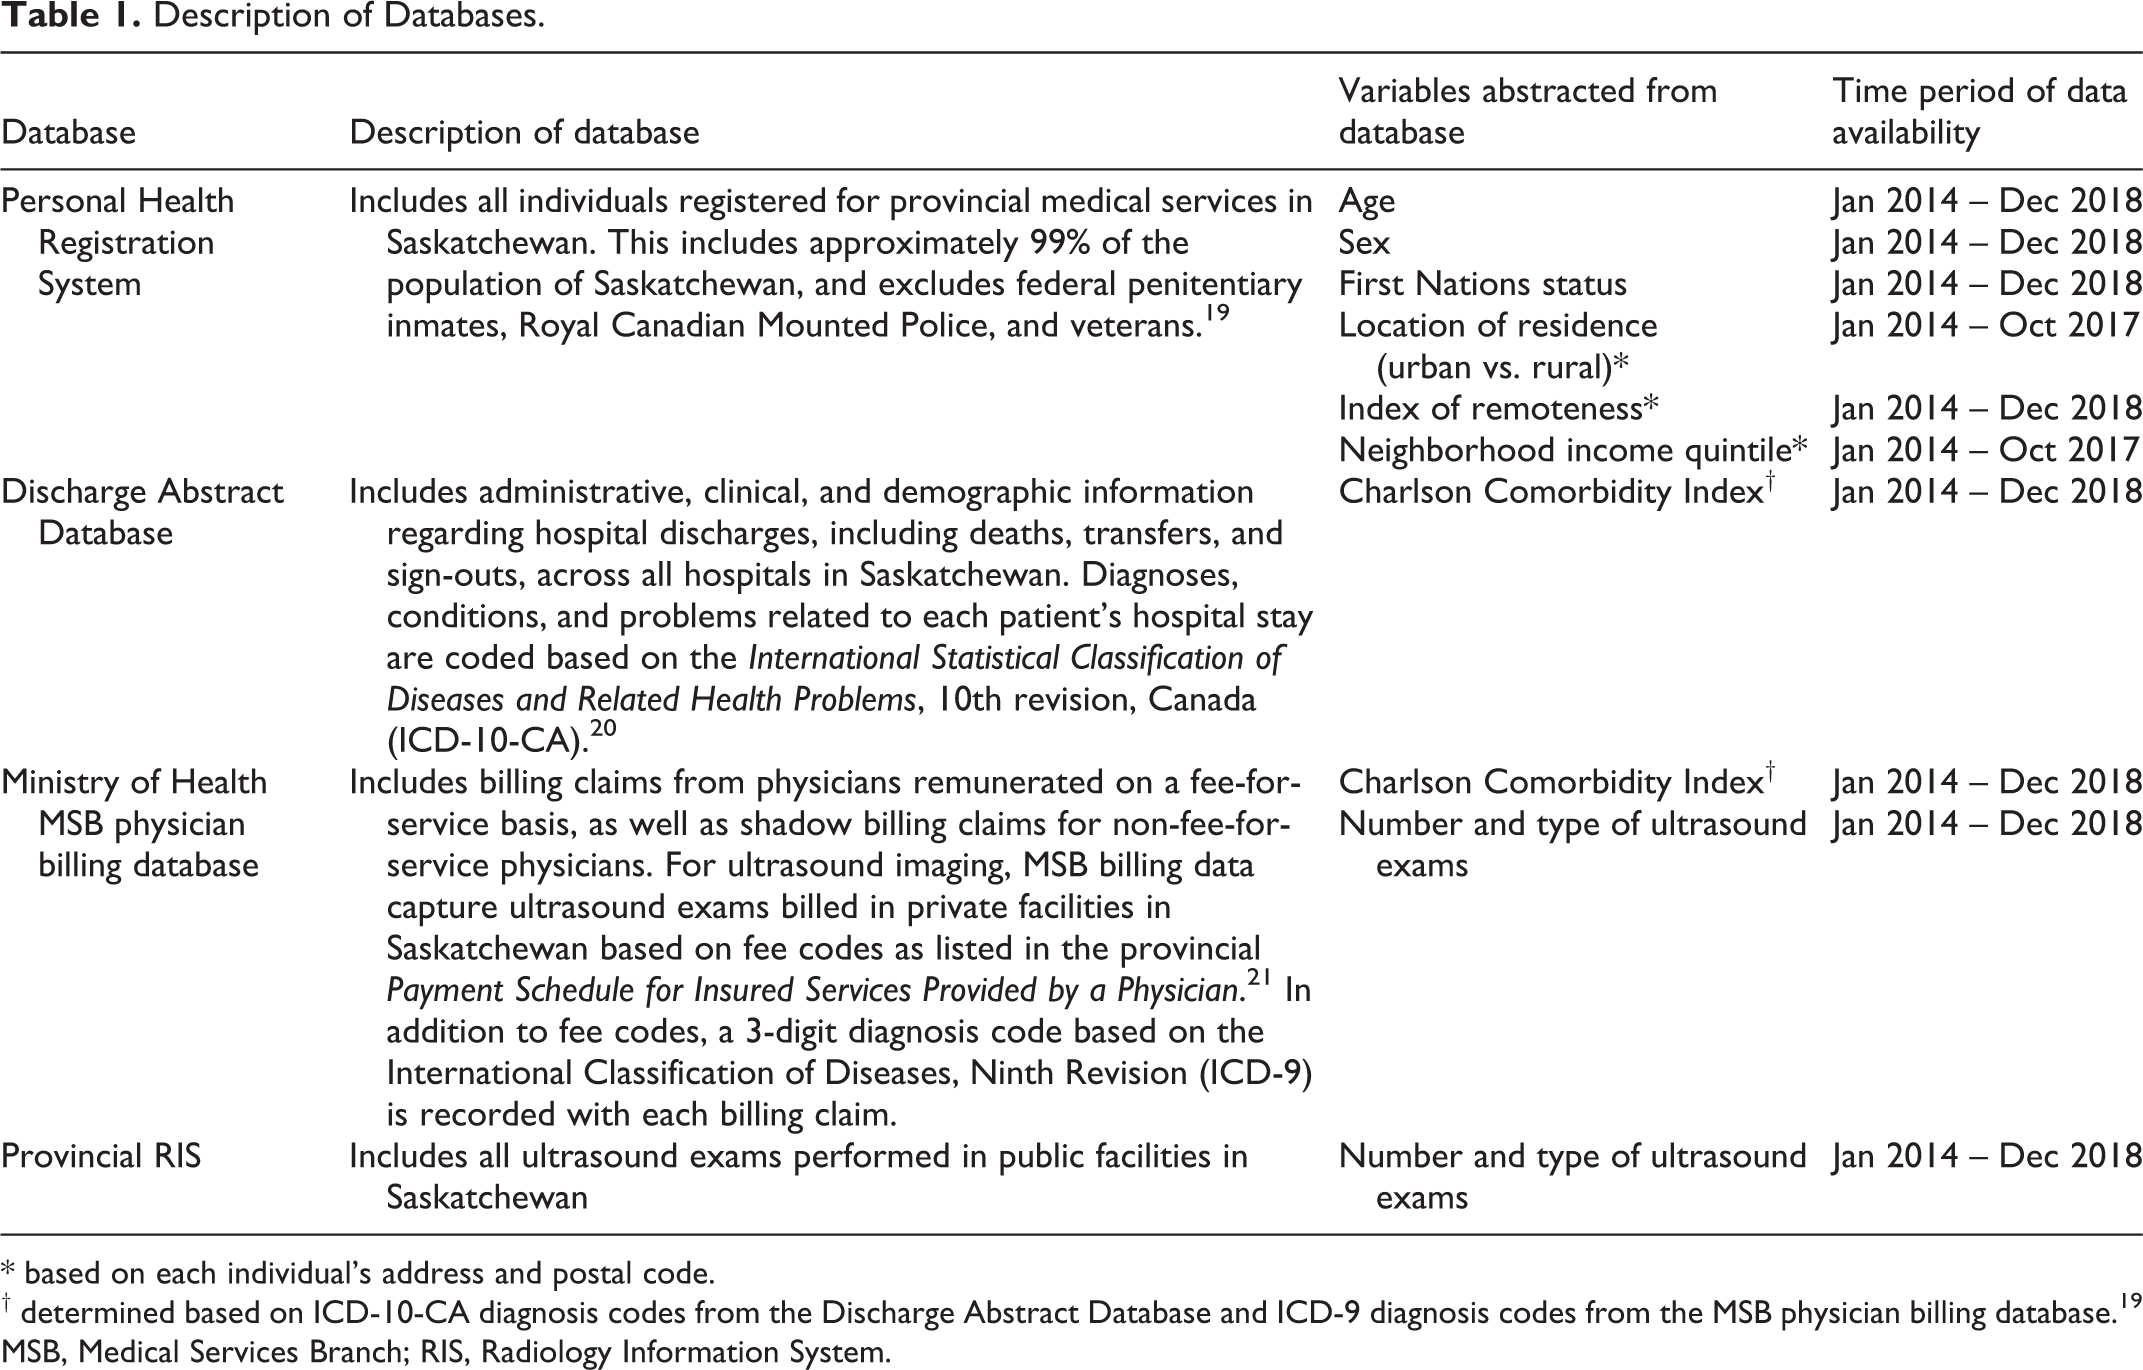
* based on each individual’s address and postal code.
† determined based on ICD-10-CA diagnosis codes from the Discharge Abstract Database and ICD-9 diagnosis codes from the MSB physician billing database. 19
MSB, Medical Services Branch; RIS, Radiology Information System.
Explanatory and Outcome Variables
Explanatory variables
Demographic information, including age, sex, and First Nations status, was abstracted from the Personal Health Registration System for each individual in the study cohort. Age was defined as of January 1, 2014 or, if not registered for health services as of January 1, 2014, the date on which the individual became registered for health services. First Nations status was indicated if a First Nations individual self-identified as a status Indian as defined by the Indian Act.
The Charlson Comorbidity Index (CCI) was used a proxy for health status. 22 This index was initially developed to predict risk of death within 1 year of hospitalization based on diagnosis codes for 17 diseases and has been validated to predict individuals who will incur high healthcare costs.19,23,24 The CCI was determined for each individual based on ICD-10-CA diagnosis codes from the Discharge Abstract Database and ICD-9 diagnosis codes from the Medical Services Branch (MSB) physician billing database. 19
Location of residence (urban vs. rural) was determined based on each individual’s physical residence listed in the Personal Health Registration System. Urban was defined to include all population centers (communities with a population of at least 1,000 and a population density of 400 persons or more per square kilometer) and rural was defined as all territory excluding population centers. 25 Based on limitations in the Saskatchewan Health Quality Council’s administrative dataset as a result of a change in licensing of the Postal Code Conversion File, these data were only available from January 2014 to October 2017. For the period from October 2017 to December 2018, location of residence was based on each individual’s residence as of October 2017.
An index of remoteness as a proxy for geographic remoteness was determined based on the census subdivision (CSD) of each individual’s physical address listed in the Personal Health Registration System as maintained by eHealth Saskatchewan. This index of remoteness was developed by Statistics Canada to reflect proximity to general services such as health services, businesses, and education. Initial values for the index of remoteness were rescaled to the range of 0 (least remote) to 1 (most remote) based on Canada-wide data. 26 In contrast to other measures of proximity such as travel distance, this index minimizes biases for remote communities in which the dominant transportation method is air transportation. In statistical analyses, <0.23 was chosen as the reference category as the 2 largest cities in the province both had index of remoteness values slightly less than 0.23.
Socioeconomic status was represented in analyses by neighborhood income quintile. As previously described, quintiles for each dissemination area were defined based on average income per single person equivalent from 2011 Census data. 27 The income quintile of the dissemination area in which each individual resided was assigned to that individual. As for urban vs. rural residence, data were only available from January 2014 to October 2017. For the period from October 2017 to December 2018, neighborhood income quintile was based on each individual’s residence as of October 2017.
All geographically based variables, including location of residence (urban vs. rural), index of remoteness, and neighborhood income quintile, were specific to a time period defined by start and end dates, taking into account that individuals may move within the study period. For example, 2 separate time periods were defined if an individual moved from address A to address B, with each time period having different values for all geographically based variables.
Outcome variable
The primary outcome variable was the number of non-obstetrical ultrasound exams performed per person-year. Ultrasound exams were identified from the provincial Radiology Information System (RIS), which includes all exams performed in public facilities, and MSB physician billing database, which includes all exams performed in private facilities. Together, these 2 databases include all publicly-funded diagnostic ultrasound exams billed in Saskatchewan.
Ultrasound exams performed on the same day which covered different anatomic regions (e.g. abdomen and pelvis) were counted as 2 separate exams. Exams which covered the same anatomic region but which were coded as 2 separate exams despite being part of the standard protocol of one of the exams performed at the same time (e.g. abdomen and renal) were counted as a single exam. Ophthalmic, cranial, joint (musculoskeletal), and breast ultrasound exams, echocardiography, and ultrasound-guided procedures were excluded from the study as these are specialized ultrasound exams not performed at all ultrasound centers. Obstetrical ultrasound exams were also excluded from this study and have been reported separately. 14
Statistical Analysis
Frequencies of each ultrasound exam type performed over the 5-year period and frequencies and proportions of the number of ultrasound exams performed per person-year were determined.
Univariate Poisson regression modeling was used to estimate incidence rate ratios (IRRs) and 95% confidence intervals (CIs) for each stratum of each predictor variable. Variables with p < 0.20 based on univariate analyses were included in a multivariate model with a Poisson distribution to identify factors associated with non-obstetrical ultrasound utilization. The logarithm of follow-up time within the 5-year study period was used as an offset variable. Missing values were considered as a special “missing” category in analyses, and no records were excluded due to missing data. Adjusted incidence rate ratios (aIRRs) and 95% CIs were determined for each stratum of each variable.
Correlation coefficients and variance inflation factors to assess for multicollinearity were determined. As correlation of 0.43 was found between location of residence (urban vs. rural) and index of remoteness, 2 multivariate models were fitted: a multivariate model with all variables except urban vs. rural location of residence (Model 1) and a multivariate model with all variables except index of remoteness (Model 2).
Adjusted incidence rate ratios were estimated for each census division and medium and large population center in Saskatchewan and were plotted on a choropleth map to visualize geographic differences in rates of non-obstetrical ultrasound utilization. Choropleth maps were created using MapInfo Pro 2019 (Precisely, Pearl River, New York).
Statistical analyses were performed using SAS, version 9.4 (SAS Institute, Cary, NC). P-values less than 0.05 were considered statistically significant.
Results
A total of 1,358,113 individuals were identified in the Personal Health Registration System over the study period. Of these individuals, 33,267 individuals were registered for medical services for less than 180 days and were excluded. The remaining 1,324,846 individuals were registered for medical services for a total of 5,857,044 person-years over the 5-year study period and were included in the study.
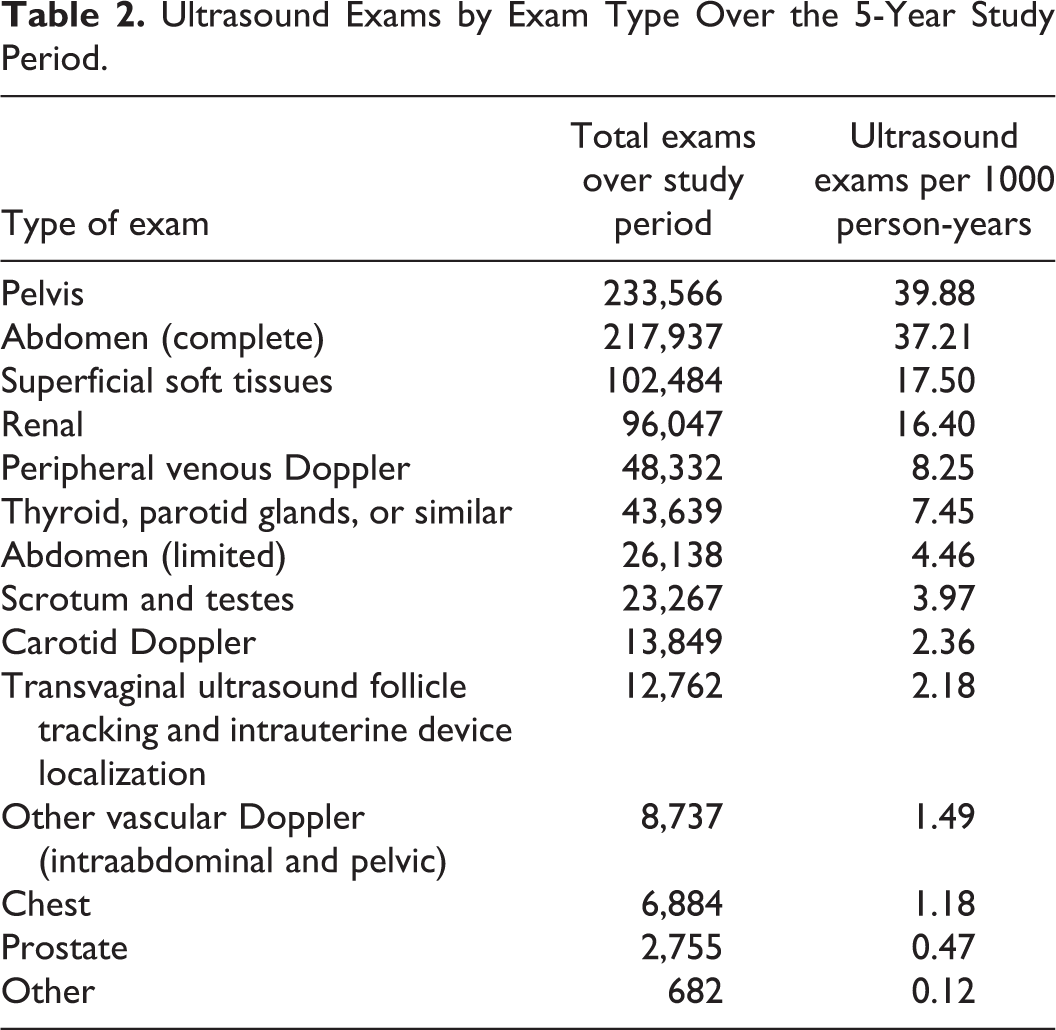
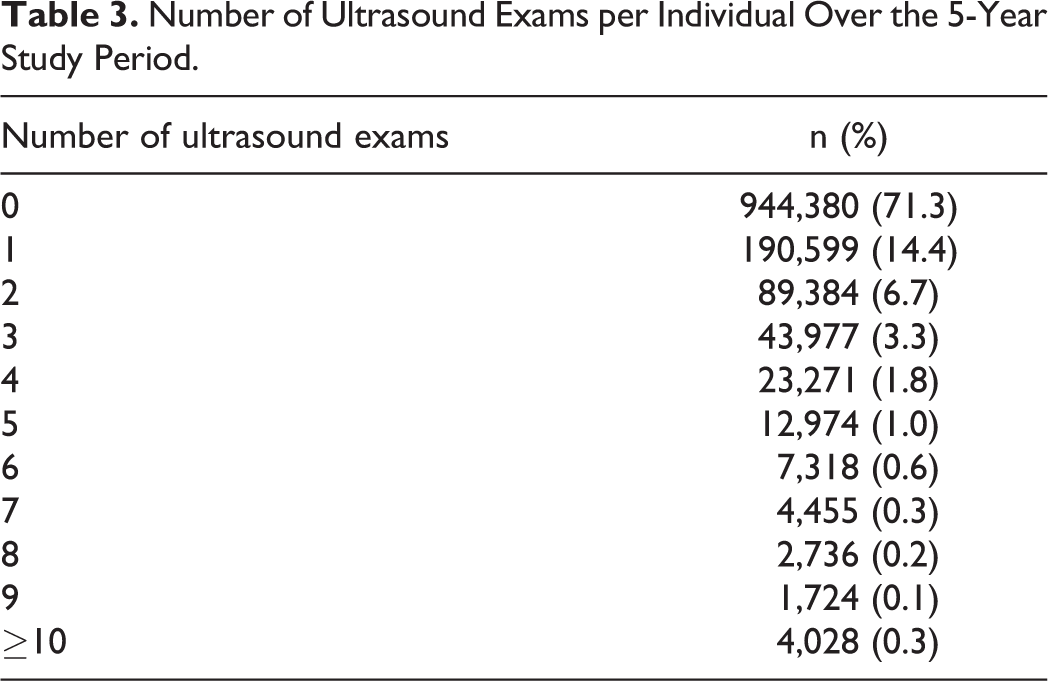
The most common exams performed over the study period were pelvic, abdominal, superficial soft tissues, and renal ultrasound exams (Table 2). Seventy-one percent of individuals had no ultrasound exams over the 5-year study period, 14% had one, 7% had 2, and 8% had 3 or more ultrasound exams (Table 3). 279,186 (34%) ultrasound exams were abstracted from RIS (representing exams performed in public facilities) and 548,624 (66%) exams were abstracted from the MSB physician billing database (representing exams performed in private clinics).
Ultrasound Exams by Exam Type Over the 5-Year Study Period.
Number of Ultrasound Exams per Individual Over the 5-Year Study Period.
The overall rate of non-obstetrical ultrasound utilization was 0.141 ultrasound exams per person-year. Rates of ultrasound exams per person-year by sociodemographic and geographic factors are presented in Table 4.
Population Characteristics and Rate of Ultrasound Exams per Person-Year by Sociodemographic and Geographic Factors.
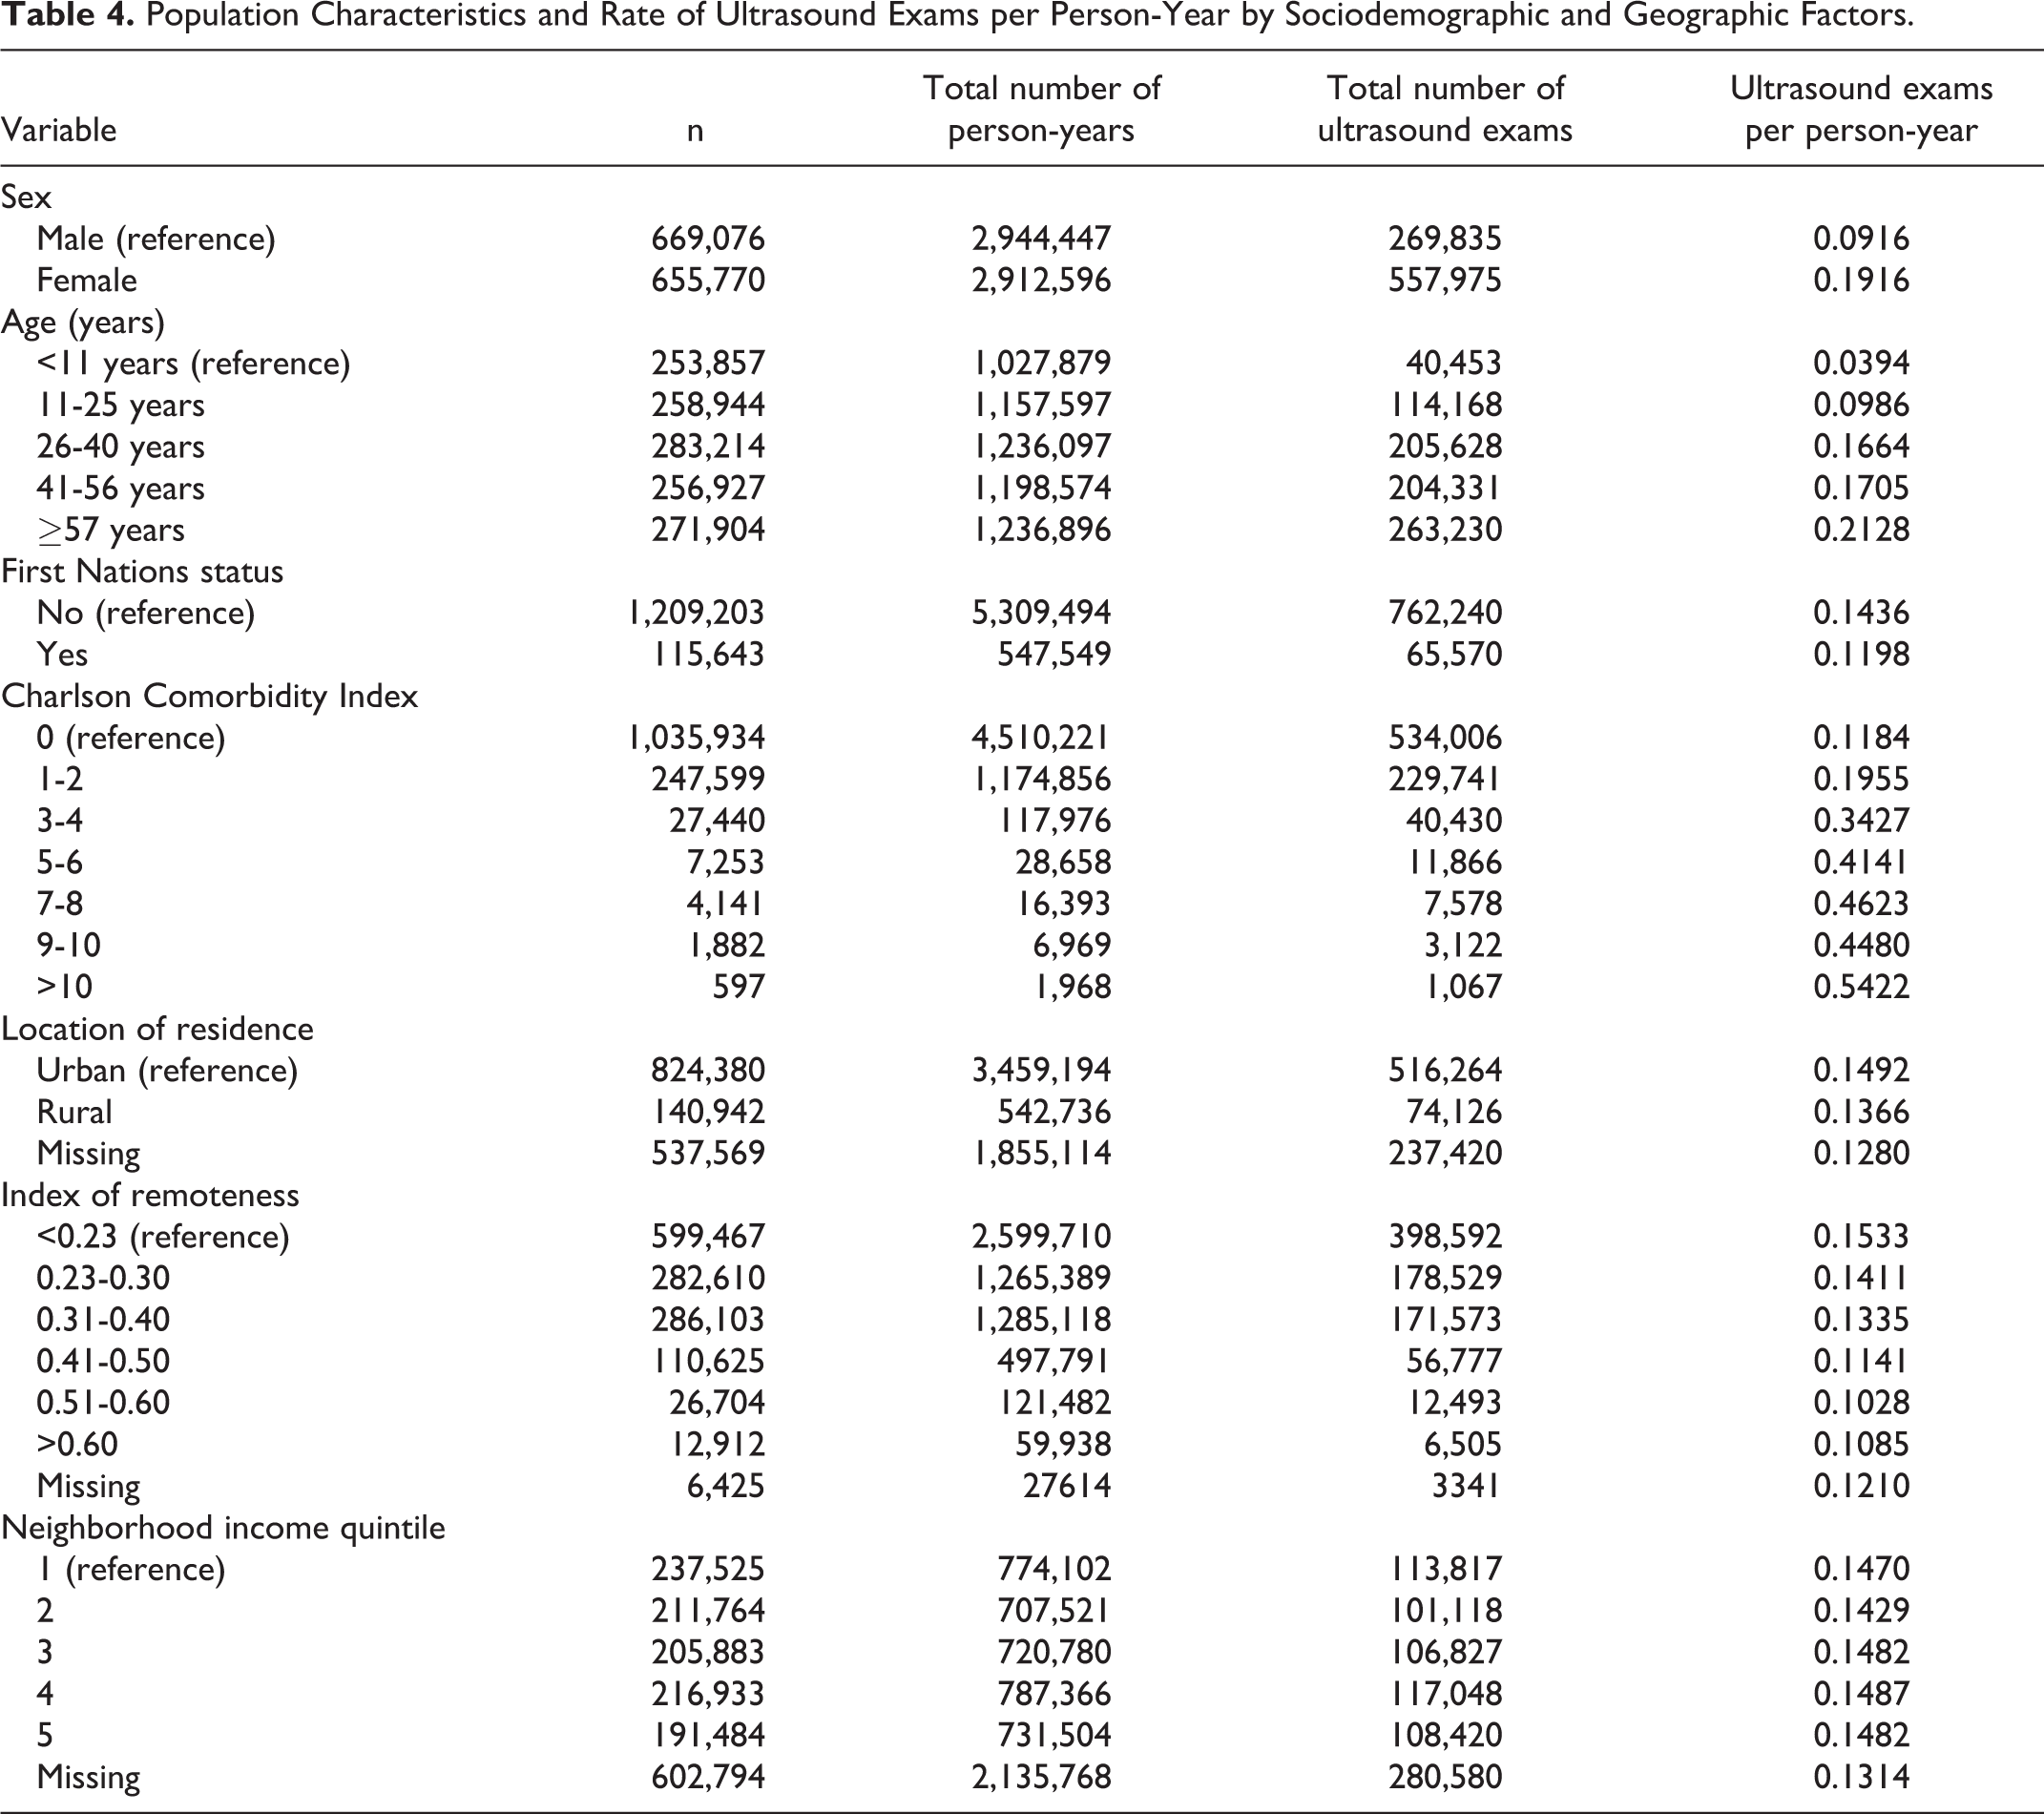
Based on univariate Poisson regression analysis, female sex, higher age, higher CCI, and higher neighborhood income were significantly associated with higher rates of ultrasound utilization. First Nations status, rural residence, and geographic remoteness were significantly associated with lower rates of ultrasound utilization (Table 5).
Results of Univariate and Multivariate Poisson Regression Analysis by Sociodemographic and Geographic Factors.
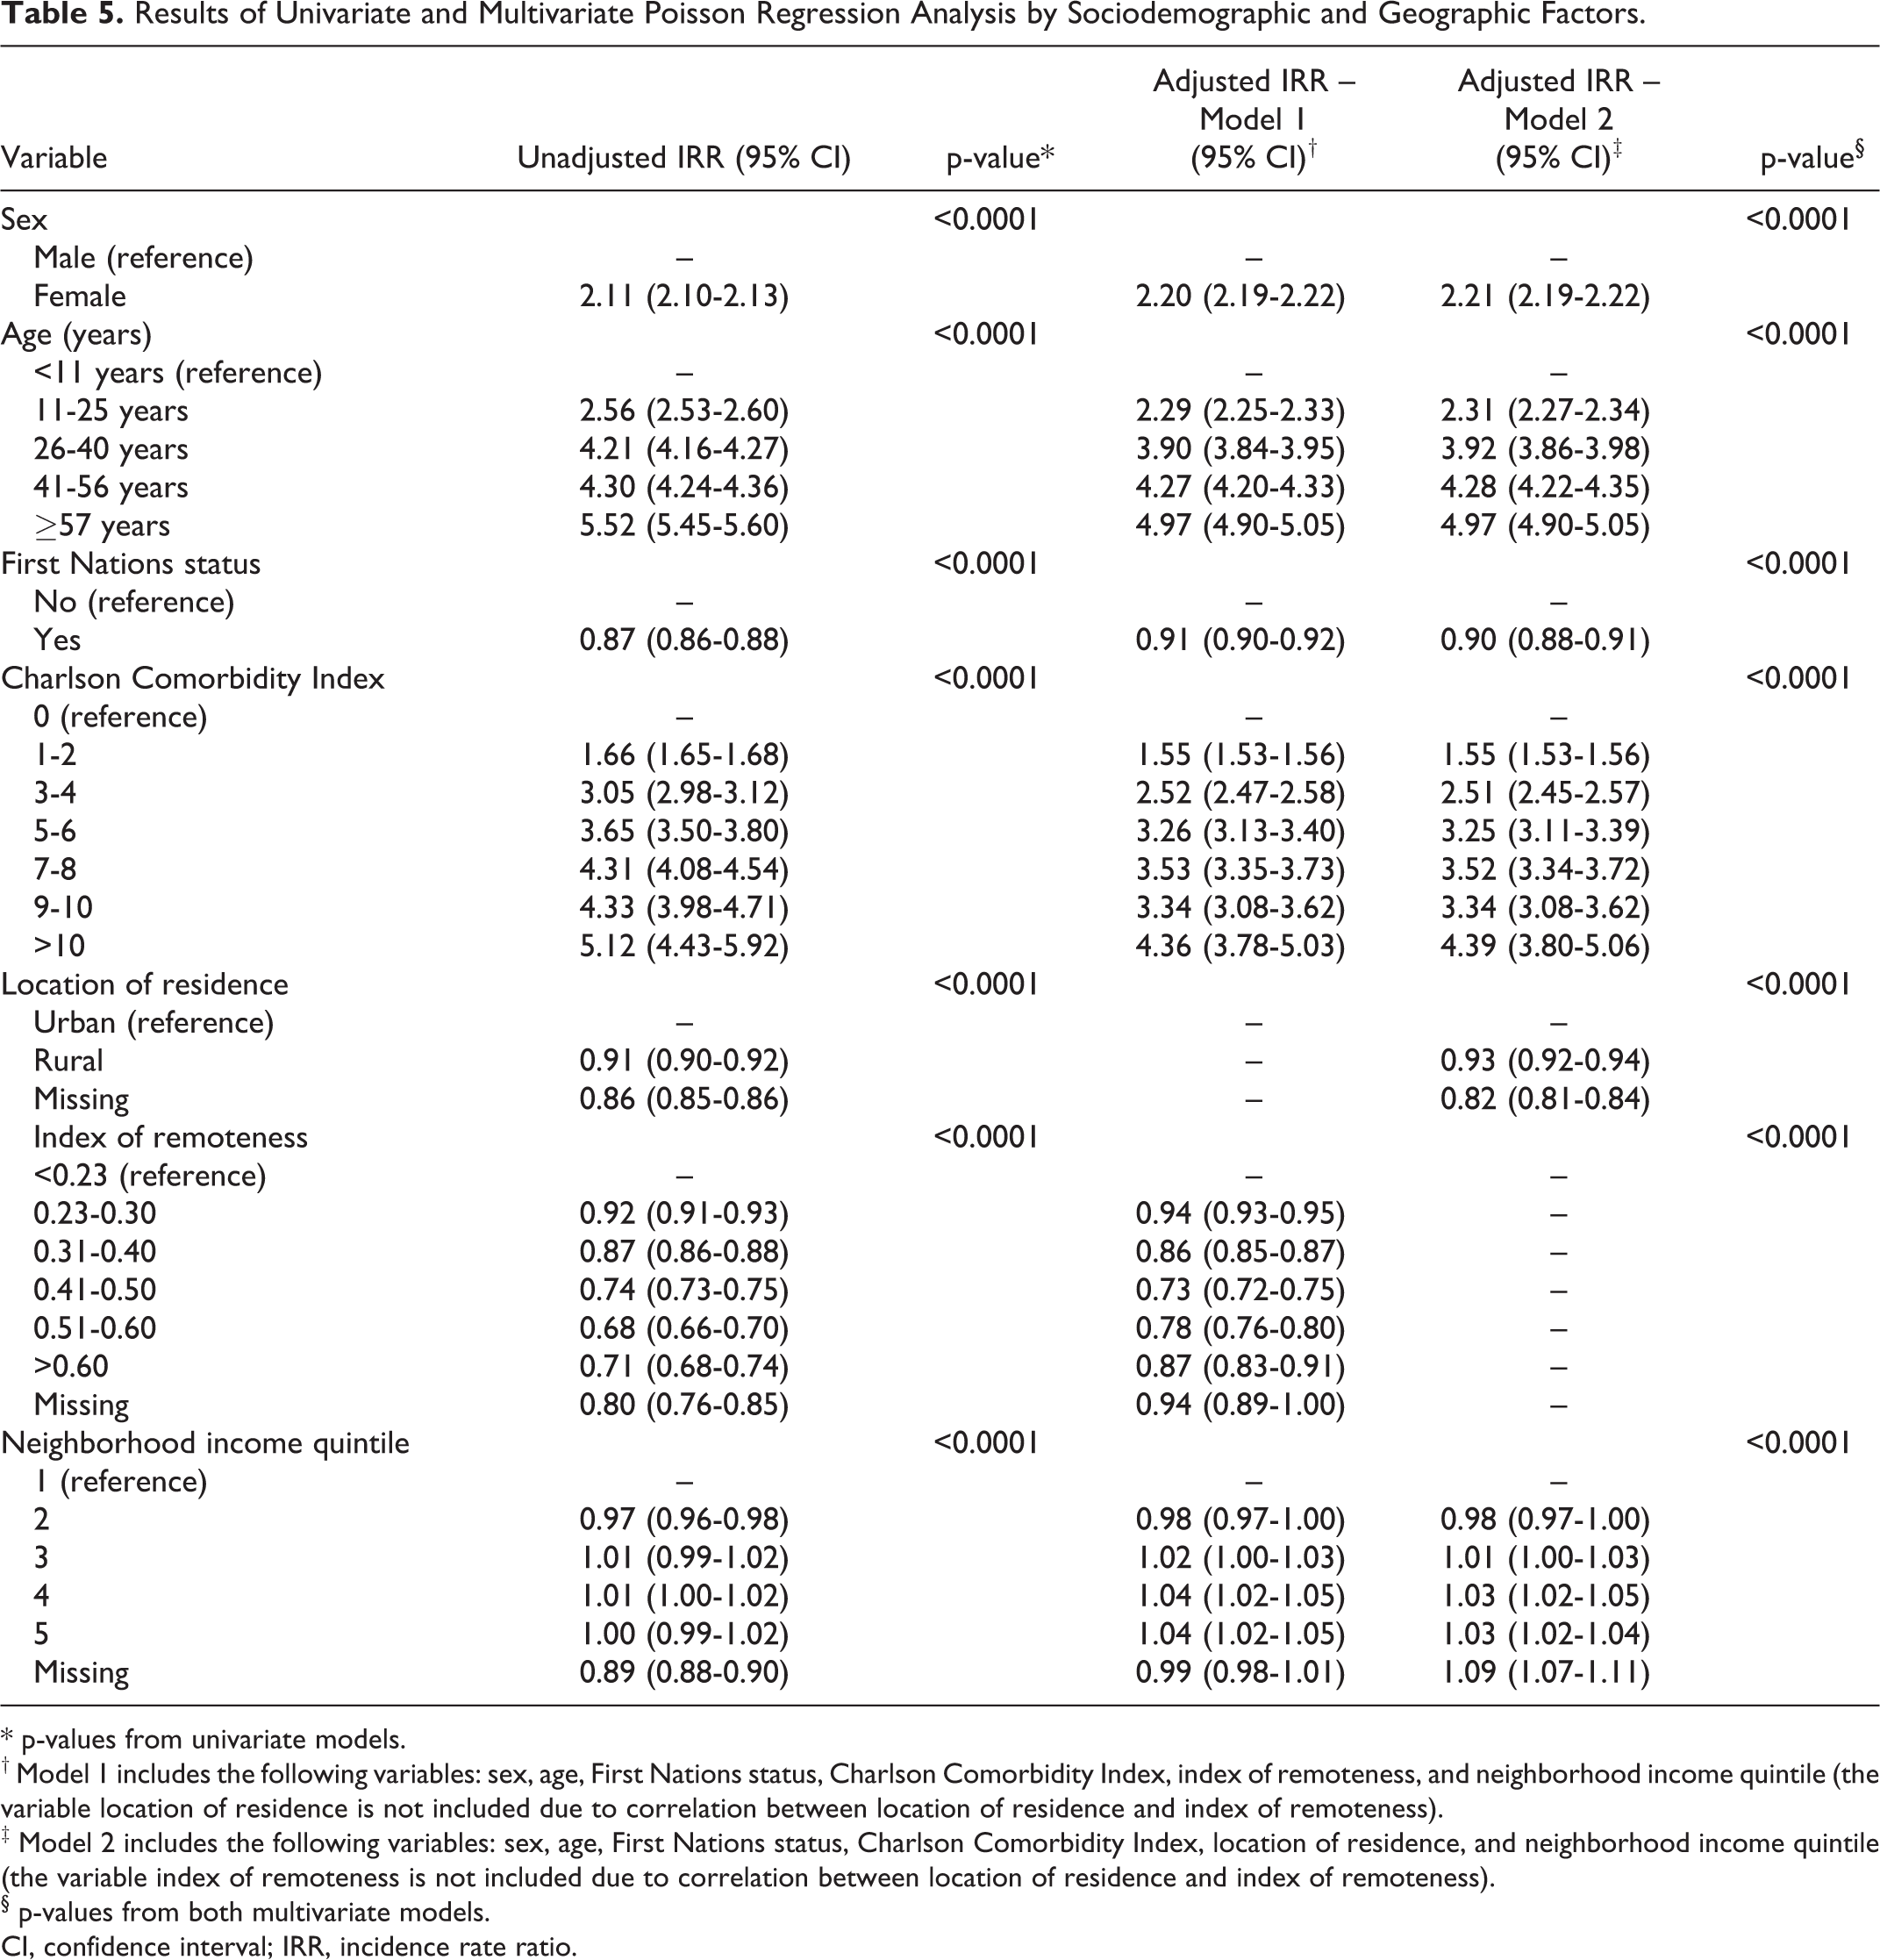
* p-values from univariate models.
† Model 1 includes the following variables: sex, age, First Nations status, Charlson Comorbidity Index, index of remoteness, and neighborhood income quintile (the variable location of residence is not included due to correlation between location of residence and index of remoteness).
‡ Model 2 includes the following variables: sex, age, First Nations status, Charlson Comorbidity Index, location of residence, and neighborhood income quintile (the variable index of remoteness is not included due to correlation between location of residence and index of remoteness).
§ p-values from both multivariate models.
CI, confidence interval; IRR, incidence rate ratio.
Based on multivariate Poisson regression analysis, female sex (Model 1—aIRR, 2.20; 95% CI, 2.19-2.22; p < 0.0001; Model 2—aIRR, 2.21; 95% CI, 2.19-2.22; p < 0.0001), higher age (Models 1 and 2—aIRR, 4.97 for age ≥57 years vs. <11 years; 95% CI, 4.90-5.05; p < 0.0001), higher CCI (Model 1—aIRR, 4.36 for CCI >10 vs. 0; 95% CI, 3.78-5.03; p < 0.0001; Model 2— aIRR, 4.39; 95% CI, 3.80-5.06; p < 0.0001), and higher neighborhood income (Model 1—aIRR, 1.04 for highest vs. lowest quintile; 95% CI, 1.02 -1.05; p < 0.0001; Model 2—aIRR, 1.03; 95% CI, 1.02 -1.04; p < 0.0001) were associated with higher rates of ultrasound utilization. Status First Nations individuals (Model 1—aIRR, 0.91; 95% CI, 0.90-0.92; p < 0.0001; Model 2—aIRR, 0.90; 95% CI, 0.88-0.91; p < 0.0001) and individuals living in a rural area (aIRR, 0.93; 95% CI, 0.92-0.94; p < 0.0001) had lower rates of ultrasound utilization. Lower rates of ultrasound utilization were also observed for all levels of increased geographic remoteness relative to the reference category corresponding to Saskatoon and Regina, the largest urban centers in the province (aIRRs all <1.00; p < 0.0001; Table 5).
Figure 1 presents aIRRs for each census division in Saskatchewan, as well as all medium and large population centers in Saskatchewan, adjusted for sex, age, First Nations status, Charlson Comorbidity Index, and neighborhood income quintile. Census divisions with low aIRRs approximate geographic areas with high index of remoteness values (Figure 2) and greater distance to and lower density of ultrasound facilities (Figure S1; Supplementary Material). Variation in aIRRs was observed across the 4 medium and large population centers, with aIRRs of 0.81 (95% CI, 0.80-0.82), 0.86 (95% CI, 0.84-0.88), and 0.86 (95% CI, 0.84-0.88) for Regina, Prince Albert, and Moose Jaw, respectively, relative to Saskatoon, the largest city in the province.
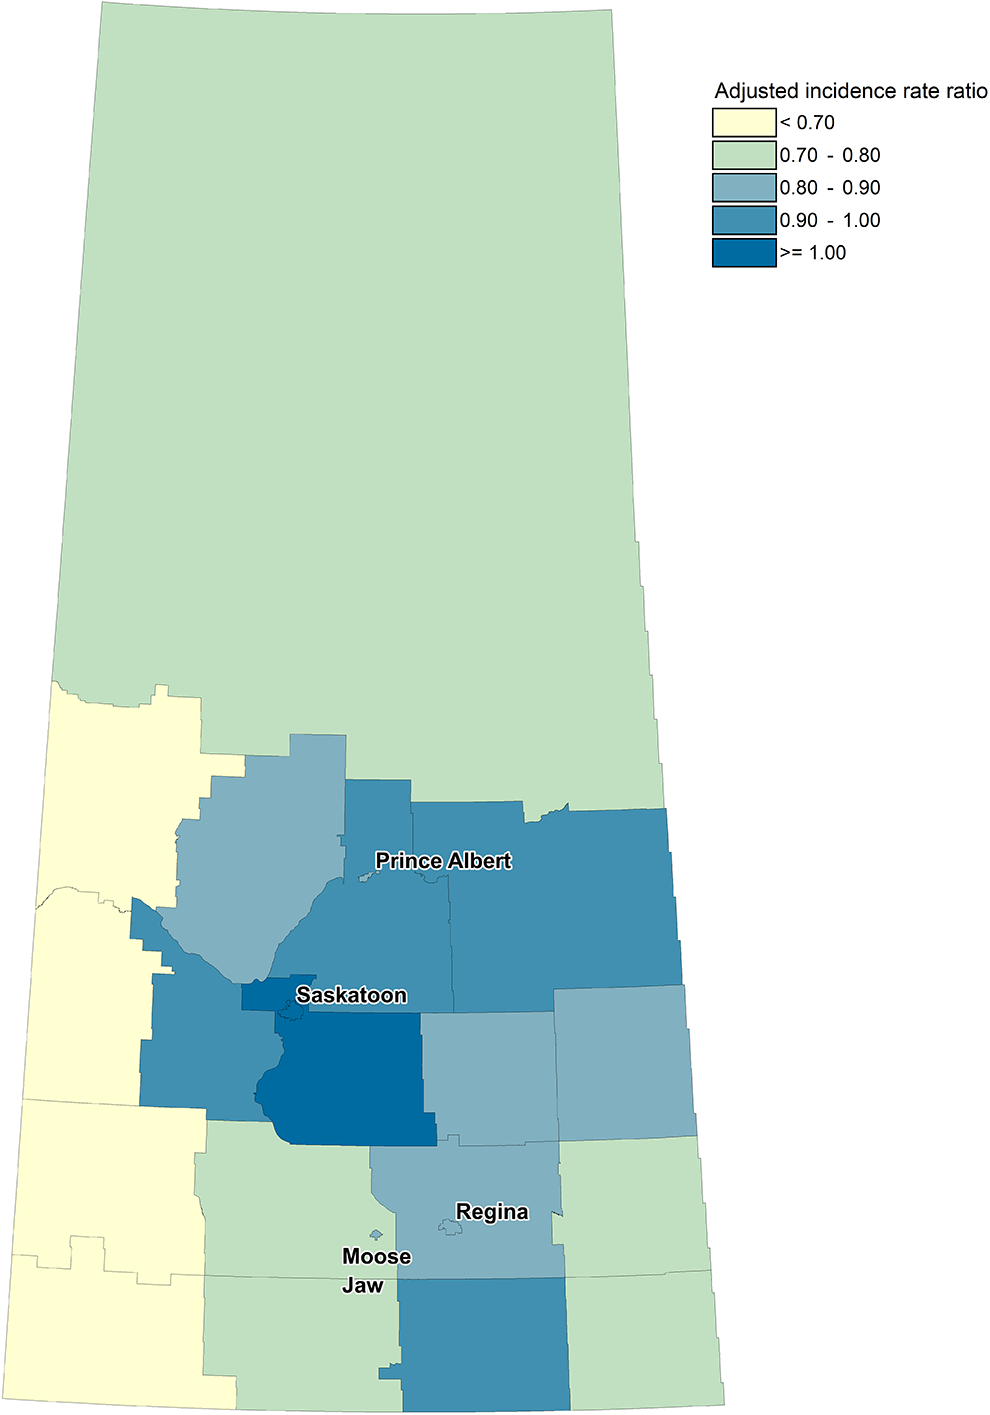
Choropleth map indicating adjusted incidence rate ratios of non-obstetrical ultrasound imaging utilization by census division in Saskatchewan. All 18 census divisions are outlined in gray, and all medium and large population centers (Saskatoon, Regina, Prince Albert, and Moose Jaw) are labeled. The reference category is Saskatoon, the largest population center in the province. Incidence rate ratios were adjusted for sex, age, first nations status, Charlson Comorbidity Index, and neighborhood income quintile. Adjusted incidence rate ratios greater than 1 indicate higher rates of non-obstetrical ultrasound utilization relative to Saskatoon, and adjusted incidence rate ratios less than 1 indicate lower rates of utilization. Comparing Figures 1 and 2, areas which are more geographically remote generally have lower rates of non-obstetrical ultrasound utilization, and areas which are less geographically remote (surrounding medium and large population centers) generally have higher rates of non-obstetrical ultrasound utilization.
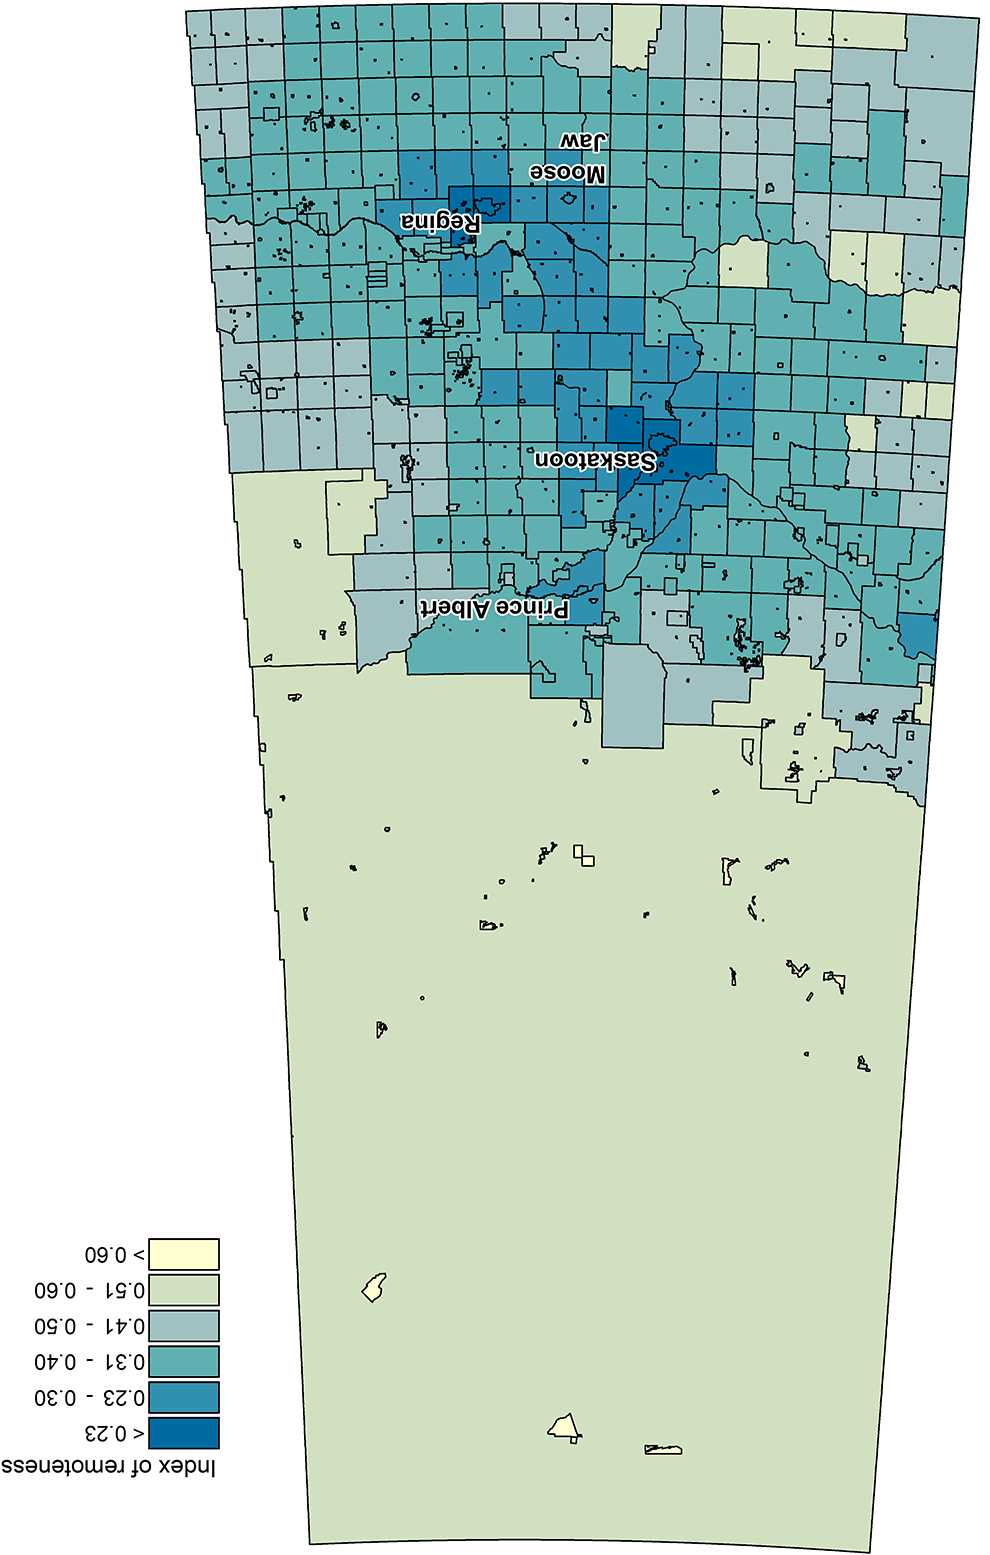
Choropleth map indicating index of remoteness values by census subdivision in Saskatchewan. Each census subdivision is outlined in black. Medium and large population centers (Saskatoon, Regina, Prince Albert, and Moose Jaw) are labeled. Index of remoteness values range from 0 (least geographically remote) to 1 (most geographically remote).
Discussion
An understanding of sociodemographic and geographic factors which are associated with ultrasound imaging utilization is critical in informing the provision of imaging services to more equitably serve the entire population. Variation in ultrasound utilization among sociodemographic groups and geographic regions may represent underutilization (secondary to barriers in accessing ultrasound services, for example) or overutilization (due to physician ordering practices, for example). Using a lens toward health equity, the root causes of variation should be carefully explored.
Lower rates of non-obstetrical ultrasound utilization in many remote areas of the province may reflect barriers which patients face in accessing ultrasound, such as the need to travel far distances—sometimes by plane—to reach an ultrasound facility. 2 However, it is interesting that utilization rates did not continue to decrease with higher levels of geographic remoteness, but were lowest in mid-geographically remote areas. 14 This may be explained by ultrasound and radiography being the most accessible imaging modalities in many rural and remote areas, leading physicians to order ultrasound imaging even in cases where another imaging modality may be more appropriate. This explanation is supported by lower utilization rates of advanced imaging modalities across rural and remote regions in a Norwegian study. 28
Similar to prior studies,29-32 we found that higher neighborhood income was associated with higher rates of ultrasound utilization. A previous study based in a single Canadian city found higher rates of diagnostic imaging (including non-obstetrical ultrasound, radiography, CT, and MRI) among patients in higher income neighborhoods, though the effect size was larger than seen in our study, with relative risks ranging from 1.25 to 2.26 for highest vs. lowest neighborhood income quintiles. 31 While the study did control for comorbidities and age, other variables, such as First Nations status, were not controlled for, potentially explaining the difference in effect size in our study.
Similar to our prior research which found that status First Nations individuals had a 20% lower rate of obstetrical ultrasound utilization, 14 in this study we found that adjusted rates of non-obstetrical ultrasound utilization were 9-10% lower among status First Nations individuals. Differential rates of non-obstetrical ultrasound utilization among First Nations and non-First Nations individuals may be secondary to overutilization or underutilization of this imaging modality among population subgroups. However, Indigenous peoples face multiple barriers in accessing healthcare services, including racism, discrimination, and stereotyping in the healthcare system, sometimes leading to a reluctance to access healthcare services.33,34 In this context, these findings provide a call to action to address the barriers which Indigenous peoples face in accessing imaging to ensure equitable imaging utilization.
The magnitude of variation of ultrasound utilization across sociodemographic and geographic factors is substantial, and results can be used to inform ultrasound service planning. Based on Table 5, if the rate of ultrasound exams across the province were equal to the average rate of ultrasound exams in the 2 largest cities, an additional 13,023 exams would need to be performed over one year to compensate for areas with currently lower utilization rates. Similarly, if the rate of ultrasound exams across the province were equal to that of the index of remoteness level with the lowest adjusted rate of ultrasound exams, it could be considered that an “excess” of 35,234 exams are currently performed over one year across the province.
The use of innovative technologies such as telerobotic ultrasound should be explored to improve access to ultrasound services for underserved and marginalized populations and help minimize the degree of variation in ultrasound utilization in some rural and remote areas.35-38 Other solutions, such as having an itinerant sonographer regularly travel to rural and remote communities, may also improve access to ultrasound services for these communities. Cultural safety training and ensuring culturally safe healthcare environments may increase the approachability, acceptability, and appropriateness of ultrasound services for Indigenous peoples, potentially reducing disparities in ultrasound utilization.
There are some limitations to this study. The CCI was used to control for comorbidities; however, as the index was initially designed to predict 1-year mortality risk, it may not directly relate to indications of a medically necessary ultrasound exam. However, it is reassuring that the CCI has been validated to predict individuals who will incur high healthcare costs,23,24 suggesting that is an effective measure to capture comorbidities that drive healthcare utilization. There are also a number of limitations inherent to the use of administrative data, including the potential for coding errors, incomplete data, and limitations in the variables available within administrative datasets. For example, First Nations status is based on self-reported data and accuracy is not verified by eHealth Saskatchewan. Additionally, data for location of residence (urban vs. rural) and neighborhood income quintile were missing for a substantial proportion of individuals and were only available from January 2014 to October 2017. We used each individual’s residence as of October 2017 to determine location of residence (urban vs. rural) and neighborhood income quintile for the remainder of the study period; however, this may have resulted in non-differential misclassification for the small proportion of the population which moved between October 2017 and December 2018, potentially biasing toward the null for these variables. Finally, ultrasound exams performed at an imaging clinic in another province to which a Saskatchewan patient travels are generally covered by the home province through a reciprocal billing arrangement and are generally captured in Saskatchewan MSB physician billing data. However, exams performed at out-of-province hospitals are not captured in the provincial RIS and are not included in this study. This may result in slightly decreased ultrasound exam counts for patients living in communities near the provincial borders, such as for individuals in northeast Saskatchewan traveling to Flin Flon, Manitoba for an ultrasound exam.
In conclusion, this study highlights disparities in ultrasound utilization among specific sociodemographic and geographic groups, including individuals in low-income neighborhoods, status First Nations individuals, and individuals in some rural and remote communities. Further work should explore solutions to minimize variation in ultrasound utilization between sociodemographic and geographic groups, particularly among those who have known barriers in accessing ultrasound imaging, through the use of innovative technologies and programs.
Supplemental Material
Supplemental Material, sj-pdf-1-caj-10.1177_08465371211041148 - Sociodemographic and Geographic Factors Associated With Non-Obstetrical Ultrasound Imaging Utilization: A Population-Based Study
Supplemental Material, sj-pdf-1-caj-10.1177_08465371211041148 for Sociodemographic and Geographic Factors Associated With Non-Obstetrical Ultrasound Imaging Utilization: A Population-Based Study by Scott J. Adams, Shenzhen Yao, Prosanta Mondal, Hyun Lim, Ivar Mendez and Paul Babyn in Canadian Association of Radiologists Journal
Footnotes
Authors’ Note
This study is based on de-identified data provided by the Saskatchewan Ministry of Health and eHealth Saskatchewan. The interpretation and conclusions contained herein do not necessarily represent those of the Government of Saskatchewan, the Saskatchewan Ministry of Health, or eHealth Saskatchewan.
Acknowledgments
The authors thank Sonia Vanderby, Saskatchewan Health Quality Council, for her assistance in facilitating use of province-wide databases, and Rob Anderson, eHealth Saskatchewan, for assistance in creating the choropleth map.
Declaration of Conflicting Interests
The author(s) declared no potential conflicts of interest with respect to the research, authorship, and/or publication of this article.
Funding
The author(s) disclosed receipt of the following financial support for research, authorship and/or publication of this article: The authors gratefully acknowledge funding from the Saskatchewan Health Research Foundation and Saskatchewan Centre for Patient-Oriented Research.
Supplemental Material
Supplemental material for this article is available online.
References
Supplementary Material
Please find the following supplemental material available below.
For Open Access articles published under a Creative Commons License, all supplemental material carries the same license as the article it is associated with.
For non-Open Access articles published, all supplemental material carries a non-exclusive license, and permission requests for re-use of supplemental material or any part of supplemental material shall be sent directly to the copyright owner as specified in the copyright notice associated with the article.