
Abstract
Purpose:
MRI is commonly used in follow up of high grade glioma. Our purpose is to assess the interrater agreement on the increasingly used visual qualitative assessment of various conventional and advanced MR techniques in the setting of treated high grade glioma in comparison to the well established quantitative measurements.
Methods:
We prospectively enrolled HGG patients who underwent reresection of a new enhancing lesion on post-treatment 3T MR examination including DWI, DCE and DSC sequences. Two neuroradiologists objectively assessed the diffusion and perfusion maps by placing ROI on representative post-processed maps. They subjectively assessed the post-contrast, perfusion and diffusion sequences. Interrater agreement and concordance correlation coefficient were calculated.
Results:
Twenty-eight lesions were included. The interrater agreement on the qualitative assessment was good for k-trans (k = 0.73), moderate for Vp (k = 0.52), fair for AUC and Ve maps (k = 0.37 and 0.21), fair for corrected CBV (k = 0.39) and poor for the enhancement pattern and presence of diffusion restriction (k = 0.02 and 0.07). The concordance between the quantitative measurements was substantial for AUC and Vp (ρc = 0.98 and 0.97), moderate for k-trans and corrected CBV (ρc = 0.94) and poor for Ve and ADC (ρc = 0.86 and 0.24).
Conclusion:
While the quantitative measurements of DSC and DCE perfusion maps show satisfactory inter-rater agreement, the qualitative assessment has lower interobserver agreement and should not be relied upon solely in the interpretation. Similarly, the suboptimal inter-rater agreement on the interpretation of enhancement pattern and diffusion restriction potentially limits their usefulness in differentiating glioma recurrence from treatment related changes.
Introduction
Progressive contrast enhancement is not uncommonly seen on follow up MRI for assessment of high grade glioma response to treatment. It may represent tumor recurrence or treatment related changes due to loss of blood brain barrier in both entities. However, true disease progression is found only in 60% of these cases on pathology.1-3 Treatment related changes include pseudoprogression (PsP), radiation necrosis (RN) and pseudoresponse (PR). While PR after anti-angiogenic therapy manifests as decreased edema and enhancement, PsP and RN present with progressive contrast enhancement, indistinguishable from true disease progression. PsP develops early within 3-6 months after combined chemoradiation, usually subsides spontaneously and is associated with favorable response to treatment and increased survival. RN on the other hand, has a later onset than PsP (most of the cases presenting within the first 3 years after radiation) and causes severe tissue injury often requiring treatment.4-7
The differentiation between tumor recurrence and treatment related changes remains challenging on conventional MR sequences. Different patterns of enhancement have been used to discern treatment related changes from disease progression, yet still with suboptimal diagnostic accuracy.2,8,9 Advanced MR techniques including MR perfusion and diffusion have been increasingly used to differentiate between recurrent glioma and treatment related changes exploiting the pathophysiologic differences between the 2 processes.2,10 The use of diffusion MR relies on the increased cellularity of the recurrent tumours and central coagulative necrosis in treatment related necrosis.2,10-12 MR perfusion provides different parameters highlighting the presence of neoangiogenesis in recurrent tumors. Differences in cerebral blood volume (CBV) between tumors and treatment related changes can be shown on dynamic susceptibility contrast (DSC) MRI utilizing T2/T2* signal loss during the first pass of contrast bolus through the tissues. Dynamic contrast enhanced (DCE) MR perfusion -relying on T1 signal changes in the lesion after contrast administration- provides additional information on vessel permeability in the lesion.13,14
Previous publications have evaluated the diagnostic accuracy of each technique using quantitative assessment of various perfusion parameters.5,15,16 Given that many radiologists, in day to day clinical practice, are used to interpreting the diffusion and perfusion maps visually without objective measurements of the maps, we sought to evaluate the interobserver agreement on this qualitative type of assessment of the different MR techniques in comparison to the more established quantitative measurements in the setting of treated high grade glioma.
Materials and Methods
Patient Population
This prospective study was approved by our institutional research ethics board and a written informed consent was obtained from all the patients. We consecutively enrolled participants from December 2012 to July 2015. We included high grade glioma (HGG) patients who underwent re-resection of a new enhancing lesion identified on clinical post-treatment follow up MRI. The original standard treatment consisted of surgical resection, standard radiation treatment (60 grays (Gy) in 30 fractions of 2 Gy over 6 weeks) and temozolomide therapy. Each patient underwent a follow up research MRI followed by reresection.
MR Imaging Acquisition Protocols
Each patient was scanned on a 3 T MR scanner (Magnetom Trio; Siemens, Erlangen, Germany). Conventional MR protocol using axial T1 pre-contrast (TR = 280 ms, TE = 2.51 ms, flip angle=90º, voxel size= 1.1 x 0.9 x 3 mm), axial FLAIR (TR = 9710 ms, TE = 93 ms, TI = 2580 ms, voxel size=1.1 x 0.9 x 3 mm) and axial T2 (TR = 6910 ms, TE = 97 ms, voxel size=0.7 x 0.7 x 3 mm), post contrast axial T1 volumetric interpolated brain examination (VIBE) (TR = 8.48 ms, TE = 3.21 ms, flip angle=12º, voxel size=1x1x1 mm). We used IV injection of Gadovist 1.0 (Bayer Schering Pharma, Berlin, Germany) (0.1 mmol/kg). The parameters for diffusion tensor imaging: TR = 3100 ms, TE = 106 ms, 20 directions, b = 0/1000, voxel size= 1.3 × 1.3 × 2.5 mm.
DCE-MR imaging was obtained using a 3D FLASH sequence (TR = 6.5 ms, TE = 1.7/3.9 ms, flip angle = 30°, thickness = 5 mm, 18 sections, temporal resolution = 3.5 seconds, duration = 440 seconds). A fixed dose of 0.05 mmol (equivalent to 5 mL) of Gadovist 1.0 (Bayer Schering Pharma, Berlin, Germany) was injected at 2 mL/s. Two 3D volumetric interpolated sequences with different flip angles (TR = 20 ms, TE = 1.22 ms, flip angle = 4° and 25°, thickness = 5 mm, 18 sections) were acquired before and after the dynamic scan and were used to calculate the T1maps.
For DSC imaging, a second equal dose of gadolinium was injected 10 minutes after the first injection, at a rate of 4 mL/s. We used a T2* EPI gradient recalled-echo sequence (TR = 2380 ms, TE = 54 ms, flip angle = 90°, thickness = 5 mm, 18 sections, temporal resolution = 2.5 seconds, duration = 125 seconds). We performed 7 baseline measurements before contrast administration. The first contrast injection for DCE imaging served to decrease the leakage effects before the DSC imaging.
Postprocessing of DSC Images
DSC images were processed using singular value decomposition as implemented in a commercially available software (Olea Sphere 1.3, Olea Medical, La Ciotat). MR signal intensity was converted to T2 relaxation rate. An automated algorithm selected the most suitable pixels for the vascular input function (VIF). The signal intensity (SI) was converted to relative change in R2 using the standard expression: delR2(t) = -ln(S(t)/So)/TE where S is the SI at time t, So is the baseline SI and TE is the echo time. Corrected CBV maps were generated by applying correction for leakage in rCBV calculations using pre-injection of contrast agent and linear fitting to estimate the T1 contamination caused by extravasation of contrast agent.
Postprocessing of DCE Images
DCE images were processed directly in the software Olea Sphere to generate maps of area-under-the curve (AUC), plasma volume (Vp) and volume transfer coefficient (Ktrans). The SI was converted to percent change in signal intensity (relSI) using the expression: relSI(t) = 100*(S(t)-So)/So, where S is the SI at time t and So is the baseline SI. The relative change in 1/T1 was estimated from this relative change in signal intensity assuming a linear relationship. The VIF was selected from a small region of interest (ROI) placed in the superior sagittal sinus directly from the DCE images. Signal conversion was set as SI to relSI(%).
Image Interpretation
The post-processed parametric maps were coregistered to the corresponding axial T1-weighted postcontrast images. Two neuroradiologists (10 years of experience for CT and 12 years for SC), blinded to the clinical information, separately assessed the conventional and advanced MRI sequences, including perfusion and diffusion.
Both neuroradiologists classified the enhancement pattern of each lesion based on previous classification provided by Reddy et al. 8 into: Solid enhancement with distinct margin, focal enhancing nodule, peripherally enhancing rim with indistinct margins, hazy mesh-like enhancement 8 or punctate enhancement. Prior to assessing the study lesions, both readers were trained on the classification with reference images of each category available for their review at the time of cases reading.
Each reader separately performed quantitative and qualitative assessment of perfusion and diffusion sequences. For the qualitative assessment, each reader assessed all the perfusion maps and categorized the lesions into: low [similar to the white matter], intermediate [similar to the cortex] and high [similar to the choroid plexus] (Figure 1–3). For the quantitative analysis, each reader performed hot spot analysis for each map by placing multiple ROIs (20-30 mm2) on the highest perceived values within the lesion avoiding nearby vessels and in the contralateral white matter avoiding areas of white matter abnormality. ADC maps were visually inspected for presence or absence of diffusion restriction compared with the contralateral normal appearing white matter. A ROI was placed on the regions with lowest ADC value.
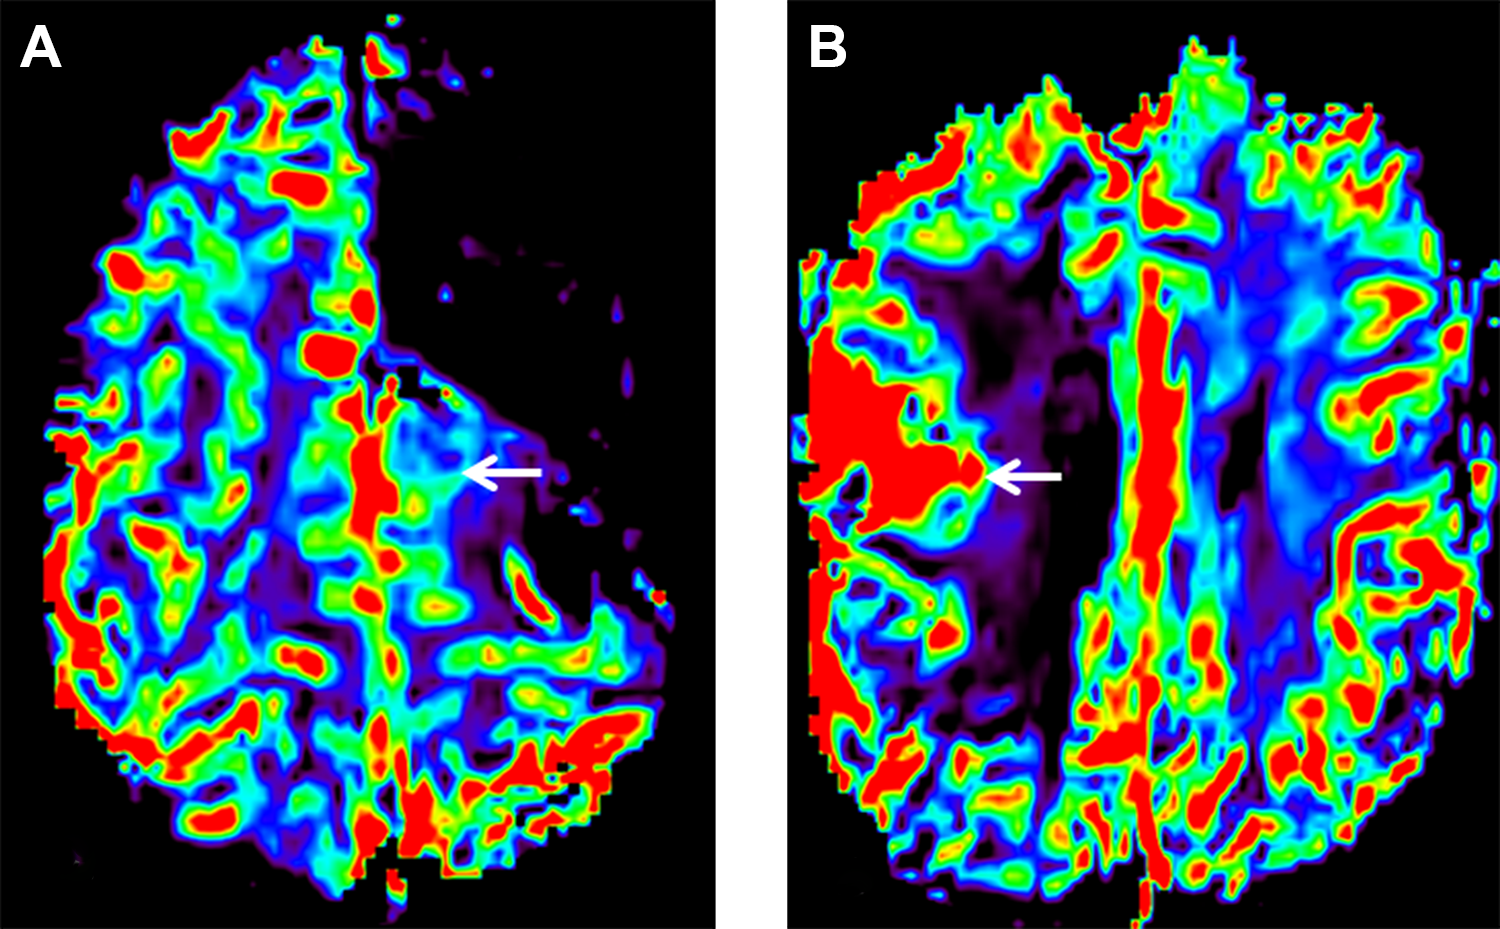
Qualitative assessment of corrected CBV maps: Axial dynamic susceptibility contrast perfusion derived corrected CBV maps showing intermediate (A) and high (B) blood volume in 2 different lesions (arrows).
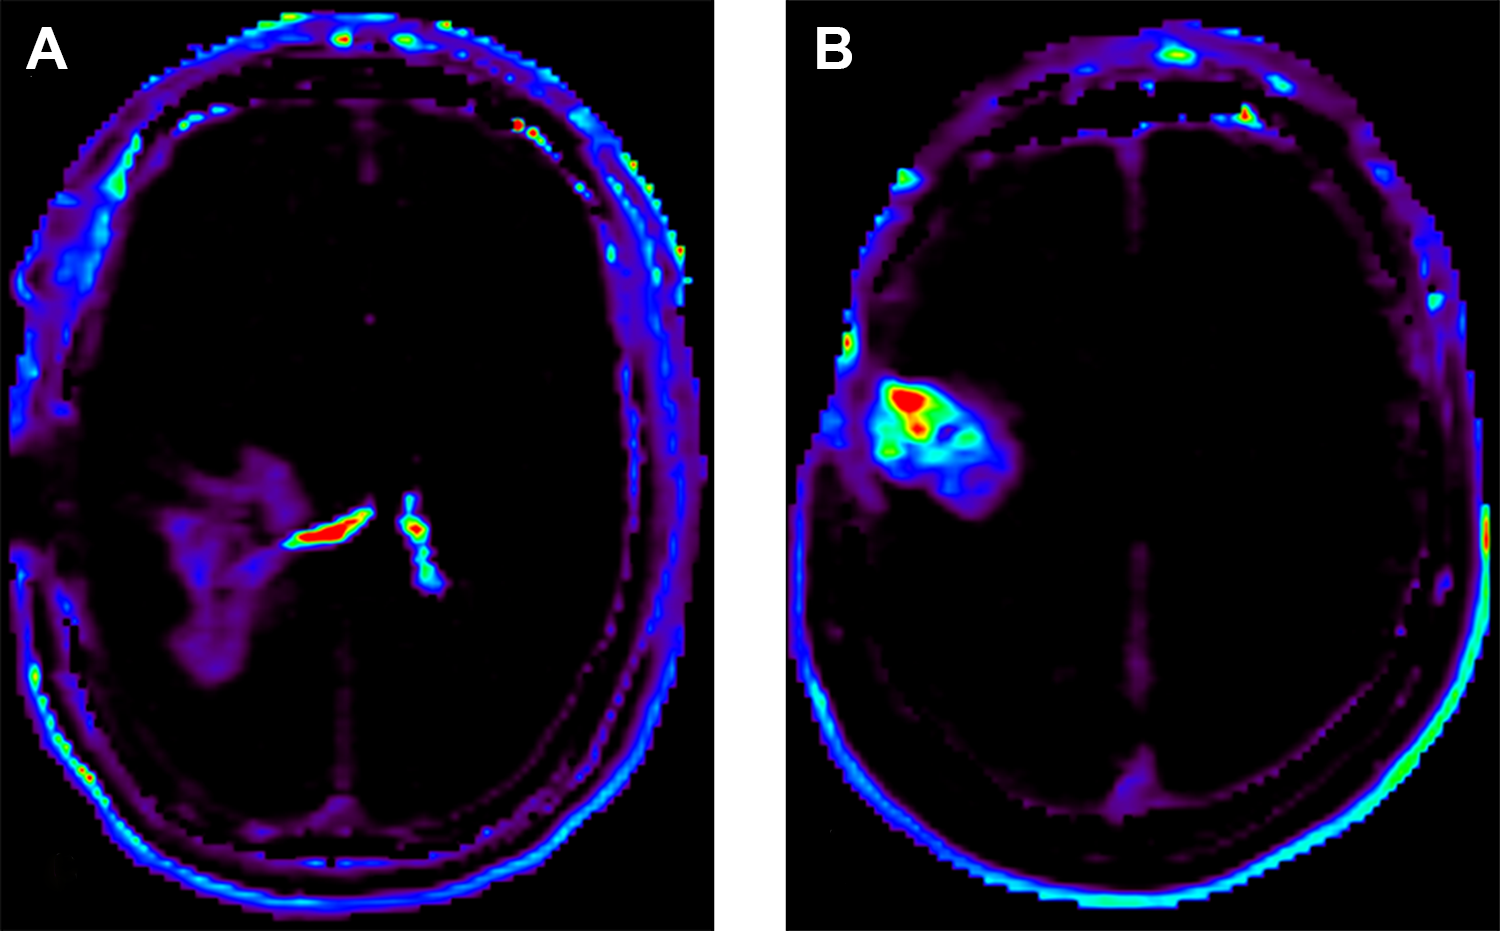
Qualitative assessment of k-trans maps: Axial dynamic contrast enhanced MR perfusion derived k-trans maps showing intermediate (A) and high (B) values in 2 different lesions. Note increased K-trans in the choroid plexuses of the lateral ventricles (A).
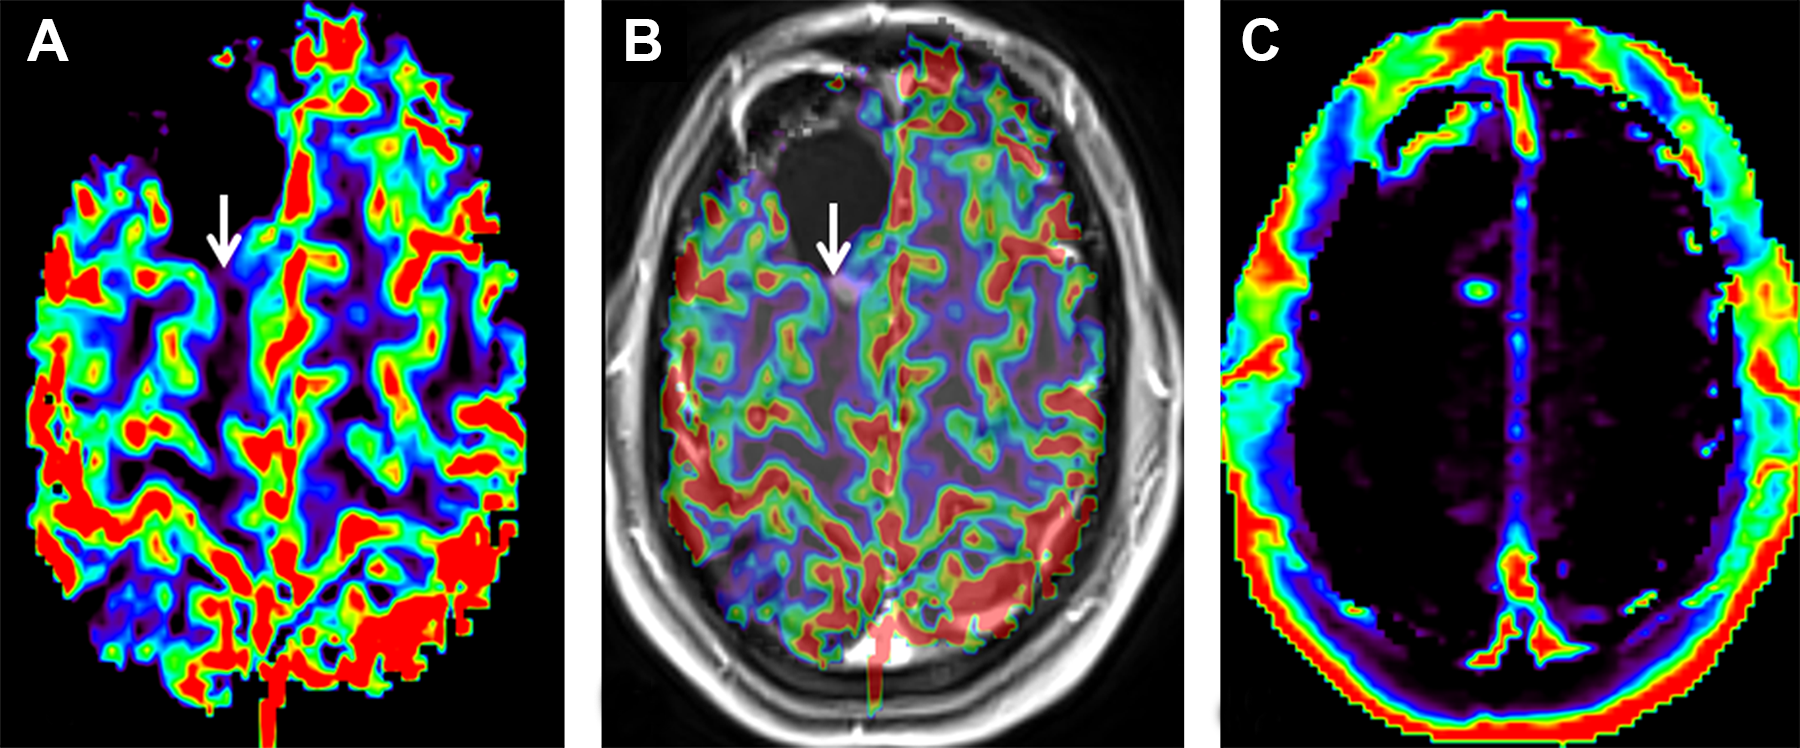
Low corrected CBV: Axial dynamic susceptibility contrast MR derived corrected CBV map (A) and axial post-contrast T1WI with coregistered corrected CBV map (B) showing low CBV in a solid enhancing nodule. Contrast enhanced MR perfusion derived k-trans map (C) showing intermediate K-trans in the same lesion.
Statistical Analysis
Inter-rater agreement statistics (k, Kappa) was calculated for the enhancement pattern classification and visual assessment of diffusion and perfusion maps. The strength of agreement is poor for k < 0.20, fair for k 0.21 - 0.40, moderate for k 0.41 - 0.60, good for k 0.61 - 0.80 and very good for k 0.81 - 1.00.
Comparison of the quantitative perfusion and ADC measurements between the 2 readers was performed using concordance correlation coefficient (
Mann-Whitney and Kruskal-Wallis tests were used to assess for presence of significant differences between the quantitative measurements and the visual assessment of diffusion and perfusion maps respectively for each reader. A P value of 0.05 indicated statistical significance. All data were analyzed by using MedCalc (Version 12; MedCalc Software, Ostend, Belgium).
Results
Twenty-seven consecutive patients were enrolled in the study with a total of 28 lesions. One patient had 2 lesions; each was assessed separately. There were 18 males and 9 females with a median age of 51 years (SD 26.8 years). At the time of the original diagnosis, 18 patients had glioblastoma (WHO grade IV) and 9 patients had grade III gliomas. Nine patients had isocitrate dehydrogenase (IDH) mutant tumors and 11 patients had IDH wild-type tumors. The IDH status was not tested for 7 patients.
The lesions were identified on clinical post-treatment follow up MRIs and were reassessed on the study MRI followed by reresection. The median interval between the research study MR and the last radiation treatment received was 320 days (SD 1088.9 days). The median interval between the research study MR and the first clinical MRI showing the new enhancing lesions was 34 days (SD 61.6 days). Most of the lesions (82.2%) were resected within a month after the research MRI (median 22.5 days, SD 63.6, range 2-281 days).
Quantitative measurements: The concordance between the DCE-derived hotspot measurements for the 2 readers was substantial for AUC and Vp map (
Concordance of ADC, DCE and DSC Parameters.
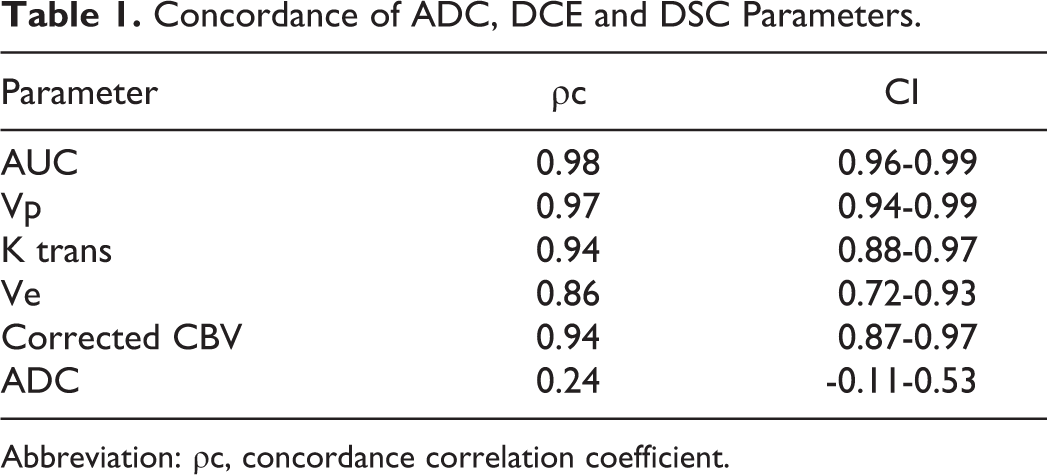
Abbreviation: ρc, concordance correlation coefficient.
Qualitative assessment: For the DSC perfusion, the interobserver agreement on corrected CBV maps visual assessment was fair (k = 0.39; 95% CI: 0.1 – 0.68). The interrater agreement on the visual DCE maps qualitative assessment was good for the k-trans map (k = 0.73; 95% CI: 0.46 - 1.0); moderate for the Vp map (k = 0.52; 95% CI: -1.0 - 1.0) and only fair for the AUC and Ve maps (k = 0.37; 95% CI: -0.005 to 0.74) (k = 0.21; 95% CI: -0.17 - 0.59).
The inter-rater agreement on the presence of diffusion restriction was poor (k = 0.07; 95% CI: -0.16 - 0.31). There was also poor agreement on the enhancement pattern classification between the two readers (k = 0.02; 95% CI: -0.29 - 0.33) (Table 2).
Interobserver Agreement on DCE MR, DSC MR, DWI and Enhancement Pattern.
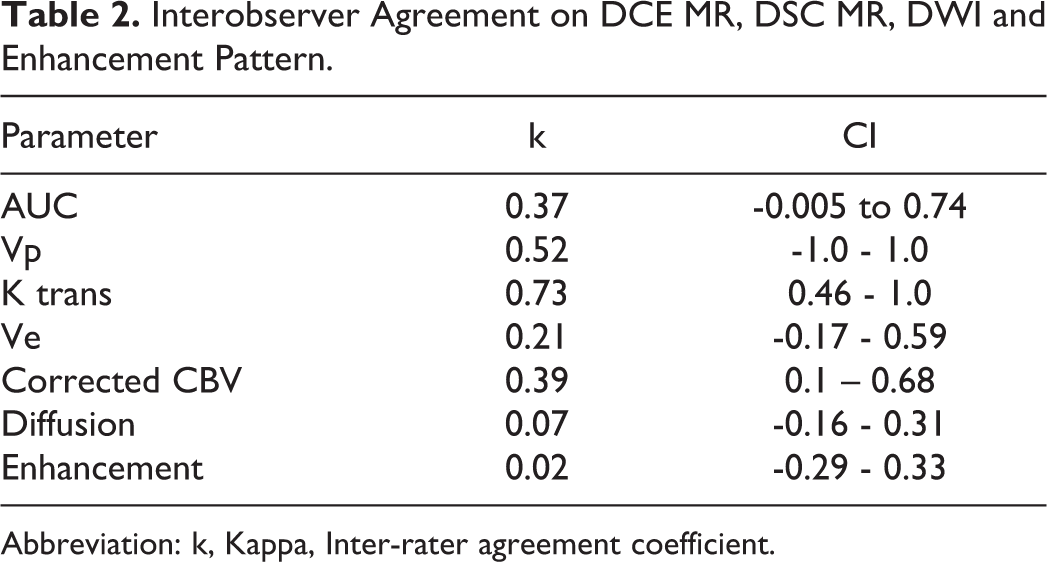
Abbreviation: k, Kappa, Inter-rater agreement coefficient.
Comparing the visual and the quantitative assessment for each reader, there was no statistically significant difference in perfusion parameters values corresponding to the subjective visual categorization into low, intermediate or high perfusion. The only exception was statistically significant difference (P = 0.005) for the corrected CBV map for reader 2. There was significant difference in ADC values between the cases classified by reader 2 as showing diffusion restriction and those without [P = 0.03, median ADC was 899 (95% CI: 454.35-1299.41) and 1211 (95% CI: 1038.75-1626.5) respectively].
Discussion
Our study showed suboptimal agreement on the visual assessment of the corrected CBV maps, and, apart from the K-trans maps, there was also lower interobserver agreement on the qualitative interpretation of the DCE derived maps when compared to the quantitative measurements. Moreover, there was no significant quantitative differences between the perfusion categories based on our visual classification. Poor interrater agreement was also noted on the presence and quantification of diffusion restriction in a lesion as well as on the classification of its pattern of enhancement.
Our results regarding the interrater agreement on DSC derived corrected CBV maps interpretation are different from those by Kerkhof et al, 17 who showed suboptimal interobserver agreement on quantitative rCBV assessment and good agreement on visual interpretation of rCBV maps. Of note, our classification of the perfusion maps included 3 categories while they only classified the rCBV into high and low. 17 The satisfactory interobserver agreement on quantitative corrected CBV measurements in our study is in agreement with prior study by Hirai et al. 18 It should be noted that in that study they assessed the relative cerebral blood flow (rCBF) rather than rCBV. However, previous studies had demonstrated strong correlation between the rCBV and rCBF ratios in gliomas.19,20
The satisfactory agreement on quantitative measurements of DCE derived perfusion maps in our study is in agreement with the results reported by Heo, et al. although they have only assessed the AUC maps. 21
Different enhancement patterns classifications have been used for lesion characterization in HGG post-treatment follow up setting. Reddy et al described enhancement patterns with a sensitivity, specificity and accuracy of 94%, 50% and 71% for predicting radiation necrosis and 85%, 33% and 61% for tumor recurrence respectively. 8 In another study, a spreading wavefront pattern of enhancement was assessed and showed sensitivity, specificity and accuracy of 50%, 81.3% and 68% for predicting radiation necrosis, however was not statistically significant (P = 0.13). 9 While these studies demonstrate the suboptimal accuracy of enhancement pattern in discriminating treatment related changes from disease progression, our study highlights that the classification of different enhancement patterns also suffers from suboptimal interobserver agreement, significantly adding to the suboptimal performance of this approach and limiting its usefulness in daily clinical practice.
DWI is widely used to differentiate HGG recurrence from treatment related changes with lower ADC values in tumor recurrence due to increased cellularity.22,23 However, treatment related necrosis can also be associated with central diffusion restriction in the non-enhancing central component due to coagulative necrosis.12,24 While excellent interrater agreement was noted on the qualitative interpretation of DWI for detection of acute stroke,25,26 in our study, we found poor agreement on presence of diffusion restriction in an enhancing lesion. This could be, in part, related to the fact that diffusion restriction seen with tumor recurrence is usually not as hyperintense on diffusion trace images as the restriction seen with cerebral infarction or abscess. Another possible explanation could be the heterogeneity of the lesions seen in posttreatment HGG follow up which commonly consist of a mixture of tumor recurrence and treatment related changes.
We also found poor agreement between the readers on the ADC measurements which is in agreement with previous study by Heo et al who found lower interclass correlation of the ADC measurement compared to DCE perfusion assessment. 21 Previous studies have also shown interobserver variability of ADC measurements in different anatomical locations.27,28 Our findings regarding the poor agreement on quantitative and qualitative DWI interpretation, emphasize the conclusion of a published metanalysis, that despite moderate diagnostic performance of DWI in differentiating radiation changes and tumor recurrence, it should not be relied upon solely in making this decision. 11
The study has some limitations. In our quantitative measurements, we did not use histogram analysis or assessment of the whole lesion volume. Instead, we used ROI on representative images of the lesion which would be more practical to use in day to day clinical practice. We did not assess the diagnostic accuracy of the MR perfusion and DWI as this was not the scope of our study and has been separately published based on a larger prospective cohort. 29 Similarly, the readers were blinded to the timing of the study MRI in respect to the completion of chemoradiation, IDH tumor status as well as to the radiation planning maps, which are important pieces of information for the radiologist reporting this type of studies in real life and would impact the radiologist’s final diagnostic considerations. However, in this study, we were interested in the agreement between different neuroradiologists on the assessment of these imaging sequences commonly used in the post-treatment follow up of HGG. Finally, given that we included a small group of patients, future studies with larger cohorts are needed to confirm our findings.
In summary, there is greater interobserver variability on the qualitative assessment of DSC and DCE MR perfusion maps compared to the well established quantitative approach, potentially limiting the usefulness of these techniques in clinical practice if the radiologists rely solely on the visual assessment. Similarly, the suboptimal inter-rater agreement on the enhancement pattern classification and the presence of diffusion restriction in a lesion potentially limits their usefulness in differentiating glioma recurrence from treatment related changes.
Footnotes
Authors' Note
This manuscript has not been published previously, and that it is not currently under consideration for publication by any other journal.
Declaration of Conflicting Interests
The author(s) declared no potential conflicts of interest with respect to the research, authorship, and/or publication of this article.
Funding
The author(s) disclosed receipt of the following financial support for the research, authorship, and/or publication of this article: This study is supported by grant from the Brain Tumour Foundation of Canada.