
Abstract
Introduction
Stereotactic radiosurgery (SRS) has become the standard treatment for brain metastases, either combined with surgery or alone, given its efficacy in tumor control and functional autonomy for patients.1,2 Nevertheless, while SRS is generally well tolerated, one of the major risks following treatment is the development of radiation necrosis (RN).2-4 The incidence of RN ranges from 17 to 24% at 12 months to 34% at 24 months.5,6 The likelihood of RN may also increase if SRS is combined with other therapies, such as immunotherapy. 7
Distinguishing between RN and tumor recurrence (TR) is crucial as treatment differs and may lead to unwarranted patient anxiety. The former can be a self-resolving condition or be treated conservatively with observation and steroids, while the latter may require an aggressive approach with surgical intervention and additional radiotherapy (RT). Radiologists have traditionally relied on the lesion morphology and enhancement pattern on magnetic resonance (MR) images to differentiate between RN and TR. Unfortunately, this has not been helpful in clinical practice. 8 As a result, advanced MR imaging (e.g., MR perfusion and MR spectroscopy) and other tests such as SPECT and PET have been implemented to address this problem. However, these techniques are often not widely available and are difficult to incorporate into everyday practice, given the time required for imaging post-processing and analysis.
In patients with treated high-grade gliomas, Zakhari et al. 9 reported the presence of centrally restricted diffusion in diffusion-weighted imaging (DWI) in a newly centrally necrotic lesion as being highly specific for RN. A similar diagnostic performance was obtained in a validation study. 10 To date, the data in cerebral metastatic disease has been sparse, with only one small population study demonstrating the utility of DWI in necrotic enhancing lesions following SRS. 11 Therefore, additional studies are required to confirm the clinical utility of this sequence in treated metastases. We aimed to evaluate the diagnostic accuracy of the centrally restricted diffusion sign for differentiation between RN and TR in the context of treated brain metastases.
Material and Methods
Study Population
We performed a retrospective analysis of consecutive patients with cerebral metastatic disease who developed a newly necrotic enhancing lesion suspicious for RN or TR after treatment (radiation therapy with or without surgery) from January 2009 to December 2020 (Figure 1). The institutional ethics board approved this study, and the requirement for informed consent was waived. The Standards for Reporting Diagnostic Accuracy Studies (STARD)
12
was followed. Demographics and treatment-related variables were recorded. Patient flowchart. RN = radiation necrosis. *Lesion with < 6 months imaging follow-up.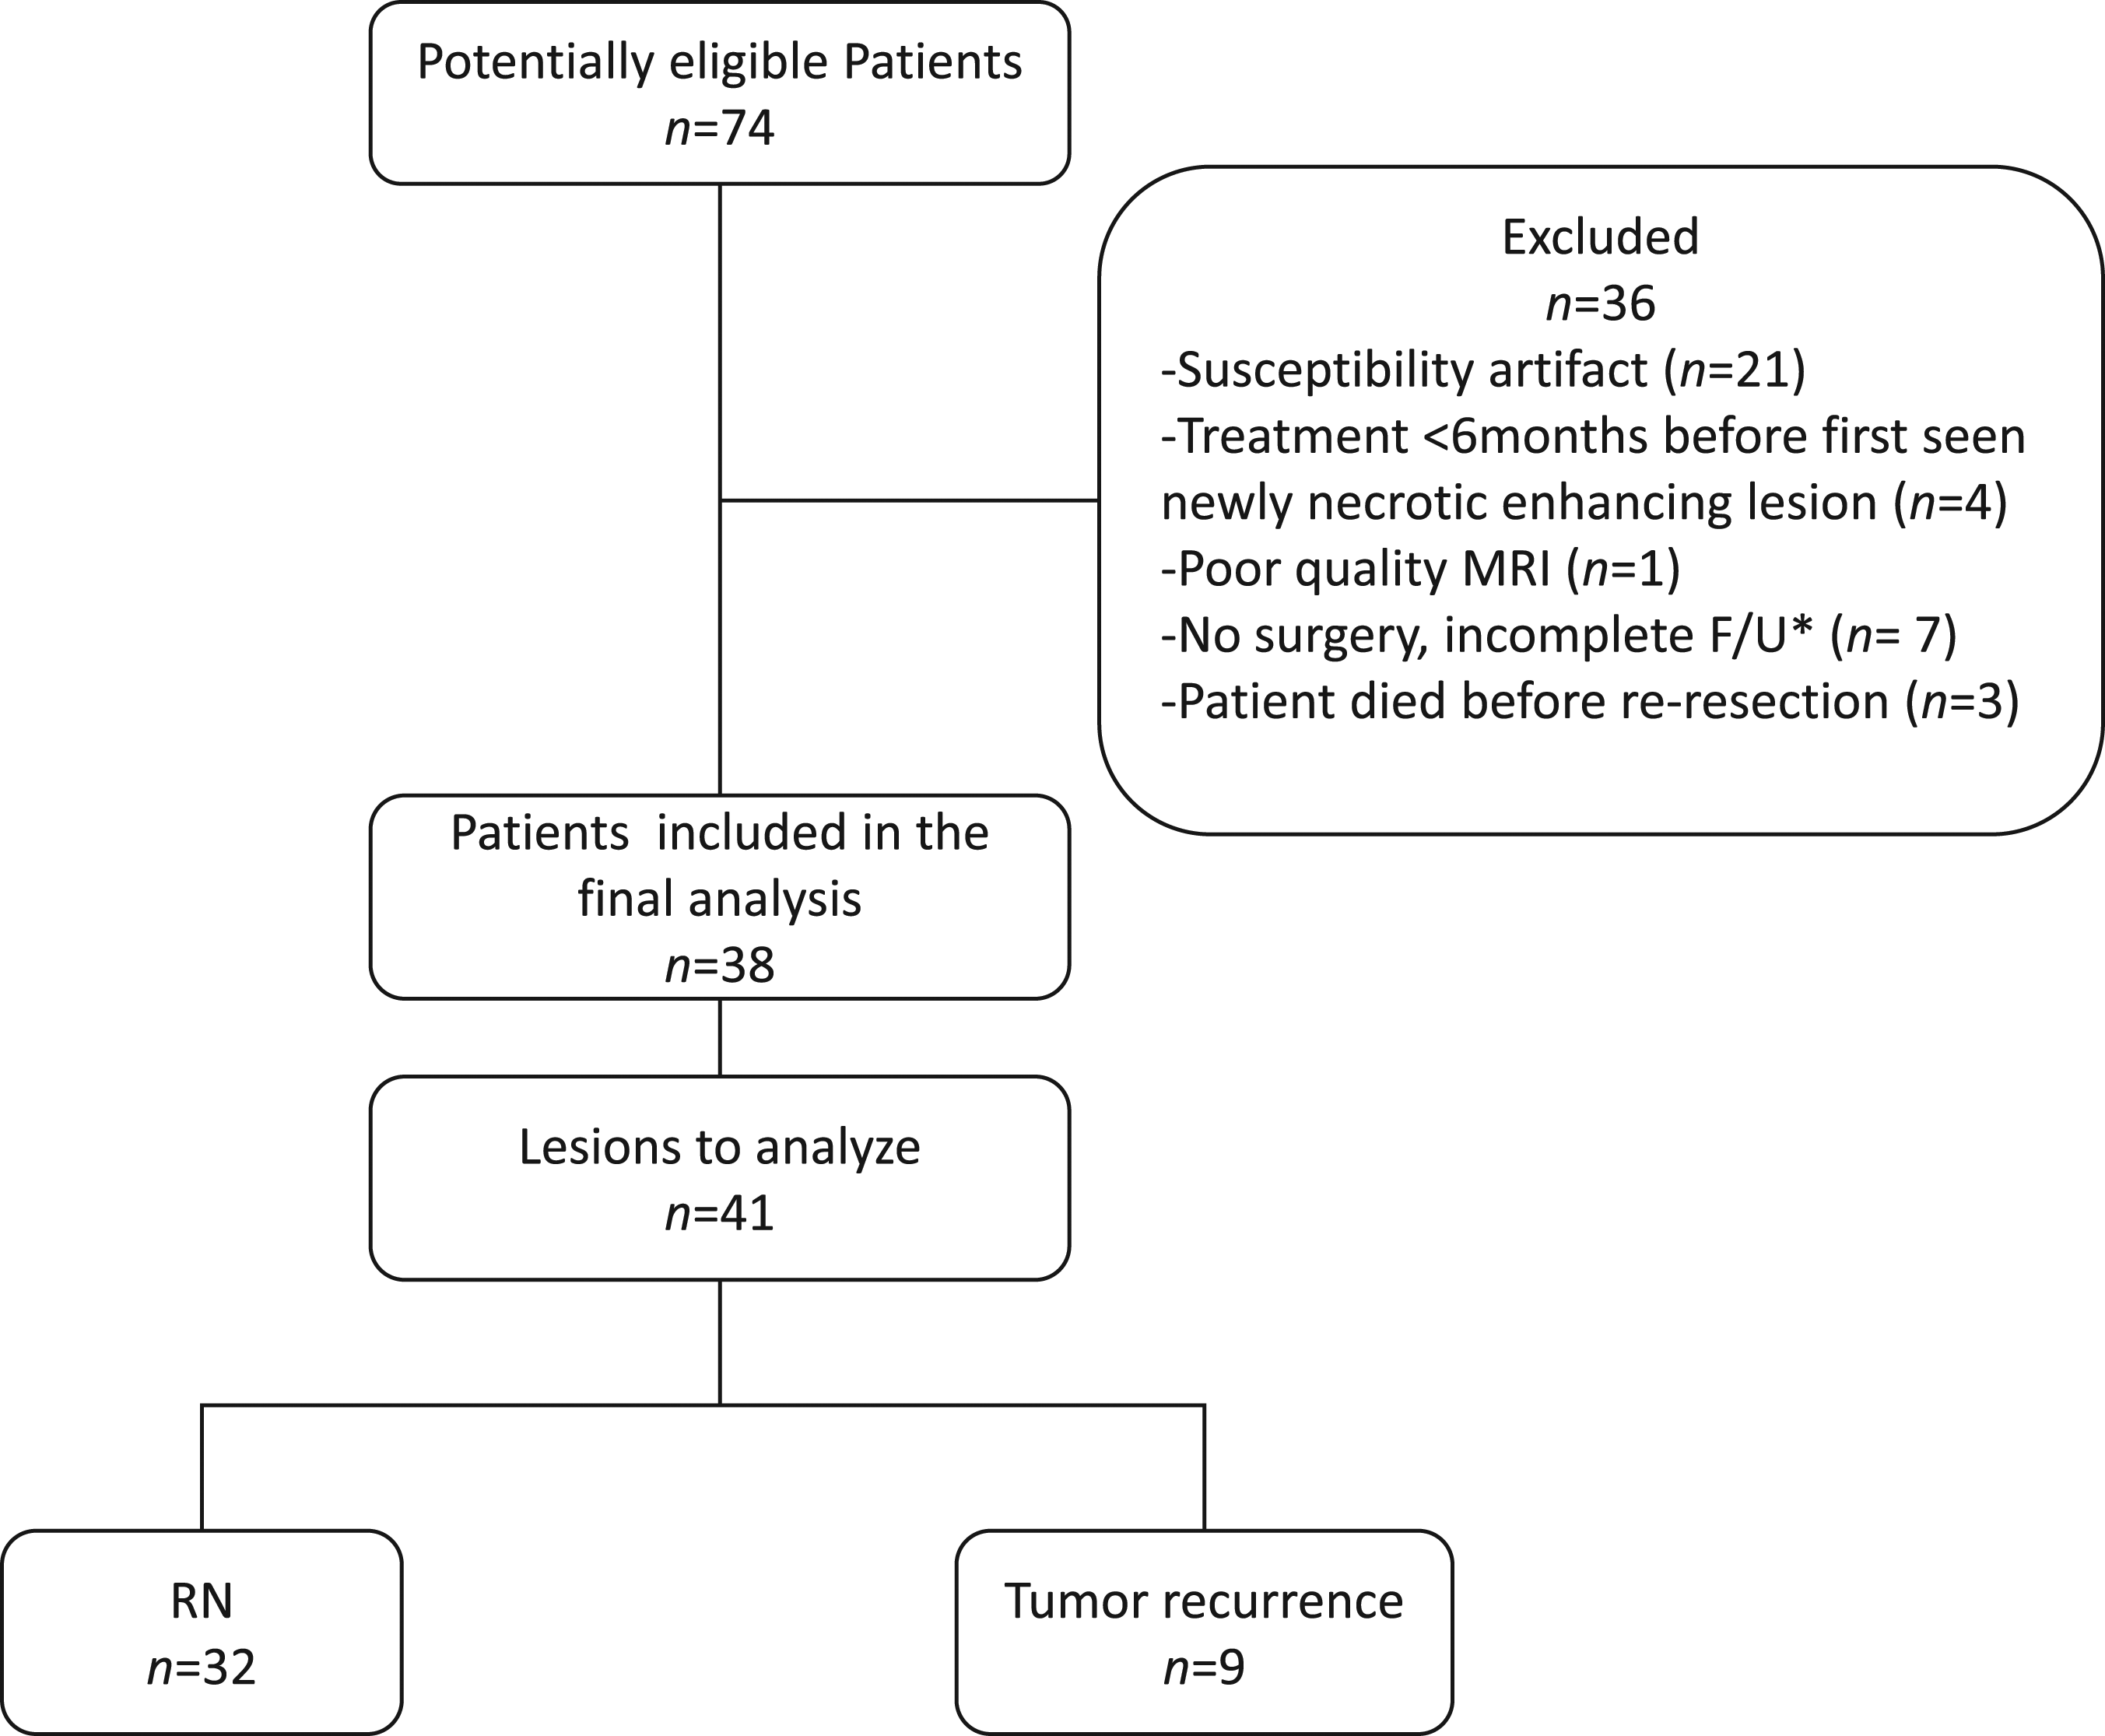
Inclusion Criteria
Adult patients (>18 years old) presented a newly necrotic enhancing lesion on imaging >6 months after treatment. A necrotic enhancing lesion was defined as a ring-enhancing lesion with a central non-enhancing fluid signal intensity component. The >6 months after treatment interval was chosen to avoid the confounding postoperative products and reactive contrast enhancement effect on DWI 13 and T1-weighted post gadolinium, 14 respectively.
Exclusion Criteria
Patients were excluded if they had surgical resection of the newly necrotic enhancing lesion >6 weeks after the last imaging follow-up (index MRI study). A short interval between surgery and imaging follow-up was chosen to ensure the histopathological analysis was representative of the imaging findings. Lesions with prominent blooming artifacts (> 50% of the lesion volume), small size (<1 cm in maximal diameter), or motion artifacts were excluded.
Magnetic Resonance Imaging Acquisition, Interpretation, and Analysis
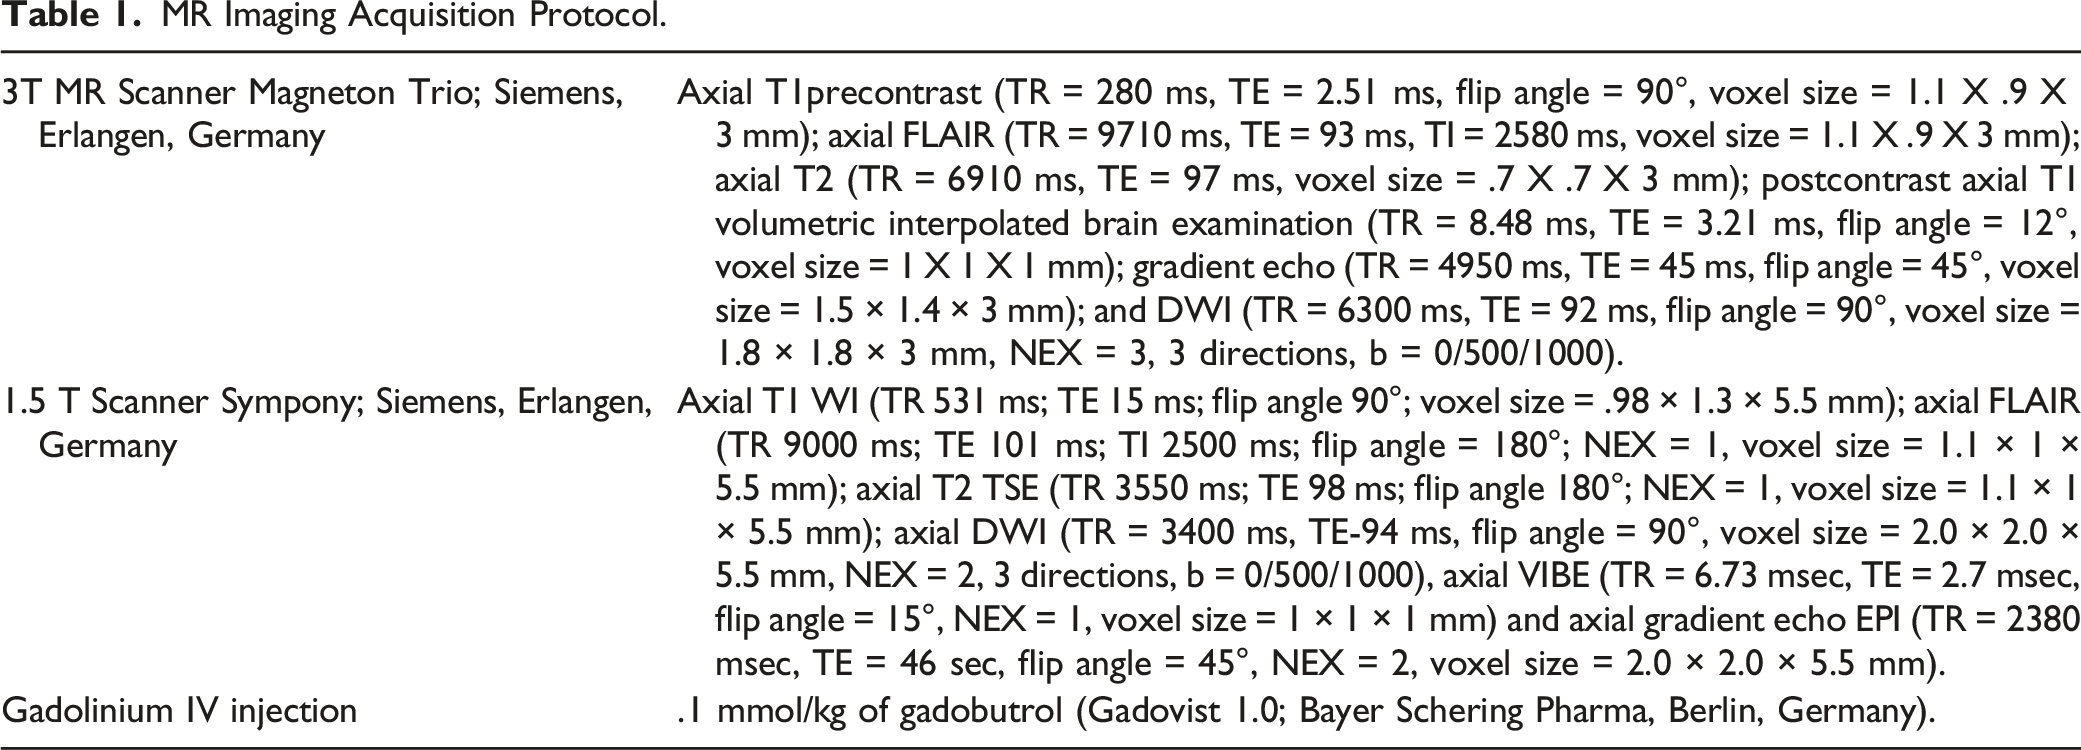
MR Imaging Acquisition Protocol.
Three neuroradiologists assessed the lesions, blinded to the clinical and histopathology analysis. For the quantitative analysis, the apparent diffusion coefficient (ADC) maps were co-registered to the axial T1-weighted postcontrast images using commercially available software (Olea Sphere 3.0; Olea Medical, La Ciotat, France). One reader (5 years of experience) manually placed 3 separate regions of interest (ROI) (20–30 mm2) in each lesion’s enhancing and non-enhancing components, and the minimum ADC value was recorded (Figure 2). The minimum ADC value was defined as the mean value of the ROI with the lowest ADC value. Regions of interests were also placed in the contralateral normal-appearing white matter. Finally, the following ADC ratios were calculated: ADC necrosis ratio = ADC central necrosis/ADC white matter; ADC enhancement ratio = ADC enhancing component/ADC white matter; and ADC necrosis/enhancement ratio = ADC central necrosis/ADC enhancing component. Quantitative image analysis. Axial T1-weighted postcontrast-enhanced MR image (A) demonstrating a centrally necrotic lesion in the left occipital lobe. Manually drawn ROIs are placed on the ADC map (B) in the non-enhancing necrotic component (yellow circle) and the solid peripheral enhancing rim (red circle).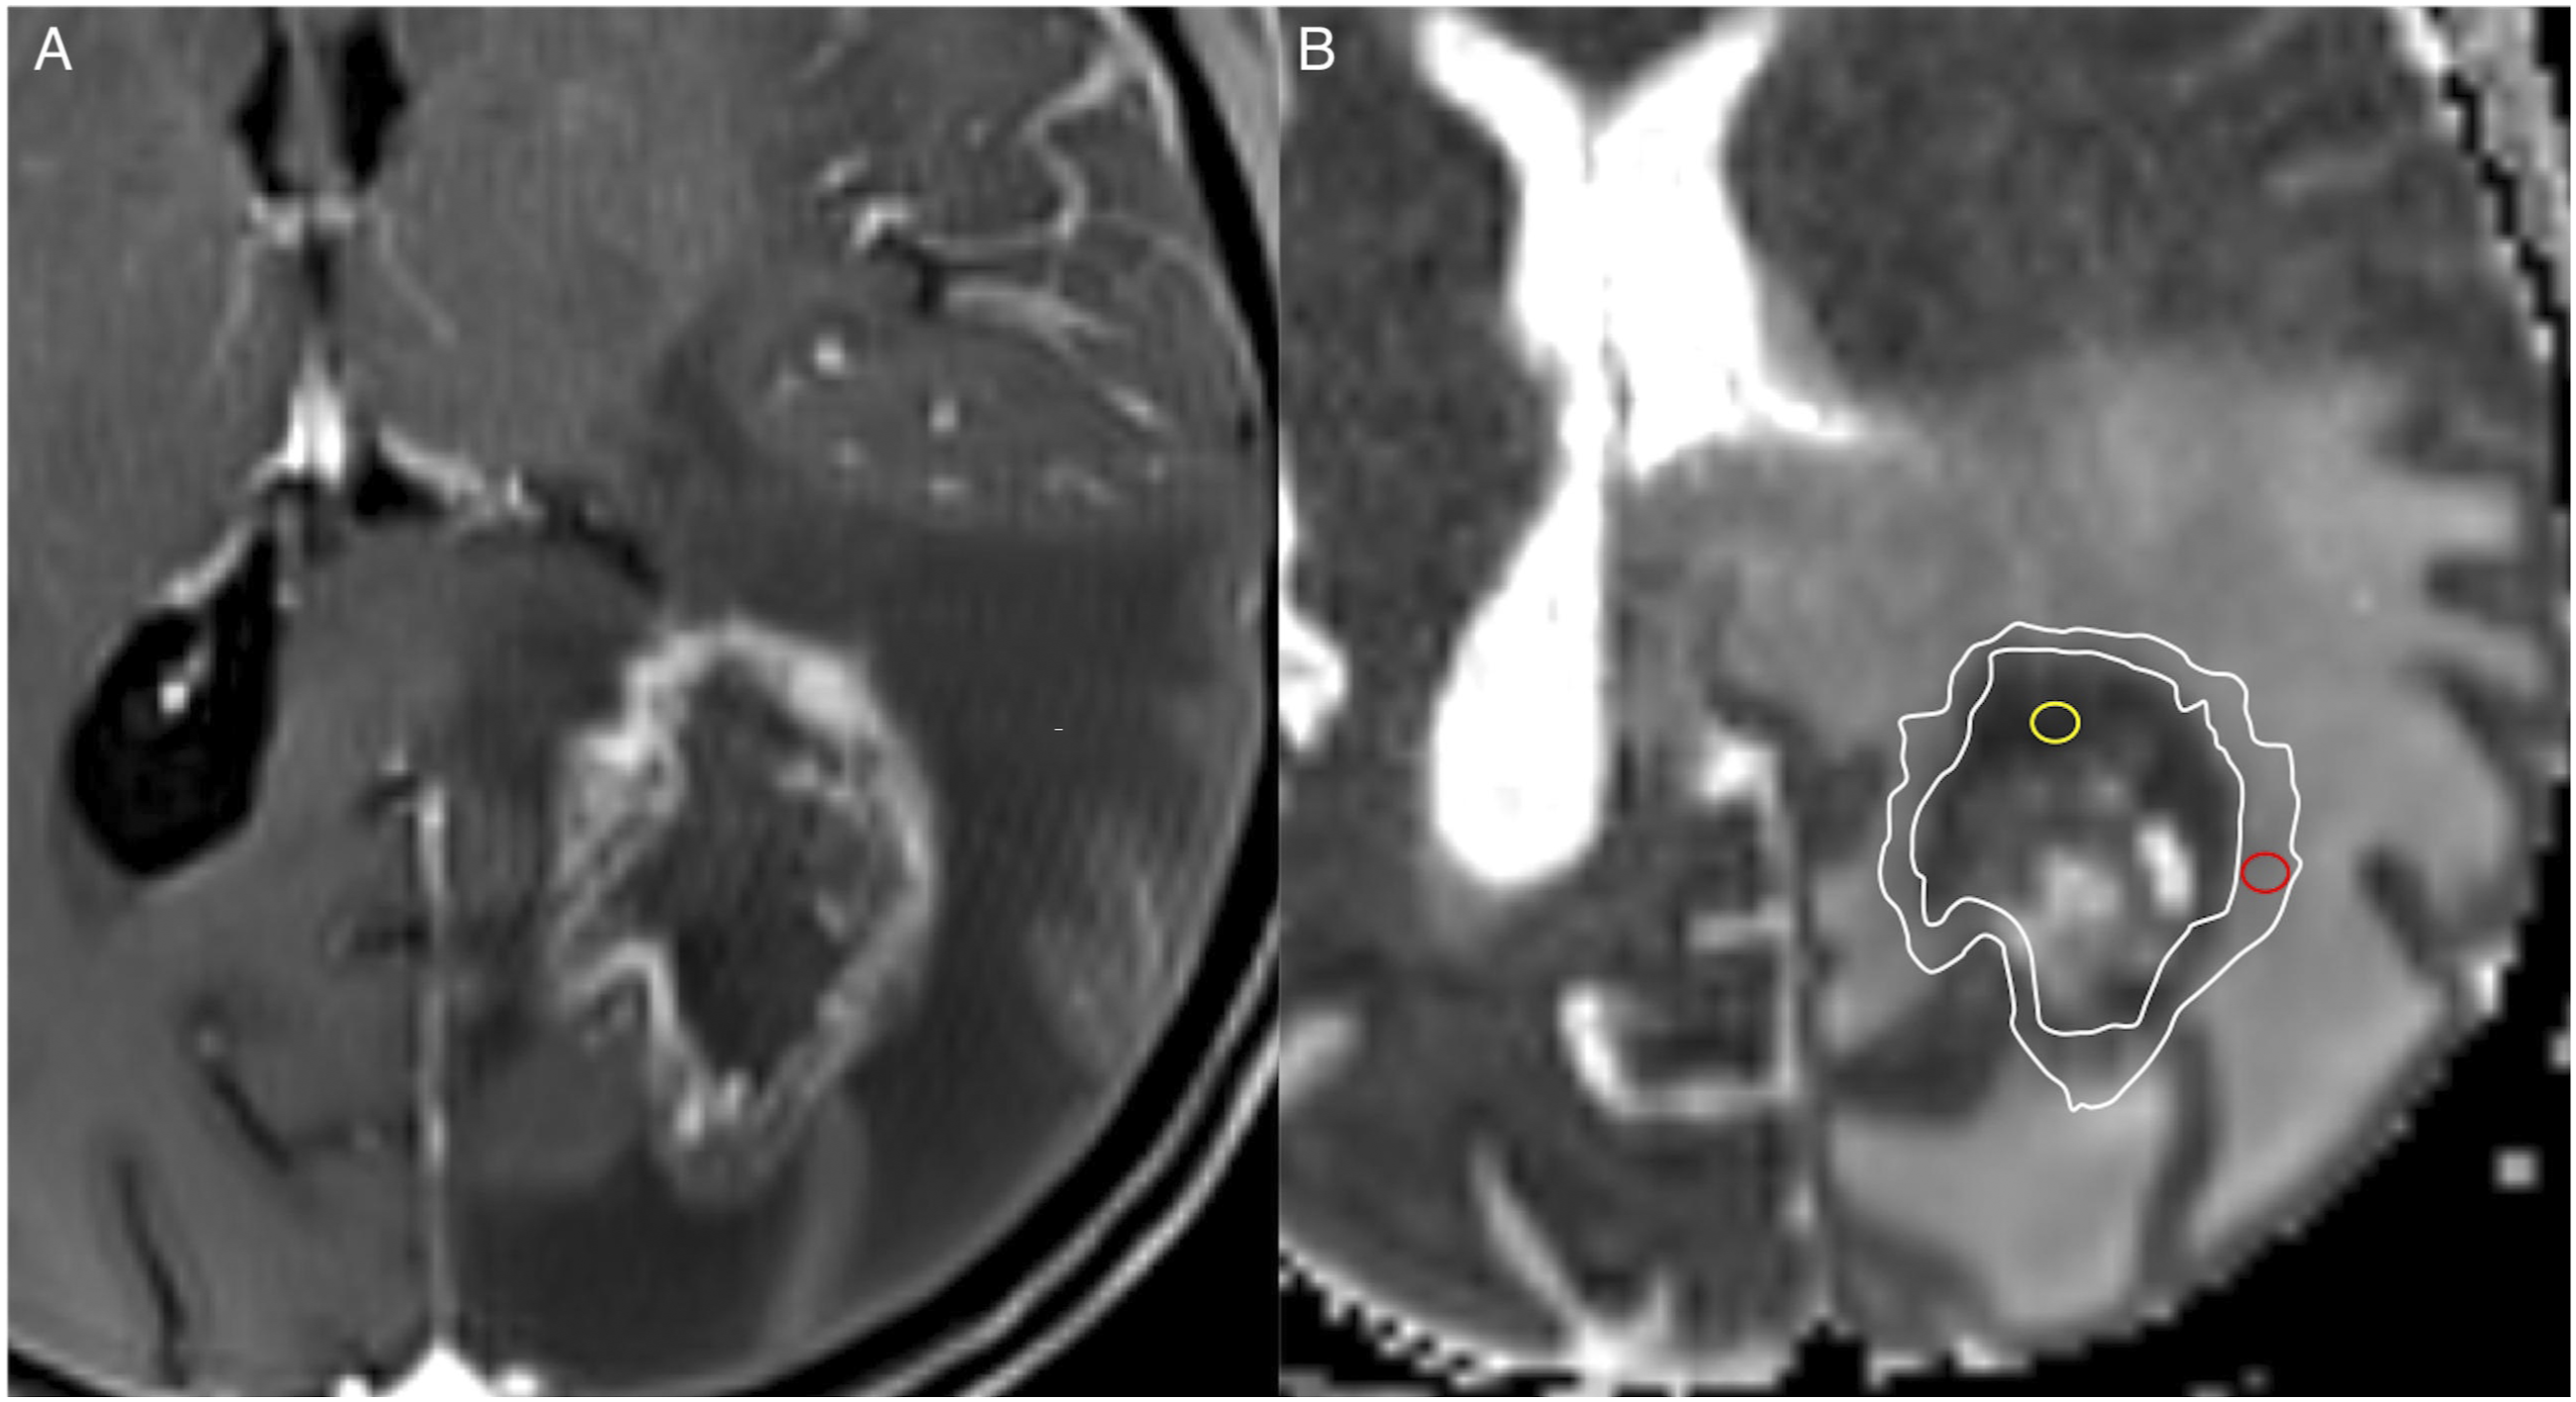
For the qualitative assessment, 2 readers (20 years and 7 years of experience) determined the status of restricted diffusion in the enhancing and central non-enhancing lesion components, recorded as present or absent. The presence of restricted diffusion was defined as a region showing hyperintensity on b1000 trace images with corresponding ADC values less than or equal to normal-appearing white matter. If restricted diffusion was present, they visually quantified its extent as < 50% or > 50% to the total size of each component (solid enhancing and central non-enhancing parts). Disagreements were resolved by consensus.
Lesion Classification and Reference Standard
Histopathology analysis was used as the reference standard. The lesions were categorized by an experienced neuropathologist (30 years of experience) into TR or RN depending on the fraction showing a higher proportion (>75%) relative to the tissue area (i.e., predominant RN or predominant TR). This cut-off value was used to classify the lesions, given the implications of the amount of RN or TR on patients’ survival. Radiation necrosis has been demonstrated to have the strongest association with survival (i.e., the more RN found in a specimen, the longer the survival rate). 15 In cases where the clinical decision was not to proceed with surgical resection, we relied on the lesion evolution on imaging follow-up during at least 6 months, with shrinkage or resolution of it diagnostic of RN and lesion enlargement diagnostic of TR.16,17
Statistical Analysis
Categorical variables were reported as percentages, and differences between RN and TR groups were assessed using Fisher exact tests. Continuous variables were presented as mean (SD) for parametric data or median (interquartile range, IQR) for nonparametric data. Two-sided Mann–Whitney U tests assessed between-group differences in SRS radiation dose, the number of fractions, ADC values, and ADC ratios. While a P-value of .05 was initially considered significant, a stepwise Holm–Bonferroni procedure was applied to counteract the potential for type I errors due to multiple comparisons. 18 We performed receiver operating characteristic (ROC) analysis to assess the diagnostic accuracy of the minimum ADC and the previously defined ADC ratios for RN diagnosis. The Youden index 19 was used to identify the optimal cut-off value that provided the highest combination of sensitivity and specificity for the identification of RN. Differences in ADC values and ratios based on field strength (1.5 T vs 3T) were assessed by either Mann–Whitney U or Kruskal–Wallis tests, as appropriate. The Cohen kappa (k) 20 was calculated to assess the interobserver agreement for the qualitative assessment. A k < .2 indicated slight agreement; .21–.4, fair agreement; .41–.6 moderate agreement; .61–.80, substantial agreement, and .81–1.00, almost perfect agreement. 21 SPSS v27 (IBM, Armonk, New York) was used for the statistical analysis.
Results
Summary of Demographics in 38 Patients.
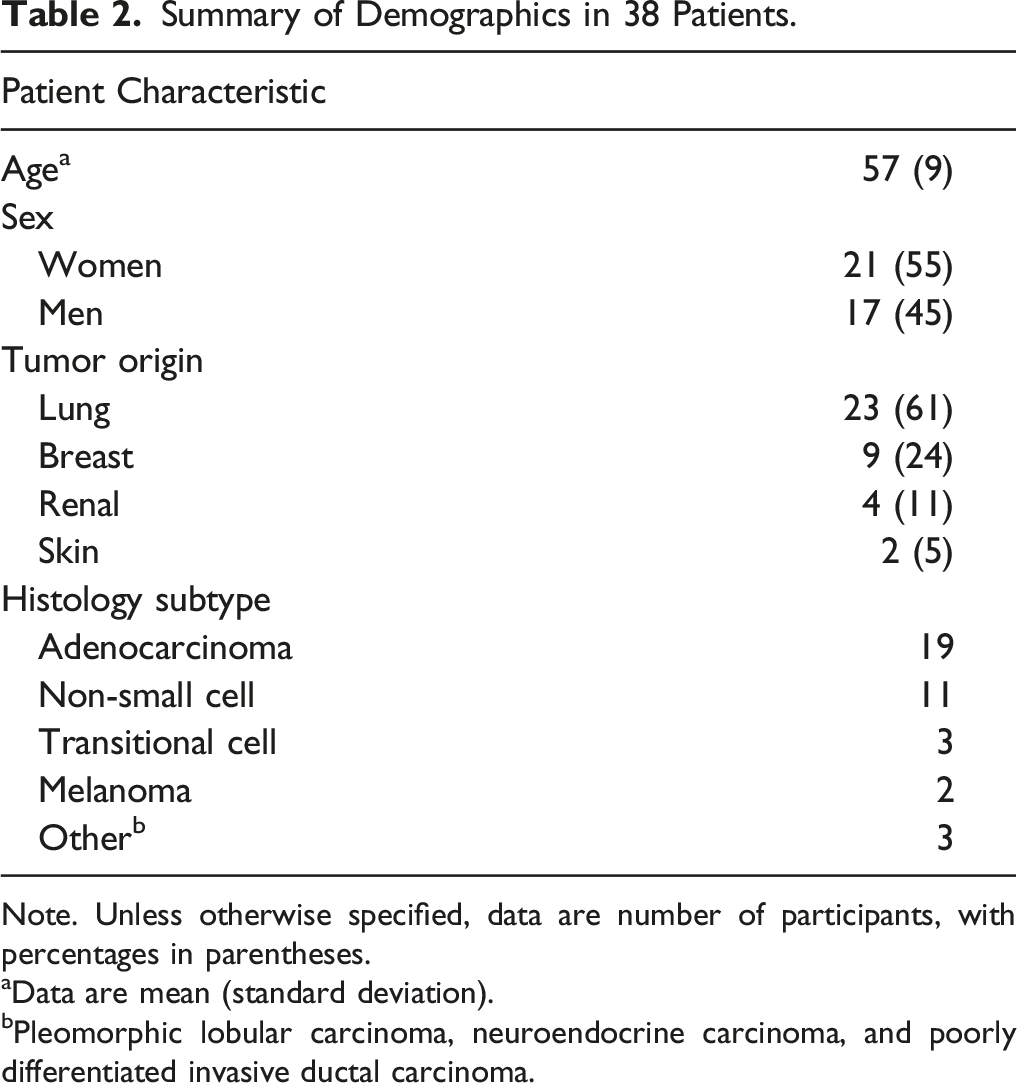
Note. Unless otherwise specified, data are number of participants, with percentages in parentheses.
aData are mean (standard deviation).
bPleomorphic lobular carcinoma, neuroendocrine carcinoma, and poorly differentiated invasive ductal carcinoma.
Summary of Characteristics in 41 Lesions.
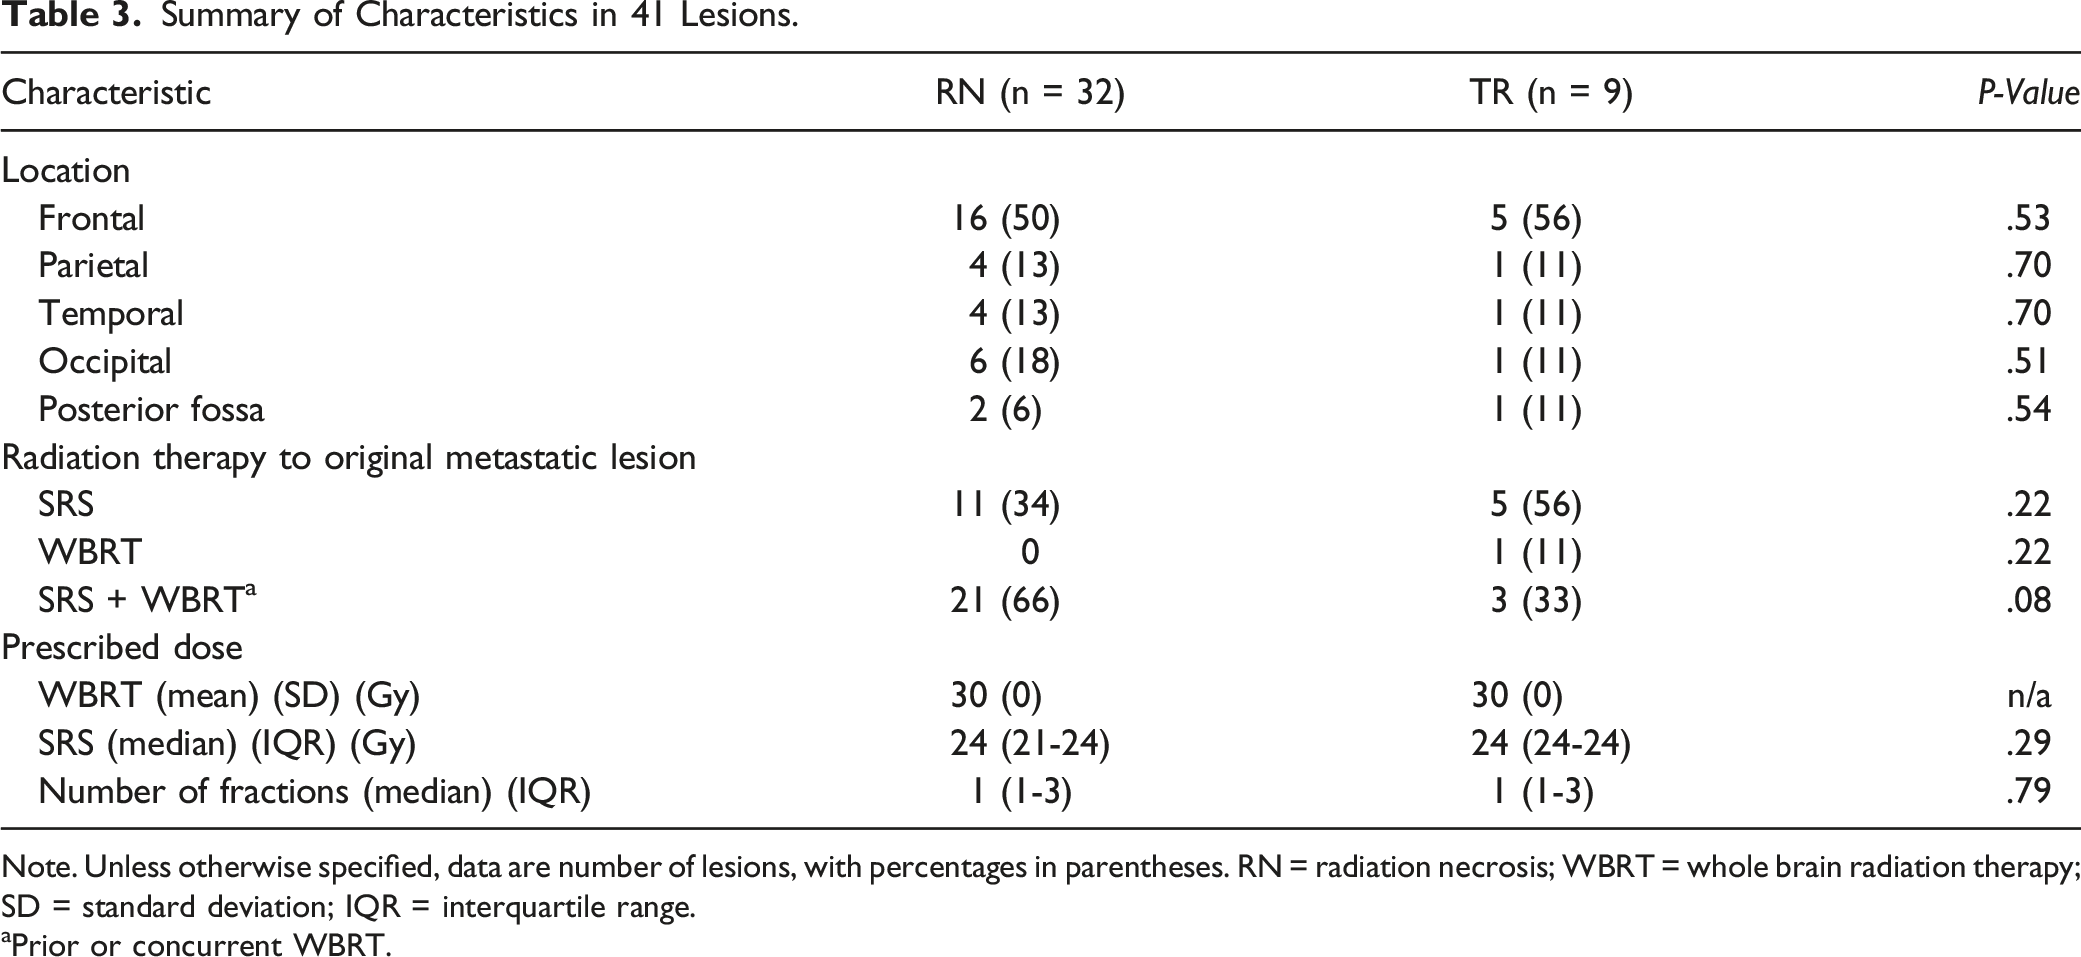
Note. Unless otherwise specified, data are number of lesions, with percentages in parentheses. RN = radiation necrosis; WBRT = whole brain radiation therapy; SD = standard deviation; IQR = interquartile range.
aPrior or concurrent WBRT.
The median time from the end of RT to the presence of a newly necrotic enhancing lesion was 8 months (IQR, 7–14) for the RN group and 12 months (IQR, 8–23) for the TR group (P = .17). Regarding the time from the index MR to surgery, the RN group had a median time of 14 days (IQR, 6–24) and 13 days (IQR, 8–20) for the TR group (P = .93). The 2 lesions (5% [2/41]) classified as RN based on imaging follow-up had a median time from recurrence to lesion shrinkage of 7 months (minimum 5 and maximum 9). One of the lesions remained small and stable in size for more than 1.5 years after RN diagnosis. The other lesion was lost to follow-up beyond RN diagnosis.
Quantitative Assessment
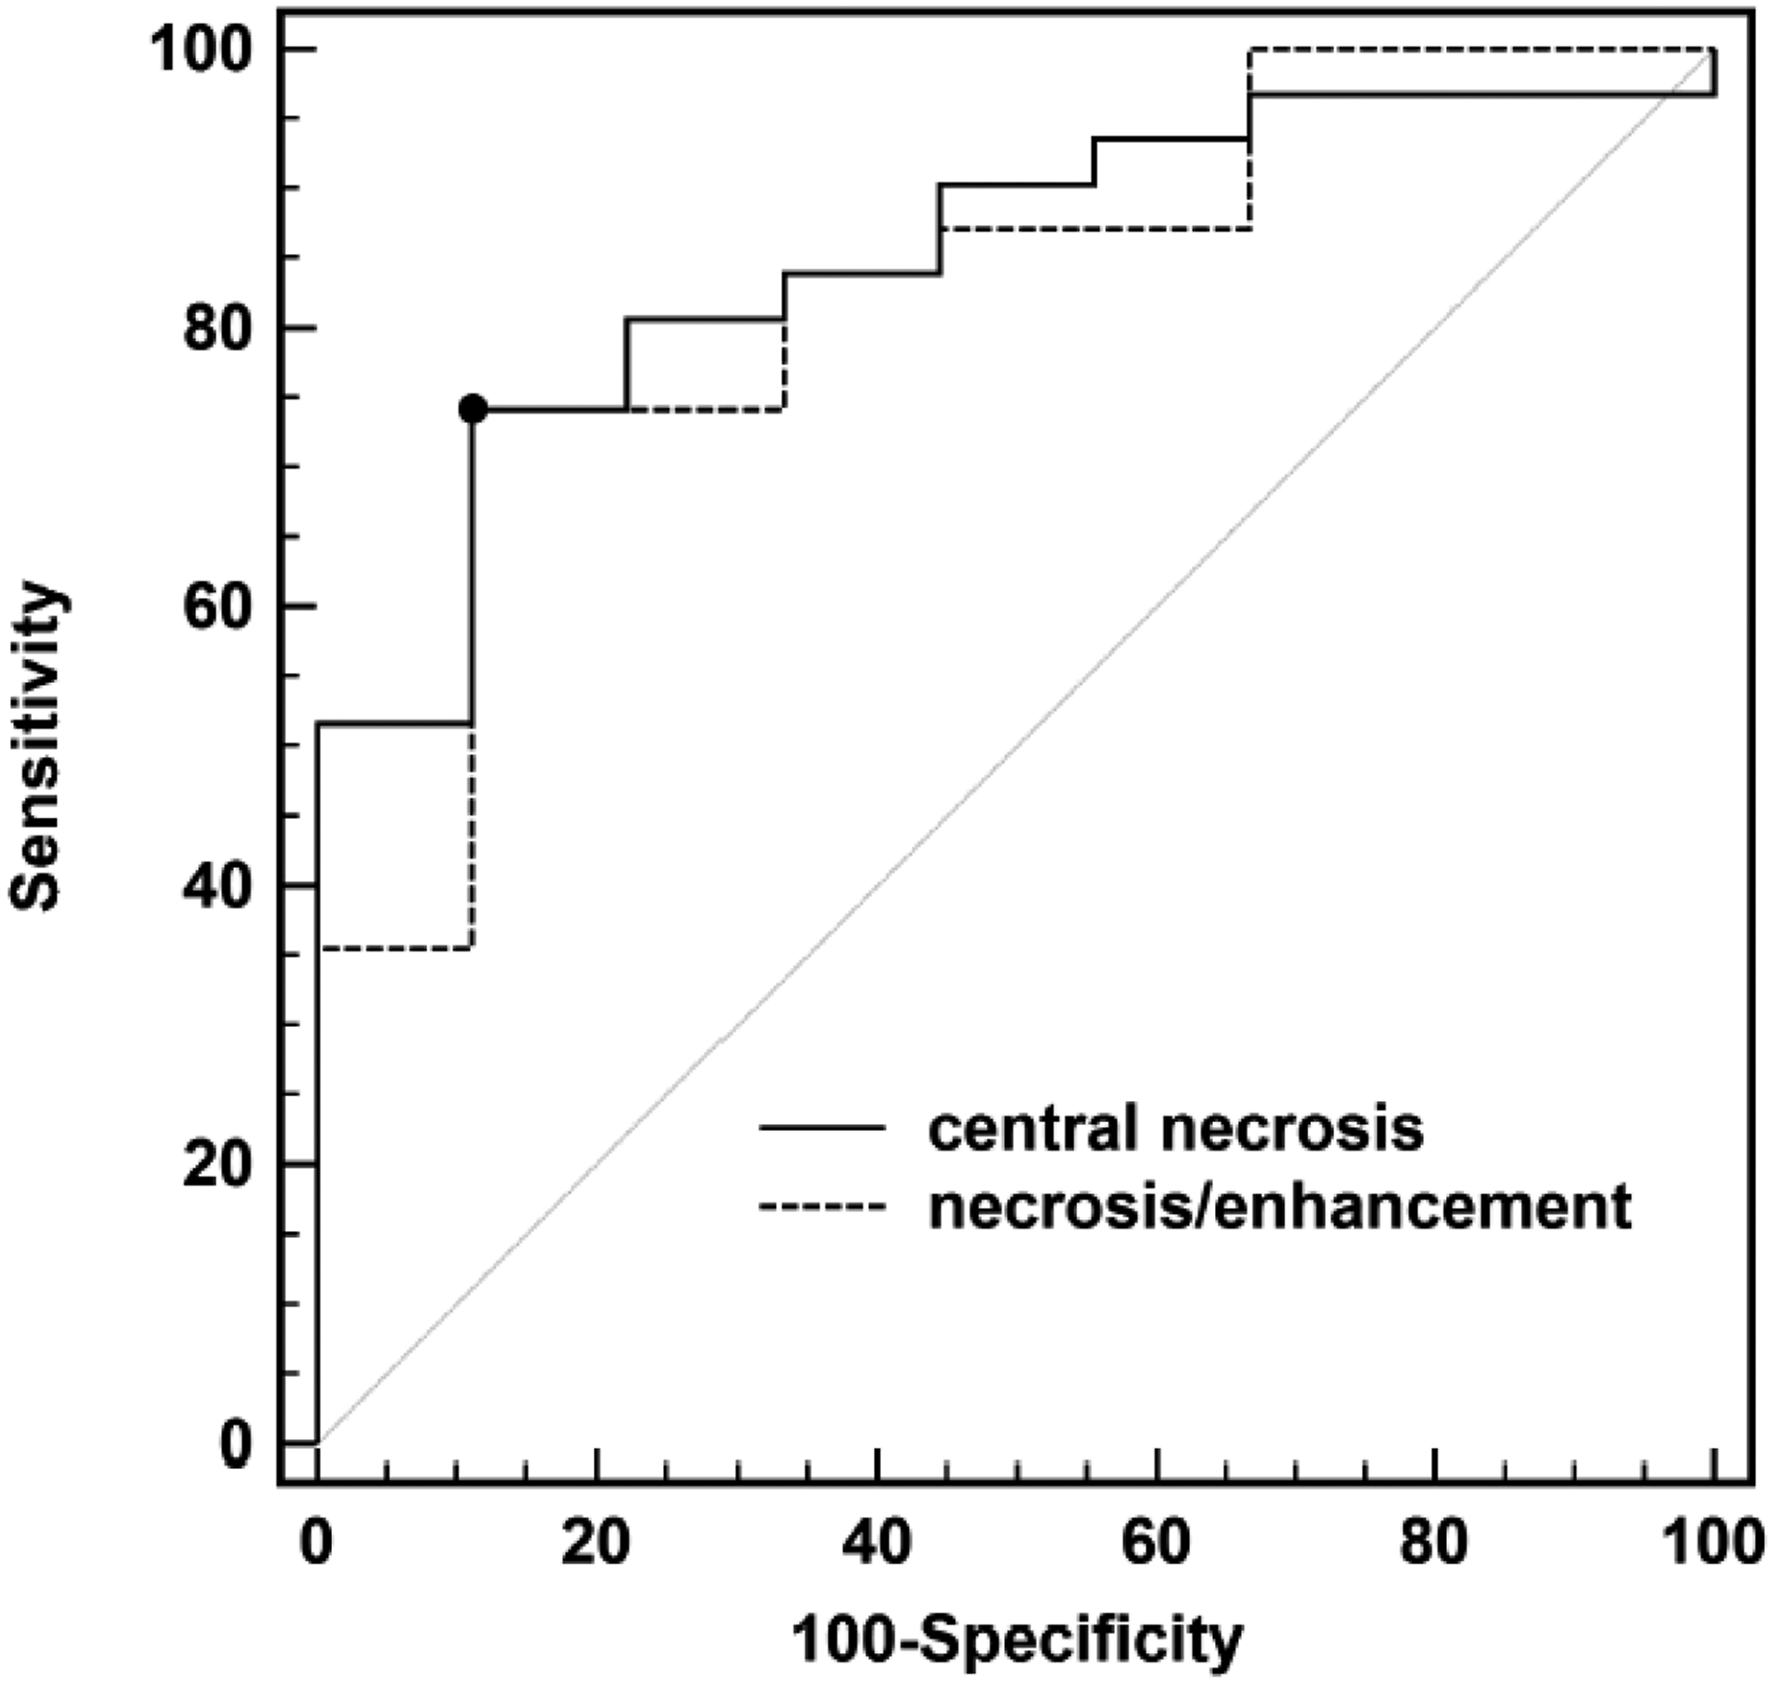
The minimum ADC value and ADC necrosis/enhancement ratio were significantly lower in the RN group compared to the TR group (P = .002, P = .003, respectively) (Figure 3). Although the median ADC necrosis ratio in the RN group was lower than in the TR group (P = .02), this difference did not meet Holm–Bonferroni criteria for significance. There were no significant differences between groups in solid enhancement, enhancement ratio, or contralateral white matter ADC. The optimal threshold (Youden’s criterion) for ADC minimum central necrosis was ≤ 1220 × 10-6 mm2/s and associated with a sensitivity of 74% and a specificity of 89%, with an area under the curve (AUC) for the diagnosis of RN (.85 [95% CI, .70–.94] P < .0001) (Figure 4). With respect to the ADC necrosis/enhancement ratio, a threshold of ≤1.37 provided a sensitivity of 74% and a specificity of 89%, (AUC, .82 [95% CI: .67–.93] P < .0001) for RN diagnosis. Box and whisker plots depicting medians, interquartile ranges, and extrema for each of minimum central necrosis ADC value (A), necrosis ratio (ADC central necrosis/ADC white matter) (B), solid enhancement (C), enhancement ratio (ADC enhancing component/ADC white matter) (D), necrosis/enhancement ratio (ADC central necrosis/ADC enhancing component) (E), and ADC of contralateral white matter (F). The median necrosis (minimum ADC) for the RN group was significantly lower than that of the TR group (881 (635–1289) vs 1901 (1371–2541) 10−6 mm2/s; P = .002). Additionally, the median ADC necrosis/enhancement ratio for the RN group was significantly lower than the TR group (.90 (.64–1.47) vs 1.94 (1.45–2.99); P = .003). The median ADC necrosis ratio was also lower in the RN group, but this difference did not meet Holm–Bonferroni criteria for significance (1.31 (1.02–2.05) vs 2.81 (1.74–3.21); P = .02). There were no significant differences in solid enhancement, enhancement ratio, or contralateral white matter ADC between RN and TR groups. Diagnostic accuracy for differentiation of radiation necrosis from tumor recurrence. Receiver-operator characteristics (ROC) based on ADC central necrosis (area under the curve [AUC], .85 [95% confidence interval {CI}: .70–.94] P < .0001), and ADC necrosis/enhancement ratio (AUC, .82 [95% CI: .67, .93] P < .0001). The black dot indicates the optimal threshold (Youden’s criterion) for ADC minimum central necrosis (≤1220) with a sensitivity of 74% and a specificity of 89%, and for ADC necrosis/enhancement ratio (≤1.37) with a sensitivity of 74% and a specificity of 89%, for the diagnosis of radiation necrosis.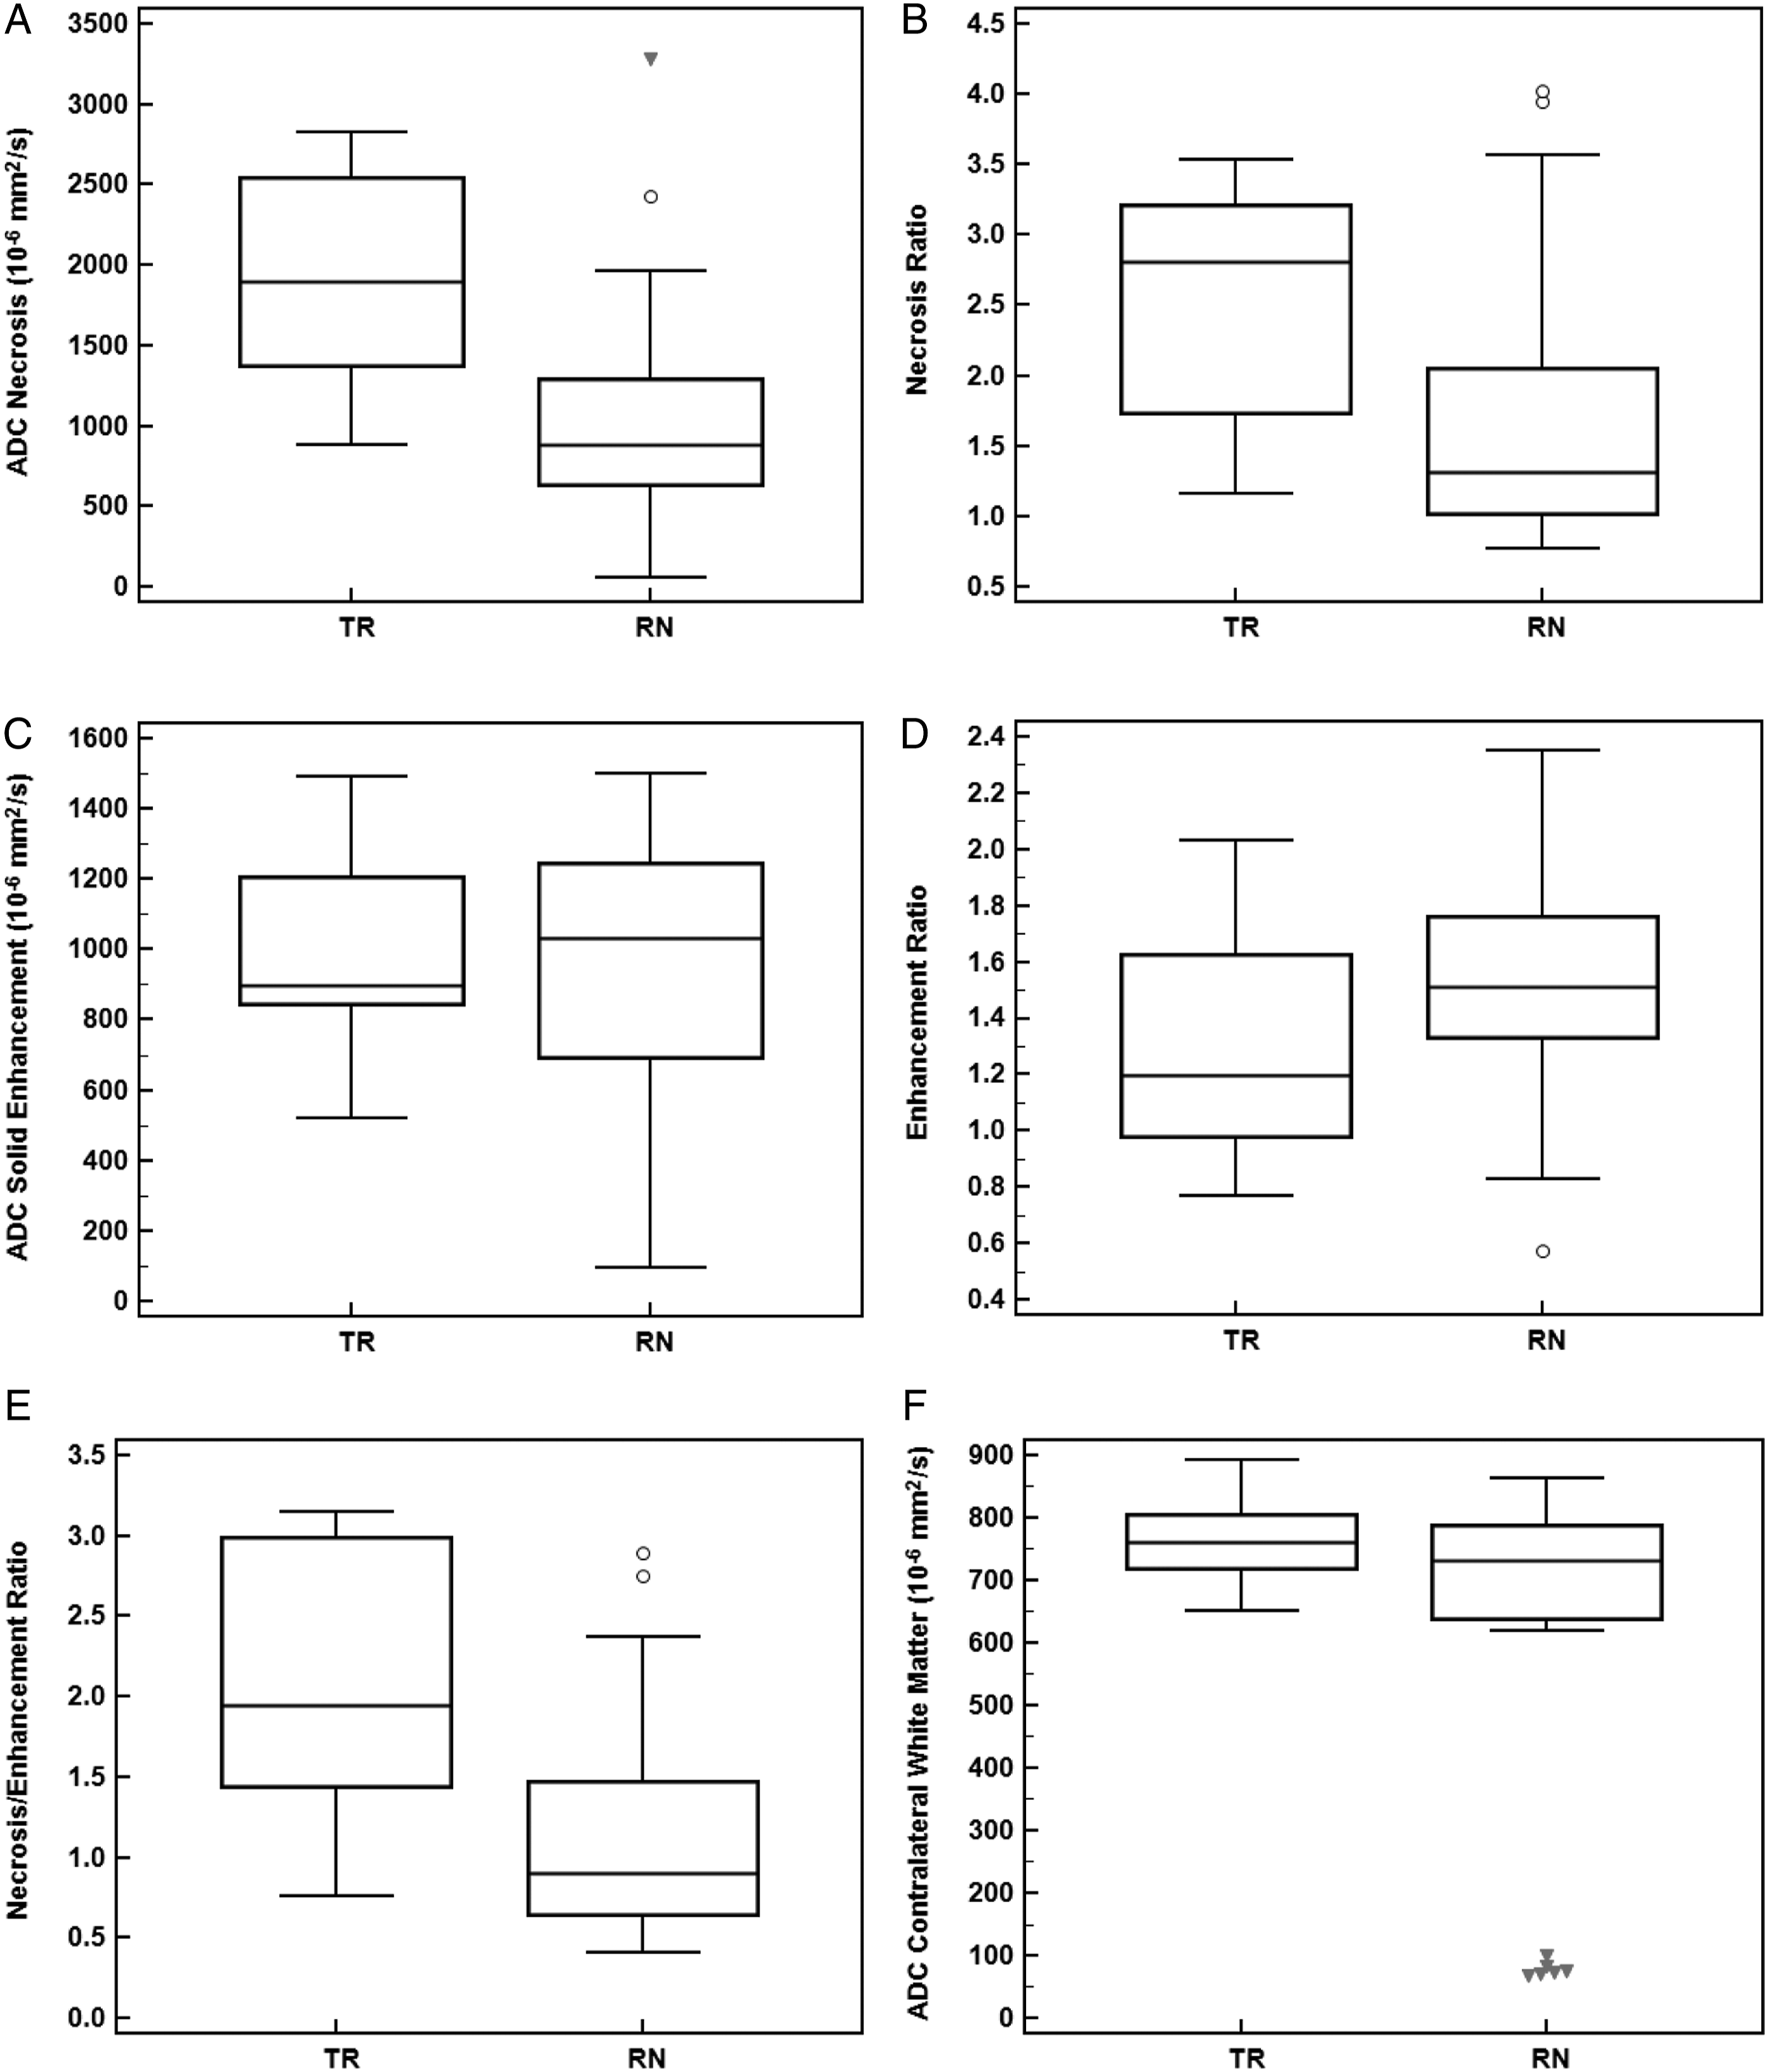
Subgroup Analysis
Magnetic resonance scanner field strength and DWI parameters: There were no significant differences in ADC values from the central necrosis between 1.5 and 3T scanners (P = .35). The ADC solid enhancement and ADC of the contralateral white matter were significantly lower at 1.5 than at 3T (863 [IQR, 132–1153] vs 1113 [IQR, 899–1250] 10−6 mm2/s, P = .03) and (676 [IQR, 83–741] vs 751 [IQR, 679–823] 10−6 mm2/s P = .01), respectively. However, none of the ADC ratios differed significantly between field strengths. Furthermore, there was no significant interaction between field strength and diagnosis (RN vs TR) using a 2-factor analysis of variance.
Diffusion-weighted imaging parameters and tumor origin/histology subtypes: There were no significant differences in ADC values and ADC ratios among metastatic tumor origins and among their corresponding histological subtypes (Table 2).
Qualitative Assessment
The presence of centrally restricted diffusion in the necrotic portion of a lesion was significantly associated with RN on histopathologic analysis (RN 69% [22/32] vs TR 22% [2/9]; P = .02) (Figure 5) (Table 4). The centrally restricted diffusion sign had a sensitivity of 69% (22/32) (95% confidence interval [CI], .50, .83), specificity of 77% (7/9) (95% CI, .40, .96), positive predictive value (PPV) of 92% (22/24) (95% CI, .72, .99), and a negative predictive value (NPV) of 41% (7/17) (95% CI, .19, .66) for the diagnosis of RN. There were no significant differences between groups regarding the extent of restricted diffusion (<50% vs >50%) in the necrotic component on visual assessment (P = .33). Radiation necrosis with positive centrally restricted diffusion sign. There is a centrally necrotic lesion in the left occipital lobe on T1-weighted imaging post-gadolinium (A), showing restricted diffusion in the central non-enhancing component on DWI (B) and ADC map (C, arrow). Qualitative Assessment of Newly Necrotic Enhancing Lesions. Note. Data are number of lesions, with percentages in parentheses. RN = radiation necrosis; TR = tumor recurrence.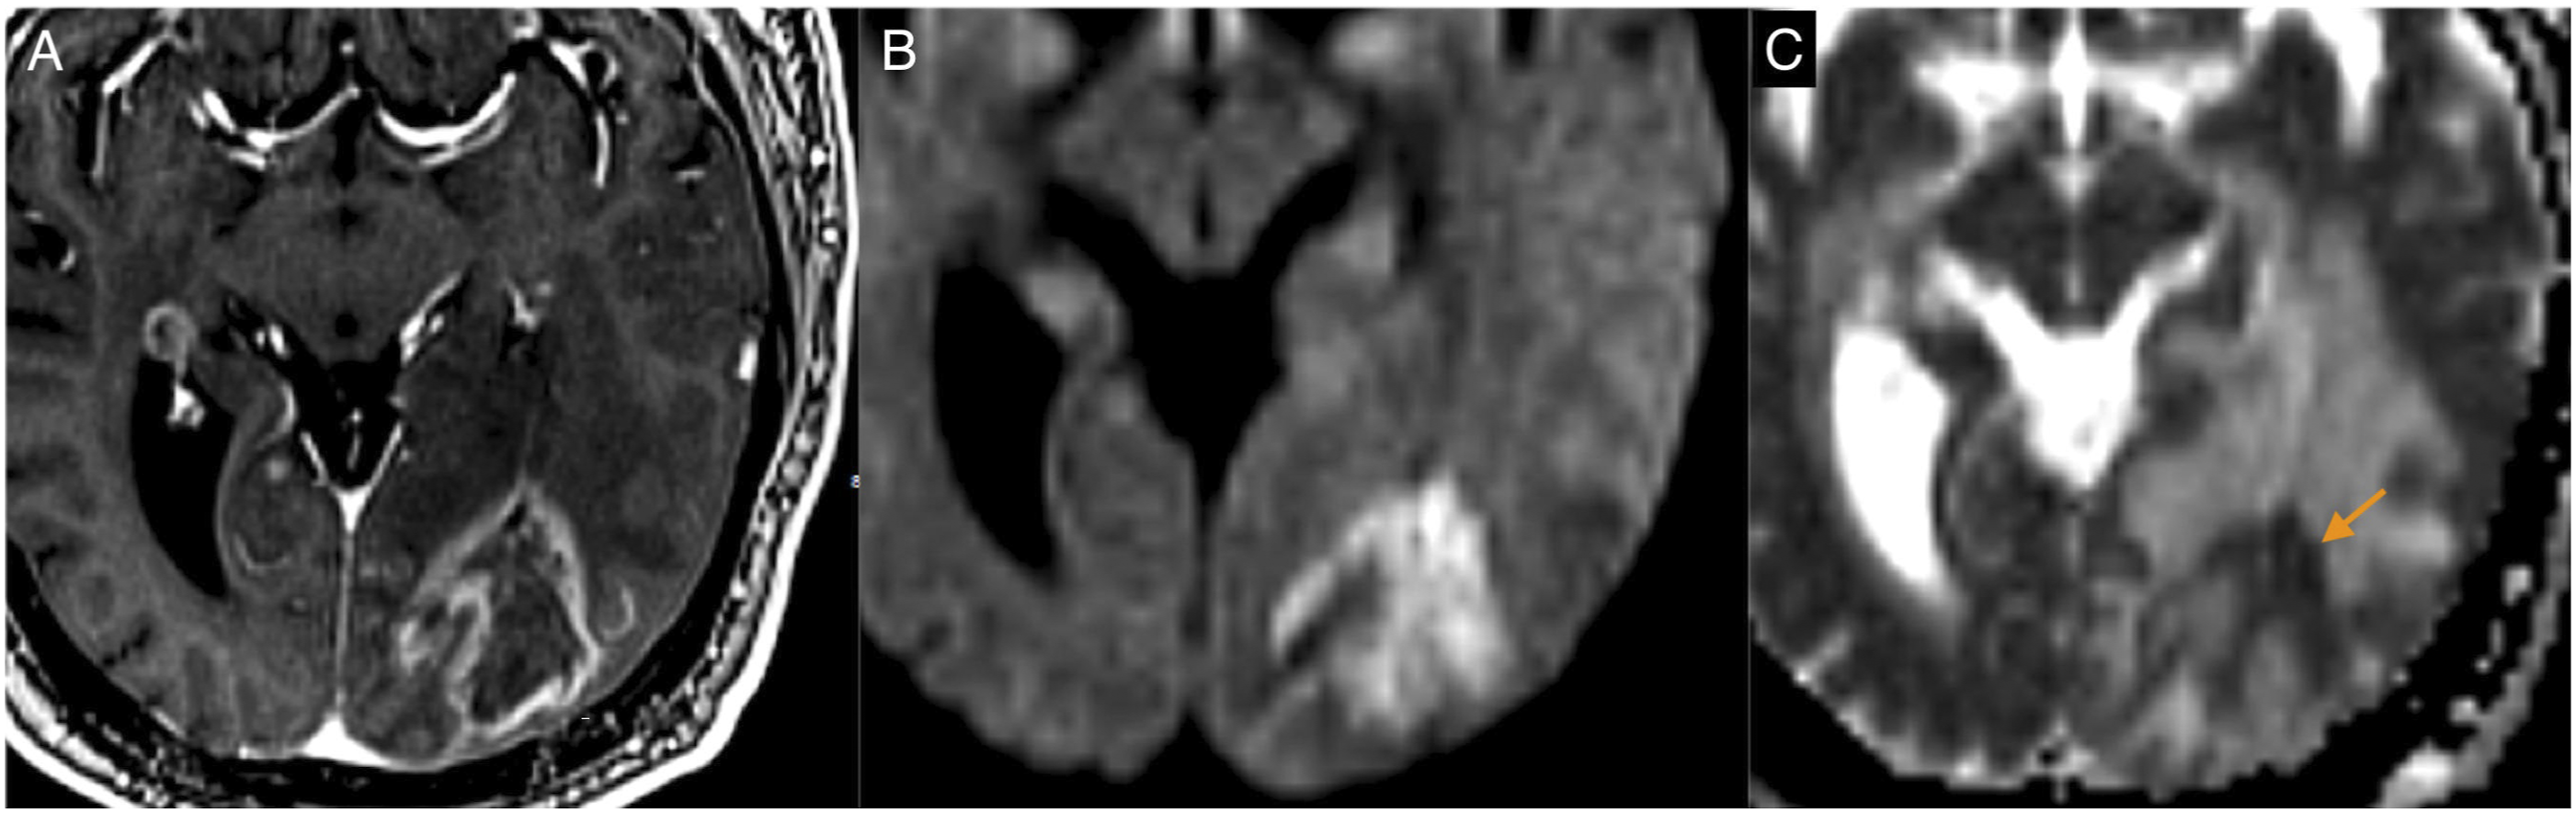
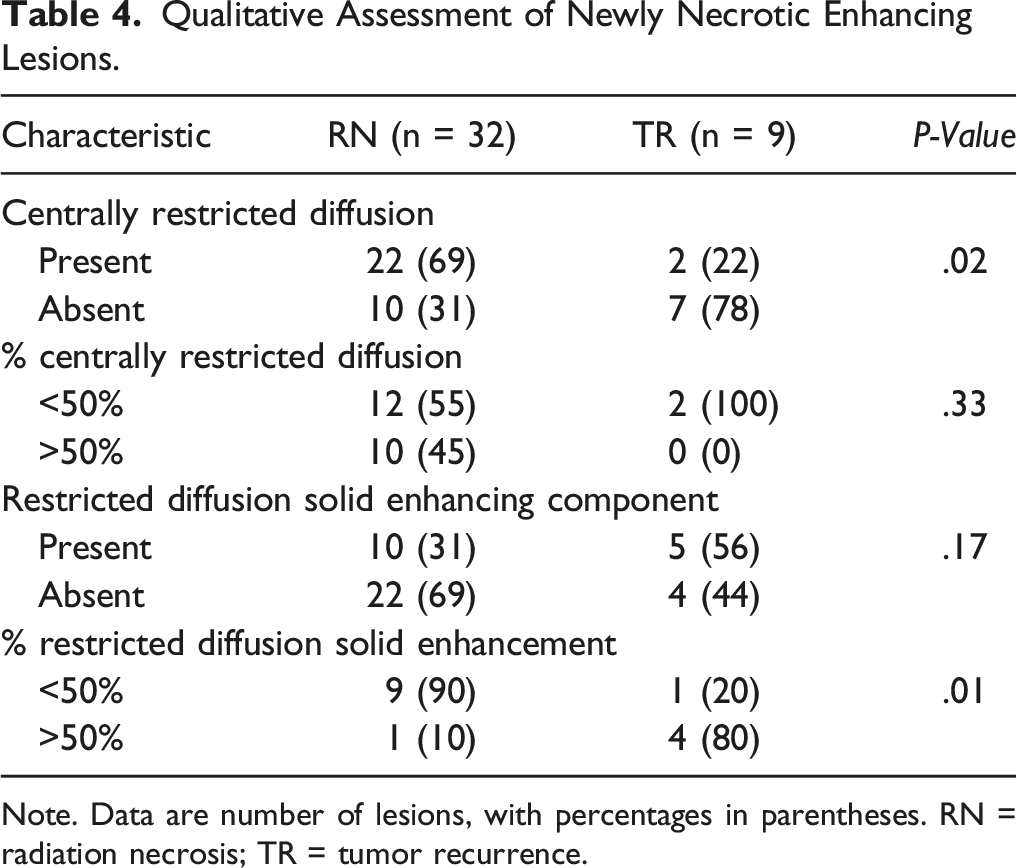
The analysis of restricted diffusion in the solid peripheral enhancing component of the lesions showed no significant differences between RN and TR (P = .17). Nevertheless, when restricted diffusion was present in this component, a significant difference was observed between groups regarding its extent: the majority (80% [4/5]) of TR lesions showed diffusion restriction in >50% of the solid enhancing component, whereas the majority (90% [9/10]) of RN lesions had it in <50% (P = .01) (Figure 6). The sensitivity, specificity, PPV, and NPV of the extent of restricted diffusion in the solid enhancing component for the diagnosis of TR were 80% (4/5) (95% CI, .30, .98), 90% (9/10) (95% CI, .54, .99), 80% (4/5) (95% CI, .30, .98), and 90% (9/10) (95% CI, .54, .99), respectively. Tumor recurrence with negative centrally restricted diffusion sign. T1-weighted imaging post-gadolinium (A), DWI (B), and ADC map (C). There is a centrally necrotic lesion in the right temporal lobe with restricted diffusion in the solid enhancing component. The central non-enhancing portion of the lesion shows facilitated diffusion (arrow).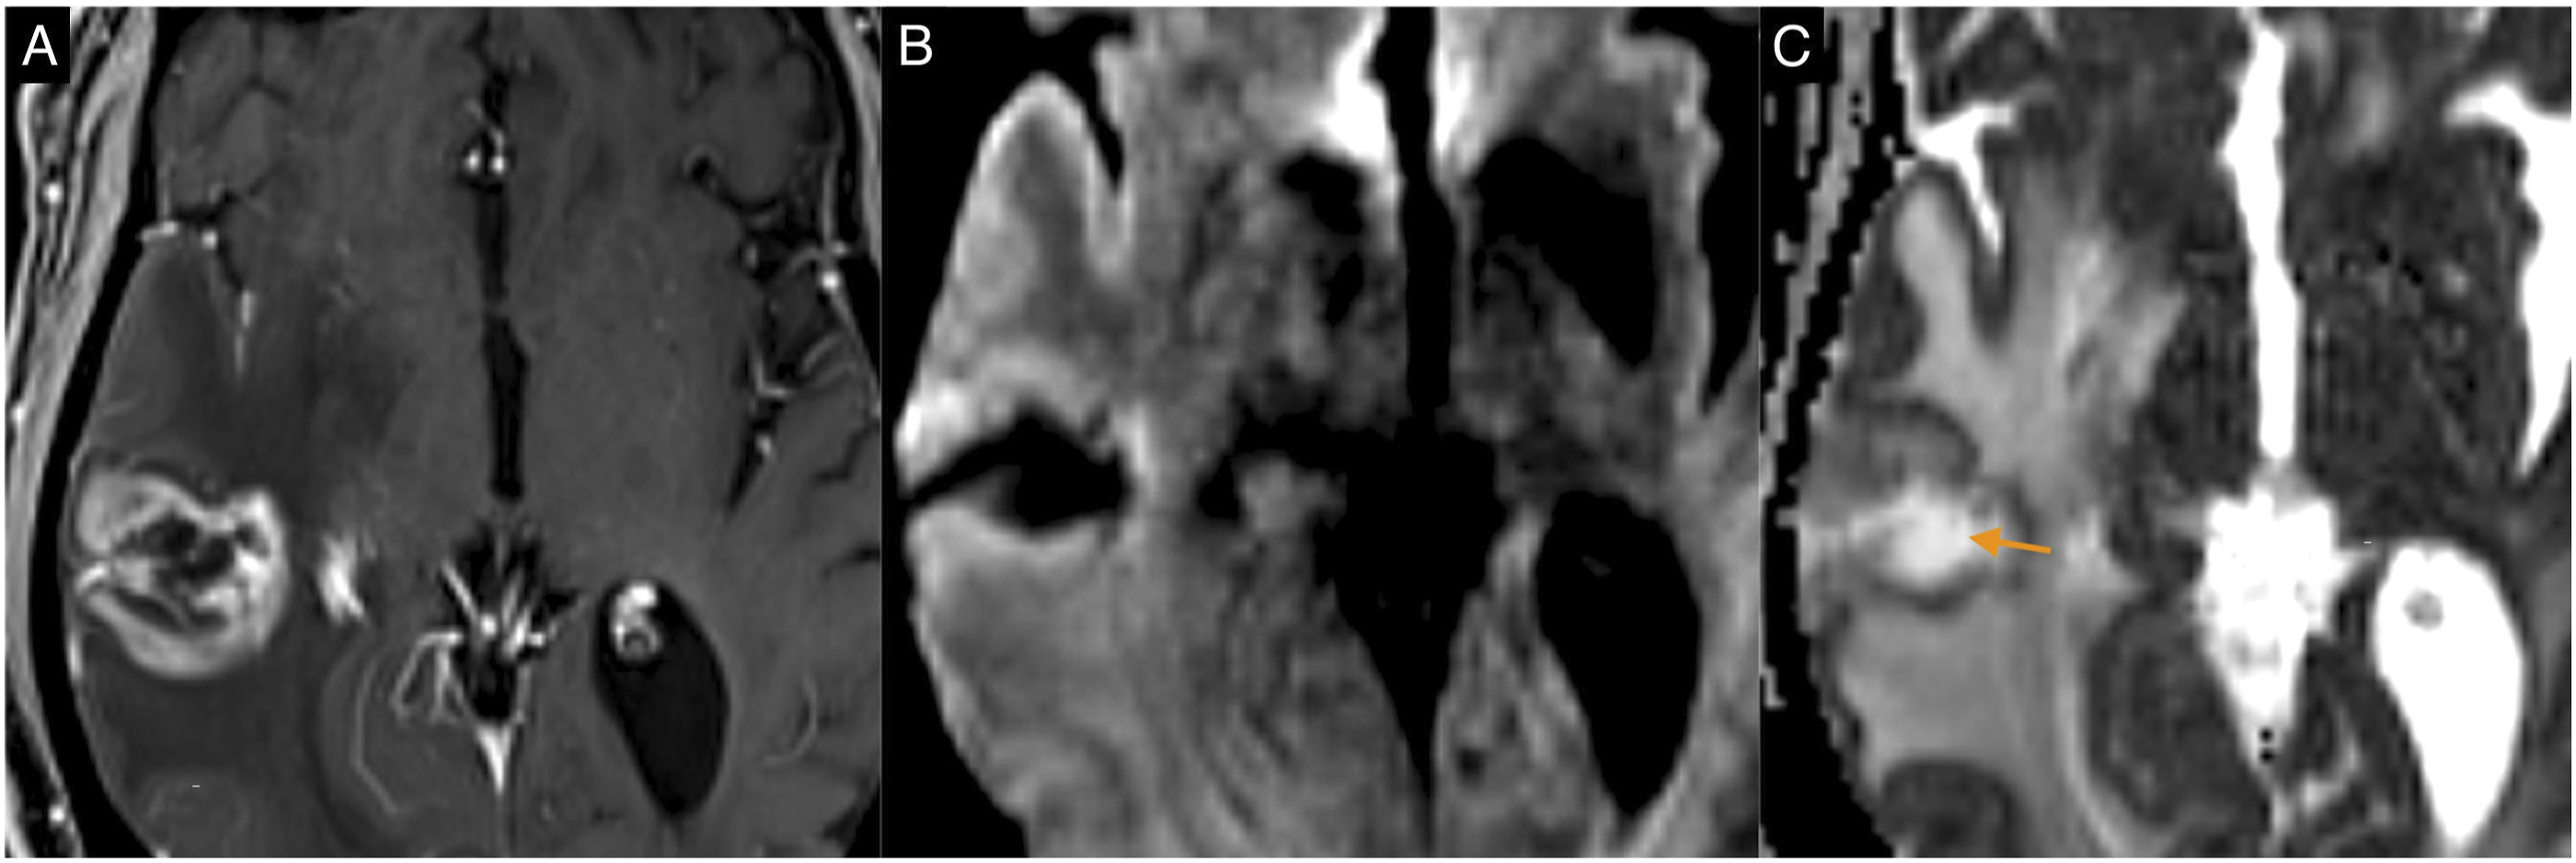
The combination of the 2 qualitative lesions’ characteristics (e.g., presence of centrally restricted diffusion and absence of restricted diffusion in the solid enhancing component or vice versa) did not improve the accuracy of RN or TR diagnosis.
Interobserver Agreement
The k value was .49 (95% CI, .21, .76) for the evaluation of centrally restricted diffusion (19/41 cases resolved by consensus), .51 (95% CI, .19, .83) for the extent of centrally restricted diffusion (14/24 cases resolved by agreement), .62 (95% CI, .36, .87) for the presence (7/41 cases resolved by consensus), and .4 (95% CI, 0, .90) for the extent of restricted diffusion (4/15 cases resolved by agreement) in the solid enhancing component.
Discussion
A necrotic enhancing lesion following RT for CNS metastases may be due to RN or TR,2-5 a distinction that is difficult on conventional MR imaging. 22 The purpose of this study was to evaluate the diagnostic accuracy of DWI for the differentiation of RN and TR in treated brain metastases. This retrospective study showed that quantitative ADC analysis could differentiate both entities based on minimum ADC values from the non-enhancing necrotic component and the ADC necrosis/enhancement ratio. Notably, there was a moderate interobserver agreement for the qualitative assessment of the centrally restricted diffusion sign, suggesting that subjective visual assessment may be of limited value.
Diffusion-weighted imaging in assessing post-treatment MR scans has shown promise in neuro-oncology as it enables accurate distinction of RN from TR.9,10,16,23,24 According to previous reports, RN is characterized by markedly restricted diffusion in the necrotic non-enhancing component of a lesion.9,10,24 This finding has been predominantly reported in treated gliomas,9,10,16,24,25-29 with only one study 11 confirming its presence in treated brain metastases.
This type of markedly restricted diffusion has been referred to as “extremely diffusion restriction” due to the low ADC values that are even lower than that of hypercellularity seen in neoplasms.24,25 Extremely diffusion restriction shows ADC values of ∼600 × 10−6 mm2/s and can be seen in limited scenarios, such as hyperacute to acute cerebral infarction30,31 or abscess.28,32,33 This markedly diffusion restriction in RN has been hypothesized to be secondary to a combination of hemosiderin-laden macrophages, infarction of remaining tumor tissue, leukocytes in late-stage necrosis, and coagulation necrosis.3,11,16,28
Our results are consistent with the findings reported in RN. In our sample, the ADC measurements obtained from the necrotic component of RN lesions showed lower ADC values than those measured from TR lesions’ necrotic and enhancing parts. However, the median ADC value in RN reported in the current study was higher than the ADC values reported in extremely diffusion restriction. 24 This could be due to volume average within the ROI in the central necrosis in our sample, which was usually heterogeneous with mixed areas of high and low signal on DWI. In fact, the minimum ADC value from the necrosis in our study falls in the range reported by others (655.7–992.15x10⁻⁶ mm2/s),9,11,16 where heterogeneity was usually present on DWI. 16 The areas of high ADC values usually present in the necrotic component might be related to increased water in the interstitial space following cell necrosis. 16
In 2013, Cha et al. 11 evaluated the accuracy of DWI in sixteen brain metastases that increased in size following SRS. Nine cases were pathologically confirmed RN, all of which showed what they classified as a three-layer pattern of ADC, which had a sensitivity of 100% (9/9) and specificity of 86% (6/7) for RN diagnosis. This “three-layer pattern” of ADC was defined as a lesion with a central non-enhancing component showing areas of high and low ADC values surrounded by an enhancing portion, which was similar to what we found in most of our RN cases. The sensitivity and specificity in our study for the centrally restricted diffusion sign were lower than Cha et al. This could be due to the difference in study populations where we analyzed a more significant number of RN (32 vs 9) and TR (9 vs 7) lesions. Also, we only used DWI for lesion classification compared to Cha et al. that used both MR perfusion and DWI, which might have increased their accuracy.
Studies have analyzed the diagnostic accuracy of the centrally restricted diffusion sing in treated gliomas, reporting a sensitivity of 64–75%, specificity of 84–89%, and PPV of 52–80% for the diagnosis of RN.9,10 This is comparable to our results, where we found a reasonable specificity (77%) and high PPV (92%). However, the reliability of this sign was limited by a moderate inter-rater agreement in our sample. Alcaide-Leon et al. 10 found a more robust interobserver agreement (k .7) than the current study for the centrally restricted diffusion sign, likely because they used an ordinal five-point scale for lesion classification vs our binary classification. We believe that additional evaluation of their classification system should improve the inter-rater agreement as this was performed in a large study population compared to ours.
Last, MR perfusion has shown promise in distinguishing TR and RN. A recent meta-analysis showed that the solid enhancing component’s relative cerebral blood volume (rCBV) was significantly higher in TR compared with RN. 34 However, many institutions do not process quantitative perfusion maps because of the lack of available software tools and the time-consuming and complex nature of post-processing. 35 Moreover, MR perfusion has a low reproducibility given that there are no universal parameter values to define TR. As a result, we believe the simplicity of our technique is a strength given the rapid acquisition and widespread use of DWI in post-treatment scans.
Study Limitations
Our study is based on a relatively small sample size. Most of our patients underwent surgery, which could have introduced a selection bias since they may represent a subgroup of patients likely influenced by other patient variables and tumor histology. 36 Moreover, spatial correlation between pathological analysis and presurgical diffusion-weighted images was unavailable. This could potentially have misclassified areas of restricted diffusion as RN instead of TR and vice versa. However, our study showed ADC values similar to those found in other studies in RN, which are lower than that of hypercellularity.9,11,16,26 Also, the primary metastatic histology and the primary tumor site were heterogeneous; thus, the nature of the metastatic tumor may act as a bias. However, our study found no significant differences in ADC values and ADC ratios among tumor origins and histological subtypes. Last, hemorrhage was common in our sample, leading to the exclusion of many cases due to susceptibility artifacts that precluded the use of DWI.
Conclusions
Radiation necrosis can be differentiated from TR, giving significantly different ADC values from the central non-enhancing component between entities. A moderate interobserver agreement hampered the performance of the qualitative centrally restricted diffusion sign for RN diagnosis.
Footnotes
Acknowledgments
We want to thank Dr John Woulfe for his assistance in database searching for eligible patients for the study.
Declaration of Conflicting Interests
The author(s) declared no potential conflicts of interest with respect to the research, authorship, and/or publication of this article.
Funding
The author(s) received no financial support for the research, authorship, and/or publication of this article.