
Abstract
Course grades, as an indicator of academic performance, are a primary academic concern at the secondary school level and have been associated with various aspects of mental health status. The purpose of this study is to simultaneously assess whether symptoms of mental illness (depression and anxiety) and mental well-being (psychosocial well-being) are associated with self-reported grades (in their primary language [English or French] and math courses) and education behaviors (school days missed due to health, truancy, and frequency of incomplete homework) in a sample of secondary school students across Canada (n = 57,394). Multivariate imputation by chained equations and multilevel proportional odds logistic regressions were used to assess associations between mental health scores, academic performance and education behaviors. Lower depression and higher psychosocial well-being scores were associated with better grade levels in both math and language courses, as well as better education behaviors. In turn, better education behaviors were associated with higher course grades. Depression scores and psychosocial well-being scores remained associated with higher grades after controlling for education behaviors, however the magnitude of association was diminished. Results indicate that the effects of mental health factors were partially attenuated by education behaviors, suggesting while reduced class attendance and poor homework adherence were associated with both academic outcomes and mental health, they do not account entirely for the association between lower grades and worse mental health.
Introduction
Course grades, as an indicator of academic performance, are a primary academic concern at the secondary school level for many students, educators, and parents not only as an indicator of success in a subject area, but also as a determinant for access to post-secondary education. Later in life, higher education attainment has been shown to be predictive of higher income, and better mental and physical health (Kantomaa et al., 2010). As such, much effort has been made to identify factors that affect academic performance in adolescents.
Depression and anxiety are among the most prevalent mental health concerns among youth (Institute for Health Metrics and Evaluation [IHME], 2018) and have been frequently linked to academic performance in adolescents. Among 98 secondary students age 12 to 16 in Spain, cross-sectional depression scores were inversely correlated with lower grades in nearly every subject area assessed, as well as grade average, but anxiety scores were not. When both anxiety and depression were included in a regression analysis for grade average, higher depression scores remained associated with lower grades, but higher anxiety scores were significantly associated with higher grades (Fernández-Castillo & Rojas, 2009). In US-American adolescents aged 12 to 18 years presenting to community health clinics, presence of mental health problems (anxiety and depression scores 2SD above the sample mean or endorsing suicidal/self-harm ideation or attempts) was predicted by lower grades after controlling for gender, age, ethnicity, and drug and alcohol use (Burnett-Zeigler et al., 2012).
The association between mental health and academic performance may be partially attenuated by including educational disengagement and delinquent behaviors. Based on data from the National Longitudinal Study of Adolescent Health (n = 6,315; after controlling for year of study, gender, ethnicity, family receipt of public assistance, highest level of parental education, family income, family structure, and academic aptitude), high school grade point averages extracted from transcripts were inversely associated with self-reported depression scores, attention-deficit/hyperactivity disorder symptoms, number of delinquent behaviors engaged in, and substance use (McLeod et al., 2012); however, when all predictors were included, the effect of depression scores decreased and fell just outside of statistical significance. Similarly, among Finnish adolescents age 15 to 16, a behavioral problems composite score including rule breaking and aggressive behaviors were associated with lower grades after controlling for emotional problems (a composite of depression and anxiety scores), family structure, highest level of maternal education, and physical activity status (Kantomaa et al., 2010). The association between depressive symptoms or the presence of a likely clinical depressive disorder and academic performance appears to be highly reproducible. However, the association with anxiety appears to be less clear.
Studies have also found associations between academic performance and adolescent psychosocial well-being (Archer & Garcia, 2014; Gilman & Huebner, 2006) (consisting of life satisfaction, experiencing happiness, achieving self-determination, and the presence of positive social and societal relations) as an aspect of mental health. However, psychosocial well-being and specific symptoms of dysfunction such as depression and anxiety have typically not been examined simultaneously, despite the dual-continua model that posits mental illness/dysfunction and mental well-being are separate but related aspects of overall mental health (Westerhof & Keyes, 2010; World Health Organization [WHO], 2004). In line with this dual-continua model, measures of psychosocial well-being have been associated with several functional outcomes such as impairment of daily activities and missed work days in both individuals with and without mental disorders (Keyes, 2002); it is reasonable to consider that psychosocial well-being may play a role in adolescent academic performance and educational behavior adherence such as missing class and completing homework, in addition to specific symptoms of mental illness.
The purpose of this study is to assess whether mental health factors in a sample of secondary school students across Canada are associated with course grades and education behaviors: truancy, days missed due to health issues, and incomplete homework frequency, and secondly, whether the associations between mental health outcomes and course grades are affected by the inclusion of education behaviors in the model. It was hypothesized that lower depression and anxiety scores and higher psychosocial well-being scores would be associated with better academic performance in math and language-courses, lower levels of truancy, days missed due to health, and incomplete homework frequency. After controlling for education behaviors, the association between mental health scores and academic performance were expected to be attenuated, suggesting the association between mental health factors and academic outcomes may be partially attributable to education behaviors related to both mental health and academic behaviors.
Methods
Design and Data Collection
Student-level data from Year 6 of the Cannabis use, Obesity, Mental health, Physical activity, Alcohol use, Smoking, and Sedentary behavior (COMPASS) study (collected during the 2017/2018 school year) were used for these analyses. COMPASS (2012–2021) collects hierarchical longitudinal health data annually from a rolling cohort of students in grades 9 to 12 attending a convenience sample of secondary schools across Canada (Leatherdale et al., 2014). In Year 6 of the study a mental health module was adopted across all 124 schools after a previous pilot evaluation (Patte et al., 2017) in a subset of schools the previous year; Year 6 represents the first full year of mental health data collection. The COMPASS study has received ethics approval from the University of Waterloo Human Research Ethics Committee, Brock University Research Ethics Committee, and participating school boards. Additional details regarding study methods can be found online (www.compass.uwaterloo.ca) or in print (Leatherdale et al., 2014). All students attending participating schools were invited to participate using active-information passive-consent parental permission protocols, which are critical for collecting robust data among youth (Chartier et al., 2008; Thompson-Haile et al., 2013; White et al., 2004). See Reel et al. (2018) for further information on recruitment methods.
Student-level data were collected using the COMPASS student questionnaire, a paper-based survey designed to collect student-reported data from full school samples during one classroom period. Only students who would fall into the typical North American “high school” grades of 9 to 12 (International Standard Classification of Education level 3) were included in analyses. Thus, students in the province of Quebec’s in secondaire 1re and 2e (equivalent to grades 7 and 8) and students in a class with no official grade equivalent (such as “new immigrant” classes offered in Quebec) were excluded prior to multiple imputation. Students in Quebec’s secondaire 3e through 5e were classified as grade 9 through 11 respectively, where secondary education ends.
Mental Health Measures
Depressive symptoms were measured using the 10-item Center for Epidemiologic Studies Depression scale Revised (CESD) (Andresen et al., 1994). Students were asked how often they experienced each symptom within the last 7 days, with the response options: “None or less than 1 day,” “1 to 2 days,” “3 to 4 days,” or “5 to 7 days.” Items were scored from 0 to 3; higher total scores indicate greater depressive symptoms. Psychometric properties of the CESD suggests scores represent depression severity through evidence of correlation with external variables in both clinical and non-clinical populations and has an internal structure relevant to the construct (Andresen et al., 1994; Bradley et al., 2010; Haroz et al., 2014; Van Dam & Earleywine, 2011). Coefficients of internal consistency for complete cases were Cronbach’s α = .82 (95% CI: 0.82–0.82), ordinal ω = .88 (95% CI: 0.88–0.88).
Anxiety symptoms were measured using the 7-item Generalized Anxiety Disorder scale (GAD7) (Spitzer et al., 2006). The seven items consist of symptoms of anxiety such as “feeling nervous” or “difficulty relaxing.” Students responded based on how often each symptom was experienced in the last 2 weeks: “Not at all,” “several days,” “over half the days,” or “nearly every day” scored 0 to 3 respectively. Higher total scores indicate greater anxiety impairment and scores correlate strongly with other measures of anxiety and poor psychosocial well-being in clinical and non-clinical populations of adults and adolescents (Löwe et al., 2008; Mossman et al., 2017; Spitzer et al., 2006; Tiirikainen et al., 2019). Coefficients of internal consistency for complete cases were Cronbach’s α = .91 (95% CI: 0.91–0.92), ordinal ω = .94 (95% CI: 0.94–0.94).
Psychosocial well-being was assessed using the 8-item Flourishing Scale (FS) (Diener et al., 2009, 2010). Items reflect feelings of competence, optimism, purpose, and success in personal relationships. Compared to the original 7-point scale, the original “slightly agree” and “slightly disagree” response options were removed, resulting in a 5-point Likert-like scale ranging from “strongly disagree” to “strongly agree” scored 1-5. Higher total scores represent greater positive well-being. FS scores correlate strongly with other measures of psychological and social well-being (Edmunds et al., 2010) and the scale has shown measurement invariance in this sample (Romano et al., 2020). Coefficients of internal consistency for complete cases were Cronbach’s α = .90 (95% CI: 0.90–0.91), ordinal ω = .93 (95% CI: 0.93–0.93).
Academic Performance
Students self-reported academic performance for their most recent Language (English or French based on survey language) and Math courses by responding to the question for each subject: “In your current or most recent [subject] course, what is your approximate overall mark? (Think about last year if you have not taken [subject] this year).” Responses options were: 90% to 100%, 80% to 89%, 70% to 79%, 60% to 69%, 55% to 59%, 50% to 54%, and Less than 50%; the 50% to 54% and 55% to 59% response options were collapsed into a single 50% to 59% category for analyses to maintain an approximately 10-point bin for most categories.
Education Behaviors
Available self-reported education behaviors included school days absent due to health reasons in the last 4 weeks (0, 1 or 2, 3 to 5, 6 to 10, 11 or more days), truancy in the last 4 weeks (0, 1 or 2, 3 to 5, 6 to 10, 11 to 20, More than 20 classes skipped), and frequency of incomplete homework (Never, Seldom, Often, Usually).
Statistical Control Covariates
Sample characteristics to be statistically controlled for included sex (female, male), academic year (grade 9–12), ethnicity (White, Black, Asian, Latin American/Hispanic, Other (includes Other, Multiple ethnicities selected, none indicated), and as proxy for socio-economic status: available weekly spending money (None, $1–20, $21–100, >$100, Don’t Know). Schools were included as a random intercept cluster factor for all models.
Statistical Analyses
Missing data for all variables used for the analyses were multiply imputed in R v3.6.1 (R Core Team, 2020) using the mice (multivariate imputation by chained equation) package (Buuren & Groothuis-Oudshoorn, 2011). To preserve the hierarchical structure of the data, the “lm.lmer” method from the miceadds package (Robitzsch et al., 2019) was used to impute values measured at the individual level using predictive means matching, with schools set as a random intercept higher order clustering factor. Multiple imputation in longitudinal data has been demonstrated to provide results similar to full-information maximum likelihood estimates (Ferro, 2014). All derived variables, such as mental health scores and recategorized responses, were calculated after imputation (“impute then transform”) to reduce bias (Van Buuren, 2018). Incomplete mental health scales ranged from 5.5% (FS) to 14.8% (CESD) and 4.6% for both Math and Language grades; based on missing data rates, guidelines (Graham et al., 2007) suggest 10 imputations were likely sufficient. Convergence was inspected visually via trace plots and deemed acceptable after 30 iterations.
Multilevel proportional odds logistic regressions with Laplace approximation were computed for academic performance and education behavior as dependant variables using the ordinal package for R (Christensen, 2019). Models based on multiply imputed data sets were pooled by applying Rubin’s rules (Campion & Rubin, 1989) as implemented by the ordinalimputation package (Nieboer, 2019). An iterative modeling process was used to regress academic performance outcomes and education behaviors, with models compared using Akaike Information Criterion (AIC) values. After an initial model controlling for covariates, adding depression, anxiety, or psychosocial well-being scores were tested in separate models, followed by a model including all three mental health scores. Academic performance outcomes received two additional iterations, where education behaviors were added as predictors after accounting for covariates and added to the best model including a measure of mental health.
As statistical tests tend to reject the proportional odds assumption of ordinal regression with large samples or if the model contains continuous or a large number of explanatory variables (O’Connell, 2011) adherence to the assumption was assessed visually based on a method suggested by Harrell (2001): several logistic regressions with a single predictor were repeated for each possible contrast dichotomy of the ordinal outcome (i.e., ≥50% vs. <49% through to ≥90% vs. <89%), the resultant logits are then plotted. The assumption of proportional odds is likely valid if the distance (in logits) between any two contrasts remains constant between levels (i.e., connecting line-segments remain parallel). The proportional odds assumption was upheld for sex as a predictor, but violations appeared between some levels of nearly all other predictors, often most apparently at the highest (≥90% vs. <89%) and lowest (≥50% vs. <49%) thresholds of the dependant variables. Due to the computational complexity of partial proportional odds models, only control and final models from the initial iterative process were re-modeled relaxing the proportional odds assumption for all predictors aside from sex (using clmm2). In general, partial proportional odds models had a much higher AIC or only improved on the respective proportional odds models by a small margin (<1% reduction in AIC). Additionally, pooling of mixed model partial proportional presented two issues: (1) allowing parameters to vary across dependant variables levels led to high proportions of parameter variance attributable to missing data once pooled (λ = .54 to .99), and (2) these high levels of variance greatly deflate the adjusted degrees of freedom for hypothesis testing despite the large sample size. Due to the AIC indicating that partial proportional odds models were generally a poorer quality model (less parsimonious with minimal goodness of fit improvement) and the proportion of parameter variance attributable to missing data once pooled, only proportional odds models with, albeit with violation of the proportional odds assumption are reported.
Results
Sample
After excluding students outside typical North American high school grades, the sample consisted of 57,394 adolescents. Table 1 describes the sample. The proportion of females and male respondents was approximately equal (49.8%:49.6%). The large majority of the sample described their ethnicity as White (63.2%), followed by Other (including multiple ethnicities or no ethnicity indicated) as the next most frequent category (16.4%) and Asian (13.8%). All other ethnicity categories were each less than 4% of the sample. Participant academic year was relatively evenly distributed, with 27.8% of the sample comprised of Grade 9/secondaire 3e students, 28.0% in Grade 10/secondaire 4e, 26.6% in Grade 11/secondaire 5e, and 17.6% in Grade 12.
Sample Summary before Imputation.
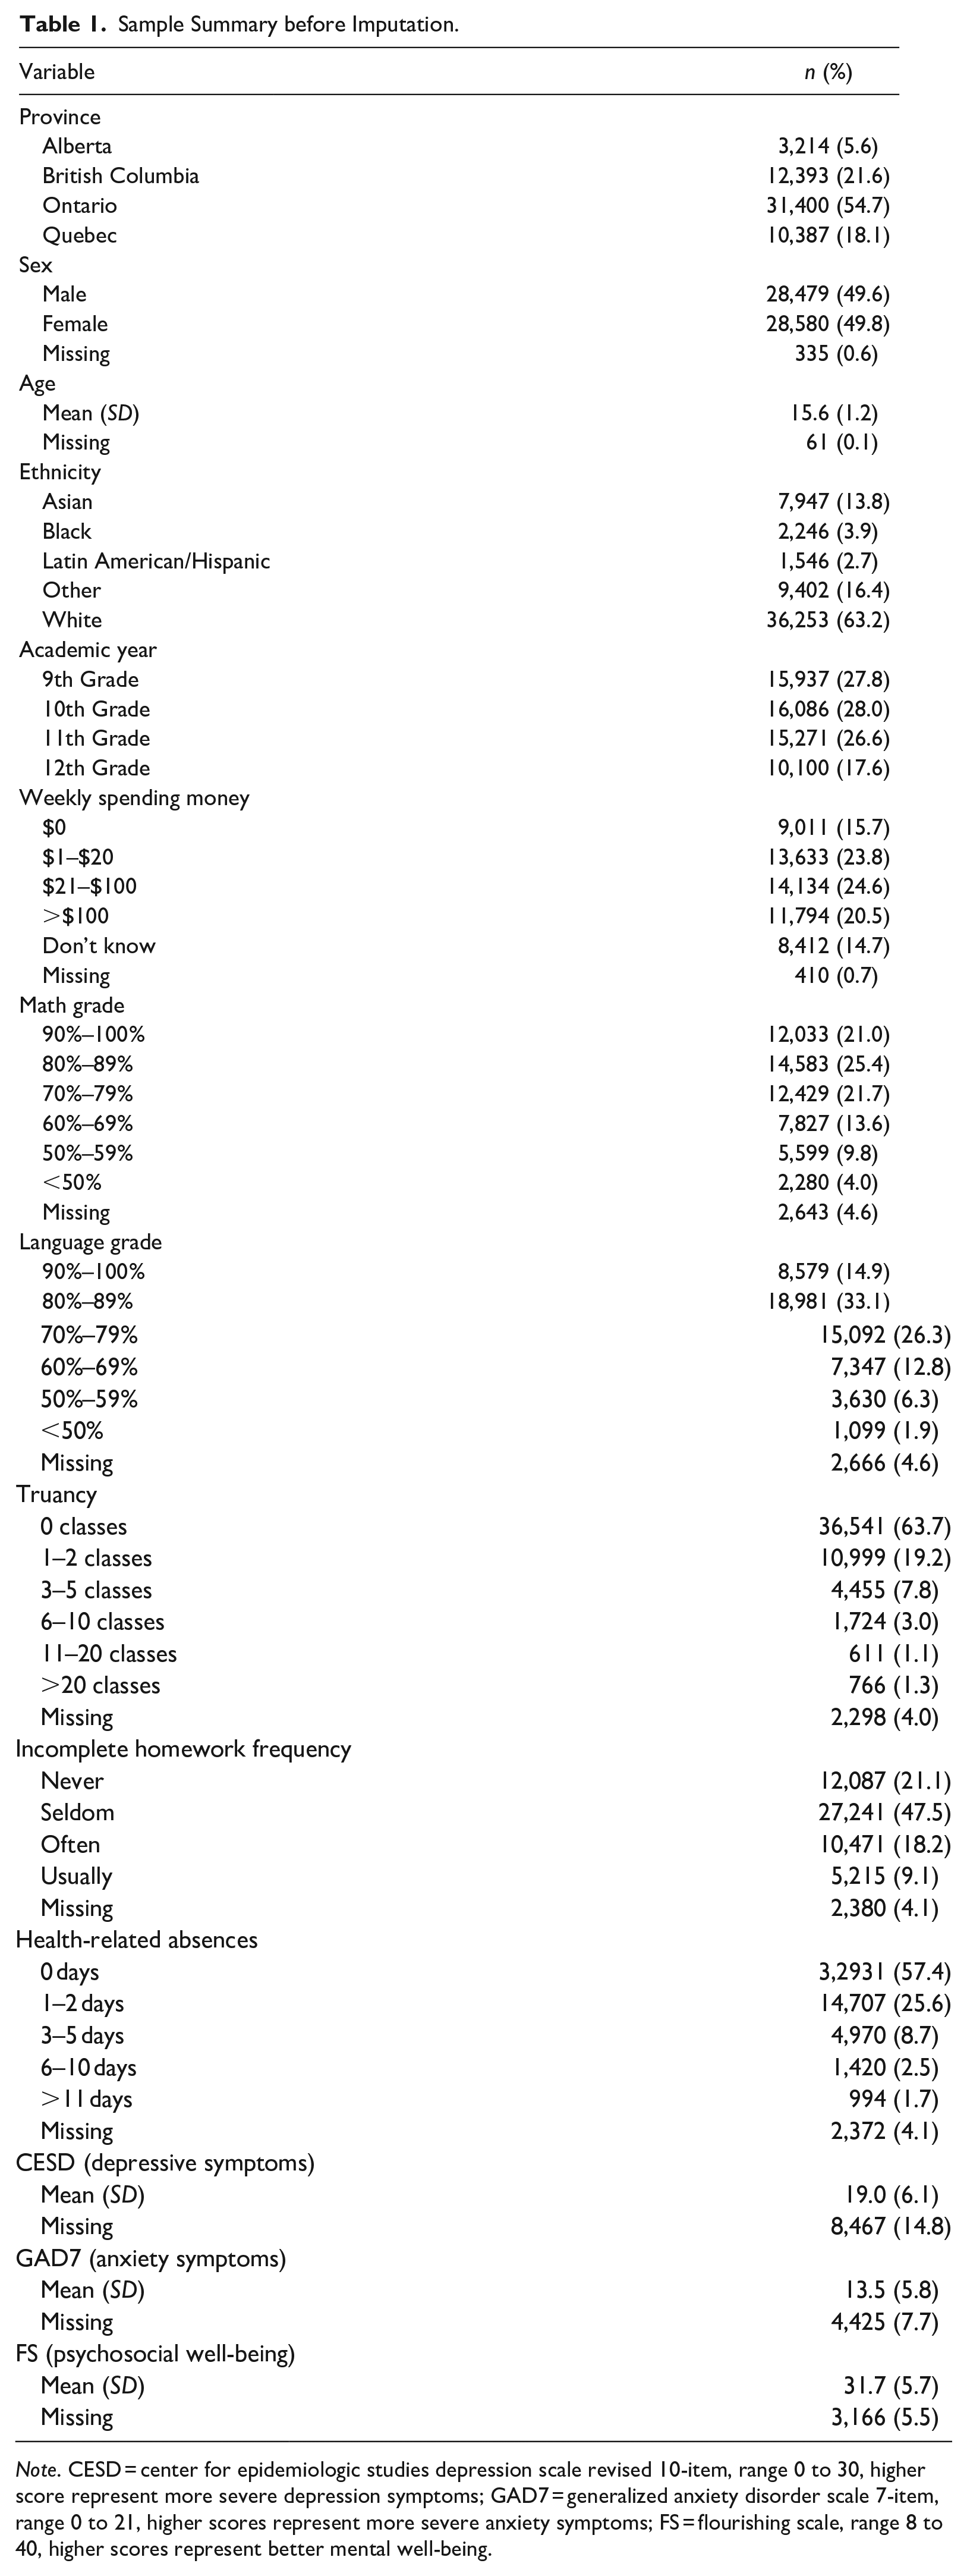
Note. CESD = center for epidemiologic studies depression scale revised 10-item, range 0 to 30, higher score represent more severe depression symptoms; GAD7 = generalized anxiety disorder scale 7-item, range 0 to 21, higher scores represent more severe anxiety symptoms; FS = flourishing scale, range 8 to 40, higher scores represent better mental well-being.
Mental Health Associations with Academic Performance
Direction, magnitude, and significance of effects were similar for both complete case and pooled results from multiply imputed data sets; pooled estimates of models from multiply imputed data sets are reported. For models predicting language grades, adding depression (mean (SD) AIC = 168,945.8 (47.3)), anxiety (AIC = 169,465.1 (52.5)), or psychosocial well-being (AIC = 168,427.8 (50.9)) scores as independent variables improved models compared to a model with statistical controls alone (AIC = 169,739.2 (52.0)). For math grades, adding depression (AIC = 186,251.7 (47.80)), anxiety (AIC = 186,822.7 (46.20)), or psychosocial well-being (AIC = 186,282 (56.60)) scores as independent variables improved models compared to statistical controls alone (AIC = 187,459.1 (50.8)). However, AIC was lowest when all three measures of mental health were included in the language (AIC = 169,739.2 (52.0)) and math models (AIC = 185,919.3 (51.90)); Table 2 summarizes the association between a one unit increase in mental health scores on the likelihood of having higher grades after adjusting for all covariates for these models. Higher depression scores reduced the likelihood of having a higher grade levels in both math and language courses, while higher psychosocial well-being scores increased the likelihood of having with higher grades. However, anxiety scores became positively associated with higher language course grades and were no longer associated with math grades, despite being negatively associated with grades when no other mental health scores were included; in light of this finding a quadratic term for anxiety scores was added to determine if the association followed an inverted-U shape, however the quadratic term was non-significant and did not improve models.
Summary of Pooled Estimates of Association between Mental Health Variables and Higher Academic Performance in Language and Math Courses.
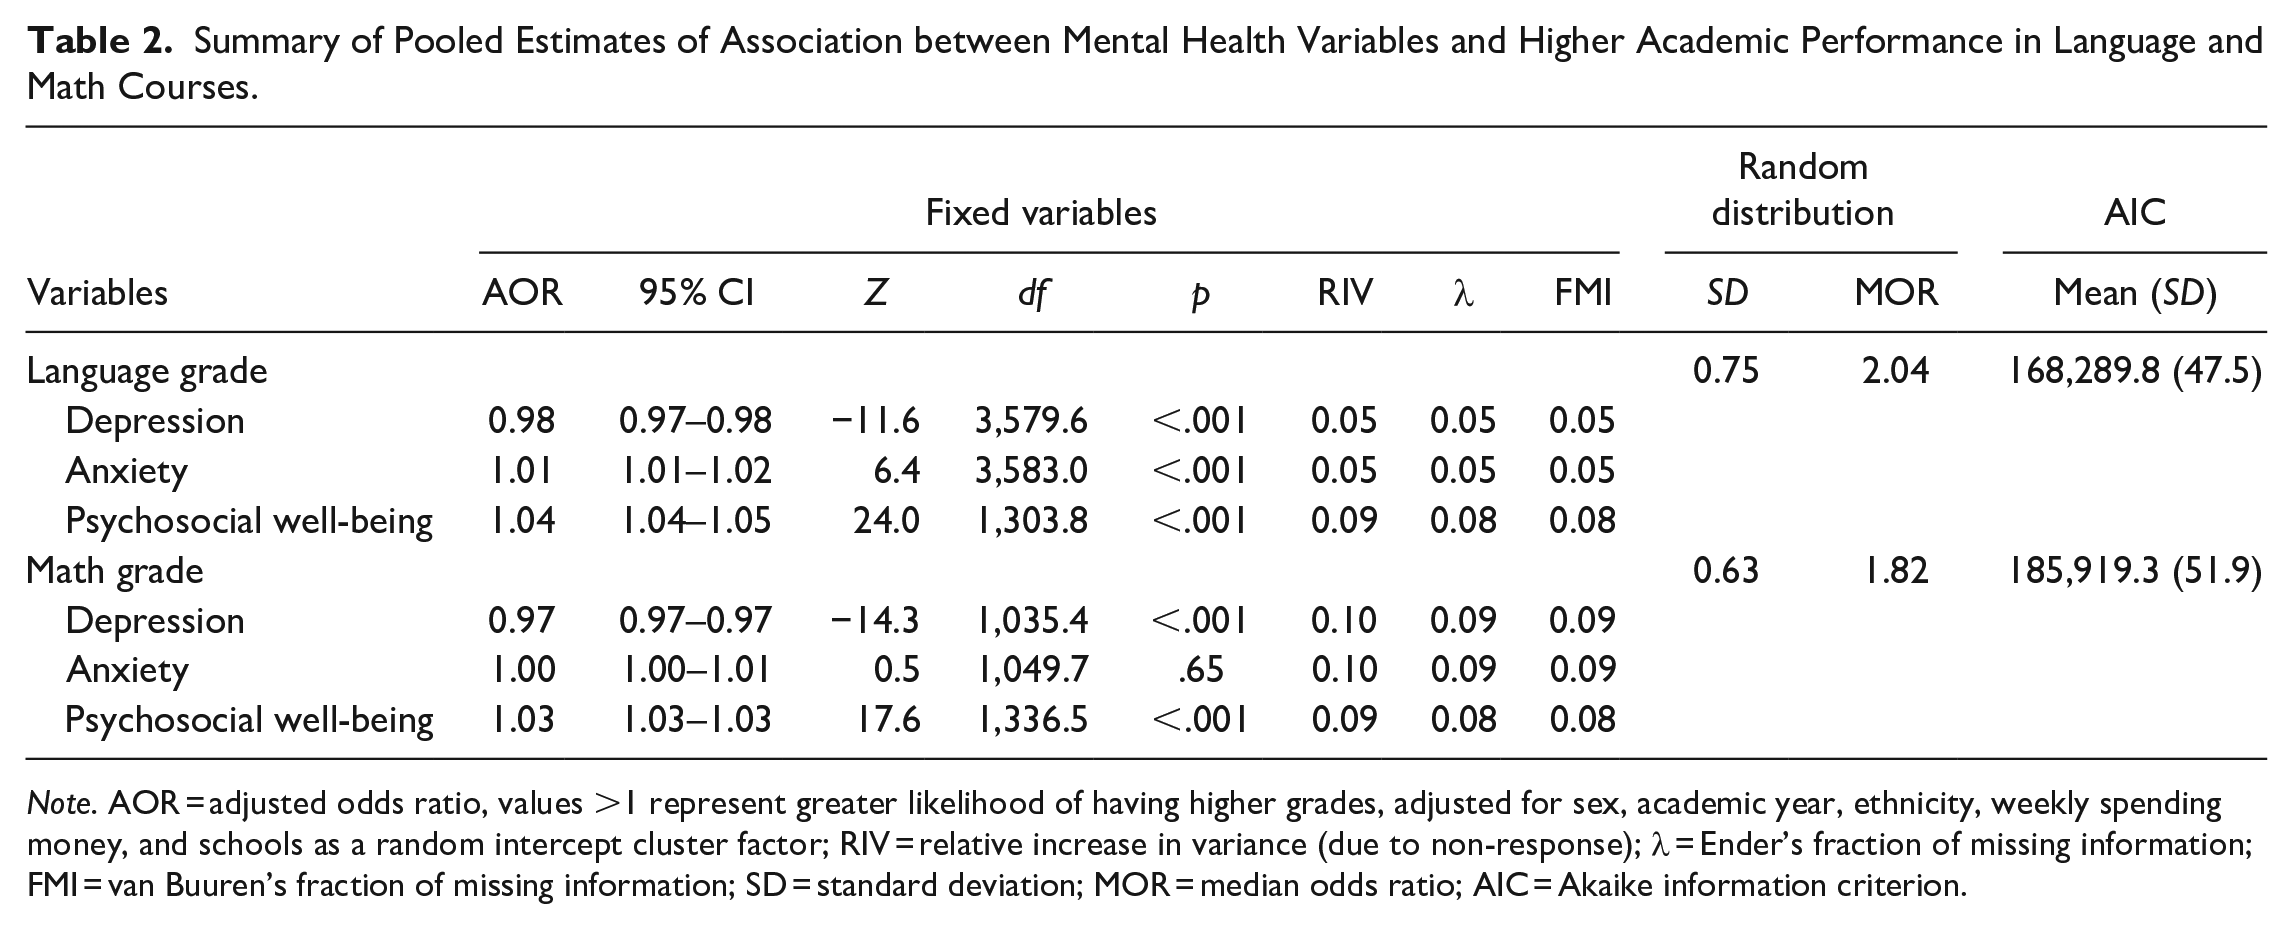
Note. AOR = adjusted odds ratio, values >1 represent greater likelihood of having higher grades, adjusted for sex, academic year, ethnicity, weekly spending money, and schools as a random intercept cluster factor; RIV = relative increase in variance (due to non-response); λ = Ender’s fraction of missing information; FMI = van Buuren’s fraction of missing information; SD = standard deviation; MOR = median odds ratio; AIC = Akaike information criterion.
Mental Health Associations with Education Behaviors
Direction, magnitude, and significance of effects were similar for both complete case and pooled results from multiply imputed data sets, pooled results are reported. Table 3 summarizes adjusted odds ratios between a one unit increase in mental health scores on reporting more frequent truancy, more frequent incomplete homework, and more frequent absences due to health for pooled models with the lowest AIC.
Summary of Pooled Estimates of Association between Mental Health Variables and Higher Truancy, Homework Incompletion Frequency, Frequency of Health Related Absences.
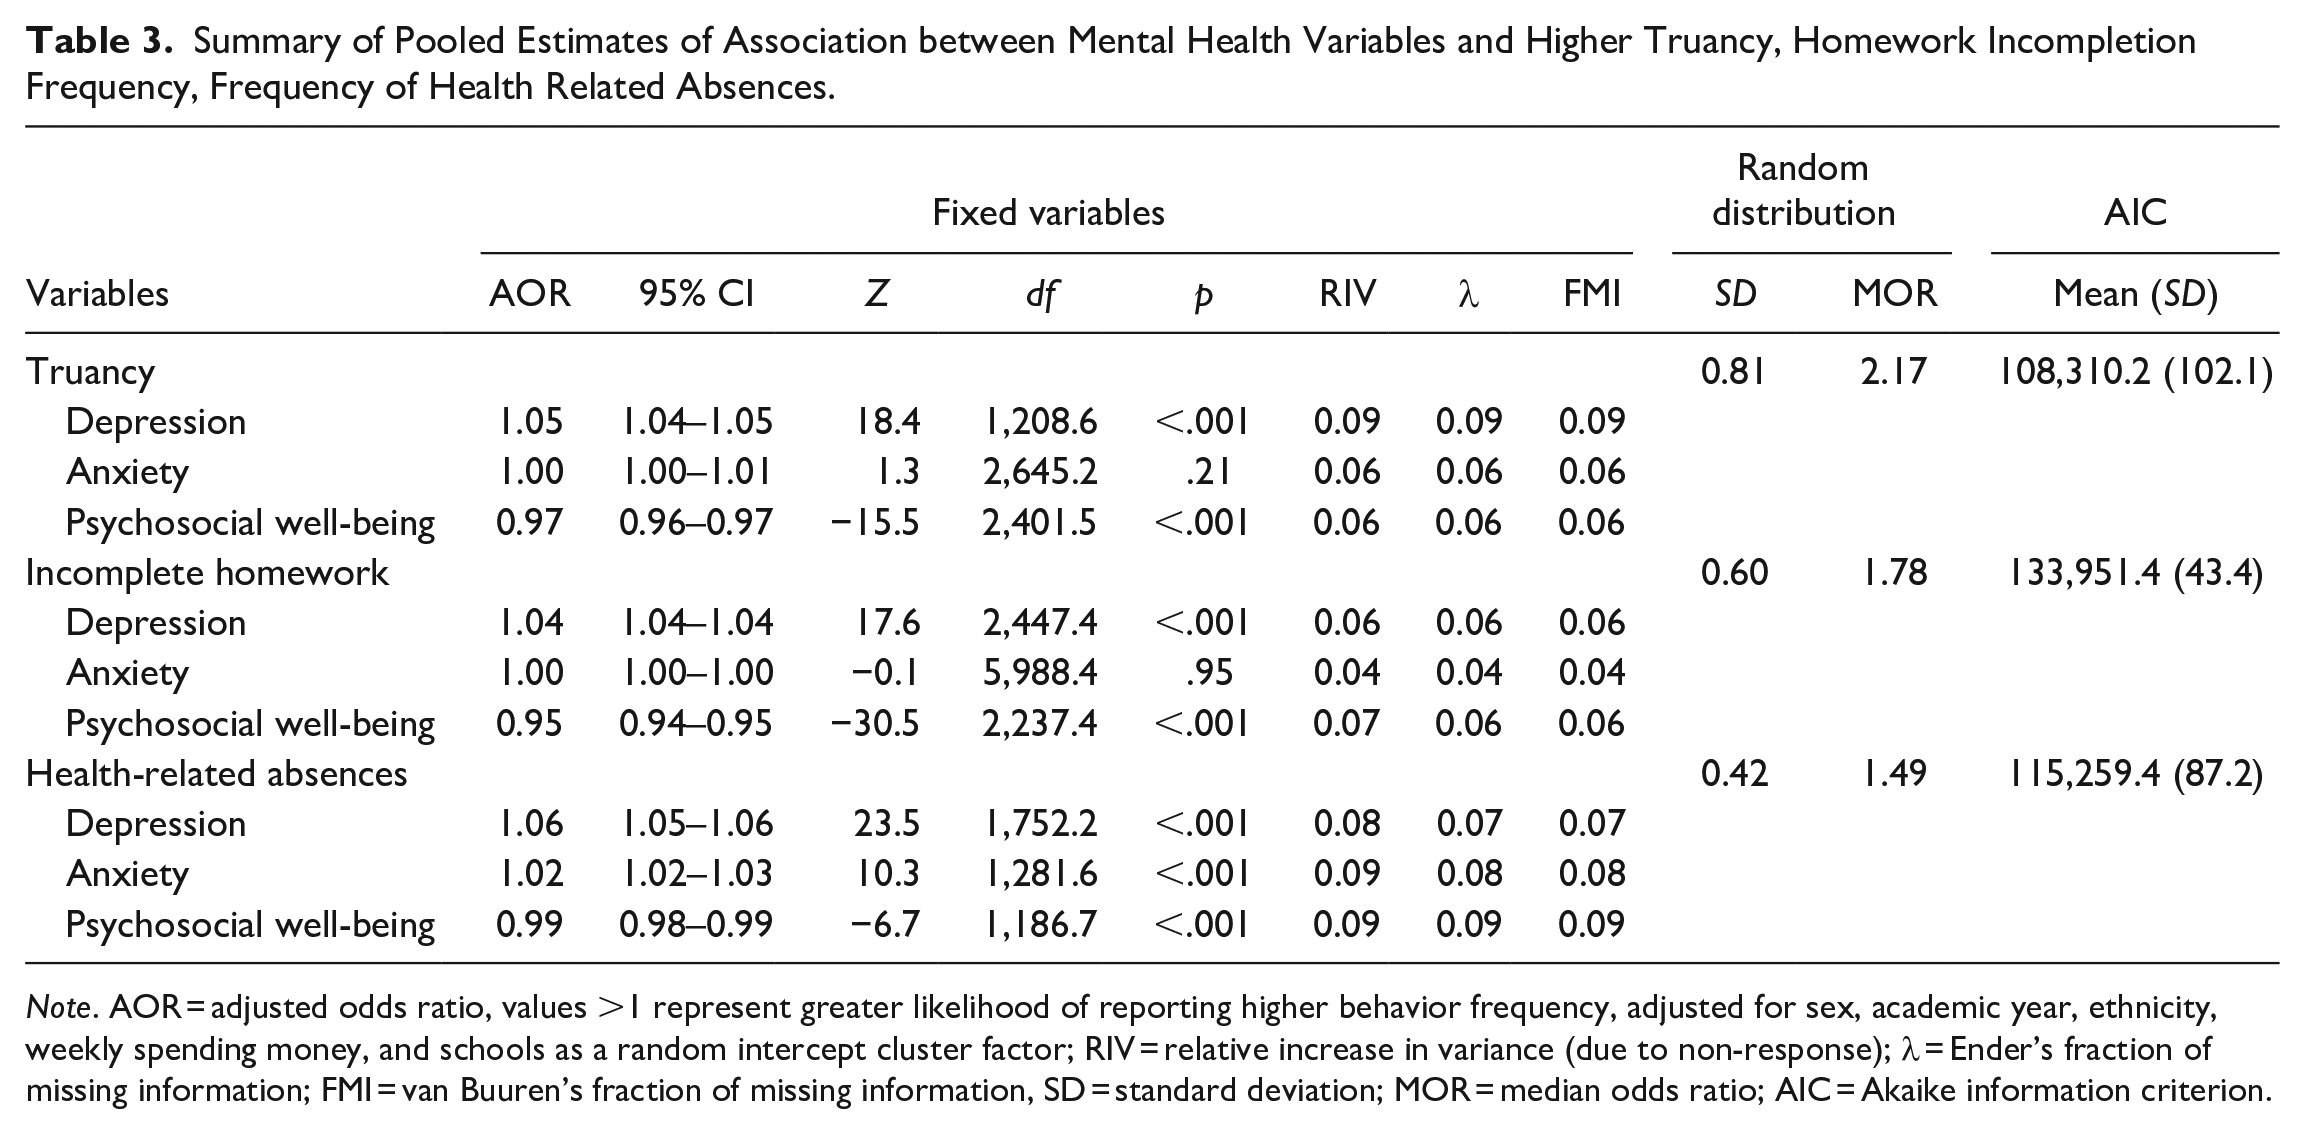
Note. AOR = adjusted odds ratio, values >1 represent greater likelihood of reporting higher behavior frequency, adjusted for sex, academic year, ethnicity, weekly spending money, and schools as a random intercept cluster factor; RIV = relative increase in variance (due to non-response); λ = Ender’s fraction of missing information; FMI = van Buuren’s fraction of missing information, SD = standard deviation; MOR = median odds ratio; AIC = Akaike information criterion.
The association between mental health scores and truancy followed a similar pattern as academic grades. adding depression (AIC = 108,565.5 (102.70)), anxiety (AIC = 109,341.7 (94.90)), or psychosocial well-being (AIC = 108,991.9 (98.20)) scores as independent variables improved AIC compared to statistical controls alone (AIC = 110,350.2 (95.40)). Again, AIC was lowest when all three measures of mental health were included (AIC = 108,310.2 (102.10)), but anxiety scores were no longer associated with truancy, nor was an additional quadratic term for anxiety scores.
Modeling the association between mental health scores and the frequency of incomplete homework followed the same pattern; adding depression (AIC = 134,948.7 (38.10)), anxiety (AIC = 136,020 (42.40)), or psychosocial well-being (AIC = 134,506.5 (49.50)) scores as independent variables improved AIC compared to statistical controls alone (AIC = 137,314.6 (42.00)). AIC was lowest when all three measures of mental health were included (AIC = 133,951.4 (43.40)), and again anxiety scores were no longer associated with homework completion, nor was an additional quadratic term for anxiety scores.
The associations between mental health scores and the frequency of health related absences were similar; adding depression (AIC = 115,428.2 (91.70)), anxiety (AIC = 116,177.8 (77.10)), or psychosocial well-being (AIC = 117,005.4 (86.60)) scores as independent variables improved AIC compared to statistical controls alone (AIC = 118,307.9 (85.40)). Models were optimal when all three measures of mental health were included (AIC = 115,259.4 (87.20)), but unlike other dependant variables examined, higher anxiety scores remained associated with the likelihood of having more absences (in addition to higher depression scores and lower psychosocial well-being scores).
Education Behavior Associations with Academic Performance
Direction, magnitude, and significance of effects were similar for both complete case and pooled results from multiply imputed data sets. Pooled models predicting language and math grades including education behaviors as predictor variables and education behaviors and mental health variables are summarized in Tables 4 and 5 respectively. Compared to statistical controls alone (Language AIC = 169,739.2 (52.0), Math AIC = 187,459.1 (50.8)) adding educational behaviors improved both models for Language (AIC = 166,433.9 (36.50)) and Math (AIC = 183,563.3 (57.40)) grades, however adding mental health scores as well further improved models (Language AIC = 165,850.5 (35.20), Math AIC = 183,062 (56.90)). In general, more classes skipped, more frequent homework incompletion, and more frequent days of school missed were associated with lower language and math grades. Higher depression scores were associated with lower grade levels in both math and language courses, while higher psychosocial well-being scores were associated with higher grades. Again, higher anxiety scores increased the likelihood of having higher language grades but had no association with math grades, nor was an additional quadratic term for anxiety scores. Effects of mental health scores were smaller after controlling for education behaviors compared to models reported in Table 2.
Summary of Pooled Estimates of Association between Education Behaviors, Mental Health Variables and Higher Academic Performance in Language Courses.
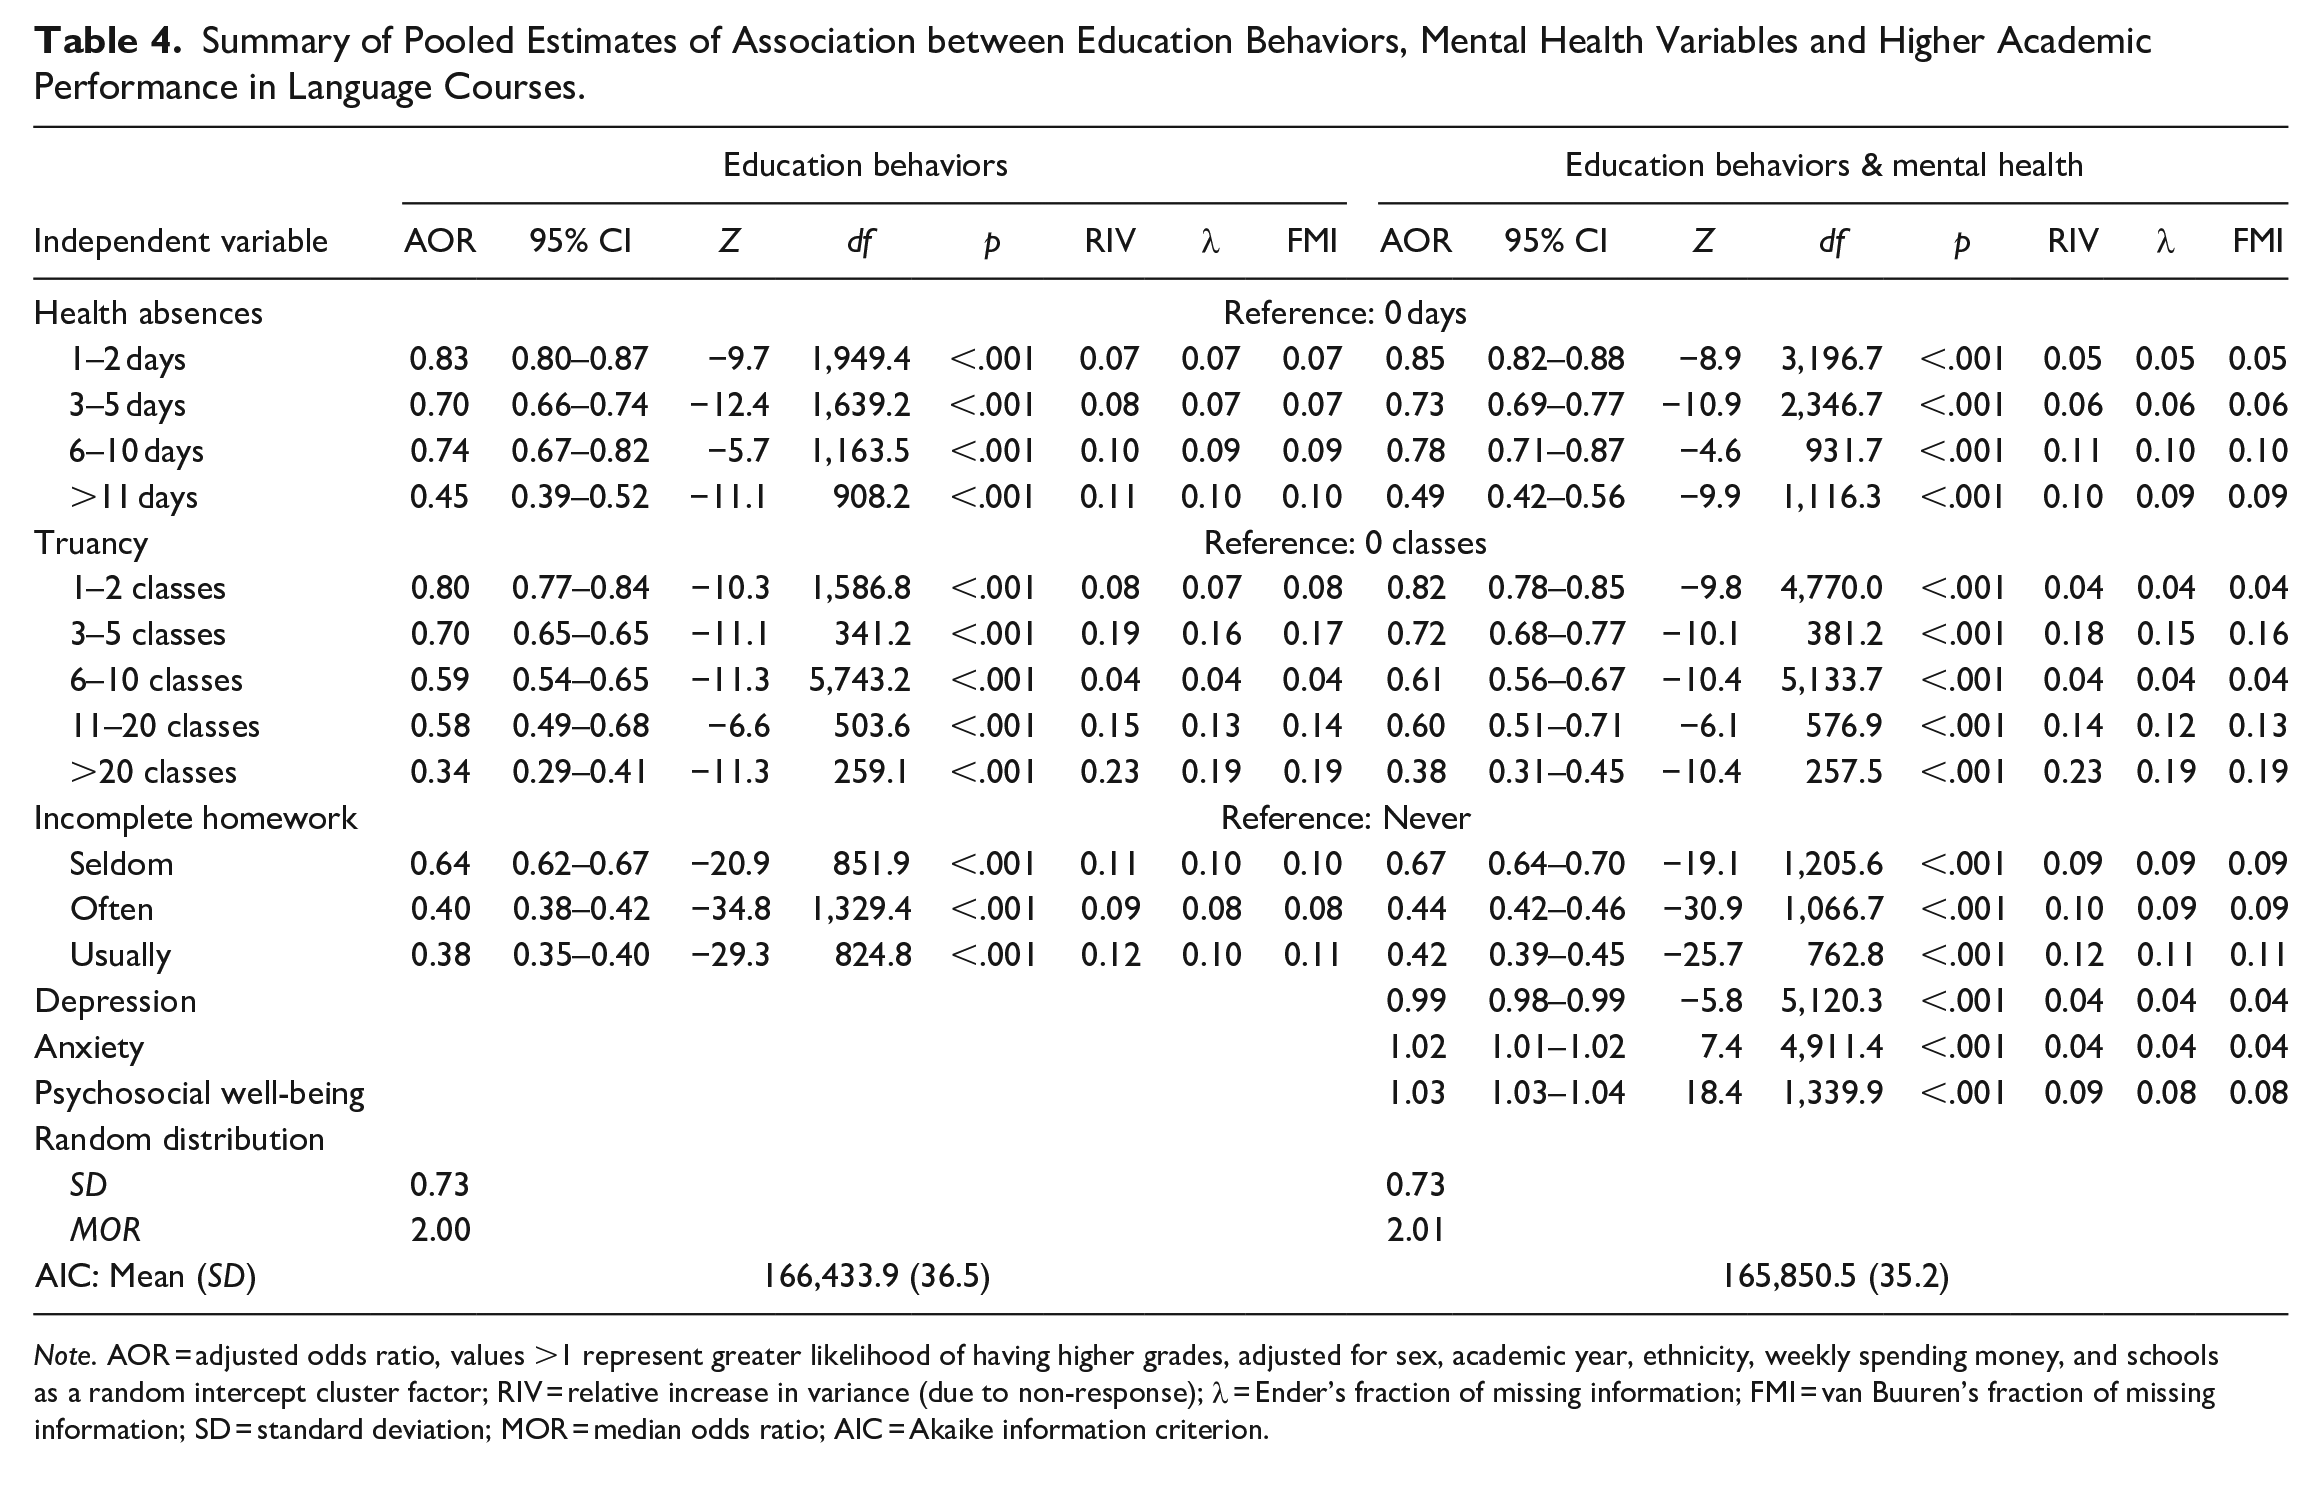
Note. AOR = adjusted odds ratio, values >1 represent greater likelihood of having higher grades, adjusted for sex, academic year, ethnicity, weekly spending money, and schools as a random intercept cluster factor; RIV = relative increase in variance (due to non-response); λ = Ender’s fraction of missing information; FMI = van Buuren’s fraction of missing information; SD = standard deviation; MOR = median odds ratio; AIC = Akaike information criterion.
Summary of Pooled Estimates of Association between Education Behaviors, Mental Health Variables and Higher Academic Performance in Math Courses.
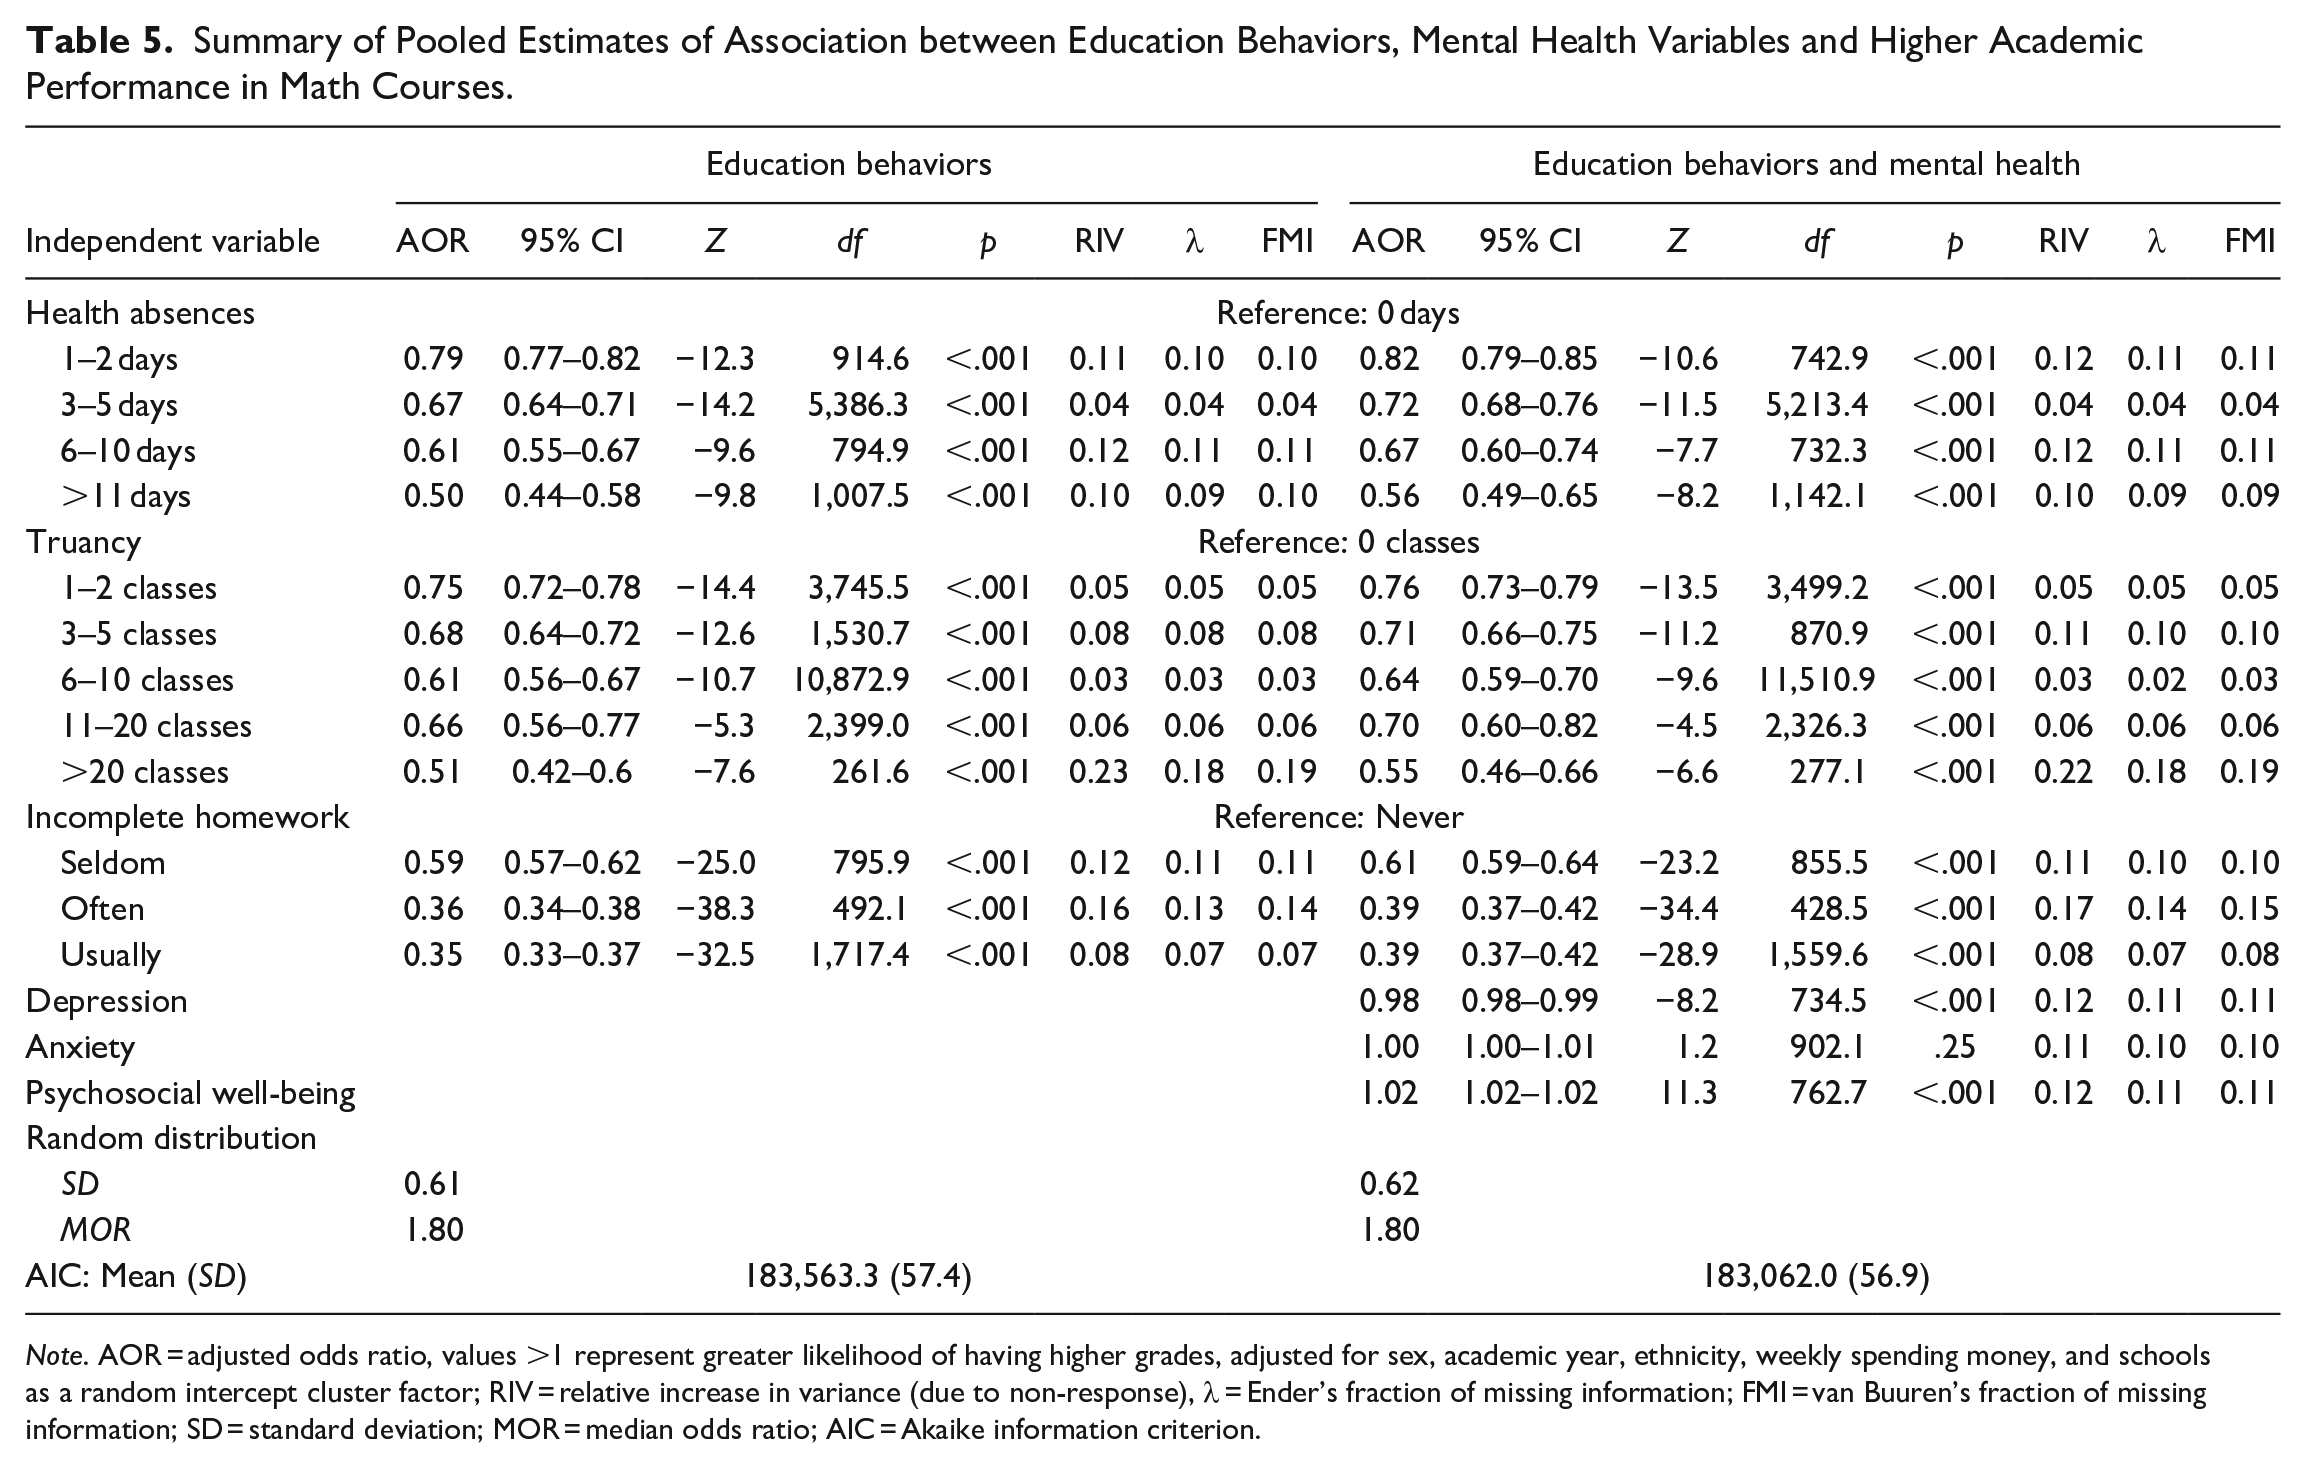
Note. AOR = adjusted odds ratio, values >1 represent greater likelihood of having higher grades, adjusted for sex, academic year, ethnicity, weekly spending money, and schools as a random intercept cluster factor; RIV = relative increase in variance (due to non-response), λ = Ender’s fraction of missing information; FMI = van Buuren’s fraction of missing information; SD = standard deviation; MOR = median odds ratio; AIC = Akaike information criterion.
Discussion
Results indicate that, as predicted, lower depression and higher psychosocial well-being were consistently associated with better academic performance and education behaviors (fewer classes skipped, days missed, and lower frequency of incomplete homework). Moreover, AIC scores suggest that including all mental health measures resulted in a more optimal solution than any single mental health measure; depression and psychosocial well-being both remained associated with academic performance and education behaviors. The role of anxiety was more complex; anxiety scores were inversely related to academic performance and associated with more days missed due to health, more classes skipped, and more frequently leaving homework incomplete when used as the only mental health predictor. However, when included with other mental health outcomes, anxiety only remained associated with days absent due to health reasons, and the relationship with academic performance reversed direction for language scores, such that higher anxiety scores were now associated with higher grades in that subject area.
For both language and math course grades, all education behaviors were associated with academic performance, such that more frequent health-related absences, classes skipped, and homework incompletion, were all associated with lower grades in both courses. Controlling for education behaviors before adding mental health scores resulted in models with the lowest AIC, indicating the most optimal model of those tested. The effects of education behaviors on academic performance remained similar, and while the direction of the association between each mental health score and grades remained the same, effect sizes were slightly smaller. Thus, the results indicate that the associations between mental health status on academic performance are partially attenuated by education behaviors.
An important limitation of this study is that only cross-sectional relationships were examined, making it difficult to draw conclusions about the temporal relationship between mental health, education behaviors, and academic achievement. However, a possible explanation for the observed results is that maladaptive education behaviors such as truancy and homework incompletion may be—in part—a negative social response to depressive symptoms and poor psychosocial well-being. Furthermore, depressive symptoms, anxiety, and psychosocial well-being may also contribute to health-related absences. Together, lower class attendance (regardless of reason) and poorer adherence to prescribed homework may lead to lower academic performance. However, as the associations between mental health factors and academic performance were only partially attenuated by education behaviors, it is likely that depression and psychosocial well-being represent aspects of functional impairment, even when students are in attendance and attempting to engage with course material. Poor mental health and low academic achievement frequently co-occur (Bradshaw et al., 2010; Valdez et al., 2011), however, successful interventions to improve mental health often result in improved academic outcomes (Becker et al., 2014; Durlak et al., 2011), suggesting academic achievement and educational behaviors may improve when mental health factors are addressed. Alternatively, lower secondary school grade point average predicts a greater likelihood of developing depression in adulthood (Wallin et al., 2019). A longitudinal study has found reciprocal relationships between psychosocial wellbeing and academic engagement (Datu & King, 2018), suggesting that early mental health concerns may interfere with academic outcomes, which in turn contribute to poorer mental health. The findings of this study suggest that longitudinal approaches are warranted to evaluate the temporal relationship between mental health factors, educational behaviors, and academic achievement, but suggest a potential role for education behaviors as a partial mediator of how poor mental health may influence later academic achievement.
The complicated relationship between anxiety and academic outcomes was not entirely unexpected given previous literature. Some studies have broadly used the presence of mental health concerns including both clinical levels of depression and anxiety (Burnett-Zeigler et al., 2012; Kantomaa et al., 2010), and thus did not partial out the relative effect of either cluster of symptoms. Additionally, at least one other study has found similar results where, after controlling for depression scores, higher anxiety scores were significantly associated with higher grades (Fernández-Castillo & Rojas, 2009). It is possible that when both depression and anxiety are included in a model, depression scores better account for a latent mood related psychological dysfunction construct such that anxiety scores are not significant predictors in the model. Once this latent psychological dysfunction is accounted for, students who are anxious about the negative consequences of lower grades may take appropriate actions to avoid such an outcome, at least in the case of language course grades.
As an analytic limitation, assessment of the proportional odds assumption indicated violations on several predictors, however relaxing this assumption for violating predictors tended to decrease model quality as measured by AIC and introduced considerable variance due to missing data when models were pooled across imputed data sets. Furthermore, Senn and Julious (2009) have suggested an ordinal model compromised by violations of the parallel lines assumption is more informationally valuable than dichotomizing ordinal scales to avoid having to meet this assumption, and the resultant estimates in a model represent a summary or average estimate of effects across all levels of the dependant variable. Faced with this trade-off we opted for the approach which tended to result in higher quality models and facilitated reduction in bias due to missing data through multiple imputation at the cost of violating the proportional odds assumption. As a result, the models reported may over or underestimate the association that predictors may have at certain thresholds of the dependant variable compared to the overall summary estimates generated by the modeling approach used for these analyses, for example higher psychosocial well-being scores may not significantly increase the odds of having a course grade above 50%, but may significantly increase the odds of having a grade above 60%. Despite this short coming, simulations studies comparing ordinal modelling approaches find similar predicted outcome probabilities even when data violates the proportional odds assumption and the partial proportional odds model has a slightly better AIC (Fullerton & Xu, 2012). Thus, the implications of this decision may have only minimal effects on the predictive ability of the overall model.
The COMPASS data set does not have a measure of attention-deficit/hyperactivity disorder symptoms or presence of learning disabilities, which are associated with lower academic achievement, nor academic aptitude or parental education, which are positively associate with academic achievement (McLeod et al., 2012). Despite this, results of the present study were similar to those previously reported where depression scores were associated with grade point average, but the effect was reduced after adding delinquent behaviors in the model (McLeod et al., 2012). Given that attention-deficit/hyperactivity disorder symptoms and learning disabilities are mental disorders and under the dual-continua model would be components of the illness/dysfunction continuum, psychosocial well-being may still be associated with academic performance after adjusting for these factors. Additionally, behaviors examined in this study were limited to education behaviors and did not examine or control for additional factors that may simultaneously affect academic performance and mental health such as substance use (Burnett-Zeigler et al., 2012; McLeod et al., 2012), physical activity (Kantomaa et al., 2010), and bullying victimization (Hammig & Jozkowski, 2013; Nakamoto & Schwartz, 2010); the remaining effects of depression and psychosocial well-being on academic performance may be further attenuated by these factors, and should be considered in the future. In particular, some evidence suggests experiences of peer victimization predict academic underachievement via depressive symptoms and school disconnection (Espelage et al., 2013). Furthermore, measures of perceived schoolwork pressure were not available; which increased over time in higher income countries and partly explained increases in psychosomatic complaints (Cosma et al., 2020).
Additional limitations include the use of self-report measures and a convenience sample of schools. The COMPASS study was not designed to be representative, although the large sample size, full school samples, favorable response rate, and use of passive consent protocols support generalizability. Passive consent protocols reduce bias resulting from student non-response and non-participation, as opposed to active consent procedures that require participants to return a permission form signed by their parent/guardian (Chartier et al., 2008; Courser et al., 2009; Pokorny et al., 2001). No student names are required, helping to preserve perceptions of anonymity and promote honest reporting. Lastly, it is important to acknowledge that the depression and anxiety measures used in this study are not diagnostic.
Overall, these results suggest that the dual-continua model of mental health (Westerhof & Keyes, 2010; WHO, 2004) to be useful in understanding the relationship between mental health and academic performance and education behaviors. Both depressive symptoms (as an indicator of mental illness/dysfunction) and psychosocial well-being were associated with all academic outcomes examined. As analyses were not limited to those meeting criteria for a mental illness, the results suggest a potential role for symptoms of depression influencing academics even when below a clinical threshold; further evaluation of subclinical mental health symptoms is required. The effects of mental health factors were partially mediated by education behaviors, suggesting reduced class attendance and poor homework adherence, while associated to both academic outcomes and mental health, do not account entirely for the lower grades observed in adolescents with worse mental health.
Relevance to the Practice of School Psychology
Initiatives to promote better psychosocial well-being and reduce feelings of depression in high-school adolescents may have simultaneous benefits for improving attendance, having students complete work, and ultimately attain better grades. While the National Institute of Mental Health already recognizes dropping grades as a sign of potential adolescent depression (National Institute of Mental Health, 2018), low attendance and poor homework completion, may serve as useful upstream behavioral markers in high-school students to help school psychologists identify those in need of individualized mental health intervention before academic performance is affected (National Association of School Psychologists [NASP], 2020). Notably, mental health scores were related to the number of days missed for health reasons, not just skipping classes, suggesting that attendance in general may be a viable marker for intervention not just when reduced attendance is due to delinquent behaviors. This insight reduces the need for educators and school psychologists to distinguish between these behaviors when trying to identify students who may need mental health support. Furthermore, the results indicate that while deficits in emotional functioning are relevant to academic performance, mental health promotion in high schools should consider psychosocial well-being as an important aspect of mental health associated with better academic outcomes. Given that mental health interventions often result in improved academic outcomes (Becker et al., 2014; Durlak et al., 2011) and that the association between academic outcomes and well-being may be reciprocal in nature (Datu & King, 2018), programs to promote positive well-being and develop effective social emotional skills, including self regulation and positive coping strategies, may represent a “best buy” approach where both mental health and academic performance improve. In summary, results may help inform school psychologists in their role of identifying students in need of individualized support and potential educational behaviors that impede achievement, and support the integration of mental health services within academic goals (NASP, 2020).
Footnotes
Declaration of Conflicting Interests
The author(s) declared no potential conflicts of interest with respect to the research, authorship, and/or publication of this article.
Funding
The author(s) disclosed receipt of the following financial support for the research, authorship, and/or publication of this article: The COMPASS study has been supported by a bridge grant from the CIHR Institute of Nutrition, Metabolism and Diabetes (INMD) through the “Obesity—Interventions to Prevent or Treat” priority funding awards (OOP-110788; awarded to SL), an operating grant from the CIHR Institute of Population and Public Health (IPPH) (MOP-114875; awarded to SL), a CIHR project grant (PJT-148562; awarded to SL), a CIHR bridge grant (PJT-149092; awarded to KP/SL), a CIHR project grant (PJT-159693; awarded to KP), and by a research funding arrangement with Health Canada (#1617-HQ-000012; contract awarded to SL). The COMPASS-Quebec project additionally benefits from funding from the Ministère de la Santé et des Services sociaux of the province of Québec, and the Direction régionale de santé publique du CIUSSS de la Capitale-Nationale.