
Abstract
The objective of the present study was to test the effects of an inpatient management system (CircadianCare) aimed at limiting the negative impact of hospitalization on sleep by enhancing circadian rhythmicity. Fifty inpatients were randomized to either CircadianCare (n = 25; 18 males, 62.4 ± 1.9 years) or standard of care (n = 25; 14 males, 64.5 ± 2.3 years). On admission, all underwent a full sleep-wake evaluation; they then completed daily sleep diaries and wore an actigraph for the whole length of hospitalization. On days 1 (T0), 7 (T1), and 14 (T2, if still hospitalized), salivary melatonin for dim light melatonin onset (DLMO) and 24-h skin temperature were recorded. In addition, environmental noise, temperature, and illuminance were monitored. Patients in the CircadianCare arm followed 1 of 3 schedules for light/dark, meal, and physical activity timings, based on their diurnal preference/habits. They wore short-wavelength-enriched light-emitting glasses for 45 min after awakening and short-wavelength light filter shades from 18:00 h until sleep onset. While the first, primary registered outcome (reduced sleep-onset latency on actigraphy or diary) was not met, based on sleep diaries, there was a trend (0.05 < p < 0.1) toward an advance in bedtime for CircadianCare compared to standard of care patients between T0 and T1. Similarly, DLMO time significantly advanced in the small group of patients for whom it could be computed on both occasions, with untreated ones starting from earlier baseline values. Patients sleeping near the window had significantly higher sleep efficiency, regardless of treatment arm. As noise fluctuation increased, so did the number of night awakenings, regardless of treatment arm. In conclusion, the CircadianCare management system showed positive results in terms of advancing sleep timing and the circadian rhythm of melatonin. Furthermore, our study identified a combination of environmental noise and lighting indices, which could be easily modulated to prevent hospitalization-related insomnia.
Circadian rhythms are self-sustaining rhythms with a period of approximately 24 h that have an influence on most physiological processes (Weitzman et al., 1971; Qian and Scheer, 2016; Douma and Gumz, 2018; Refinetti, 2020). The circadian timing system encompasses a master light–entrainable clock in the suprachiasmatic nuclei of the hypothalamus, and peripheral time-keepers in almost every organ of the body (Allada and Bass, 2021). Its regulation depends on both internal (neural and humoral) and environmental stimuli, called Zeitgebers, such as the light/dark cycle and, to a lesser extent, exercise timing, meal timing, and the timing of social interactions (Asher and Schibler, 2011; Reinke and Asher, 2016). In humans, the sleep-wake cycle is the most obvious behavioral output of the circadian timing system and it also indirectly determines light/dark exposure.
In recent years, evidence has emerged that circadian disruption and misalignment have serious medical consequences, including sleep curtailment and worsened sleep quality, increased cardiovascular morbidity (Morris et al., 2016; Vetter et al., 2016), and increased risk of certain types of cancer (Lin et al., 2015; Masri and Sassone-Corsi, 2018; Walasa et al., 2018). Hospitalization per se weakens circadian rhythmicity and the sleep-wake cycle due to disease itself, an unusual and noisy environment, and modified light (with significant exposure to light at night, especially in hospital rooms with multiple beds), food, and activity cues (Aaron et al., 1996; Kamdar et al., 2012; Bano et al., 2014; Giménez et al., 2017). As a result, patients tend to experience delayed, shorter, and poorer night sleep, several night awakenings, and daytime sleepiness. This disturbed sleep may affect prognosis, also in terms of duration of the inpatient stay (Ryherd et al., 2008).
We have previously documented that, in our medical ward, rolling shutters were rarely moved during the 24 h, with consequent daylight deprivation and worse sleep (especially for patients whose bed was far from the window; Bano et al., 2014), highlighting the powerful role of light as a Zeitgeber within the hospital environment. Furthermore, we subsequently showed that inpatients treated with bright light immediately after awakening and with short-wavelength light filter glasses in the evening had fewer night awakenings, less daytime sleepiness (with potential positive effects also on the subsequent sleep episode), and better mood than their untreated counterparts (Formentin et al., 2020). It is therefore possible that controlling/modulating light and other potentially relevant Zeitgebers during an inpatient stay may enhance rhythmicity, improve sleep timing and quality, and, ultimately, improve prognosis (Milani et al., 2018).
Thus, the aim of the present study was to test the effects of an inpatient management system, which we called CircadianCare, aimed at limiting the impact of hospitalization by enhancing circadian rhythmicity (and, in turn, improving sleep timing/quality) through an assessment of the patient’s specific circadian features/needs and an ad hoc personalized light/dark, meal, and activity or physiotherapy schedule. The main expected outcome was an advance in circadian phase, measured by an advance in sleep onset timing (first registered primary outcome: reduced sleep onset latency based on actigraphy or diary, plus a series of actigraphy-/diary-based sleep-wake variables) and/or an advance in melatonin onset after 7 days of hospitalization. This was based on the hypothesis that the personalized CircadianCare schedule would advance phase (mostly due to morning light administration and protection from light in the early evening/night hours, vide infra), limit its hospitalization-related delay and/or rhythmicity weakening, and, in turn, improve sleep quality.
Patients and methods
Patients
All patients admitted into the Clinica Medica V ward (a general medical 54-bed ward with 10 hepatology beds) of Padova University Hospital between October 2020 and January 2022 were screened within 24 h of admission. In principle, all patients screened within 24 h of admission could be included. Exclusion criteria were: unwillingness or inability to comply with the study procedures, severe cognitive impairment, and diagnosed, well-defined sleep-wake disorders. To detect a difference of 10 min in sleep onset time between CircadianCare and standard of care after a week of hospitalization (T1) with a standard deviation (SD) of 15 min, with a two-sided 0.05 significance and a power of 80%, a sample size of 35 subjects per arm would have been needed. The above was based on what is known on light responses, and not on more articulate, multiple intervention protocols such as ours, thus a less conservative power estimate to detect a difference of 20 min in sleep onset time between CircadianCare and standard of care (remaining parameters unchanged) was also made, with 18 subjects per arm being needed. On final review, considering both feasibility in the acute medical setting and the limited, available literature data, 25 subjects per arm were deemed appropriate and study approval sought for based on this power calculation. Despite the difficulties and limitations to screening/recruitment during the pandemic, a total of 142 patients were screened; 48 patients did not meet the inclusion/exclusion criteria, and 44 patients were eligible but unwilling to participate (Figure 1). Thus, the final population included the necessary 50 inpatients (study stop), randomized (1:1 block randomization) to either the CircadianCare system (n = 25) or standard of care (n = 25) by use of a computer-generated randomization list. Sequentially numbered, sealed envelopes were then utilized and singly provided by author LZ to clinician author CM, who wrote the screened patient code on the outside of the envelope prior to opening it. Authors LZ, CF, GG, EDD, DR, RC, DJS, DB, LB, ADB, PA and SM remained blinded after assignment of the interventions. Information on demographics (sex, age, body mass index, and level of education), reasons for hospital admission, triage severity code on admission, the Charlson Comorbidity Index (Charlson et al., 1987), and treatment prior to admission were collected for each patient. The study protocol was approved on 20 February 2020 by the Padova University Hospital Ethics Committee (AOP0536) and the study was conducted according to the Declaration of Helsinki (Hong Kong and 2008 Amendments) and Good Clinical Practice (European) guidelines. All participants provided written, informed consent. The study was registered retrospectively (because of administrative/logistic issues) on ClinicalTrials.gov (NCT05228444). The Consolidated Standards of Reporting Trials (CONSORT) reporting guidelines were used (Schulz et al., 2010). The CONSORT flow diagram is presented in Figure 1 and the CONSORT checklist is included in the Supplementary Material.
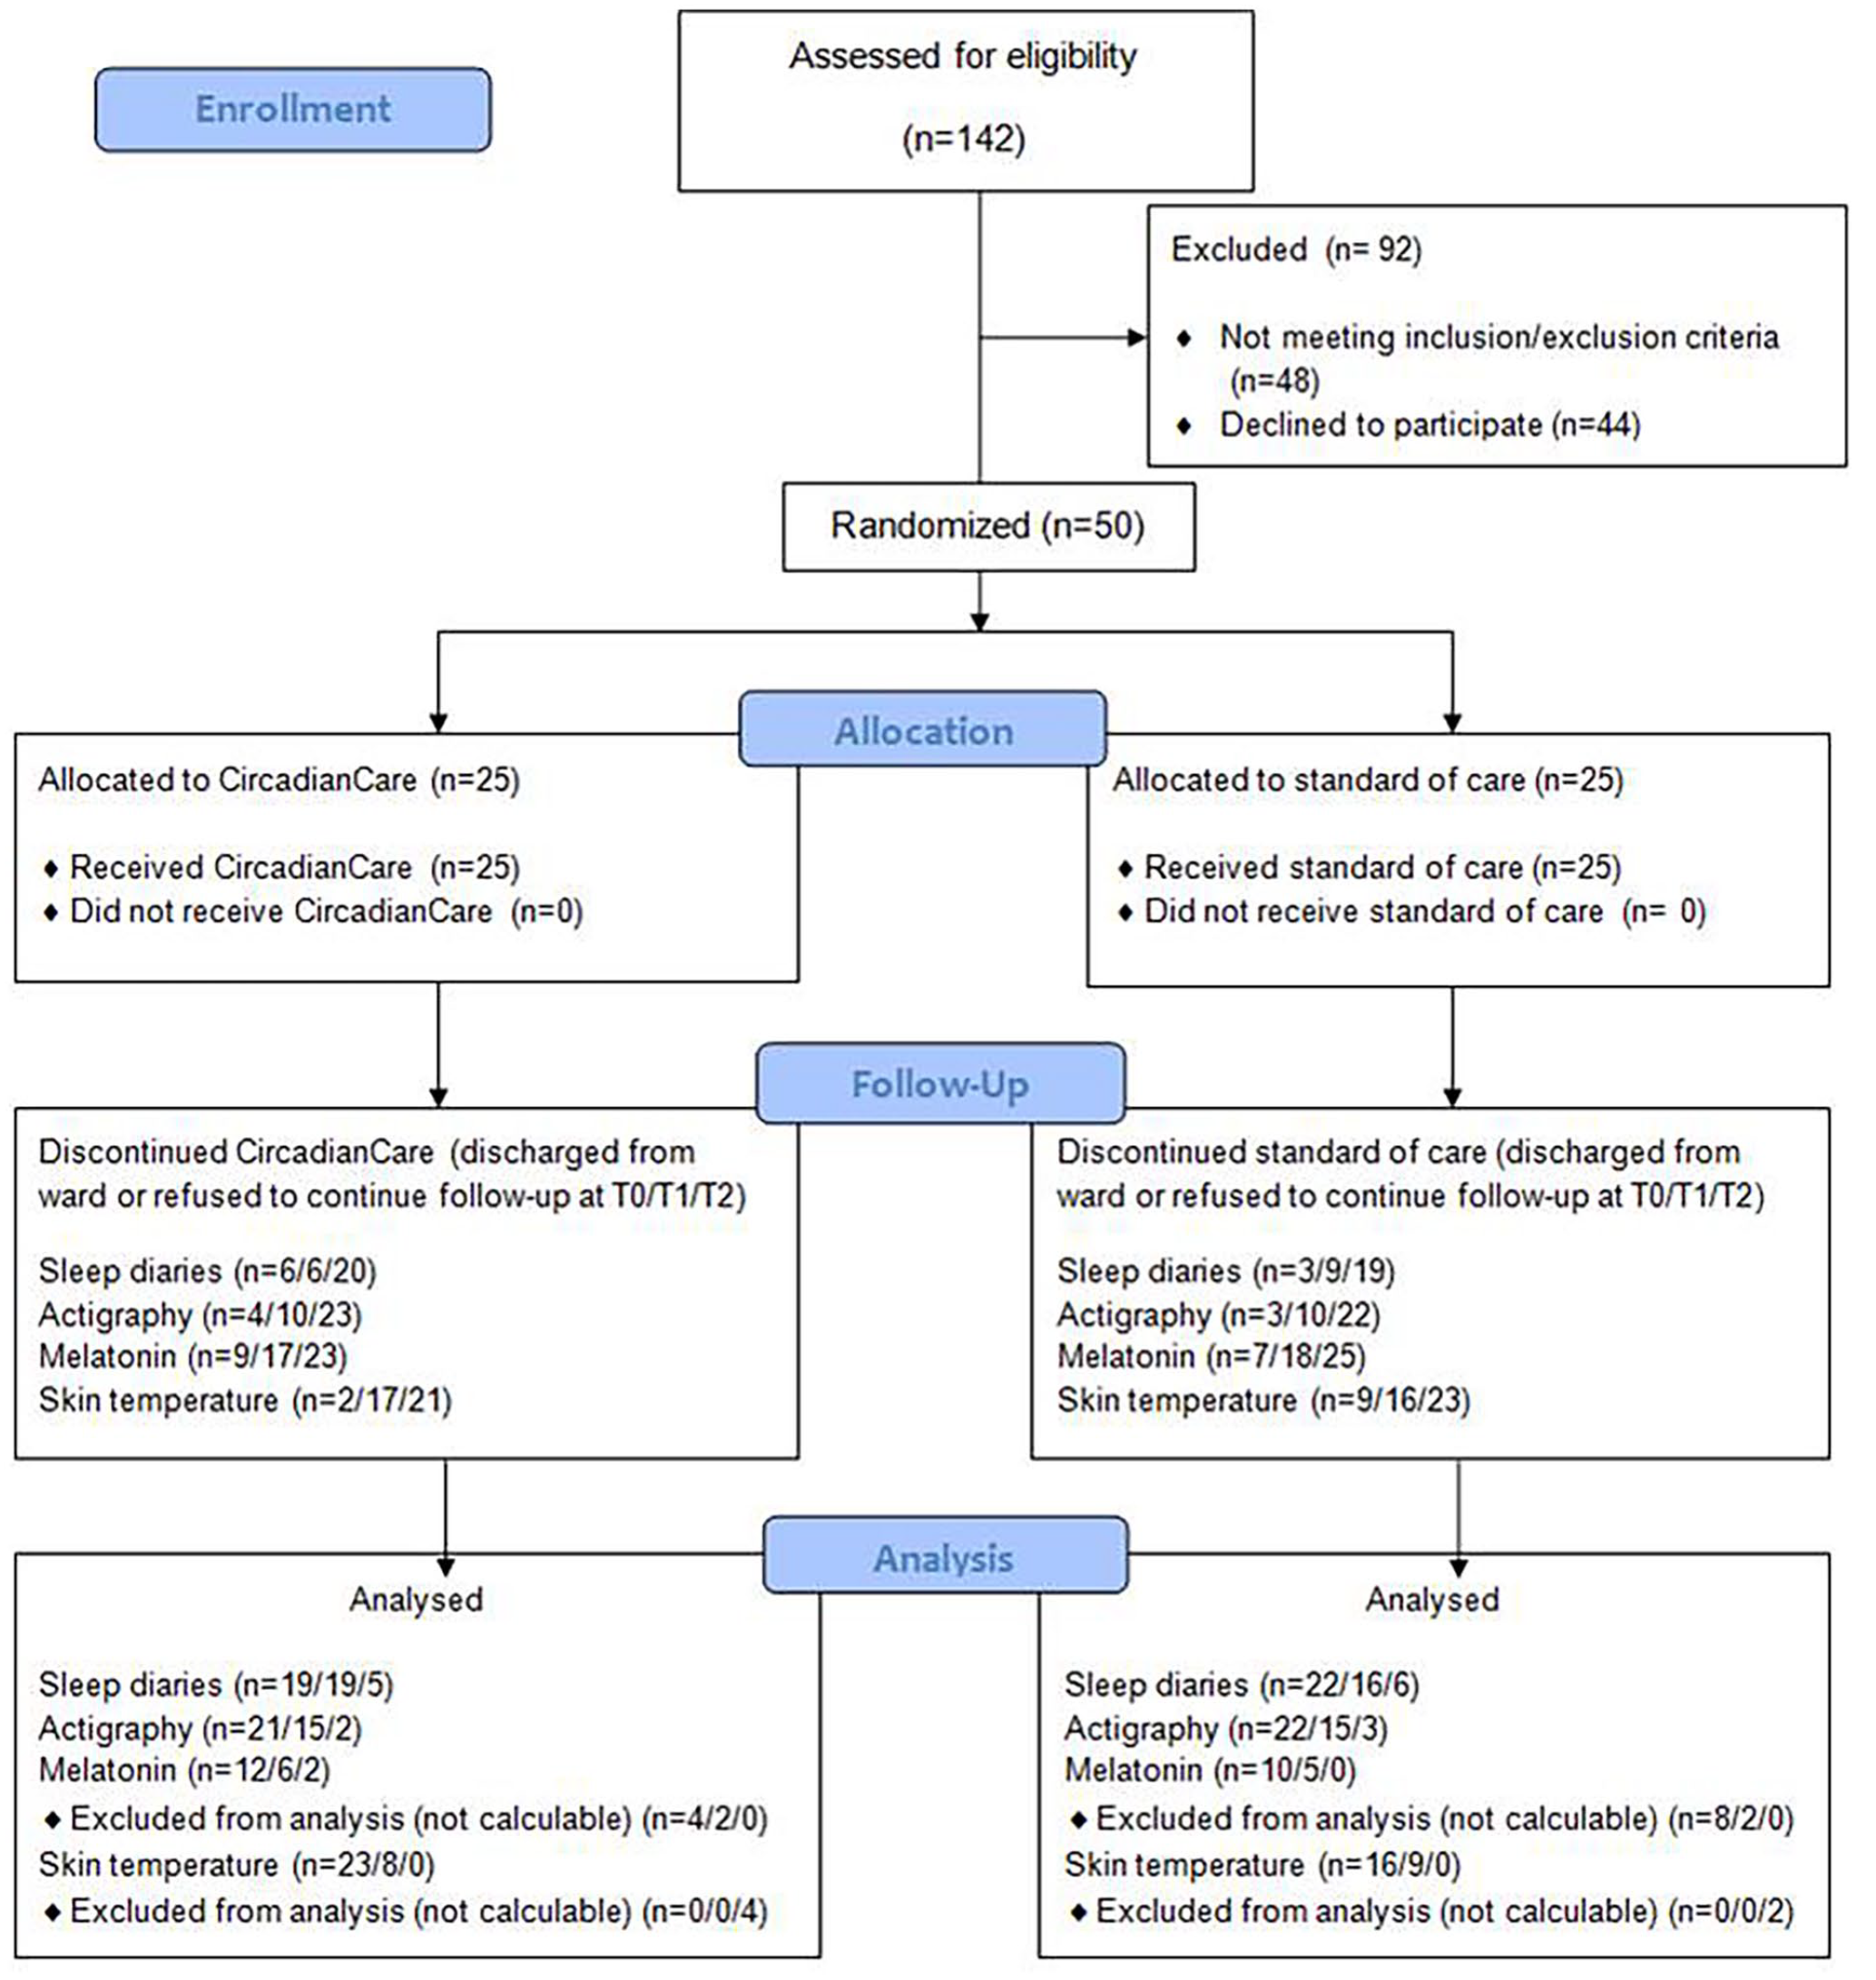
Consolidated Standards of Reporting Trials (CONSORT) flow diagram.
Data Collection
Pre-admission Sleep-Wake Profiles
On the day of admission, patients underwent an assessment of their baseline, pre-hospitalization sleep-wake profiles, based on: (1) the Pittsburgh Sleep Quality Index (PSQI), which evaluates subjective sleep quality over the preceding month and differentiates “good” from “poor” sleepers (Buysse et al., 1989; Curcio et al., 2013); (2) the ultrashort version of the Munich ChronoType Questionnaire (MicroMCTQ) (Ghotbi et al., 2020), which is used to assess chronotype based on habitual sleep timing on work/study versus free days; (3) the Sleep Timing and Sleep Quality Screening (STSQS) questionnaire, to assess habitual sleep-wake timing/quality (Montagnese et al., 2009); and (4) the Horne-Östberg (HÖ) questionnaire (Horne and Ostberg, 1976), which defines diurnal preference and was utilized to split patients into morning (definitely/moderately), intermediate, and evening (definitely/moderately) types. For statistical power reasons, “definitely morning” and “moderately morning” types were grouped as “morning,” and “definitely evening” and “moderately evening” as “evening”, resulting in 3 groups. Habitual meal timing at home was also recorded.
On days 1, 7, and 14 (if still admitted) of hospitalization (Figure 2), or the day before discharge, patients underwent an evaluation of the course of their sleepiness/mood during the waking hours (Karolinska Sleepiness Scale and a mood 1-10 Visual Analogue Scale [VAS]; Akerstedt and Gillberg, 1990), which they were asked to complete hourly from wake up to sleep onset time.
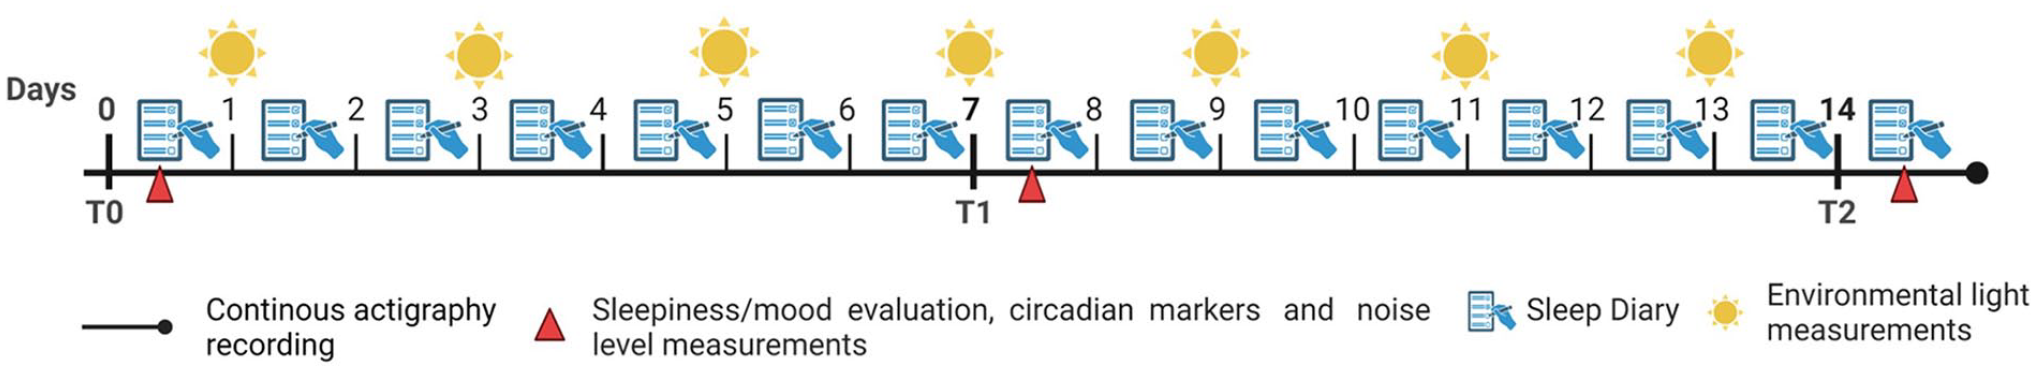
Study design, representing a hypothetical 14-day hospitalization stay. The icons on the horizontal line indicate the study procedures performed daily, or at the 3 main study times (T0: baseline, T1: day 7, T2: day 14; red triangles). Continuous actigraphy (black line) and daily sleep diaries (blue paper and pencil) were recorded over the whole inpatient stay. Environmental light was measured every 2 days (yellow sun); patient skin temperature, salivary melatonin samples, subjective sleepiness/mood, and room noise and temperature were collected at T0, T1, and T2 (red triangles).
At the end of hospitalization, patients’ overall perception of their hospital experience was assessed by a questionnaire for which an Italian, validated version is available (Bai et al., 2018), encompassing satisfaction in relation to information on admission, the medical and nursing staff, general organization, and the environment. On admission, standard of care patients were provided with standard information, which mostly covers visiting hours and doctors’ contact hours (for patients and carers). CircadianCare patients were provided with the above plus, because of the protocol, also with information and potential choices for light, meal, and activity timing (vide infra).
Sleep-Wake Profiles and Other Circadian Markers During the Inpatient Stay
For the whole length of hospitalization, patients were asked to complete a daily sleep diary (Figure 2) in the morning, immediately after waking up, to limit recall bias. Each diary page also included a VAS for the assessment of sleep quality during the previous night (range: 1 = worst to 10 = best; Lockley et al., 1999; Carney et al., 2012). Sleep onset time (as clock time) was then calculated as the sum of the time when the patient stated they tried to sleep plus their sleep latency; time spent in bed as the difference between bedtime and get up time (in hours); sleep duration as the difference between sleep onset and wake-up time (in hours). Night awakenings included both spontaneous arousals and sleep interruptions due to environmental factors, which could not be differentiated by the question asked with the diary tool utilized.
In addition, patients underwent continuous actigraphy by MotionWatch 8© (MW8, CamNtech, Cambridge; Figure 2), which is a wrist-worn axial accelerometer. The data (number of “counts” per 30-sec epochs) were extracted by the MotionWare software (CamNtech, Cambridge). Movements causing the acceleration signal to exceed the threshold of approximately 0.1 g were qualified as activity. Periods in which participants removed the actigraph were recorded by the daily sleep diaries and excluded from analyses. The following indices were obtained: total sleep time (i.e., total duration of all epochs qualified as sleep during time in bed), sleep onset latency (i.e., time to fall asleep), sleep efficiency (i.e., percentage of time spent sleeping out of the total time spent in bed), wake after sleep onset (time spent awake after sleep onset), and number of naps. In addition, intra-daily variability (indication of fragmentation of the sleep rhythm, ranging from 0 to 2, with higher scores indicating more fragmentation) and inter-daily stability (indicating the stability of the 24-h activity rhythm across days, ranging from 0 to 1, with higher scores indicating more stable rhythms; Luik et al., 2013) were obtained.
On days 1 (T0), 7 (T1), and 14 (T2, if still admitted) of hospitalization, the following samples/information were also acquired (Figure 2):
Salivary melatonin samples collected hourly on 5 occasions in the evening hours. The first sample was collected 3 h before the patient’s habitual sleep time (Voultsios et al., 1997; Benloucif et al., 2008). Information was also collected on medications potentially interfering with melatonin levels (Arendt, 2018). Melatonin was then determined using a radioimmunoassay (Melatonin RIA-5503 kit, DRG Instruments GmbH, Marburg) according to the manufacturer’s protocol (detection limit: 0.3 pg/mL). The dim light melatonin onset (DLMO) was computed based on a threshold calculated as the mean of baseline plus twice the SDs for each individual melatonin profile. Each participant’s DLMO was the point in time when the melatonin concentration exceeded the threshold (Lewy et al., 1980; Micic et al., 2015). When the threshold was not obviously computable, author DJS (blinded to any information relating to the patient and/or their treatment) visually identified the time of melatonin rise based on qualitative profile analysis (Benloucif et al., 2008; De Rui et al., 2015; Rzepka-Migut and Paprocka, 2020).
The 24-h recording of distal skin temperature (DST) and proximal skin temperature (PST) was performed using wireless sensors (iButtons, model no. DS1922L-F5, Maxim Integrated, San Jose, California; van Marken Lichtenbelt et al., 2006). Sampling rate was set at 3 min (resolution 0.0625 °C; approximately 500 temperature values per day). Four sensors were placed on the skin (right mid-thighs on the rectus femoris, right infraclavicular area, abdomen, and mid-metatarsal area of the plantar site of the right foot) using medical tape (Longato et al., 2017). Data were extracted using the iButton Viewer software (Dallas Semiconductor, Maxim Integrated Products, Sunnyvale, California). An artifact rejection procedure was applied to exclude outliers (Rutkove et al., 2007). Temperature measurements were aligned according to try-to-sleep time, as recorded in the sleep diaries, and averaged in 30-min bins. The data analysis window was set from 4 h prior to try-to-sleep time until 10 h after try-to-sleep time. Patients with missing values due to sensor loss or clinical procedures were excluded from the analysis. PST, DST, and the distal-proximal skin temperature gradient (DPG) were calculated as follows (Longato et al., 2017):
- TPST = 0.359 × Tmid-thigh + 0.262 × Tinfraclavicular site + 0.379 × Tabdomen
- TDST = 1.017 × Tfeet
- DPG = (TDST − TPST).
Environmental Factors
Type of room (single, double, or 4-bed) and bed position (qualified as near/far from the window, where near was less than 1 m and far was more than 3 m) were recorded on admission. On days 1, 7, and 14 (if still admitted) of hospitalization, or on the day before discharge, the following information was acquired (Figure 2):
The 24-h recording of the A-weighted sound pressure levels within the ward rooms (1 sample/sec). To carry out this measurement without interfering with the normal activities in the hospital room, a specific acquisition system was set up. A series of sound level meters with accuracy equivalent to Class II was arranged by equipping smartphones (Apple iPhone 6 Plus) with external condenser microphones (BSWA Technology Ltd., Type micW i436). The application used for acquiring recordings and saving data was OpenNoise, developed and distributed by the Regional Agency for the Protection of the Environment of Piemonte, Italy (Arpa Piemonte, n.d.). Measurement was calibrated in the reverberation room of the acoustic laboratory “LabAcus” of the Department of Industrial Engineering (University of Padua) using two methods: comparison with the measurements obtained from a Class I precision sound level meter (NTi XL2) with the method proposed by Kardous and Shaw (2016), and with the sound emission of a reference sound source (Brüel & Kjær, Type 4204) by a comparison method for determination of sound power of noise sources according to ISO 3741 standards (International Organization for Standardization, 2010). From these comparisons, it was possible to obtain the gain value to be applied to the microphone, to align the measurements with those of the precision sound level meter in reference conditions. Smartphones and microphones were placed on top of the headboard and powered externally to make their presence minimally invasive for patients and to minimize the need for operator interventions. The A-weighted equivalent continuous sound pressure level (LAeq) and the maximum A-weighted sound level (LAmax) were measured during the conventional 8-h night time period (vide infra). The time history of the LAeq was aggregated in 15-min intervals to fit the resolution of the actigraph used for patient rest/activity monitoring. The equivalent background noise level (LA95eq), evaluated every second by the noise level exceeded 95% of the time during the previous T/6 interval, where T is the measurement time, was estimated according to Alsina-Pagès et al. (2021). The intermittency ratio (IR) was computed as in Wunderli et al. (2016). The IR metric expresses the proportion of the acoustic energy contribution in the total energetic dose created by individual noise events above a certain threshold. Thus, it is a descriptor that can effectively integrate the LAeq, based on the concept of energetic dose over longer periods, to describe specific changes in environmental noise conditions that can cause awakening (World Health Organization. Regional Office for Europe [Bonn, Germany], 2009 – this should be marked as a reference, as in a few lines here below). Furthermore, the comparison between the IR and the LA95eq with the same sampling time provides a direct indication of the incidence of sound fluctuations in the variation of the overall sound level better than the maximum sound level at any given moment in time (LAmax). Finally, the LA95eq (dB(A)), IR (%), and the percent of awake epochs from the actigraphic data (every 15 min) were computed during the night. The conventional length of the night period was defined according to Italian law (D.M. 16 March 1998 and D. Lgs. n.66/2003) as the period between 2200 h and 0600 h; World Health Organization (WHO) Night Noise Guidelines for Europe were used as reference (World Health Organization. Regional Office for Europe, 2009).
Room illuminance was measured at each patient’s eye level as detailed in Bano et al. (2014) by a luxmeter (Konica Minolta T-10A, Marunouchi, Chiyoda, Tokyo, Japan). Measurements were taken 4 times per day (Slot 1: 07:00-10:30 h, Slot 2: 12:00-14:00 h, Slot 3: 14:30-17:00 h, and Slot 4: 17:30-21:00 h), with these relatively wide time slots being aimed at minimizing interference with standard hospital activity. At the same time slots, information was also recorded about headboard lights (on/off), position of the rolling shutters (open [0%], three-fourth open [25%], halfway [50%], one-fourth open [75%], and closed [100%]), and number of people in the room (patients, personnel, and/or visitors).
The 24-h recording of room temperature was monitored by an iButton (vide supra) taped on the wall close to the headboard of the patient’s bed.
Treatment Protocol
Patients in the CircadianCare arm followed 1 of 3 different schedules for light/dark, meal, and physical activity timing, based on their circadian preference (Figure 3).
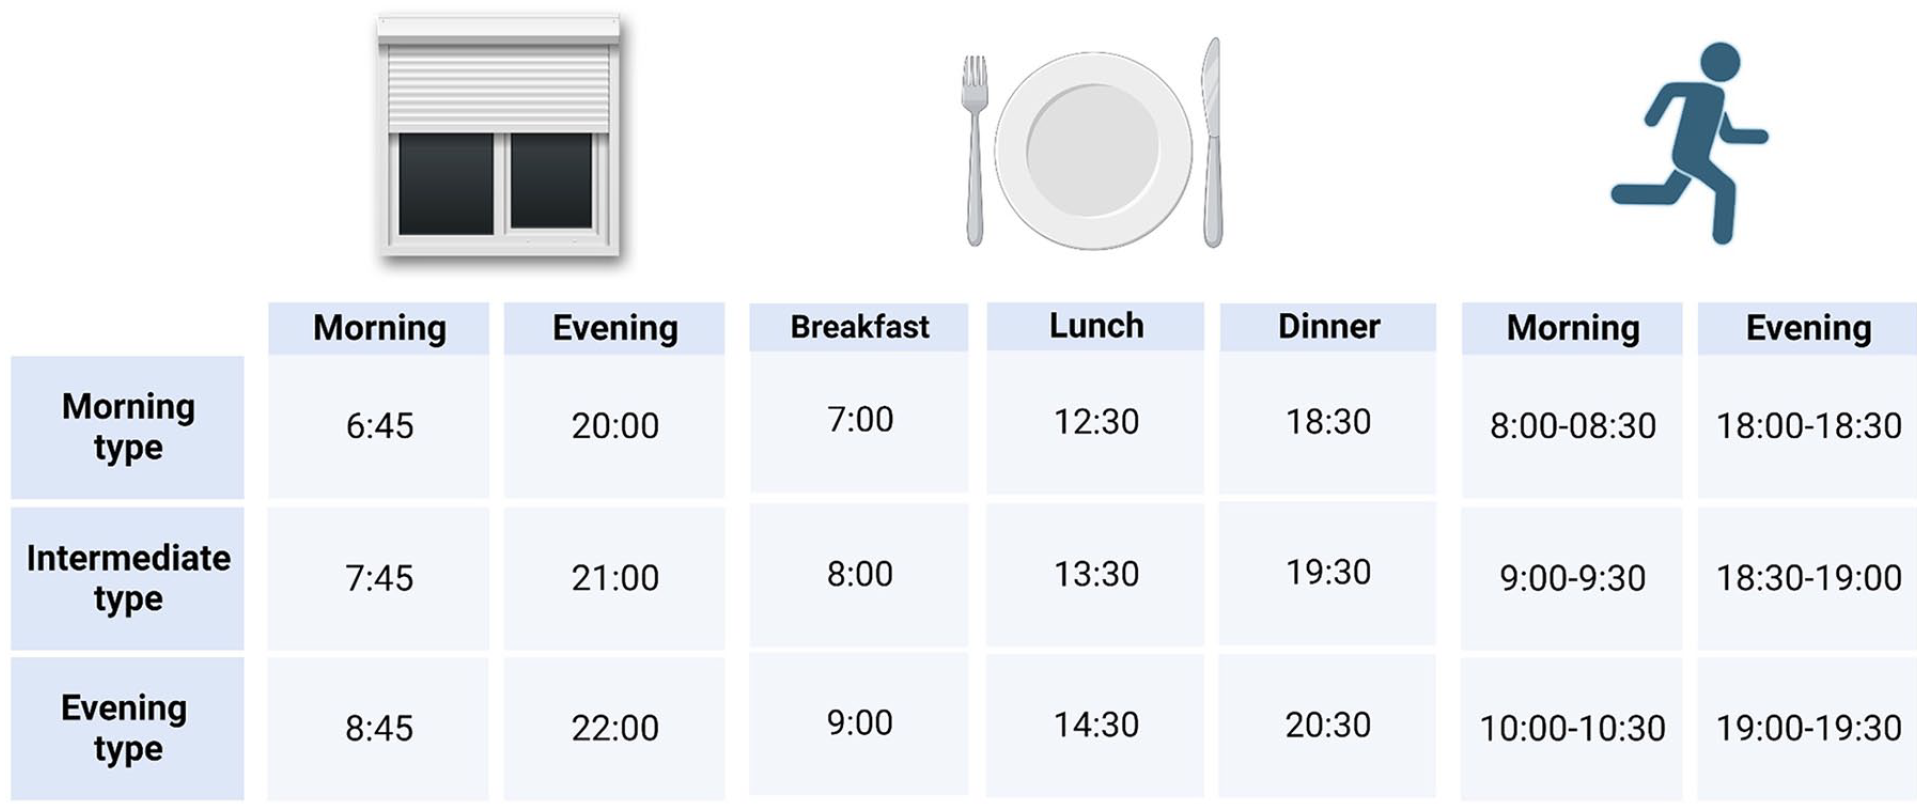
Rolling shutter opening/closing, meals, and physical activity timing (clock time or clock time range) in the CircadianCare arm, categorized by diurnal preference.
Light/Dark and Noise Hygiene
To provide as much natural daylight as possible over the daytime hours, rolling shutters were opened according to the patients’ habitual sleep-wake timing (Figure 3). Moreover, short-wavelength–enriched morning light was administered via Luminette light glasses (Lucimed, Villers-le-Bouillet, Belgium, 2000 lux; blue-enriched; Langevin et al., 2014). Patients were asked to wear the light glasses every morning, immediately after awakening, for 45 min (e.g., while having breakfast). These devices are equipped with 8 light-emitting diodes (LEDs) distributed on the upper part of the 2 lenses (4 on each side), outside the patient’s visual field. The LEDs reflect light toward the eye via a diffractive lens, thus focusing it toward the lower part of the retina, regardless of the position of the head; this also allows for uniform illumination and for avoidance of glare (Bragard and Coucke, 2013).
To limit night light exposure, rolling shutters were closed according to the patients’ habitual sleep-wake timing (Figure 3). Patients were also asked to wear a pair of short-wavelength light filter shades (MelaMedic, Viborg, Denmark) from 18:00 h until sleep onset time, plus at any time during the night if the room light was on. These shades filter light in the blue range of the spectrum (up to 530 nm), that is the one our eye and the circadian timing system are most sensitive to (Brainard et al., 2001; Thapan et al., 2001). Finally, each patient received a pair of earplugs, which they were free to wear if and as needed.
Meal Timing
Meal timing was chosen based on patients’ circadian preference (Figure 3); patients’ diet was prescribed individually by the physicians, and not modified for study purposes.
Physical Activity Timing
Patients were guaranteed the amount of regular, timed physical activity they were capable of, based on their condition. This consisted of: in-bed passive mobilization for the sickest, in-bed active mobilization (raise arm across midline, raise leg and extend knees, bend ankle and point toes), bed-to-armchair transition, sitting and standing from chair, aided or un-aided short walks inside the room, and so on. Physical activity timing was chosen between 3 options, again depending on pre-admission habits and preferences (Figure 3).
Statistical Analyses
Data are reported as mean ± standard error of the mean (or, where indicated, 95% confidence interval [CI]) for quantitative variables, and as count and percentage for categorical variables. The distribution of variables was tested for normality using the Shapiro-Wilk’s W test. Differences between groups were evaluated by the Student t/Mann-Whitney U, analysis of variance (ANOVA; post hoc Tukey test), or Pearson’s χ2, as appropriate. When considering different time points, variables were analyzed by repeated measures ANOVA (post hoc Tukey test). Correlation analysis was performed by Pearson’s r or Spearman’s rank R, as appropriate. Analyses were carried out by the package Statistica, version 13.1 (Dell, Round Rock, Texas). Overall information on missing data can be inferred from Figure 1; given the size of the study and the considerable attrition, missing data were treated as such, and imputation was not utilized (complete case analysis at each time point). Finally, also due to attrition and to significant observed variability in the registered outcomes (especially sleep timing and DLMO), these are not necessarily presented in the Results section with the exact, strict order in which they were listed as outcomes on trial registration.
Results
Demographics, Clinical, and Pre-admission Sleep-Wake Profiles
At baseline, treated (CircadianCare) and untreated (standard of care) patients were comparable in terms of demographics, diurnal preference, habitual sleep quality (except for number of night awakenings, which were higher in the untreated group: 1.5 ± 0.2 vs 2.4 ± 0.4, p = 0.047), habitual sleep and meal timing, length of hospitalization, room type, and bed position in relation to the window (Table 1). Furthermore, pre-admission treatment (also in relation to psychoactive, sleep-inducing, and medications that may affect melatonin profiles) was comparable in the two groups (Table 1). Considering diurnal preference in both groups, since there were only 2 “evening” patients in the untreated group and none in the treated one, comparisons were performed only between “morning” and “intermediate” patients. The number of working days per week was higher in “morning” compared to “intermediate” patients (3.2 ± 0.8, 95% CI [2.16, 4.20] vs 1.8 ± 0.9, 95% CI [−0.60, 2.54], F = 5.605, p = 0.023). Interestingly, the Charlson Comorbidity Index was lower (i.e., meaning less disease burden) in “morning” compared to “intermediate” patients in both groups (2.7 ± 0.4, 95% CI [2.09, 3.99] vs 4.4 ± 3.0, 95% CI [3.96, 6.79], F = 4.652, p = 0.037). Given the low numbers, this may either be a random series-specific observation or, as an alternative, may be in line with the notion that morning individuals tend to lead generally healthier lives and to have less difficulties aligning with the timing constraints imposed by the social clock in the industrialized society, and thus carry a generally lower disease risk burden (Allada and Bass, 2021). As expected, patients with a “morning” preference reported a significantly earlier breakfast time than “intermediate” patients (06:49 ± 00:17 h, 95% CI [06:15, 07:18] vs 07:58 ± 00:28 h, 95% CI [07:04, 08:27], F = 5.150, p = 0.029). In addition, “morning” patients habitually went to bed and tried to sleep earlier than “intermediate” patients (22:41 ± 00:14 h, 95% CI [22:20, 23:02] vs 23:24 ± 00:15 h, 95% CI [22:50, 23:49], F = 4.54, p = 0.039 and 23:02 ± 00:13 h, 95% CI [22:43, 23:19] vs 23:41 ± 00:13 h, 95% CI [23:13, 00:03], F = 5.73, p = 0.021, respectively). No other significant differences were observed.
Demographics, pre-admission sleep quality and habitual sleep, and meal timing, plus information on the inpatient environment in the CircadianCare and the standard of care arms.
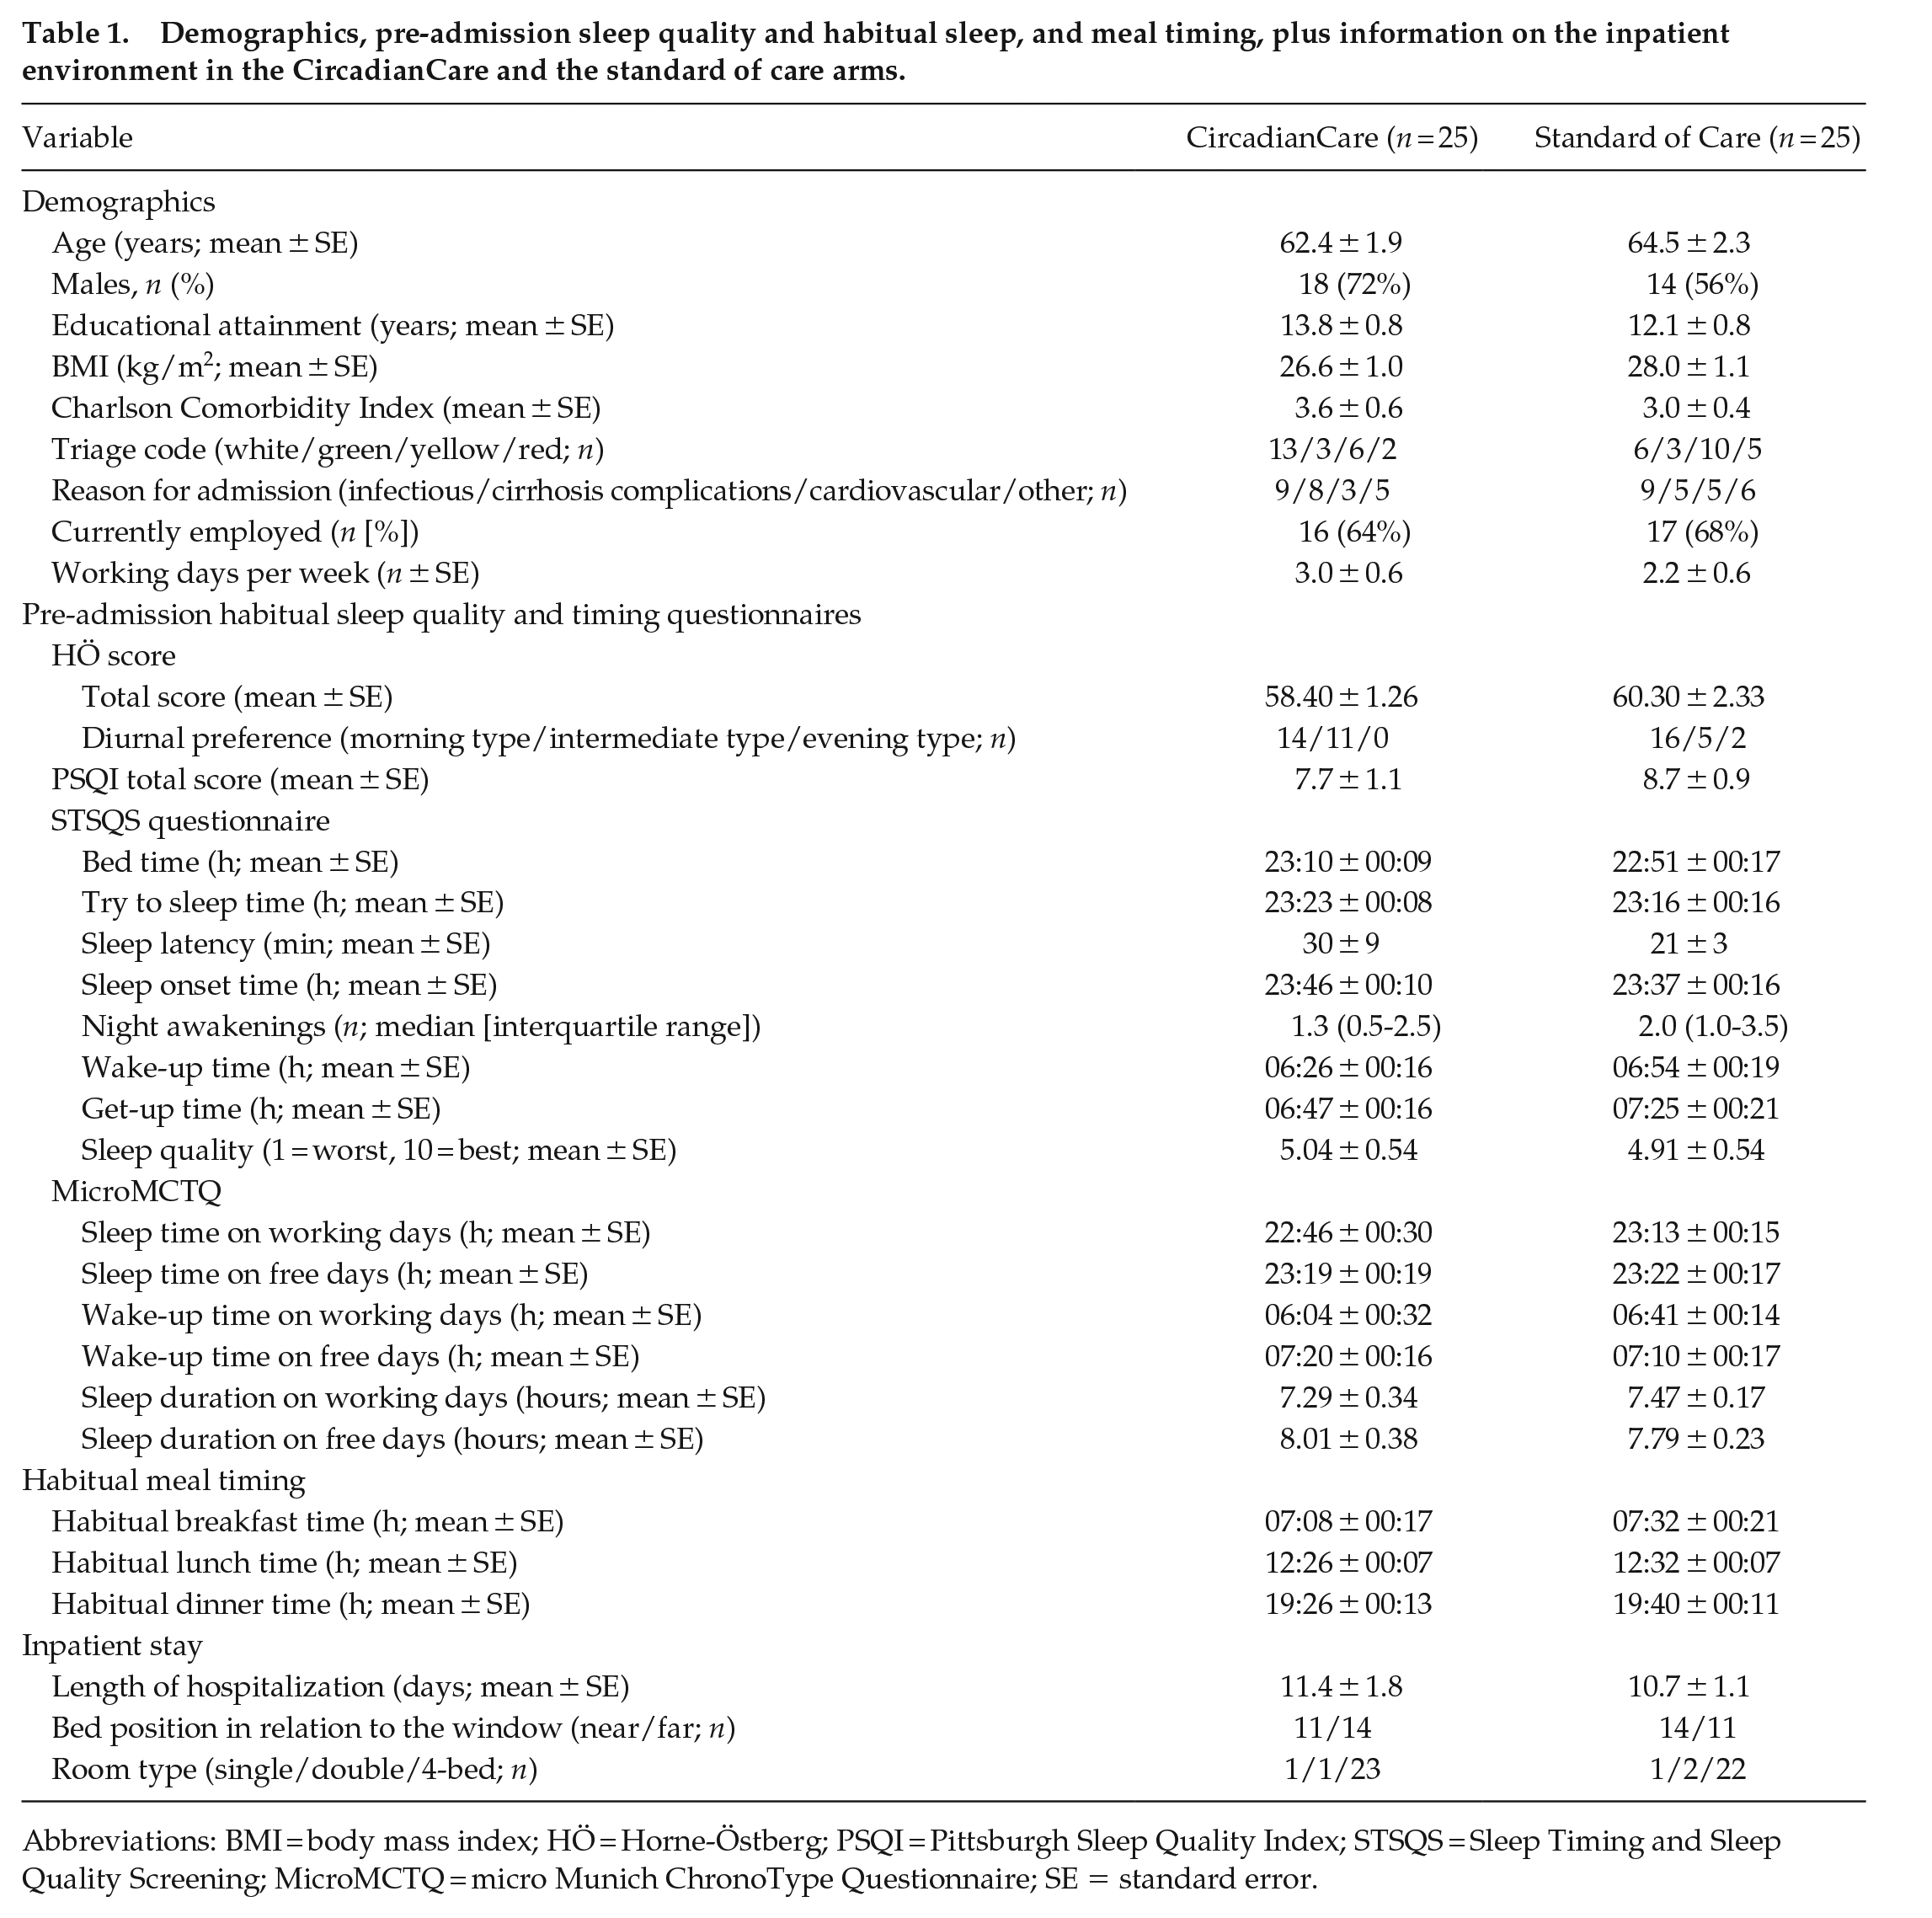
Abbreviations: BMI = body mass index; HÖ = Horne-Östberg; PSQI = Pittsburgh Sleep Quality Index; STSQS = Sleep Timing and Sleep Quality Screening; MicroMCTQ = micro Munich ChronoType Questionnaire; SE = standard error.
Inpatient Stay—Sleep Diaries and Actigraphy
Sleep diaries were available for 41 patients (19 treated and 22 untreated, respectively) at T0, for 35 patients (19 and 16) at T1, and for 11 patients (5 and 6) at T2. Actigraphic data were available for 43 patients (21 and 22) at T0, for 30 patients (15 and 15) at T1, and for 5 patients (2 and 3) at T2. There was a trend advance in bedtime for treated patients, whereas untreated patients showed a trend delay in bedtime between T0 and T1 (22:38 ± 00:21 h, 95% CI [21:54, 23:22] at T0, 22:02 ± 00:25 h, 95% CI [21:11, 22:54] at T1 in treated vs 22:17 ± 00:20 h, 95% CI [21:35, 22:59] at T0, 22:49 ± 00:24 h, 95% CI [22:00, 23:38] at T1 in untreated patients, F = 3.768, p = 0.062, trend; Figure 4, Panel a). This was confirmed when also considering T2 (data not shown), despite the marked reduction in patient numbers, and may express the expected, overall positive effect of the CircadianCare system on both wake and sleep (i.e., more active and earlier wake period, and thus earlier bedtime). The number of hours spent in bed significantly increased from T0 to T1 in the treated group (8.24 ± 0.44 h, 95% CI [7.32, 9.14] at T0 and 9.08 ± 0.45 h, 95% CI [8.16, 10.02] at T1) compared to the untreated group (8.65 ± 0.41 h, 95% CI [7.81, 9.49] at T0 and 7.70 ± 0.42 h, 95% CI [6.83, 8.58] at T1, F = 8.503, p = 0.007; Figure 4, Panel b). In addition, treated patients showed an increase in get up latency (i.e., the interval between wake-up and get-up time) compared to untreated patients (16 ± 14 min, 95% CI [−13, 45] at T0 and 58 ± 16 min, 95% CI [24, 91] at T1 in treated vs 47 ± 14 min, 95% CI [18, 75] at T0 and 38 ± 16 min, 95% CI [5, 70] at T1 in untreated patients, F = 4.526, p = 0.043). This latter finding may relate to an unintended effect of treatment, with some patients in the CircadianCare arm choosing (despite not being instructed to) to remain in bed while wearing the light glasses after waking up in the morning. The number of night awakenings was similar between the two groups at T1. When extending the analysis to T2, the number of night awakenings was greater in the untreated group (0.90 ± 0.46, 95% CI [−0.26, 2.25] in treated vs 2.43 ± 0.35, 95% CI [1.31, 3.27] in untreated patients, F = 7.217, p = 0.036). Given the baseline differences in this variable between the two groups, changes over time should be interpreted with caution.
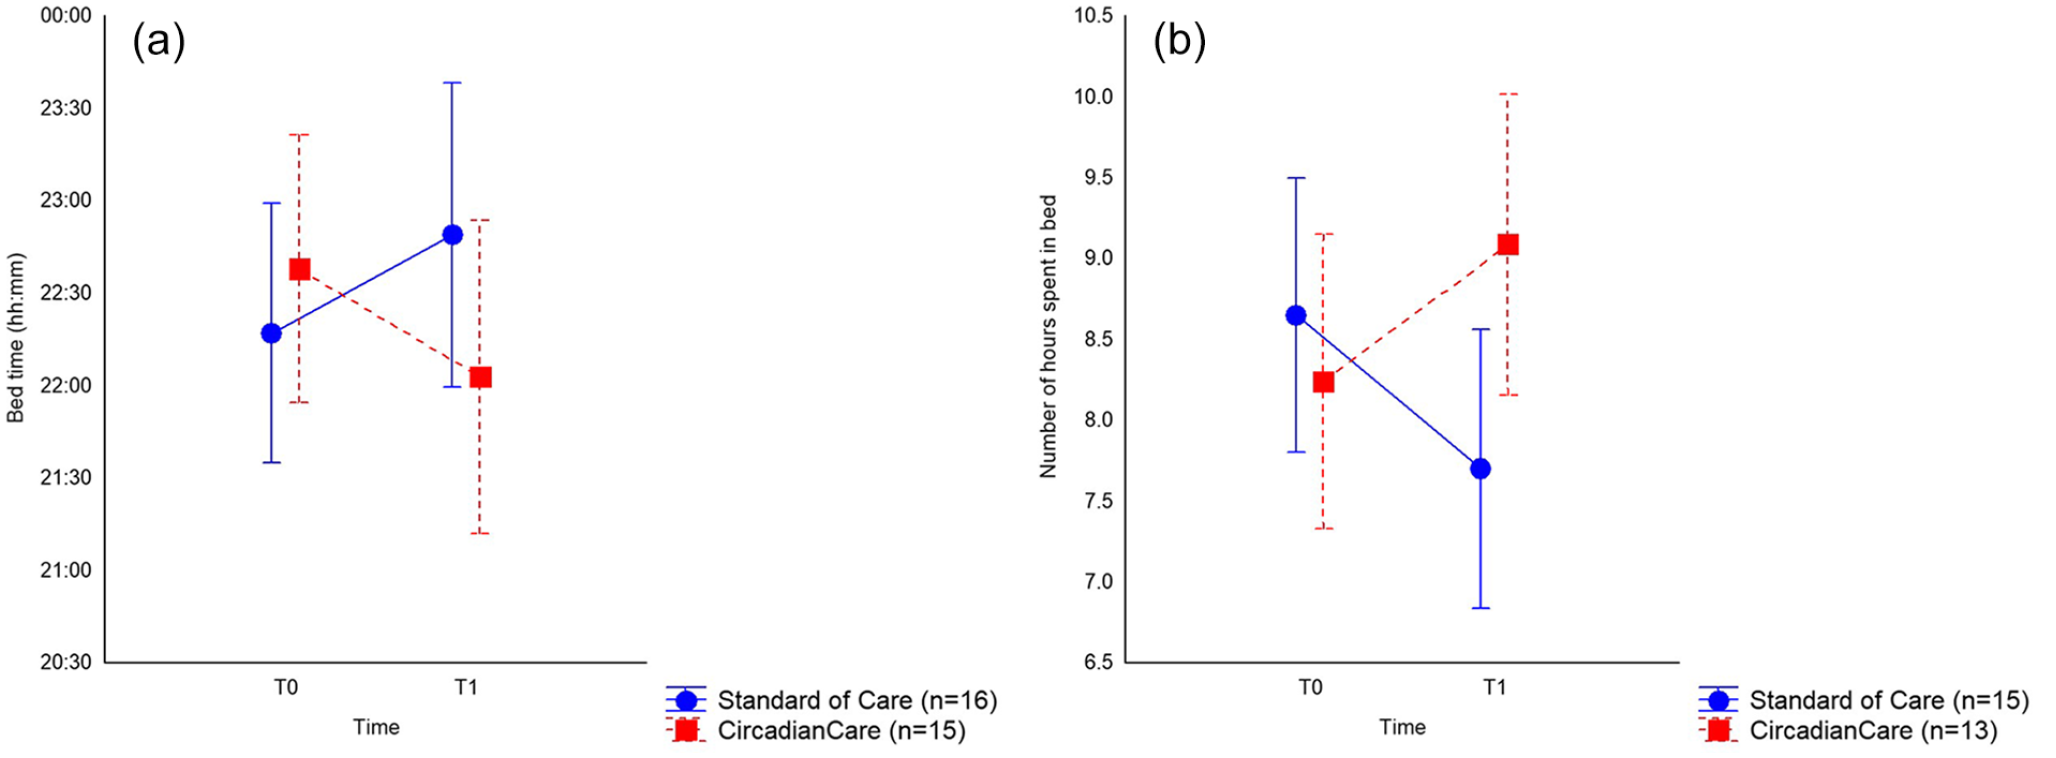
Sleep diary–based bedtime (mean and 95% CI) at T0 and T1 (day 7; Panel a; p = 0.062) and number of hours spent in bed (mean and 95% CI) at T0 and T1 (day 7; Panel b; p = 0.007) in the CircadianCare (red squares) and standard of care (blue circles) arms. Abbreviation: CI = confidence interval.
The comparison between treated and untreated patients was also performed according to diurnal preference. Considering untreated patients, wake-up time was earlier in “morning” compared to “intermediate” patients (05:44 ± 00:14 h, 95% CI [05:19, 07:13] vs 07:13 ± 00:25 h, 95% CI [06:21, 08:04], F = 7.800, p = 0.010); these data were comparable between T0 and T1. Sleep diaries documented a decrease in the number of night awakenings from T0 to T1 for “morning” patients in the treated group (3.4 ± 0.7, 95% CI [1.85, 4.97] vs 2.2 ± 0.8, 95% CI [0.40, 3.93]) and for “intermediate” patients in the untreated group (3.7 ± 0.9, 95% CI [1.84, 5.66] vs 1.6 ± 1.0, 95% CI [−0.54, 3.79]), with a significant interaction between time, treatment, and diurnal preference (F = 11.007, p = 0.004). No significant differences between the two groups were detected in other sleep diary variables.
By contrast to sleep diaries, the comparison of actigraphic recordings at T0, T1, and T2 did not show significant differences between treated and untreated patients. This may suggest a decreased reliability of actigraphy within the hospital setting, which is by definition characterized by an overall activity reduction and by bed rest also during the waking hours. Within this context, patient-provided subjective measures may be more reliable than recorded activity, especially when studying/measuring the transitions between sleep and wake states. When limiting the analysis to T0 and T1, the number of daytime naps decreased after 1 week of inpatient stay in both study arms (1.5 ± 0.3, 95% CI [0.89, 2.17] at T0 and 0.8 ± 0.3, 95% CI [0.27, 1.41] at T1), with a significant effect of time (F = 6.211, p = 0.019). Similarly, the time spent awake after sleep onset also decreased after 1 week in both study arms (1.60 ± 0.15, 95% CI [1.29, 1.91] at T0 and 1.23 ± 0.13, 95% CI [0.96, 1.51] at T1), with a significant effect of time (F = 4.982, p = 0.033). These findings may relate to improved general patients’ condition toward the first/second week of hospitalization. When diurnal preference was considered, the overall number and duration of daytime naps were lower in “morning” compared to “intermediate” patients (number: 0.7 ± 0.3, 95% CI [0.57, 1.39] vs 2.1 ± 0.4, 95% CI [1.18, 2.93], F = 6.219, p = 0.020; duration: 16 ± 8 min, 95% CI [−1.82, 33.01] vs 52 ± 11 min, 95% CI [29.62, 75.38], F = 6.985, p = 0.014). In addition, actigraphic data showed a delay in wake-up time for “intermediate” patients in the untreated group from T0 to T1 (05:31 ± 00:31 h, 95% CI [04:26, 06:36] vs 06:59 ± 00:33 h, 95% CI [05:50, 07:06], F = 6.569, p = 0.017; Figure 5, Panel a). This was not evident in the treated group. Along the same lines, there was a delay in mid-sleep for “intermediate” patients in the untreated group from T0 to T1 (02:20 ± 00:28 h, 95% CI [01:21, 03:18] vs 03:37 ± 00:29 h, 95% CI [02:37, 04:37]), with a significant interaction between time and diurnal preference (F = 8.276, p = 0.008; Figure 5, Panel c).
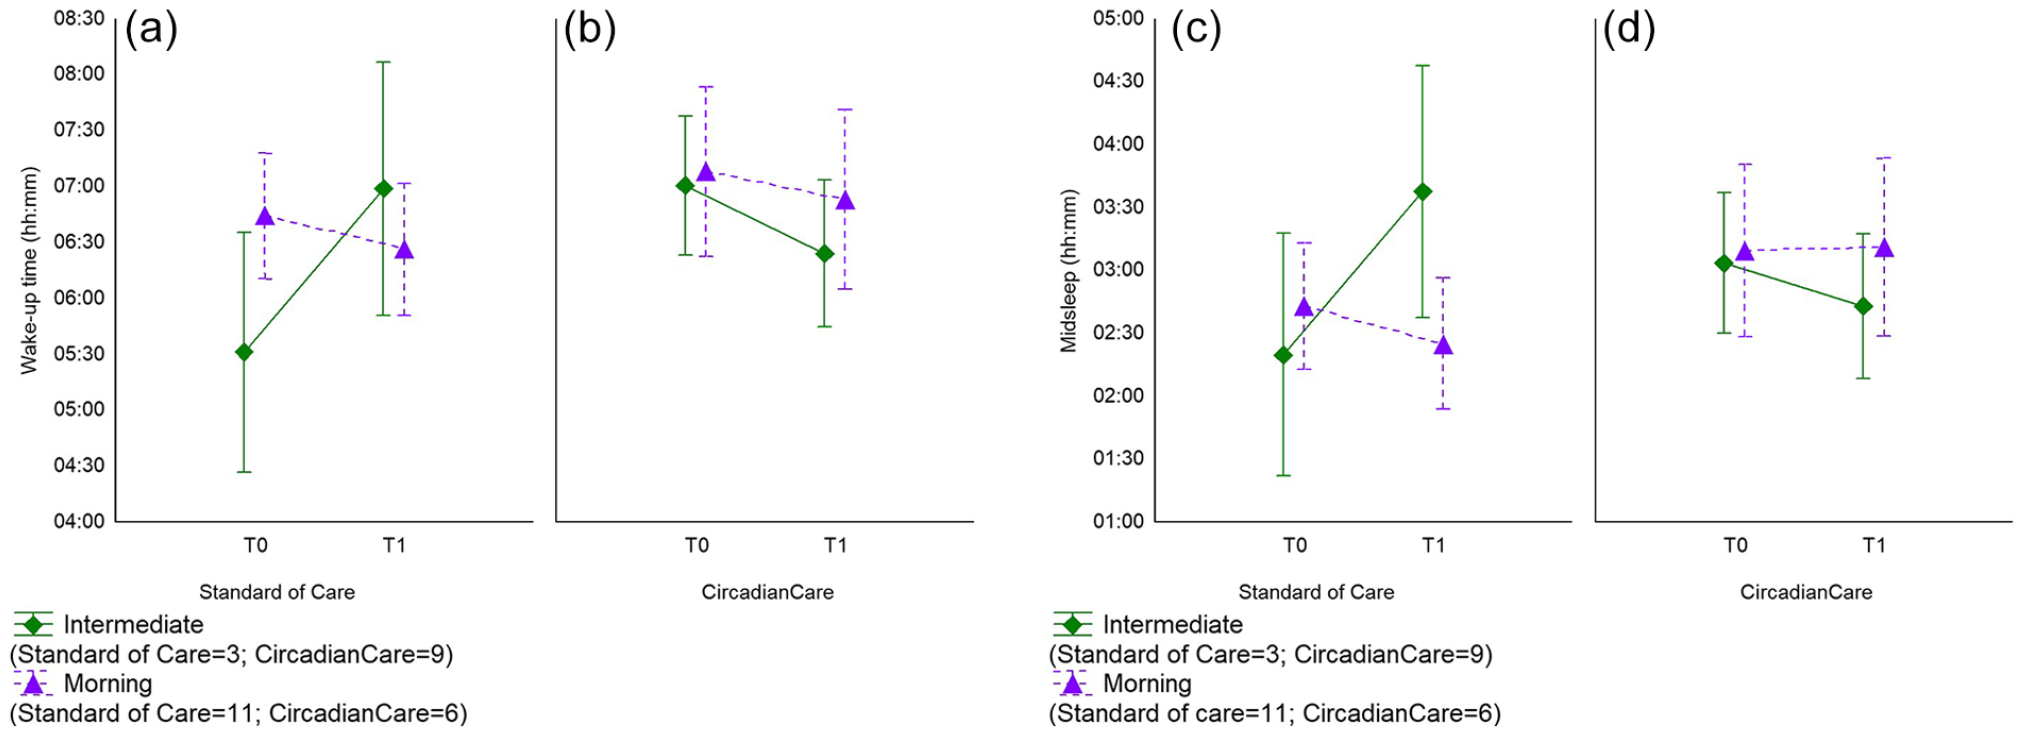
Actigraphy-based wake-up time (mean and 95% CI; Panels a and b; p = 0.017 for intermediate types) and mid-sleep (mean and 95% CI; Panels c and d; p = 0.008 for intermediate types) in standard of care (Panels a and c) and CircadianCare (Panels b and d) arms in morning (purple triangles) and intermediate types (green diamonds) at T0 and T1 (day 7). Abbreviation: CI = confidence interval.
Inpatient Stay—Salivary Melatonin Samples
Baseline salivary melatonin was collected in 34 patients at T0, in 15 patients at T1, and in 2 patients at T2. The DLMO was calculable in 17 patients (8 treated and 9 untreated) at T0, 9 patients (5 treated and 4 untreated) at T1, and 2 patients (both treated) at T2. While measuring the dim light melatonin offset (DLMOff) rather than DLMO at night is unusual, it was deemed necessary in 5 patients (4 treated and 1 untreated) at T0 and 2 patients (1 treated and 1 untreated) at T1, due to the melatonin profile showing a clear and steady decrease in melatonin levels. This may have been the result of light/dark conditions and/or hospital or disease-dictated sleep-wake habits during the inpatient stay. At T0, the treated group had a later DLMO (22:04 ± 00:22, 95% CI [21:10, 22:57]) than the untreated group (20:43 ± 00:27, 95% CI [19:39, 21:47], F = 1.71, p < 0.05). Between T0 and T1, there was an advance in DLMO in treated patients (at T0 22:50 ± 00:18 h, 95% CI [21:42, 23:54]; at T1: 21:48 ± 00:25 h, 95% CI [21:12, 22:24], p < 0.05), which may partly relate to the untreated ones having less room for advancement due to the differences at baseline. An example of a patient in the CircadianCare arm whose DLMO was available and calculable at all 3 time points, with gradual phase advance over the inpatient stay, is presented in Suppl. Fig. S1. There were no significant differences in sleep parameters (diaries or actigraphy) between patients grouped by calculable DLMO, calculable DLMOff, and non-calculable DLMO/DLMOff at T0 or T1, suggesting that confounders rather than more specific sleep-wake and/or circadian pathophysiological pathways may contribute to melatonin profile rhythmicity and/or its timing in this population of acute medical inpatients.
Inpatient Stay—Skin Temperature
At T0, PST was available for 39 patients (23 treated and 16 untreated), whereas DST and DPG were available for 35 patients (22 treated and 13 untreated), with no differences between the two treatment arms (Figure 6, Panels a1-a3). As expected, temperature varied significantly over the 24 h for all 3 variables (PST: F = 6.56, p < 0.001; DST: F = 7.38, p < 0.001; DPG: F = 3.10, p < 0.001; Figure 6, Panels a1-a3). At T1, PST was available for 17 patients (8 treated and 9 untreated), whereas DST and DPG were available for 15 patients (8 treated and 7 untreated; Figure 6, Panels b1-b3). At T1, no significant difference was observed between the two treatment arms in any of the 3 temperature indices (Figure 6, Panels b1-b3). Qualitative, visual analysis, however, showed that the oscillation in DST amplitude was greater in treated compared to untreated patients (Figure 6, Panel b2), again, possibly suggesting rhythm strengthening in the treatment arm over time. Moreover, at T1, temperature varied significantly over the 24 h in terms of DST and DPG (DST time: F = 4.82, p < 0.001; DPG, time: F = 4.91, p < 0.001; Figure 6, Panels b2 and b3), but not in PST, where the oscillation amplitude diminished at T1 compared to baseline in both treated and untreated patients (Figure 6, Panel b1). This may relate to PST being more affected by bed rest or bedcovers, and/or to the contribution to the case series of inpatients with cirrhosis (2 untreated and 1 treated with available data), whom we have previously shown to have increased PST and decreased DPG (Garrido et al., 2017).
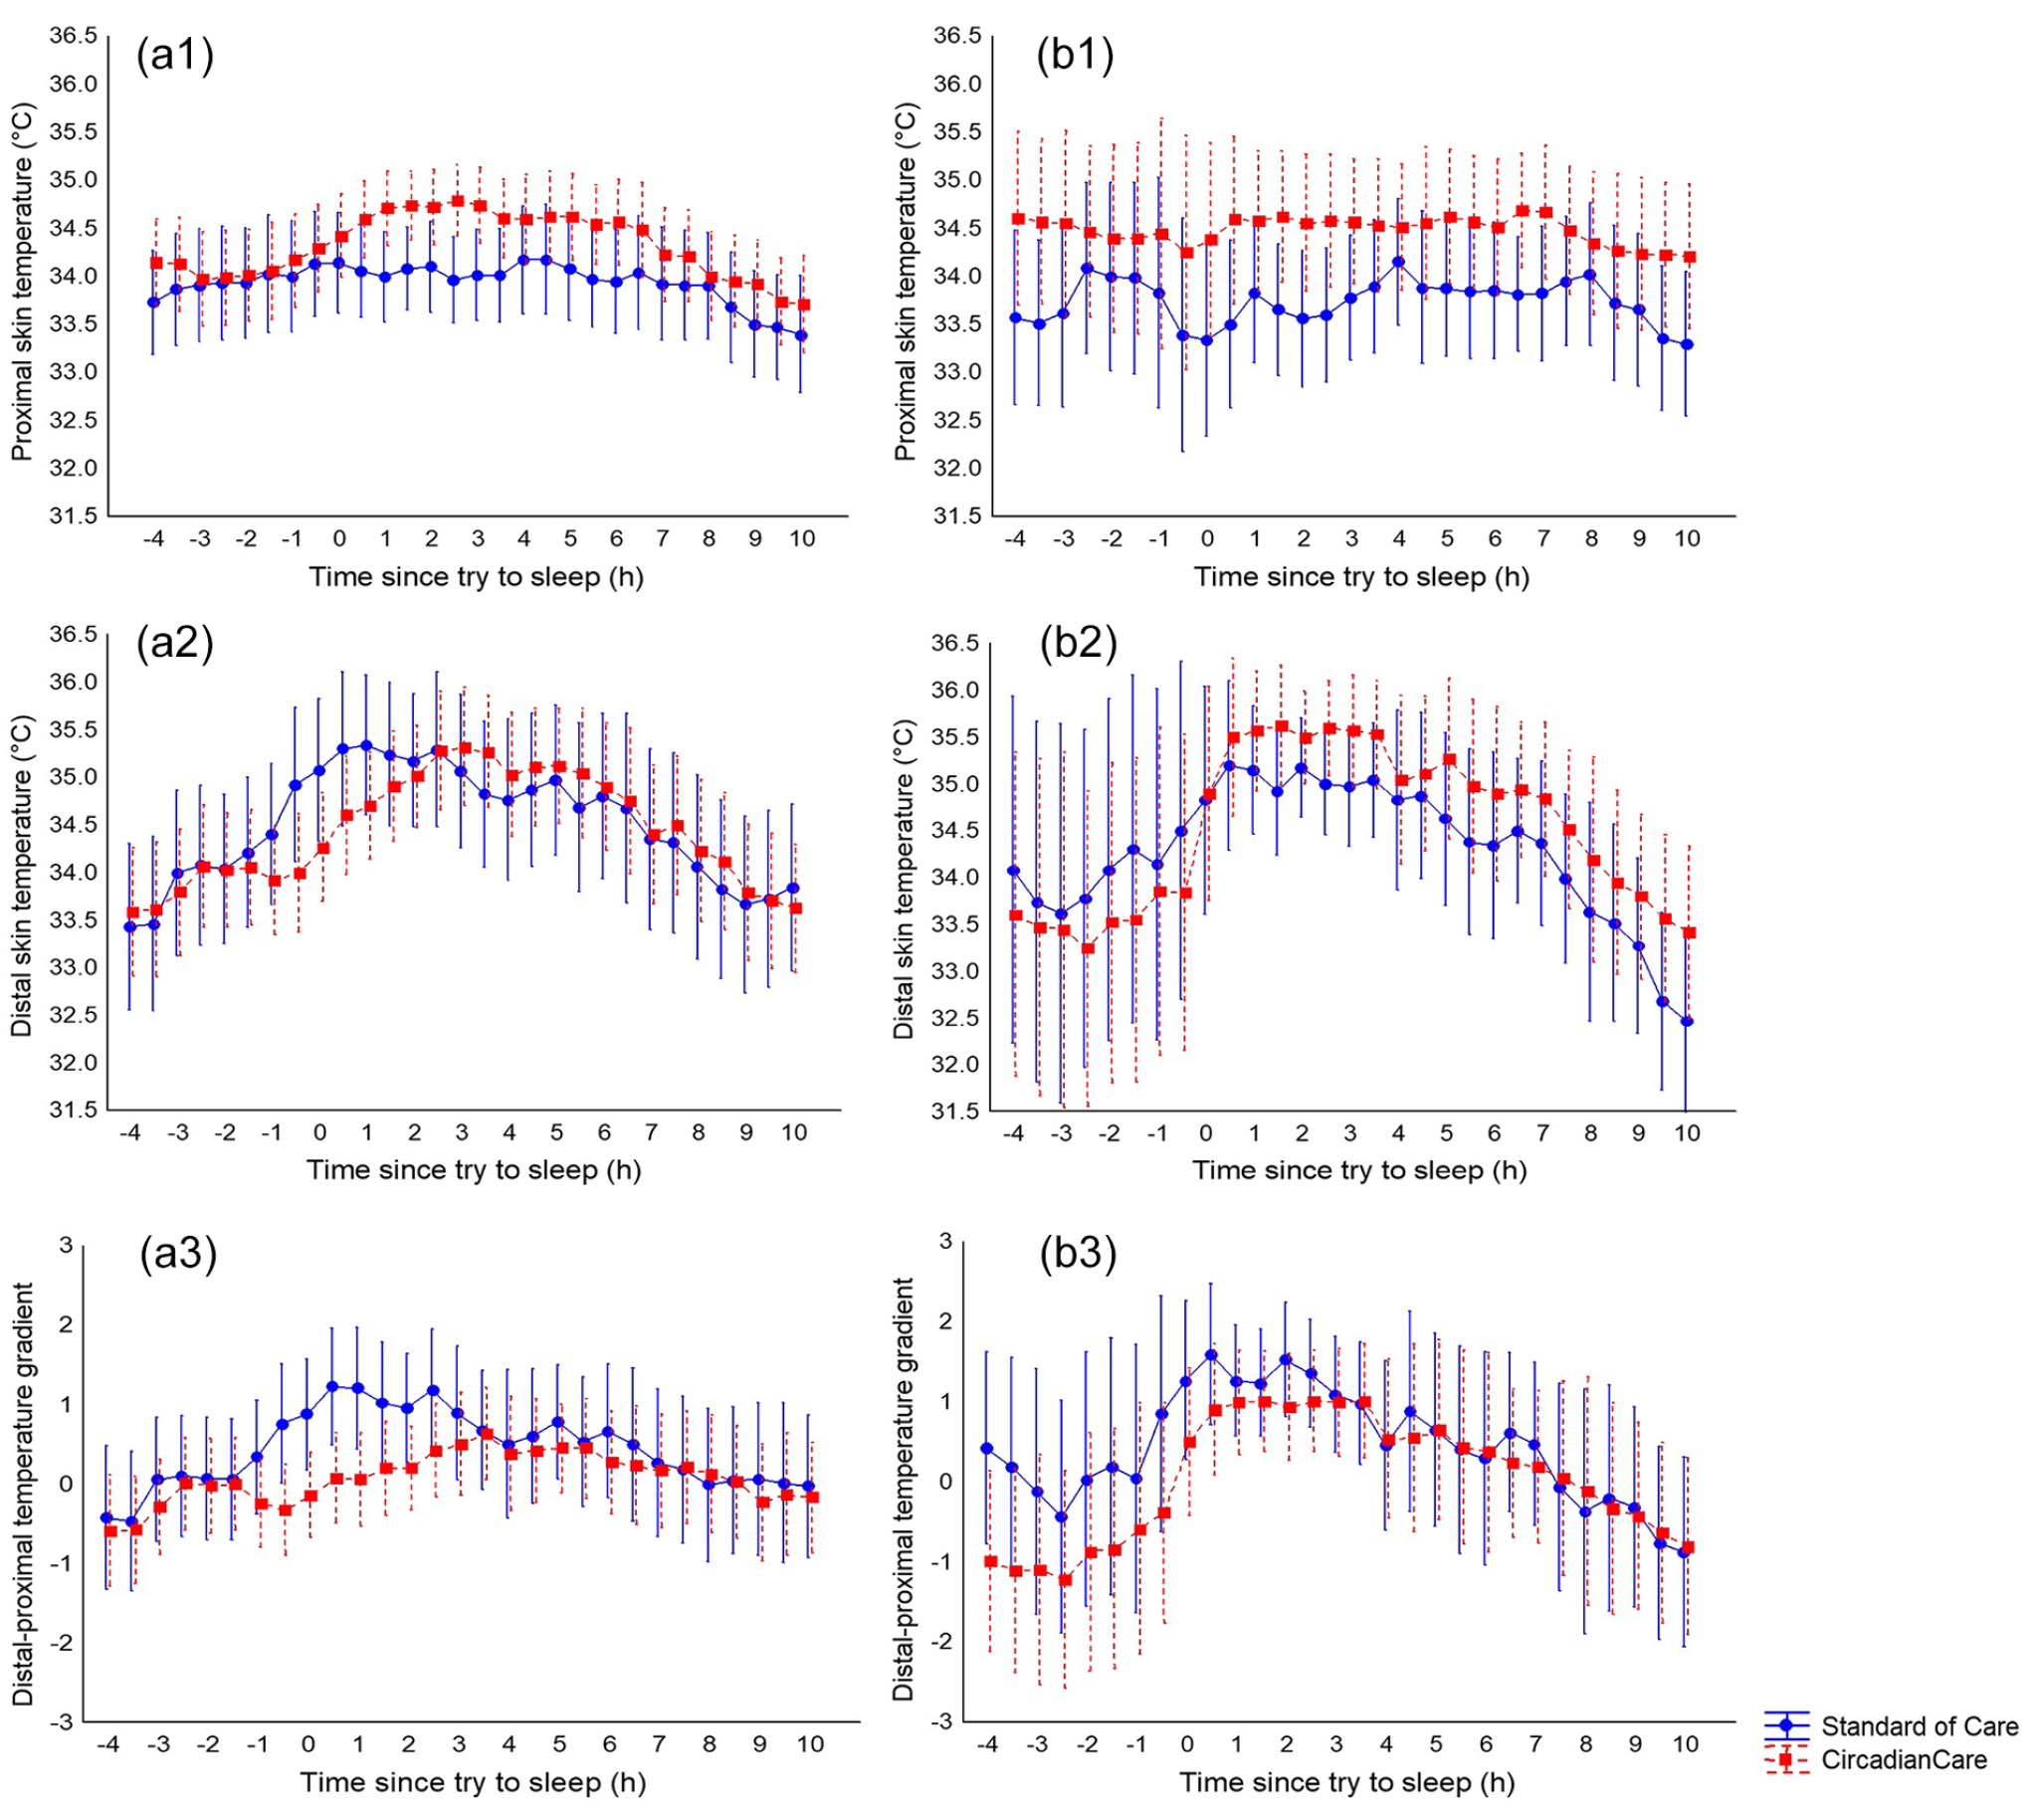
Proximal skin temperature (mean and 95% CI; Panels a1 and b1), distal skin temperature (Panels a2 and b2), and distal-proximal skin temperature gradient (Panels a3 and b3) at T0 (Panels a1-a3) and T1 (day 7; Panels b1-b3), aligned according to try-to-sleep time in the CircadianCare (red squares) and standard of care (blue circles) arms. No significant differences were observed in relation to treatment. However, on visual analysis, proximal skin temperature seemed to flatten over the inpatient stay in both arms (a1 and b1) and the distal skin temperature oscillation seemed greater in treated compared to untreated patients (a2 and b2). Abbreviation: CI = confidence interval.
Inpatient Stay—Medication
During the inpatient stay, 11 untreated and 9 treated patients took pro re nata sleep–inducing medication; 19 untreated and 16 treated, respectively, took drugs that might have affected melatonin profiles, with no significant difference between the two treatment arms. Moreover, no significant difference between the absolute or relative number of days on pro re nata sleep–inducing medication during the inpatient stay was observed between the two treatment arms.
Inpatient Stay—Satisfaction With Hospitalization
Patients in the treatment arm were more satisfied than untreated patients in relation to the quality of the information received on admission about the ward organization (χ2 = 6.74, p = 0.034). It is possible that receiving a small amount of additional information (plus having a choice) on light, meal, and activity timing in an environment as stressful, disorienting, and restrictive as an acute medical ward may contribute to decrease hospitalization-related discomfort and improve the quality of the inpatient stay.
Inpatient Stay—Illuminance
Illuminance levels differed significantly during the day (Table 2). Moreover, illuminance levels differed between patients sleeping near or far from the window in the first 2 time slots, with a significant interaction between time and bed position (Table 2). When grouping patients by date of admission (i.e., during daylight saving time or standard time), these data were only confirmed in the group admitted during Daylight Saving Time (Slot 1: 623 ± 74 lux, 95% CI [471, 776] vs 261 ± 69 lux, 95% CI [117, 403]; Slot 2: 679 ± 96 lux, 95% CI [483, 874] vs 334 ± 90 lux, 95% CI [151, 518], respectively, F = 12.72, p = 0.001). Rolling shutters (average position per time slot) were halfway down for most of the day (Table 2). Moreover, the position of the rolling shutters correlated with light levels in the afternoon and evening slots (Slot 3: r = −0.48, p < 0.001; Slot 4: r = −0.37, p = 0.011). This trend was maintained in the patients who slept far from the window (Slot 3: r = −0.58, p < 0.01; Slot 4: r = −0.42, p = 0.047) but only in the afternoon in the patients who slept near the window (Slot 3: r = −0.44, p = 0.033). The total number of people in the room was the highest in Slot 4 (range: 1-10 people) and the lowest in Slots 2 and 3 (range: 1-5 people). Patients sleeping near the window had significantly higher sleep efficiency (defined as the percentage of time spent asleep while in bed, recorded by actigraphy) during their hospitalization compared to those sleeping far from the window (83 ± 1, 95% CI [80, 86] vs 78 ± 2, 95% CI [74, 82], p = 0.042). No significant relationships were observed between subjective sleep quality, length of hospitalization, or bed position.
Room illuminance by time of day (divided into 4 time slots), bed position in relation to the window, and position of the rolling shutters.
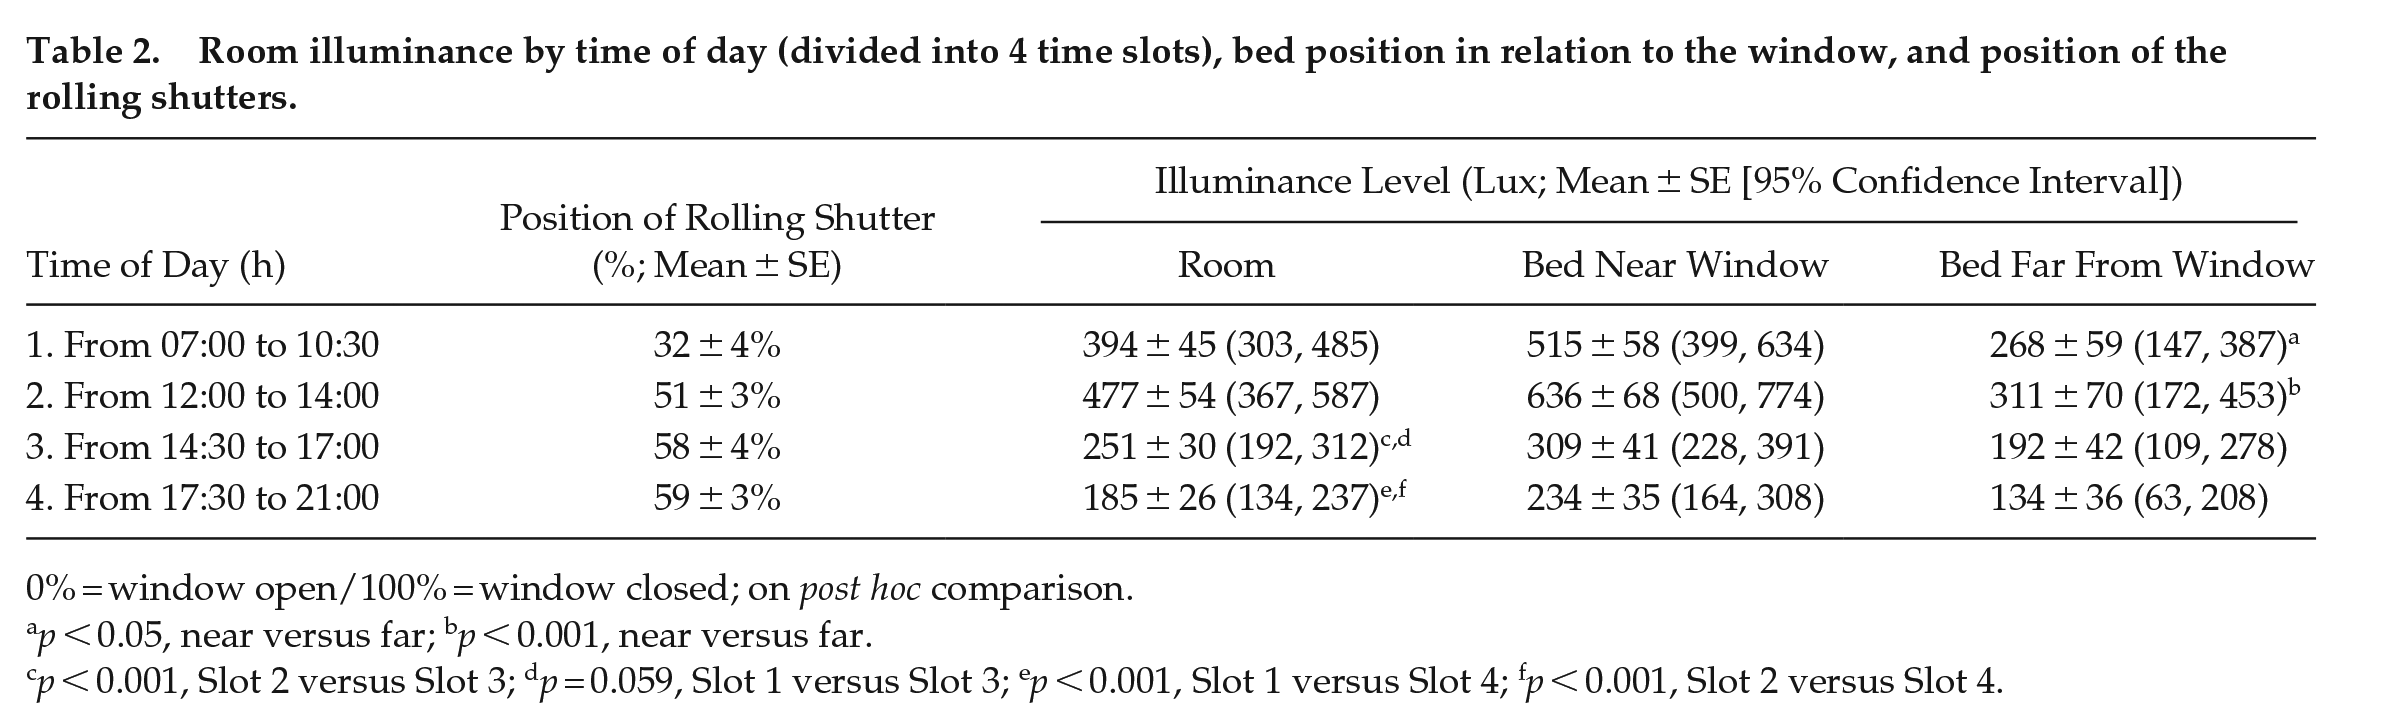
0% = window open/100% = window closed; on post hoc comparison.
p < 0.05, near versus far; bp < 0.001, near versus far.
p < 0.001, Slot 2 versus Slot 3; dp = 0.059, Slot 1 versus Slot 3; ep < 0.001, Slot 1 versus Slot 4; fp < 0.001, Slot 2 versus Slot 4.
Inpatient Stay—Night Noise Levels
The noise levels recorded during the night at T0 were constantly higher than the WHO recommended value of 30 dB(A) for 8 h LAeq in care units (average night time ambient noise LAeq: 50.0 ± 0.5 dB(A), average LA95eq: 39.6 ± 0.5 dB(A), average LAmax: 80.5 ± 0.5 dB(A), and average IR: 53.1%). No significant differences were observed in patients who slept far from or near the window (and thus nearer or further from the corridor, respectively). Noise levels and activity (measured by actigraphy) were compared in 28 (12 treated and 16 untreated) patients at T0 (before the commencement of any treatment) and visual analysis of 9 patients (3 whose bed was close to the window) showed peaks of IR that were associated with awakenings of the patient or preceded them (Figure 7, Panel a and Suppl. Fig. S2). Although fluctuating ambient noise alone was not the dominant cause for the awakenings, a substantial change in the IR over a relatively short 15-min interval represented a clear change in room conditions relative to noise.
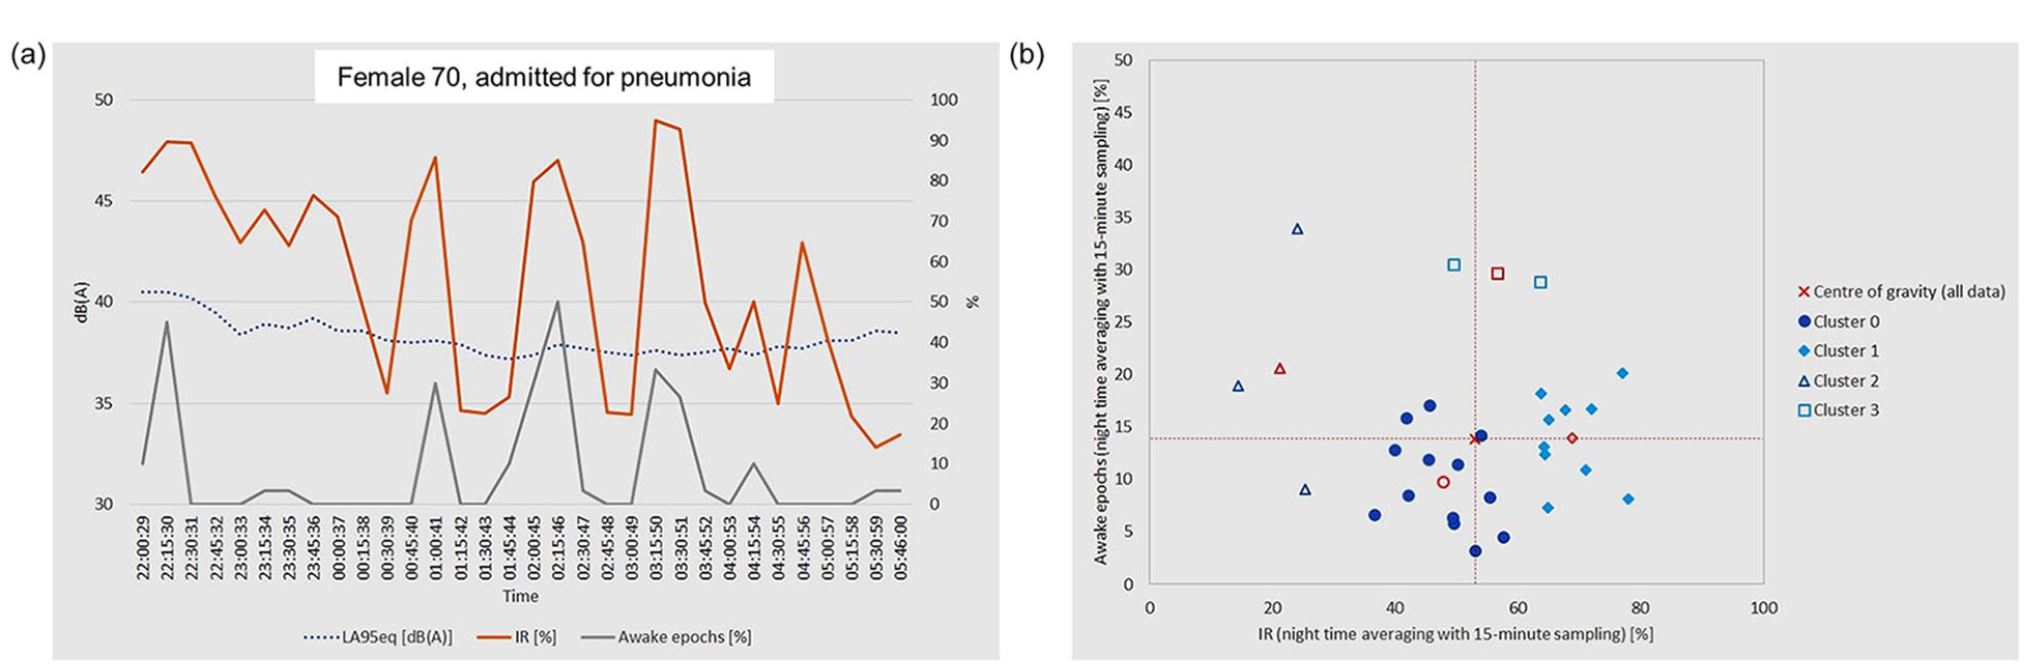
(a) Activity and noise levels in one example patient showing a clear relationship between increases in percent of awake epochs as recorded by actigraphy (gray line) and increased intermittent noise (intermittency ratio; orange line) during the first night of hospitalization. The LA95eq is shown as a blue dotted line. (b) Cluster analysis of the relationship between percent of awake epochs and noise intermittency ratio; the center of each cluster is marked in red. For the two most numerous clusters (0 and 1), a consistent and significant relationship can be observed (R = 0.866) between ambient noise fluctuation and percent of awake epochs.
The comparison between the average of the IR (%) and the awake epochs over the conventional 8-h night led to the definition of 4 clusters of patients (Figure 7, Panel b). Two relatively large groups of patients had a similar number of awakening periods (typically between 5% and 20%) despite two distinct ranges of noise fluctuation (Cluster 0 with IR: 40%-60% and Cluster 1 with IR: 60%-80%). For these two clusters, as the noise intermittence increased, so did the number of awakenings. Two smaller patient groups had different behavior: one (Cluster 2) had an awakening period of more than 20% despite favorable noise conditions (IR <30%); the other (Cluster 3) exhibited a very high number of awakenings even in average conditions of intermittent noise. Of interest, while the results did not reach statistical significance, patients in Clusters 2 and 3 exhibited a tendency toward higher Charlson Comorbidity Index (4.2 ± 0.8, 95% CI [2.3, 6.1] in Clusters 2 and 3 vs 2.9 ± 2.2, 95% CI [2.0, 3.8] in Clusters 0 and 1) and higher pre-admission PSQI scores (10.8 ± 5.1, 95% CI [5.8, 15.8] in Clusters 2 and 3 vs 8.1 ± 5.4, 95% CI [5.6, 10.1] in Clusters 0 and 1), suggesting that their awakenings might have been associated with their clinical condition and/or their chronic sleep disturbance rather than environmental conditions.
Unintended Effects
No unintended effects were reported and treatment was well tolerated.
Discussion
In this pilot study, we tested a novel inpatient management system (CircadianCare) aimed at limiting the negative impact of hospitalization on sleep by enhancing circadian rhythmicity through personalized light/dark, meal, and physical activity timing schedules. While the primary registered outcome (reduced sleep onset latency on actigraphy or diary) was not met, the CircadianCare system resulted in a trend advance in bedtime and, albeit only in the few patients in whom the variable was repeatedly calculable, a significant advance in DLMO time. Patients sleeping near the window showed significantly higher sleep efficiency, regardless of treatment. As noise fluctuation increased, so did the number of night awakenings, also regardless of treatment. Finally, having a “morning” diurnal preference was associated with better sleep quality during hospitalization, most likely because morning types find it easier to adapt to hospital activity schedules, which tend to start early.
Actigraphic recordings did not document any significant differences between treated and untreated patients. However, the number of daytime naps decreased after 1 week of inpatient stay in both study arms, and so did the time spent awake after sleep onset. The latter are more likely to relate to the course of disease during hospitalization rather than to our intervention, or lack thereof. The fact that actigraphy and sleep diaries did not produce overlapping results is most likely due to the fact that these two tools may have a different relationship in hospitalized patients, who are also bedridden at times, compared to that known for healthy individuals in their home environment (Lockley et al., 1999; Lehrer et al., 2022). It is somewhat intuitive, albeit not well demonstrated, that an activity-based sleep-wake index may be less than ideal within a context which is by definition characterized by an overall reduction in activity.
The lack of significant differences in sleep timing and sleep quality indices (sleep diaries or actigraphy) between patients grouped by DLMO onset, DLMO offset, and non-calculable DLMO, at T0 or T1, may be in relation to the complexity of the condition of the patients, the limited number of DLMO available, and the fact that the timing of melatonin production is obviously not the sole determinant of sleep timing/quality (Lavie, 1997; De Rui et al., 2015; Blume et al., 2022), especially in a complex and unusual situation such as hospitalization. The lack of a relationship between melatonin profiles and subjective or objective sleep-wake variables may also suggest that confounders such as medication or illness per se may play a relevant role on melatonin profile shape and DLMO/DLMOff computability/timing in clinical populations.
Furthermore, after 1 week of treatment, patients in the CircadianCare arm increased the number of hours spent in bed and the get up latency (time spent in bed after waking up) compared to standard of care patients, possibly because the majority of treated patients chose to stay in bed while wearing the light glasses after awakening, even though this was not prescribed. While this is not necessarily an unwelcome interpretation of the instructions provided, these may be modified as appropriate in future, similar studies.
Treated patients reported a higher satisfaction regarding the information received on the ward organization, which suggests that provision of such information in a detailed and possibly personalized fashion may be a simple and cheap tool to contain hospitalization-related discomfort.
The strong effect of diurnal preference on sleep-wake timing/quality was confirmed, even in our hospital setting. For example, patients in the standard of care group with a “morning” diurnal preference woke up earlier than patients with an “intermediate” diurnal preference, and this held true for the entire hospitalization. The effect of diurnal preference was also evident when examining actigraphic results (delay in wake-up time exhibited by “intermediate” patients in the untreated group). It should be highlighted that, in our patient population, the subgroup of patients with an “evening” chronotype was poorly represented. This was probably to be expected, as the mean age was relatively high in both study arms, with a consequent prevalence of early chronotypes (Fischer et al., 2017). This is an important consideration when evaluating the effectiveness of our intervention, as a significant proportion of patients was already “aligned” to the usual time schedule of a standard medical ward, where routine activities are generally carried out in the earlier part of the day. Furthermore, this finding could be usefully taken into consideration when designing future, similar trials.
Regarding skin temperature variations, although we did not find significant differences between the two study arms, a 24-h oscillation in PST and DST was observed, with a tendency to flattening of the PST curve after 1 week of hospitalization in all patients. This is in agreement with previously published literature (Cuesta et al., 2017; Garrido et al., 2017). In the DST profile, a flattening of the DST curve at T1 was not visible. This suggests that the distal vasodilation occurring at night, which is functionally linked to sleep propensity, is still intact after 1 week of hospitalization and it also supports the hypothesis that DST is less affected by masking factors (van Marken Lichtenbelt et al., 2006), making it a valuable index also within the context of an acute medical hospitalization.
Patients sleeping near the window were exposed to more light than those sleeping far from the window, especially in the morning and during Daylight Saving Time. A clear effect of bed position on sleep efficiency was confirmed despite the age and severity of the medical condition (Bano et al., 2014), emphasizing the importance of the amount of natural light an inpatient is exposed to. As we have observed before (Bano et al., 2014), and except for purposes of the CircadianCare protocol, rolling shutters were rarely moved. Given the significant effect that natural light seemed to have on sleep efficiency, small educational campaigns on rolling shutters management aimed at hospital staff may be an additional, cheap and helpful tool to prevent hospitalization-related insomnia. By contrast to a previous study (Benedetti et al., 2001), no significant relationship was observed between bed position and length of hospitalization, possibly due to the considerably shorter period of hospitalization in the present study.
With regard to the effects of nocturnal environmental noise in hospital rooms, the baseline LAeq and the LAmax were very similar for all cases analyzed, and well above those recommended by the WHO. By contrast, the combination of the IR and the LA95eq allowed to unveil a relationship between substantial fluctuations in noise levels and night awakenings. It should be noted that the parameters taken into consideration by the WHO to evaluate the effects of noise on sleep focus on the noise determined by vehicle traffic outside buildings. By contrast, the acoustic analysis proposed in this study tried to highlight the effects of noise produced within the wards by the service equipment, as well as by medical operations and activities related to patients’ care. The results suggest that better conditions for sleep could be obtained not only by limiting the amount of noise during the night but also by ensuring that noise levels have the smallest possible fluctuations. This could probably be obtained, for example, by educational interventions for nurses on night rounds, and also by changes in the features of medication trolleys (e.g., operating surfaces materials) and their wheels and other mobile parts, which tend to be noisy.
The study has several limitations. A considerable proportion of patients screened did not provide informed consent and attrition over time was also high, which should be taken into account when planning similar, future studies in the acute medical setting. There were differences in baseline parameters between the two treatment arms (i.e., number of awakenings and DLMO), which might have affected subsequent comparisons. Also, logistics/feasibility issues and the lack of available, published information on the features/variability of certain indices (e.g., actigraphy and DLMO) in acute medical populations lead to some degree of uncertainty in power estimates and some deviation from the original analyses plan. Nonetheless, the CircadianCare management system showed some positive results in terms of both sleep and circadian timing. Furthermore, the study documented a significant effect of environmental lighting (bed position in relation to the window) and environmental noise (noise fluctuations during the night) on sleep. These findings may allow to implement minor changes to the service equipment currently used in wards plus in some ward practices, which may be cheap and beneficial, and ultimately to design better wards in future. Finally, our study demonstrates the feasibility of a personalized, multiple intervention chronotherapy protocol in a complex, acute hospitalization setting.
Supplemental Material
sj-docx-3-jbr-10.1177_07487304231213916 – Supplemental material for Managing Circadian Disruption due to Hospitalization: A Pilot Randomized Controlled Trial of the CircadianCare Inpatient Management System
Supplemental material, sj-docx-3-jbr-10.1177_07487304231213916 for Managing Circadian Disruption due to Hospitalization: A Pilot Randomized Controlled Trial of the CircadianCare Inpatient Management System by Chiara Mangini, Lisa Zarantonello, Chiara Formentin, Gianluca Giusti, Esther D. Domenie, Domenico Ruggerini, Rodolfo Costa, Debra J. Skene, Daniela Basso, Lisa Battagliarin, Antonino Di Bella, Paolo Angeli and Sara Montagnese in Journal of Biological Rhythms
Supplemental Material
sj-jpeg-1-jbr-10.1177_07487304231213916 – Supplemental material for Managing Circadian Disruption due to Hospitalization: A Pilot Randomized Controlled Trial of the CircadianCare Inpatient Management System
Supplemental material, sj-jpeg-1-jbr-10.1177_07487304231213916 for Managing Circadian Disruption due to Hospitalization: A Pilot Randomized Controlled Trial of the CircadianCare Inpatient Management System by Chiara Mangini, Lisa Zarantonello, Chiara Formentin, Gianluca Giusti, Esther D. Domenie, Domenico Ruggerini, Rodolfo Costa, Debra J. Skene, Daniela Basso, Lisa Battagliarin, Antonino Di Bella, Paolo Angeli and Sara Montagnese in Journal of Biological Rhythms
Supplemental Material
sj-jpeg-2-jbr-10.1177_07487304231213916 – Supplemental material for Managing Circadian Disruption due to Hospitalization: A Pilot Randomized Controlled Trial of the CircadianCare Inpatient Management System
Supplemental material, sj-jpeg-2-jbr-10.1177_07487304231213916 for Managing Circadian Disruption due to Hospitalization: A Pilot Randomized Controlled Trial of the CircadianCare Inpatient Management System by Chiara Mangini, Lisa Zarantonello, Chiara Formentin, Gianluca Giusti, Esther D. Domenie, Domenico Ruggerini, Rodolfo Costa, Debra J. Skene, Daniela Basso, Lisa Battagliarin, Antonino Di Bella, Paolo Angeli and Sara Montagnese in Journal of Biological Rhythms
Footnotes
Acknowledgements
The authors are grateful to all the personnel in the Clinica Medica V ward for their precious help with the daily organization of this study, especially during the pandemic. The study and authors LZ and GG were supported by a STARS@UNIPD 2019 Consolidator Grant to author SM.
Conflict of interest statement
The authors have no potential conflicts of interest with respect to the research, authorship, and/or publication of this article.
ORCID iDs
NOTE
Supplementary material is available for this article online.
References
Supplementary Material
Please find the following supplemental material available below.
For Open Access articles published under a Creative Commons License, all supplemental material carries the same license as the article it is associated with.
For non-Open Access articles published, all supplemental material carries a non-exclusive license, and permission requests for re-use of supplemental material or any part of supplemental material shall be sent directly to the copyright owner as specified in the copyright notice associated with the article.