
Abstract
Developing interventions to prevent firearm-related violence and to address its consequences requires an improved understanding of when these violent events are most likely to occur. We explored gunshot events in 6 of the most populated cities in the United States by time of day, day of week, holiday/non-holiday, and month using publicly available datasets. In some of these cities, gunshot events occurred most often at nighttime, on holidays and weekends, and during summer months, with significant interaction effects. There were also time-related changes in characteristics of the victims. Primary prevention efforts aimed at curbing firearm-related violence should consider these differential risks.
Introduction
The death rate in the United States due to gun violence is higher than that of any other high-income country (Grinshteyn and Hemenway, 2016). In the United States, firearm-related injuries are now the leading cause of death in children and adolescents (Goldstick et al., 2022). Developing interventions to prevent firearm-related violence and to address its consequences requires an improved understanding of when these violent events are most likely to occur; for example, some other violent behaviors occur more often at night (reviewed in Tubbs et al., 2022). We explored gunshot events by time of day, day of week, holiday/non-holiday, lunar cycle, and month in 6 of the most populated US cities.
Materials and methods
We utilized publicly available datasets (listed in References section, Part B) that report the date and time of day of gunshot events (defined as gunshots or shootings [i.e., gunshots with victims]) in 6 US cities: Baltimore MD, Boston MA, Washington DC, New York City (NYC) NY, Philadelphia PA, and Portland OR. We chose these cities as they have publicly available datasets that report gunshot events by time of day. Available datasets from Baltimore, NYC, Philadelphia, and Portland included information on gunshot events with victims; the dataset from Washington DC reported information on gunshot events detected from a technology surveillance system (ShotSpotter), without report of whether the event resulted in a victim or not; and the Boston datasets reported both gunshot events with and without victims separately. Baltimore, Boston, Washington DC, NYC, and Philadelphia data were from 1 January 2015 to 31 December 2021; Portland data were from 1 January 2019 to 31 December 2021. All cities except Portland reported data with exact time stamps; Portland reported data in 2-h increments starting at midnight. Therefore, we summed the counts of gunshot events into 2-h increments for all cities.
Holidays were defined as days in which government offices were closed and were identified according to federal, state, and city calendars. We checked the total number of gunshot events in 12-h time frames (e.g., 0000-1200 h vs 1200-2400 h; 0100-1300 h vs 1300-0100 h . . . 2300-1100 h vs 1100-2300 h). The time frame with the maximal difference was 1800-0600 h versus 0600-1800 h. We then defined nighttime as 1800-0559 h and daytime as 0600-1759 h. Weekend was defined as Friday 1800 h to Sunday 1759 h, weekday as Sunday 1800 h to Friday 1759 h, and Monday holidays as Sunday 1800 h to Monday 1759 h.
For each city, we summed the number of gunshot events by time of day, day of week, holiday/non-holiday, lunar cycle, and photoperiod-based month (i.e., beginning on the 21st of each month to match shortest [21 December-20 January was Month 1] and longest [21 June-20 July was Month 6] photoperiod days of year). We analyzed by nighttime versus daytime overall and within day of week, weekday holidays versus non-holidays, weekend versus weekday and their interactions, day within the lunar month, and photoperiod month. We computed ratios of the number of gunshot events of nighttime/daytime overall and separately for weekends, for weekday holiday and non-holiday, for Monday holiday and non-holiday, by day within a lunar cycle, and for photoperiod month. There were too few non-Monday holidays to do calculations for holiday versus non-holiday for other weekdays. We adjusted for the number of days in each group for these ratios.
Negative binomial–based statistics were performed for number of gunshot events for each city for (1) daytime versus nighttime and (2) separately daytime and nighttime for holiday versus non-holiday on weekdays; holiday versus non-holiday for Monday; and weekends versus non-holiday weekdays. Cosinor analyses were performed for counts of gunshot events for each city for (1) day within lunar cycle and (2) photoperiod month by calendar day. Statistics were conducted using SAS v9.
For Boston, NYC, and Philadelphia shooting data, data on the sex of the victim were available. For NYC data, victim data were available by age group: <18, 18-24, 25-44, 45-64, and ≥65 years. For Philadelphia data, victim data were available by exact age; we grouped Philadelphia data using the NYC age categories. Age and sex of victims in Portland were not reported.
Because the types of data reported by each city are different, we did not compare results across cities.
Results
Nighttime/Daytime, Weekend, Holiday, Lunar, and Photoperiod Month
Across all 6 cities, gunshot events were more common during the nighttime than during the daytime. The ratio of nighttime/daytime gunshot events ranged from 1.7 to 4.5; the number of gunshot events were statistically significantly higher (p < 0.001) for all cities for nighttime than daytime (Figures 1 and 2a, Table 1).
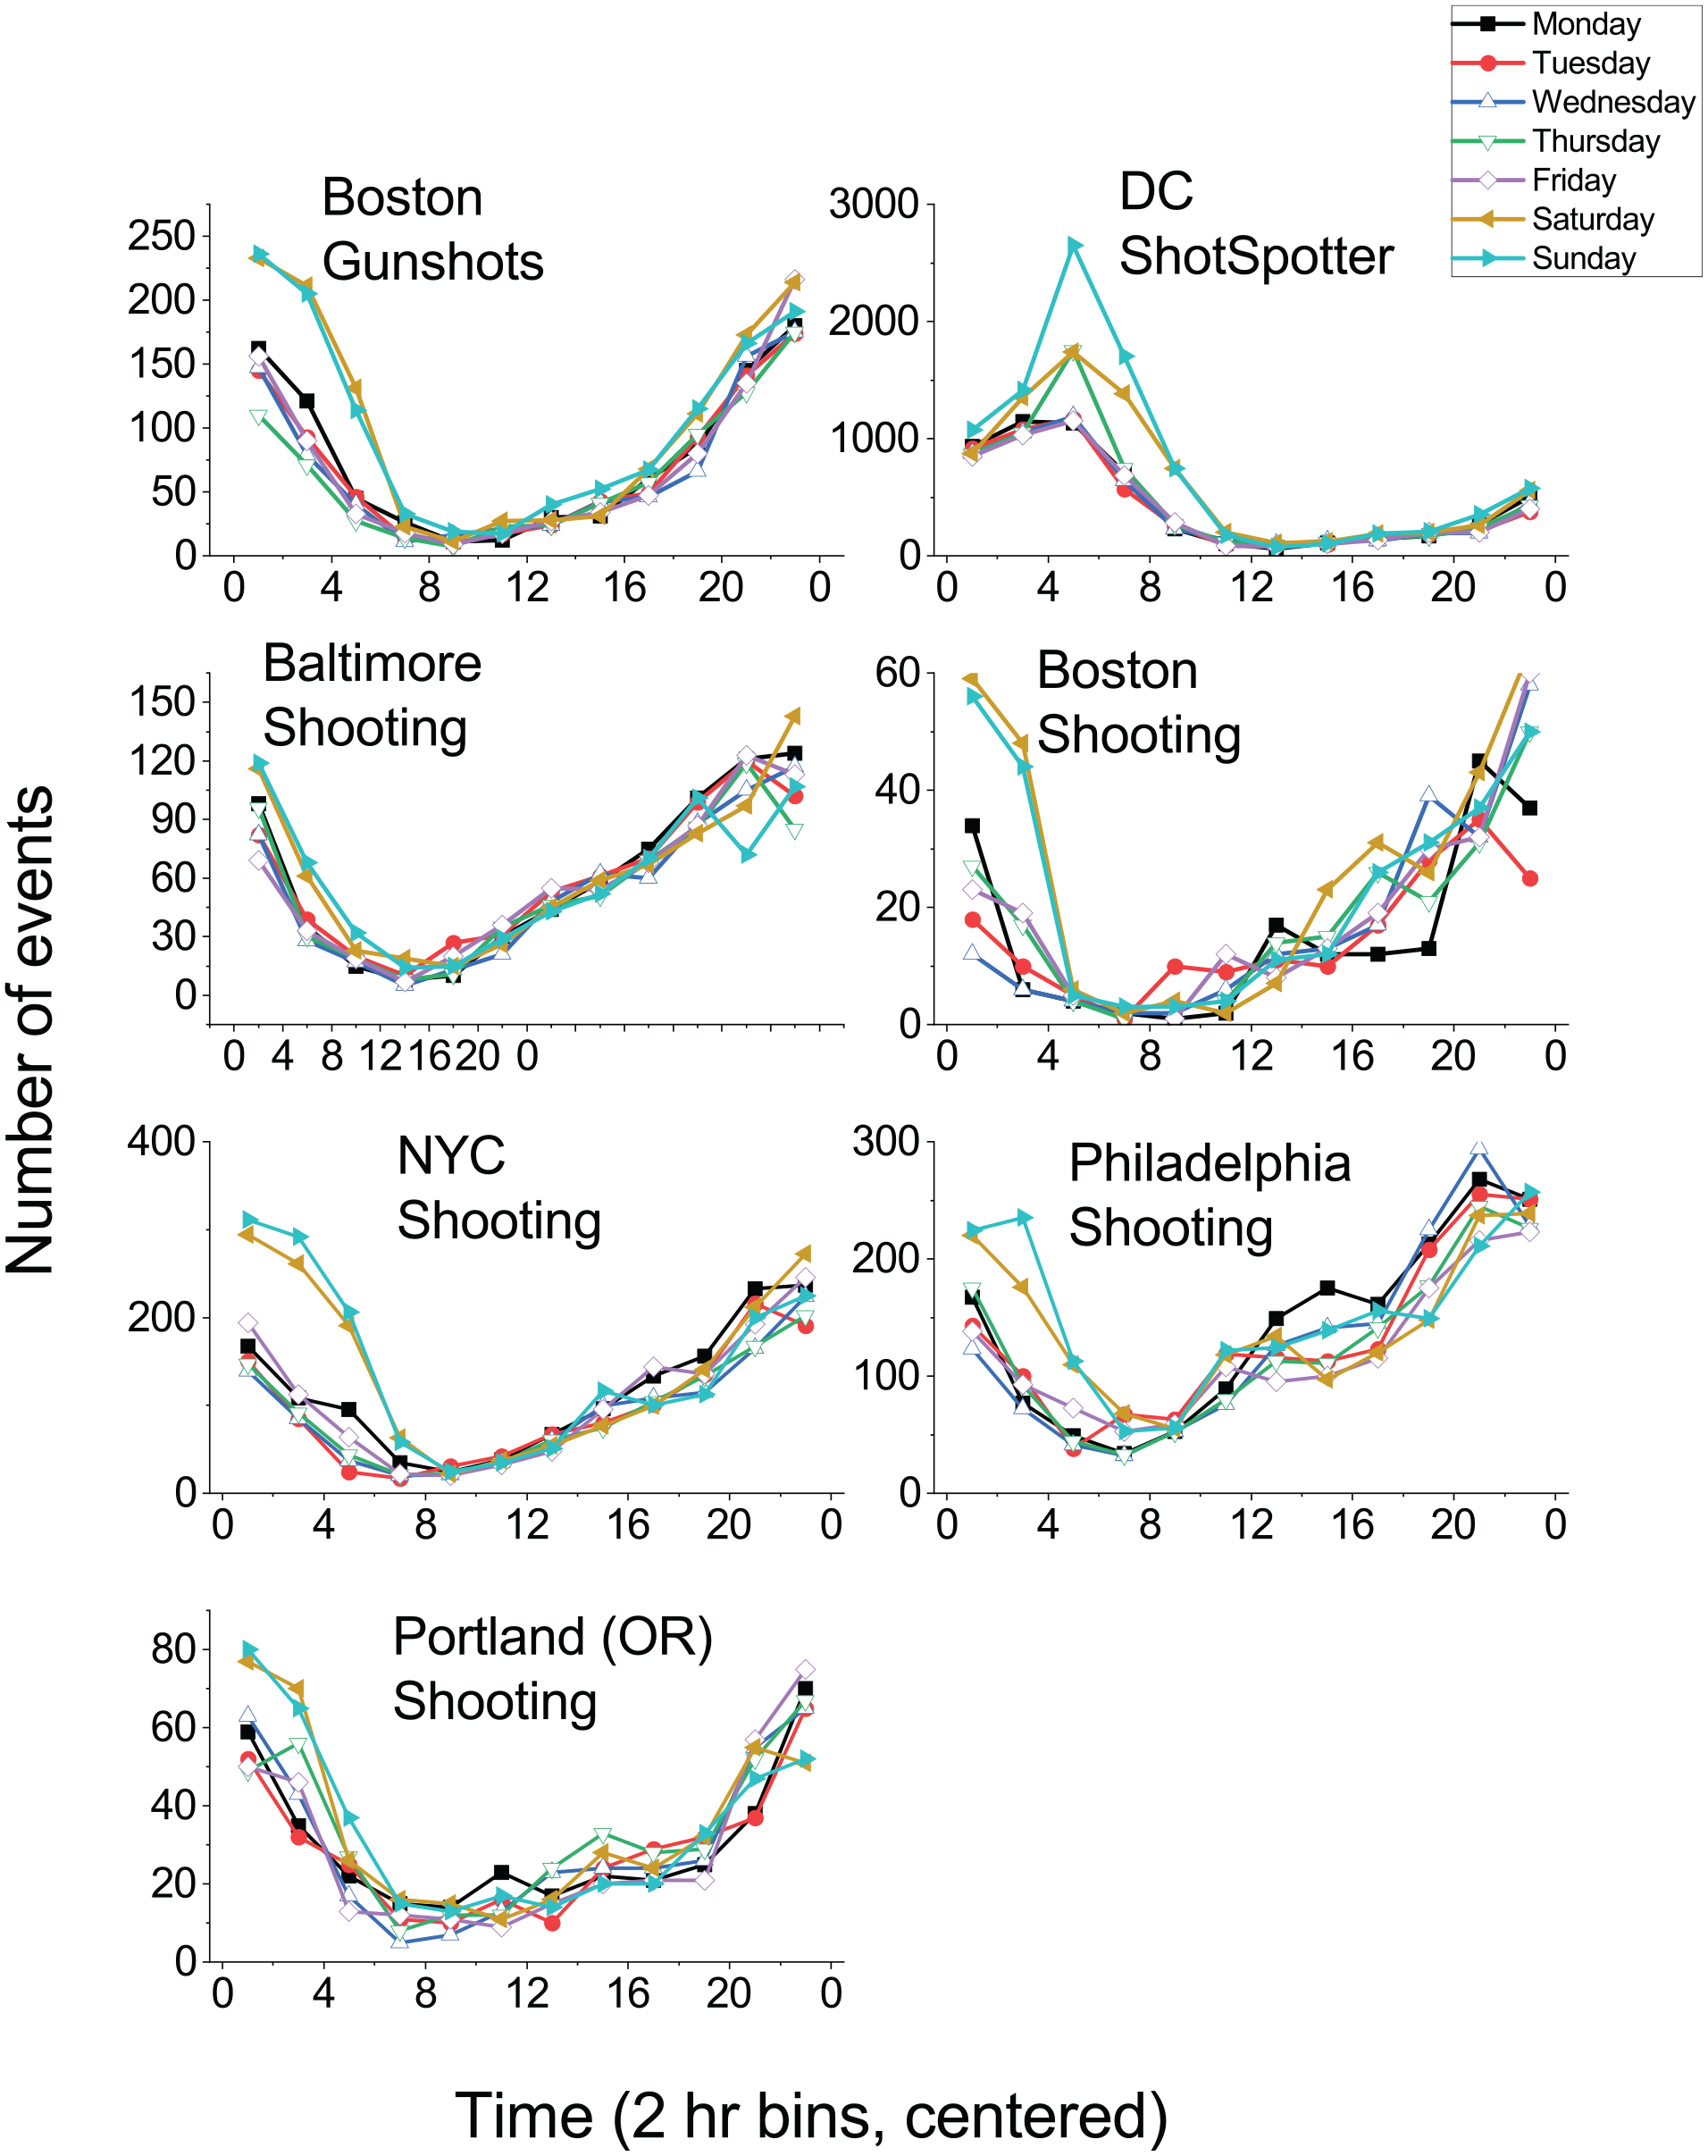
Number of gunshot events by city in 2 hr intervals by each day of the week. Shooting gunshot events are those with victims.
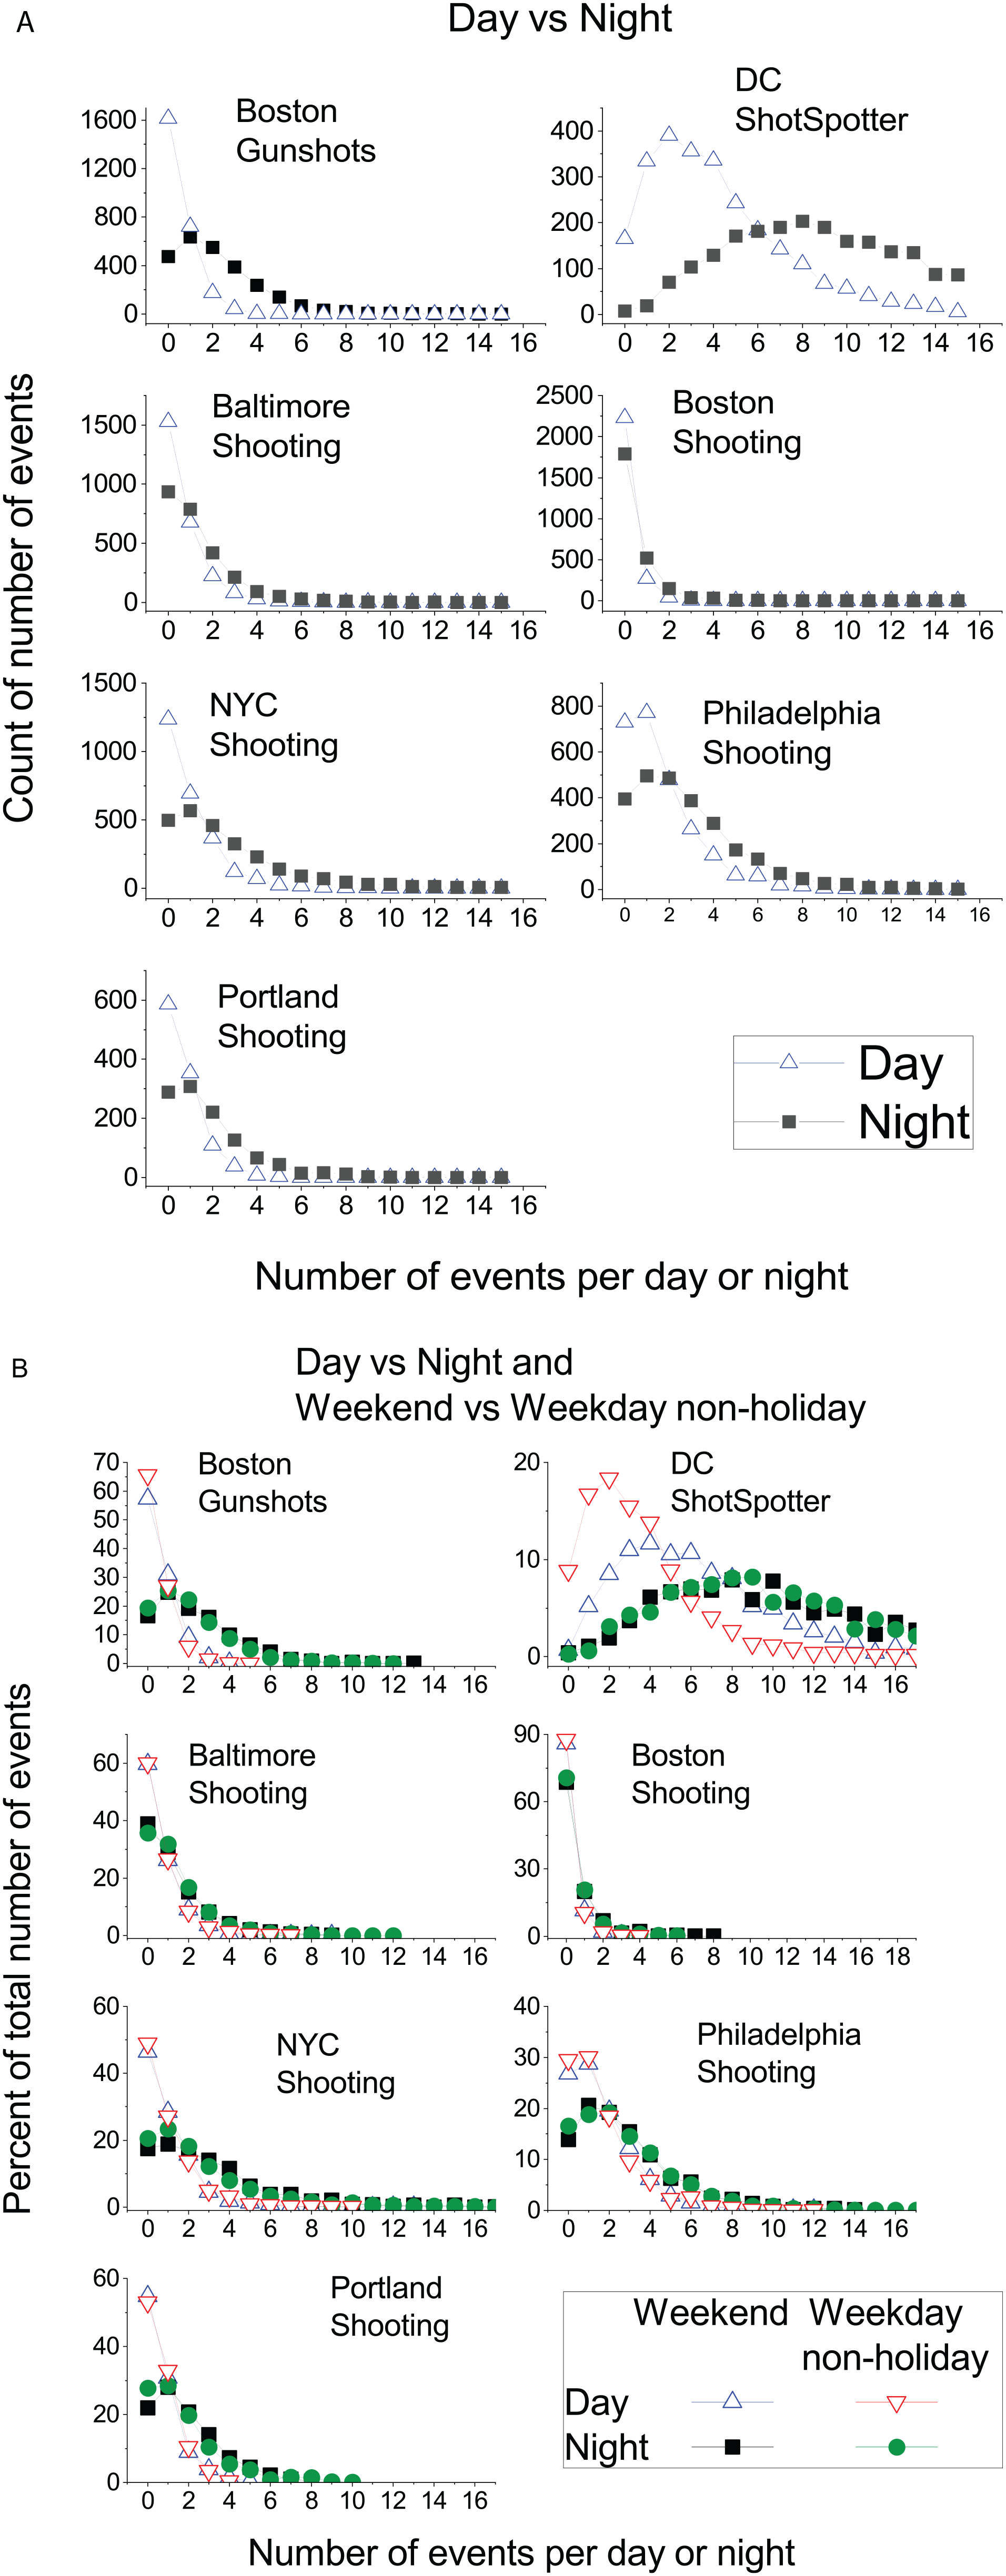
Histograms of the number of gunshot events by city. The x-axis is the number of events per daytime or nighttime; y-axis is the number (panel A) or percentage (panel B) of times that number of events occurred. (A) Number of gunshot events for each city by daytime vs nighttime by city (B) Percentage of gunshot events for each city by daytime vs nighttime and weekend vs weekday non-holiday. Shooting gunshot events are those with victims. Note: percentages are plotted in panel B because of the different number of days that are weekend vs weekday non-holiday.
Relative ratios of gunshot events for each gunshot event type and city.
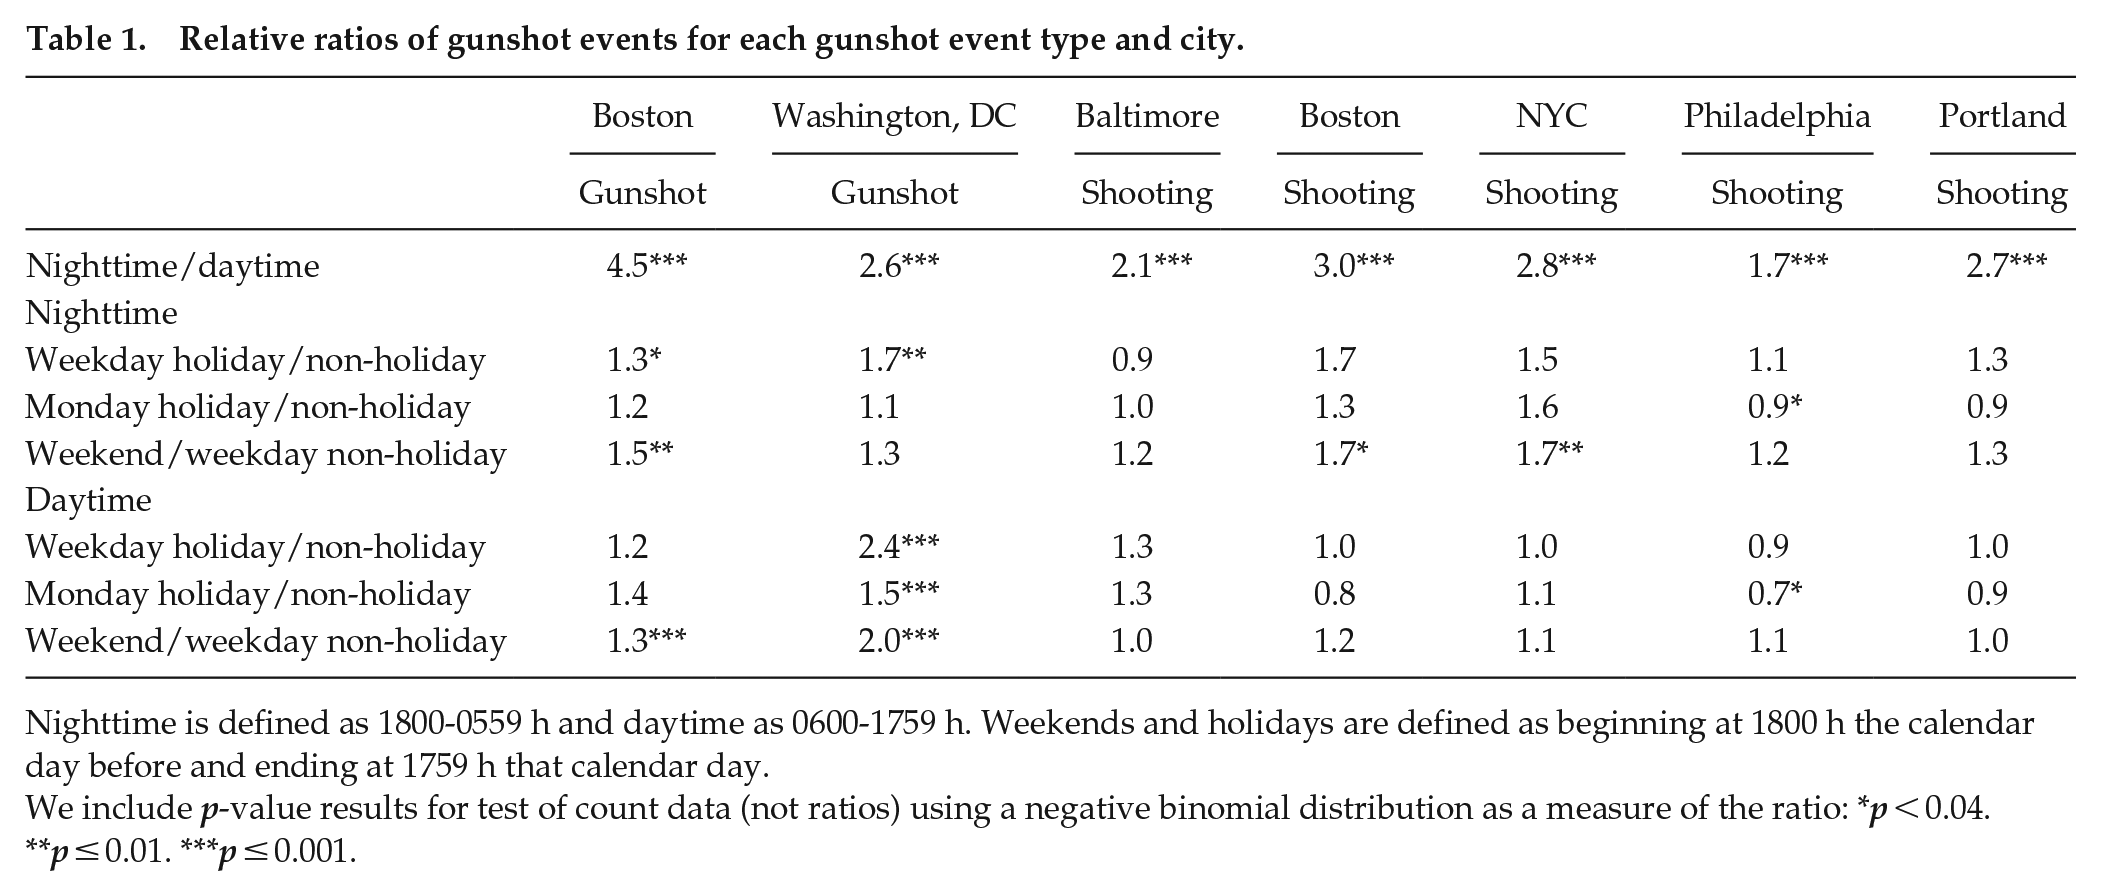
Nighttime is defined as 1800-0559 h and daytime as 0600-1759 h. Weekends and holidays are defined as beginning at 1800 h the calendar day before and ending at 1759 h that calendar day.
We include p-value results for test of count data (not ratios) using a negative binomial distribution as a measure of the ratio: *p < 0.04. **p ≤ 0.01. ***p ≤ 0.001.
The ratios of gunshot events on weekdays that were holidays/non-holidays during daytime ranged from 0.9 to 2.4; during nighttime, these ratios ranged from 0.9 to 1.7. For daytime number of gunshot events, only DC ShotSpotter counts were significantly higher for holiday versus non-holiday (p < 0.001). Nighttime number of gunshot events were significantly higher for Boston gunshots (p = 0.03) and DC ShotSpotter (p = 0.01) for holiday versus non-holiday.
The ratios of gunshot events on Mondays that were holidays/non-holidays during daytime ranged from 0.7 to 1.5; during nighttime, these ratios ranged from 0.9 to 1.6 (Table 1). For daytime number of events for Monday holiday versus non-holiday, only DC ShotSpotter counts (p < 0.001) and Philadelphia shootings (p = 0.04) were significantly different. The nighttime number of events for Monday holiday versus non-holiday were not statistically different in any city.
The relative ratio of gunshot events on weekend/weekday non-holidays during daytime ranged from 1.0 to 2.0 and during nighttime ranged from 1.2 to 1.7. For daytime weekend versus weekday non-holidays, Boston gunshots (p < 0.001) and DC ShotSpotter (p < 0.001) were significantly higher on weekends. Nighttime weekend versus weekday non-holiday number of events were significantly higher on weekends for Boston gunshots (p = 0.006), Boston shooting (p = 0.03), and NYC shootings (p = 0.003; Figure 2b).
For the nighttime/daytime ratio of number of gunshot events, there were no significant effects of day within the lunar month (data not shown; all p > 0.28 for cosinor fit) and there were more gunshot events during months with longer photoperiod for Baltimore, Boston, Washington DC, and NYC (p < 0.01 for cosinor fit; Figure 3).
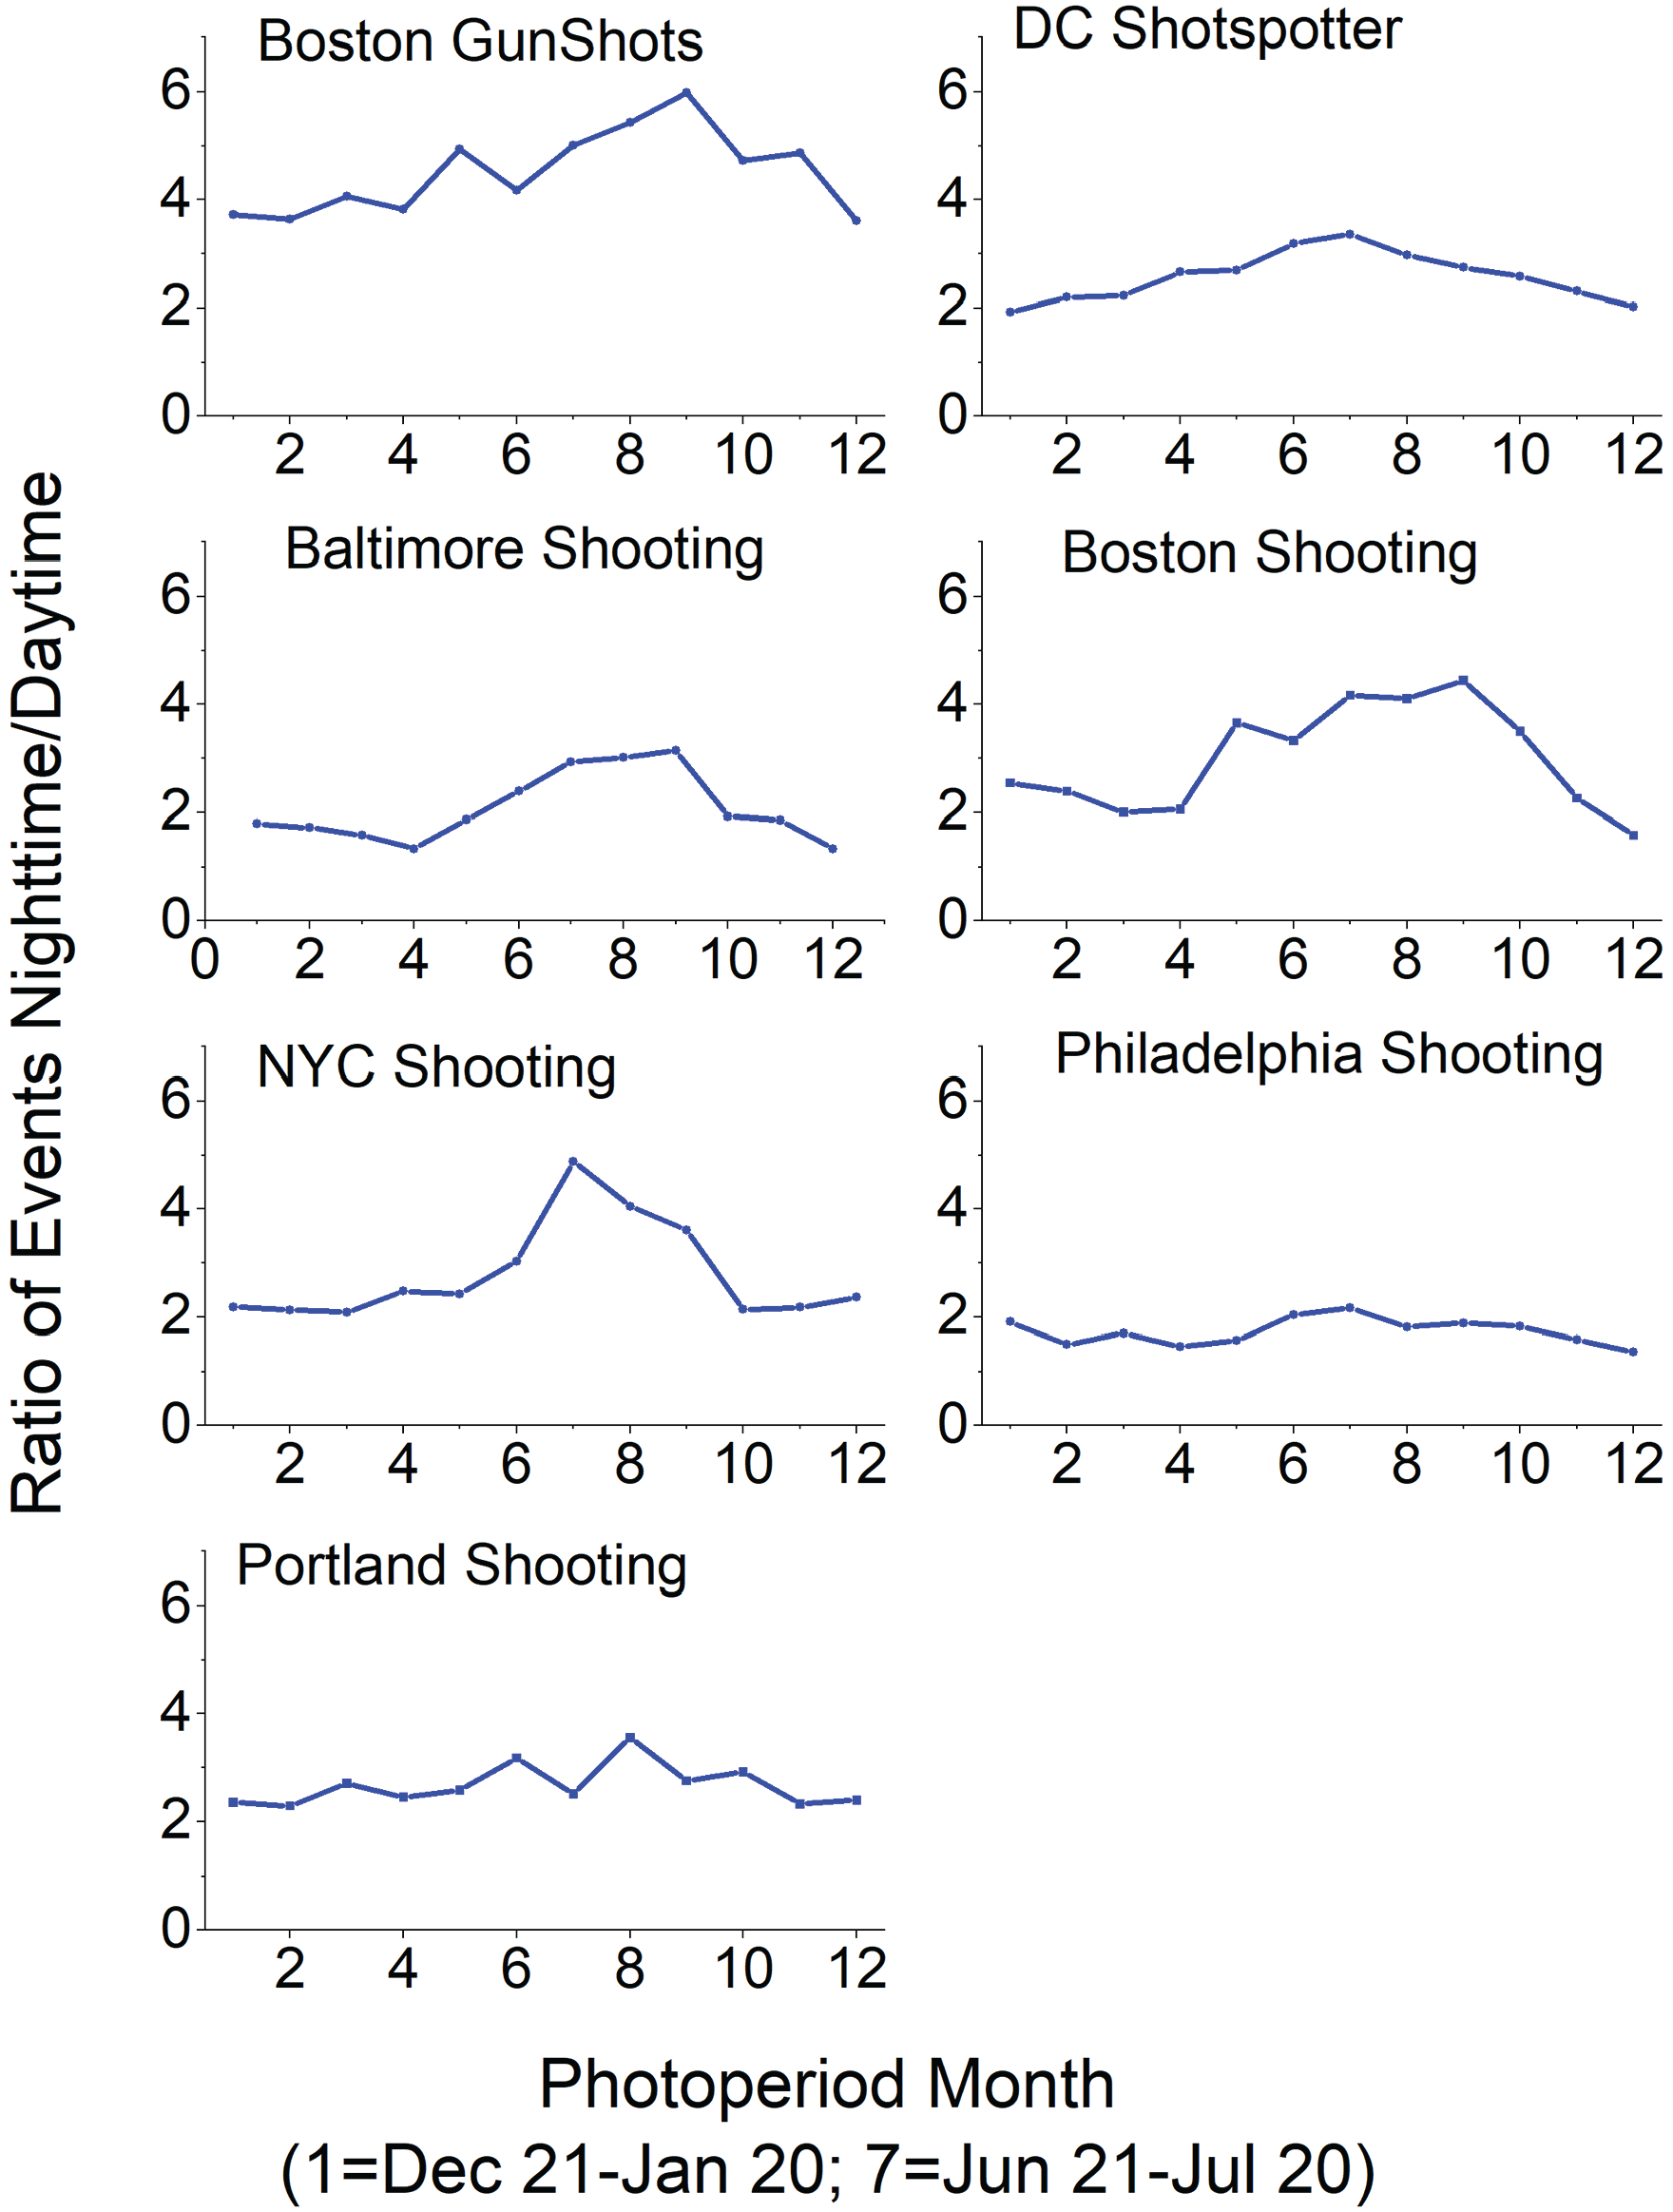
Number of gunshot events by city by photoperiod month. Month 1 is Dec 21-Jan 20 (beginning with shortest photoperiod day of the year); month 7 is Jun 21-July 20 (beginning with longest photoperiod day of the year). Shooting gunshot events are those with victims.
Nighttime/Daytime—Age and Sex of Victim
The overall male/female victim ratio was 8.8 (Boston), 9.0 (NYC), and 9.7 (Philadelphia). The nighttime/daytime ratio was similar in both sexes: for female victims, the nighttime/daytime ratio was 3.7 (Boston), 3.0 (NYC), and 2.1 (Philadelphia); for male victims, the ratios were 3.0, 2.8, and 1.7, respectively.
The ratio of nighttime/daytime gunshot events in each age group was lowest in the ≥65 age group: 1.2 (NYC) and 1.0 (Philadelphia). For ages less than 18 years, the nighttime/daytime ratios were 1.9 (NYC) and 1.2 (Philadelphia); for ages 18-24 years, they were 3.2 and 1.7, respectively; for ages 25-44 years, they were 3.0 and 1.8, respectively, and for 45-64 years, they were 2.1 and 1.7, respectively.
Discussion
Across 6 US cities, this analysis of publicly available data demonstrates that gunshot events occur most often during nighttime, on holidays and weekends, and during summer months. Understanding time-based variations in firearm violence provides critical data to develop targeted interventions to reduce gun violence. The preponderance of gun violence during the nighttime may impact individuals in the surrounding area due to the noise, not only of the gunshot but also of the associated emergency response (e.g., police, ambulance). For cities in which information about the victims was reported, the nighttime/daytime ratios were also greater than 1.0 (i.e., more gunshot events during nighttime) for both male and female victims and for all age groups except for people ages 65 years and older in Philadelphia.
A time-of-day effect and a monthly effect have been previously documented in Syracuse, NY (Larsen et al., 2017) and weekend versus weekday effect has been described in Chicago (Kieltyka et al., 2016). A report from nearly 40 years ago described a weekend effect of number of homicides in Manhattan that depended on location of the homicide (home vs >10 blocks from home) and social distance between the perpetrator and victim (e.g., family members; Messner and Tardiff, 1985); the authors of that report did not find an increase between midnight and 0800 h. Given that the graphs of homicide by hour stratified by other variables (location, victim-perpetrator relationship) in that paper suggest time-of day variation, it is possible that if they had defined nighttime as the hours of 1800—0600 (such as we used for our analyses), a nighttime effect would have been found. Seasonality in violent crimes has also previously been reported (Sisti et al., 2012).
For the analysis by photoperiod month, there are many factors on the causal pathway for which we did not adjust, including (1) temperature—higher outside temperature is associated with increased violence (Anderson, 2001; Kieltyka et al., 2016), and (2) probable difference in location—more time is spent outdoors during long photoperiod/warmer months.
These data represent an underestimate of all firearm-related violence, as certain crimes using firearms that were not fired (e.g., armed robbery) were not captured by these datasets, and it is very likely that some gunshot events are not reported or identified by law enforcement. Some violent crimes and suicides also occur more often at night, either in unadjusted rates and/or after adjustment for expected number of people awake (Tubbs et al., 2022).
We did not adjust the ratios based on the number of people awake at the time of the gunshot event. If the individuals involved in gunshot events were representative of those surveyed in the American Time Use Survey for 2015-2021 (References section, Part B), then the nighttime/daytime ratio of individuals awake would be 0.6. All nighttime/daytime ratios listed above would be divided by this number to adjust for the number of people awake at different times; this would increase the ratio values reported. We report this value but do not apply it to calculated ratios since the individuals—both perpetrator and victim—involved in gunshot events may not have been proportionately represented in that survey.
The results suggest that gunshot events may be impacted by standard work or school schedules, since there were fewer gunshot events during the day and on non-holidays or weekends. Weekends and holidays are associated with changes in sleep timing and duration and substance use (Heacock et al., 2022). We do not have information about the person who fired the gun (e.g., age, sex, any substance use, relationship to victim, location relative to home [Messner and Tardiff, 1985]), which is important for further study.
In this report, we do not include other known factors associated with gun violence (most of which vary within a city), including measures of neighborhood socio-economic status (e.g., income, population density, income disparity, economic insecurity, proportion of rental vs owned housing units, racial composition; Johnson et al., 2021; Larsen et al., 2017; Pah et al., 2017). There is also substantial variation by year and presumably by individual events (e.g., very high temperature for 1-2 days, local political protests; Braga et al., 2010); we hypothesized that the multi-year analysis would reduce variance due to these causes.
Primary prevention efforts should consider the differential risk in firearm-related violence reported here. Beyond the impact of firearm-related violence on individuals, the sounds of gunshots and the lights and sirens of emergency vehicles are likely to disrupt the neighborhoods in which this violence occurs—at all times of the day and night. Because sufficient sleep with minimal interruption during the nighttime supports daytime cognition and emotional regulation and is vital for mental health, learning, and physical health, these nighttime-predominant patterns of gun violence may be an important factor in understanding the community-level consequences of firearm-related violence, and can become a target for designing interventions to reduce the multiple negative health, safety, learning, and other outcomes.
Footnotes
Acknowledgements
The authors thank Dr. Wei Wang for advice on the statistical analyses.
EBK: NIH R01-NS099055, U01-NS114001, U54-AG062322, R21-DA052861, R01-NS114526-02S1, R01-HD107064; DoD W81XWH201076; and Leducq Foundation for Cardiovascular Research Leducq Trans-Atlantic Network of Excellence on Circadian Effects in Stroke.
MA: None.
RR: NIH K01-HL150339.
JI: None.
GG: None.
PTM: None.
CAS: None.
Authors’ note
A report of a subset of these findings is available on MedRxiv.
Conflict of interest statement
COI (2021-present).
EBK: consulting: American Academy of Sleep Medicine Foundation, Circadian Therapeutics, National Sleep Foundation, Sleep Research Society Foundation, Yale University Press. Travel support: European Biological Rhythms Society, Sleep Research Society, EPFL Pavilions. Other: unpaid scientific board member of Chronsulting; partner is founder, director, and chief scientific officer of Chronsulting.
MA: None.
RR: consulting: Sonesta Hotels, Castle Hot Springs, Oura Ring, Savoir Beds, by Nacht GmbH.
JI: None.
GG: None.
PTM: None.
CAS: None.
Data availability statement
All research materials are available from public sources.