
Abstract
Circadian-paced biological processes are key to physiology and required for metabolic, immunologic, and cardiovascular homeostasis. Core circadian clock components are transcription factors whose half-life is precisely regulated, thereby controlling the intrinsic cellular circadian clock. Genetic disruption of molecular clock components generally leads to marked pathological events phenotypically affecting behavior and multiple aspects of physiology. Using a transcriptional signature similarity approach, we identified anti-cancer protein synthesis inhibitors as potent modulators of the cardiomyocyte molecular clock. Eukaryotic protein translation inhibitors, ranging from translation initiation (rocaglates, 4-EGI1, etc.) to ribosomal elongation inhibitors (homoharringtonine, puromycin, etc.), were found to potently ablate protein abundance of REV-ERBα, a repressive nuclear receptor and component of the molecular clock. These inhibitory effects were observed both in vitro and in vivo and could be extended to PER2, another component of the molecular clock. Taken together, our observations suggest that the activity spectrum of protein synthesis inhibitors, whose clinical use is contemplated not only in cancers but also in viral infections, must be extended to circadian rhythm disruption, with potential beneficial or iatrogenic effects upon acute or prolonged administration.
All organisms living on Earth have evolved to temporally modulate physiological regulations allowing metabolic (pre)adaptations to activity and rest periods, which are normally aligned on night and day cycles. Adopting a 24-h period, the light-induced pacing of the central nervous system and of connected organs is further controlled by additional zeitgebers (time givers) such as food intake or social interaction (Fagiani et al., 2022). The importance of these circadian regulations is highlighted by deleterious effects on metabolic homeostasis of an unphased lifestyle, such as shift work or chronic jet lag, which extends organism exposure to artificial light, induces sleep alteration and irregular food intake (Sulli et al., 2018). Whether they are causative of diseases in humans is unclear, but misalignments and/or blunting of the internal clock are associated with a large panel of pathologies ranging from cardio-metabolic, immuno-inflammatory diseases and cancer to psychiatric disorders (Baron and Reid, 2014; Jacob et al., 2020; Mukherji et al., 2020; Wang et al., 2022). As a consequence, lifestyle adaptations to minimize or correct these ailments by resetting/rephasing this internal clock are warranted. Targeting the clock is also an entry point for the development of novel, more efficient, and less toxic therapeutic strategies (Sulli et al., 2018; Tamai et al., 2018; Ye et al., 2018).
At the cellular level, circadian rhythms are established by 2 autoregulatory loops of transcription factors, encoded by so-called core clock genes (CCGs). The first transcriptional loop is composed of the heterodimeric BMAL1 (ARNTL) and CLOCK transcriptional activators and PER and CRY transcriptional repressors. The secondary loop is made of the nuclear receptors RORs, REV-ERBα, and REV-ERBβ. These interlocked transcriptional-translational feedback loops (TTFLs) define a cell-autonomous clock machinery whose temporal regularity is conditioned by the precise orchestration of gene transcription and protein degradation (Kramer et al., 2022). These TTFLs themselves control clock output genes, which are involved in a myriad of biological processes including metabolism, inflammation, and house-keeping functions, underlying again the fundamental role of the molecular clock in organismal homeostatic control (de Assis and Oster, 2021).
Considering the major role of the molecular clock, it seems obvious that any drug treatment altering the clock in normally-phased individuals may be iatrogenic. Importantly, dysregulated circadian rhythmicity is associated with poor survival rates in cancer patients, and a few chemotherapeutic agents such as paclitaxel have been shown to disrupt endogenous circadian rhythms (Sullivan et al., 2022). We recently discovered that acute administration of the cardiotonic steroid digoxin, chronically used to treat atrial fibrillation, severely impacts on TTFLs by promoting the proteasomal degradation of the nuclear receptor REV-ERBα (Vinod et al., 2022). REV-ERBα transcriptional repressive activity is detrimental to myocardial resistance to an ischemia-reperfusion insult (Montaigne et al., 2018). Interestingly, digoxin has also been proposed as a potential anti-cancer drug (Elbaz et al., 2012a, 2012b; Zhou et al., 2019; Ren et al., 2021), but its impact on the molecular clock has not been assessed in this context. Broadly speaking, we also note that cancer therapies are significantly associated with cardiac and vascular toxicity with multiple etiologies and mechanisms of action (Herrmann, 2020). Given that circadian rhythmicity is paramount to cardiac physiology, this warrants the specific exploration of chemical anti-cancer molecules in cardiomyocytes.
Thus, to identify drugs that could impact cardiomyocyte biology through a dys-synchrony of the molecular clock, we compared perturbations of the gene expression pattern triggered by digoxin in a reference human cardiomyocyte cell line to the L(andmark)1000 compendium collected from drug-treated cancer cell lines (Subramanian et al., 2017). Here we report that transcriptional pattern similarities could be identified with structural analogues of digoxin, validating our strategy. More unexpectedly, a significant proportion of digoxin-like molecules belonged to the protein synthesis inhibitor class, including homoharringtonine (HHT, omacetaxine mepesuccinate), an alkaloid approved by the Food and Drug Administration for the treatment of chronic myeloid leukemia. A significant number of tested anti-cancer protein synthesis inhibitors also strongly impacted on REV-ERBα protein synthesis and affected cardiomyocyte circadian rhythmicity in vitro and ex vivo. We propose an original workflow allowing the identification and characterization of molecules able to target the clock machinery by decreasing REV-ERBα protein levels.
Materials and methods
Reagents
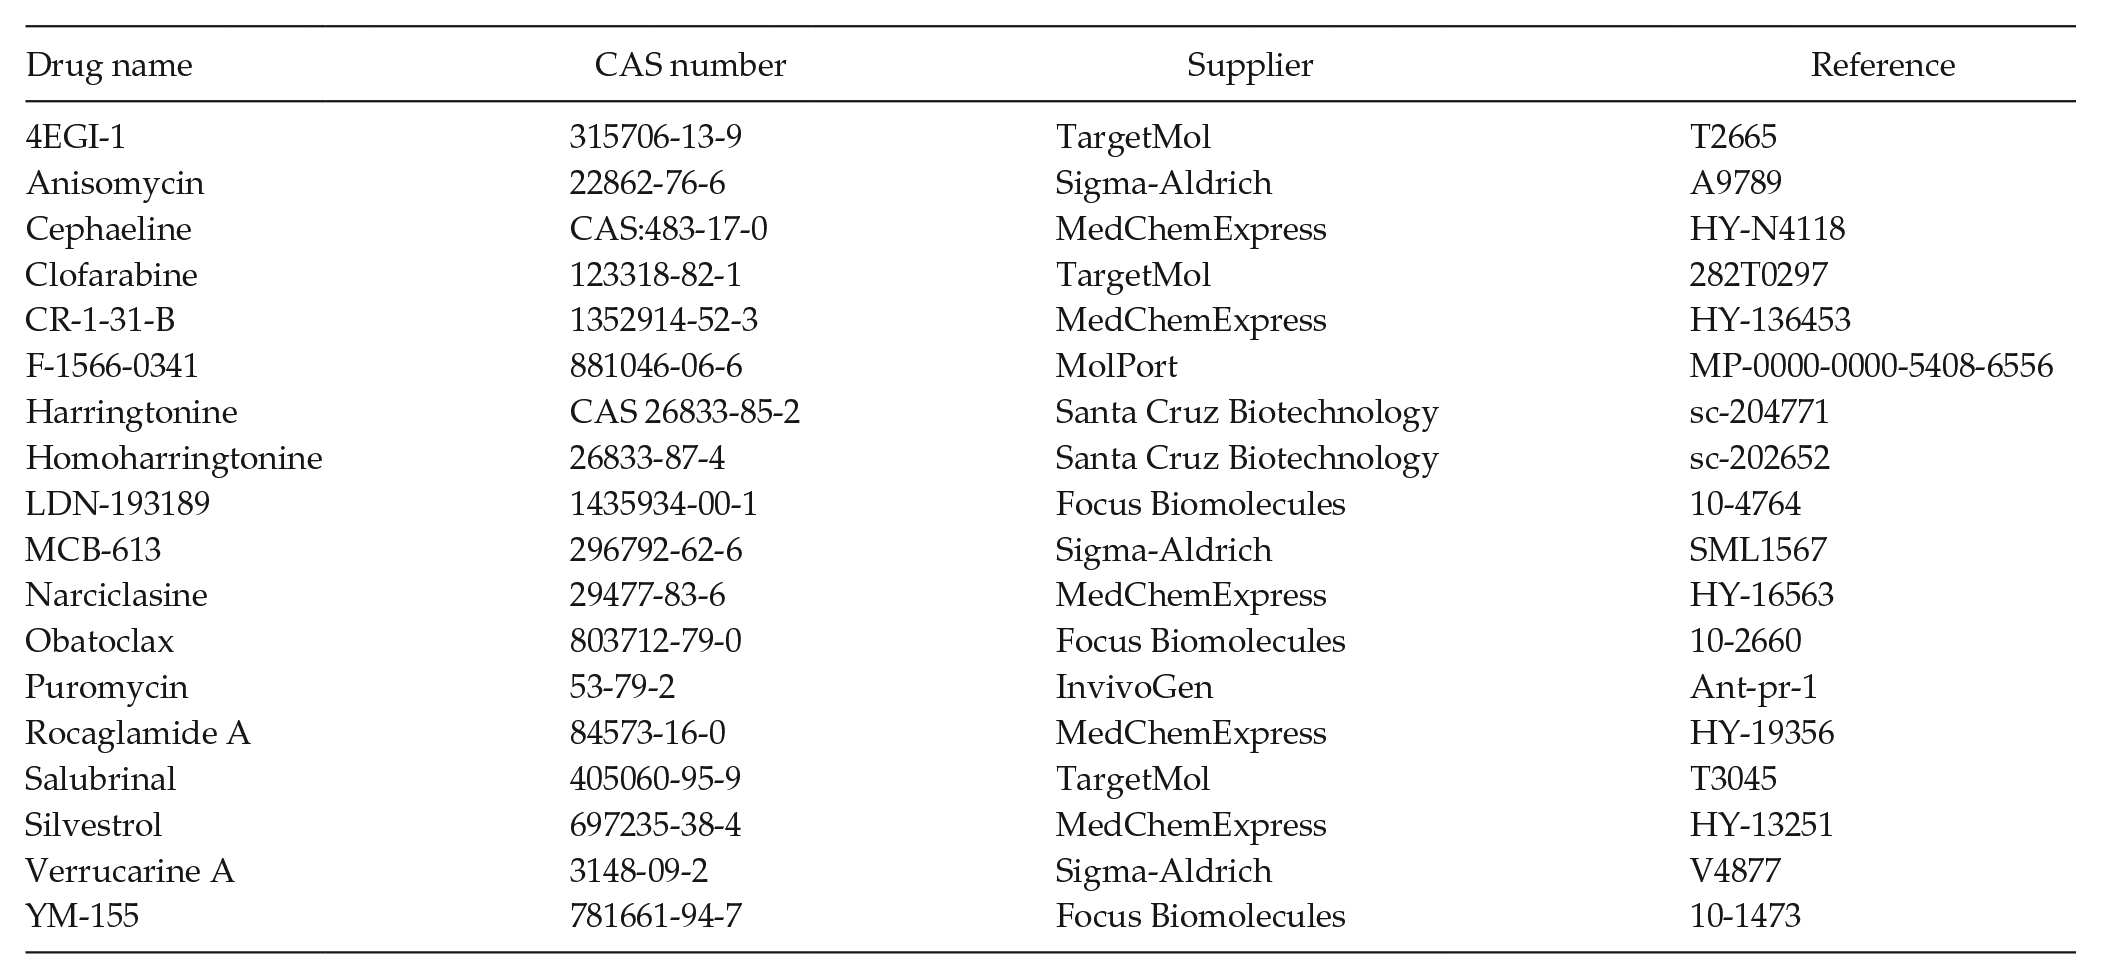
Digoxin (Sigma-Aldrich, D6003) was dissolved in 10% ethanol, 40% propylene glycol, 0.08% citric acid, and 0.3% sodium phosphate and stored at 4 °C. The 20S proteasome sub-unit inhibitor clasto-lactacystin β-lactone (Sigma-Aldrich, L7035) as well as all the other drugs listed in the table below were dissolved in DMSO and stored at −20 °C. Rabbit anti-NR1D1 and mouse anti-HSP90α/β monoclonal antibodies were obtained from Cell Signaling Technology (13418) and BioLegends (661802), respectively.
Drugs
Animal Experimentation
Mice were handled in accordance to institutional guidelines and approved by the local ethics committee for animal experimentation (Comité d’Ethique en Expérimentation Animale n°075). C57bl/6J mice were purchased from Charles River Laboratories and Per2::luc mice (IMSR_JAX:006852 [Yoo et al., 2004]) were from The Jackson Laboratory and were re-derivated into SOPF C57bl/6J mice at Charles River Laboratories. Animals were housed in a 12-/12-h light/dark cycle and fed ad libitum with a chow diet [Safe diets, A04] and free access to drinking water. For acute in vivo experiment, 11-weeks-old wild-type males were first acclimated for 2 weeks in the animal facility. On the day of the experiment, HHT 1 mg/kg, a dose chosen according to previous studies (Li et al., 2020; Wang et al., 2021), or control vehicle [0.25% DMSO in 9 g/L NaCl solution] was administrated by intraperitoneal injection at ZT5. Animals were then sacrificed at ZT9 by cervical dislocation and hearts were cut in half, flash-frozen in liquid nitrogen, and stored at −80 °C. For the ex vivo atrial explant experiment, 23-week-old Per2::Luc males were used. Briefly, animals were sacrificed by cervical dislocation at ZT 7 [ZT0 is light on], and atria were collected, washed in ice-cold 1× PBS, and cut in 2-mm3 pieces.
Cell Lines
The human ventricular cardiomyocyte cell line AC16 was purchased from Merck-Millipore (SCC109) and maintained in DMEM/F12 Ham medium (Sigma-Aldrich, D6434), supplemented with 2 mM L-glutamine (Thermo Fisher Scientific), 12.5% fetal calf serum (FCS), and 1% penicillin-streptomycin (Thermo Fisher Scientific).
Human primary ventricular cardiomyocytes (HPC) were isolated from a male donor after a cardiac transplantation. These cells were obtained from PromoCell (C-12811) and maintained in Myocyte Growth Medium (C-22070, PromoCell) supplemented with Myocyte Growth Medium supplement mix (C-39270, PromoCell).
AC16 and HPC cells were synchronized before each experiment by a 2-h, 100-nM dexamethasone (Sigma-Aldrich, D4902) pulse (Balsalobre et al., 2000; van der Veen et al., 2012).
Reporter Vectors, Cell Transfection, and Real-Time Bioluminescence Assays
The BMAL1-Luc and the PER2-Luc constructs suitable for real-time bioluminescence studies were obtained by cloning the corresponding human promoter regions. The BMAL1 promoter region from −350 to +100 base pairs (bp) relative to the gene transcriptional start site was inserted into red (pcBR) luciferase emitting vector (Promega, E1411). This DNA sequence deduced from previous report (Vollmers et al., 2008) starts 40 nucleotides before the CAAT box. The PER2-Luc vector was assembled with the human PER2 promoter region from −480 to +120 bp containing the minimal cycling promoter (Vatine et al., 2009) into a green luciferase vector (pcBG68, Promega, E1431). The pGL4.50 vector was purchased from Promega.
AC16 cells were batch-transfected with 10 µg reporter plasmid using Fugene HD transfection reagent (Promega, E2311) following the manufacturer’s recommendations. Twenty-four hours after transfection, cells were split into 35-mm-diameter dishes and incubated at 37 °C, 5% CO2 for 24 h. Cells were synchronized by a 2-h incubation with 100 nM dexamethasone. After a wash with 1× PBS, fresh medium containing 200 µM beetle luciferin potassium salt (Promega, E1601) was added onto cell layers and dishes were placed into a KRONOS AB-2550 luminometer (ATTO). Luciferase activities were measured for 1 min every 10 min under 5% CO2 at 37 °C for 4 days. Twenty hours after synchronization, bioluminescence monitoring was paused and HHT or vehicle was added to the cell culture medium. After a 4-h treatment, cells were washed with 1× PBS and fresh medium containing luciferin (200 µM) was added. Signals were recorded as described above.
In Vitro Luciferase Assay
The purified recombinant luciferase (Promega, E2940) activity was determined in vitro as previously described (Berthier et al., 2021). The bioluminescence signal was quantified using a Victor Light Luminometer (PerkinElmer) in the presence of 0.1, 1, or 10 µM Luciferase Inhibitor II (Calbiochem, 119114) or of 0.1, 1, or 10 µM HHT.
Ex Vivo Luciferase Activity Monitoring
Atrial tissue pieces were cultivated on inserts (Millicell 0.4 µM, Millipore, PICM0RG50) placed on 35-mm-diameter plates containing 1.4 mL DMEM medium (Gibco, 31053) supplemented with 10% FCS, 10 mM HEPES, pH 7.4, 1% Glutamax, 1% penicillin-streptomycin cocktail, and 200 µM beetle luciferin potassium salt. Explants were then maintained at 36 °C with 5% CO2 into a KRONOS-DIO AB-2550 (Atto) system. Luciferase signal was integrated for 1 min every 10 min during 1 week. The signal obtained was quantified and analyzed by the ATTO Dish type Luminescence Kronos software (version 2.30.243). Sinusoidal representation curves are detrended data generated by the software using temporal width set to ±12 h.
Rhythmic Tests
Real-time luciferase data were binned into 2-h increments. Ex vivo luciferase data (heart explants) were first detrended using Kronos software as previously described (Martin-Burgos et al., 2022). Luciferase signals monitored before exposition to HHT or vehicle were removed prior to statistical rhythmic tests. Data collected after the washout step were analyzed using Nitecap web application with default parameters (Brooks et al., 2022).
Protein Extraction and Simple Western Immunoassays
Cells were lysed using RIPA lysis buffer (10 mM TRIS-HCl, pH 8.00, 1 mM EDTA, 0.5 mM EGTA, 140 mM NaCl, 1% Triton, 0.1% sodium deoxycholate, and 0.1% SDS). Mouse heart proteins were extracted in the same buffer using a Minilys tissue homogenizer (Bertin Instruments) with 2.8-mm ceramic bead. The total protein amount was determined using the BCA method following manufacturer’s recommendations (BCA protein assay kit, thermo scientific, 23227). REV-ERBα protein levels as well as loading control (HSP90α/β or total protein) were analyzed by Simple Western size-based or total protein assays using a Wes system as recommended by the manufacturer (ProteinSimple). Proteins (0.5 mg/mL) were detected with primary antibodies described above. Secondary antibodies were provided by ProteinSimple (anti-rabbit 042-206 or anti-mouse 042-205, ProteinSimple). Samples were processed according to manufacturer’s recommendations. Data were analyzed using the Compass 6.1 software (ProteinSimple).
RNA Extraction, Microarray Analysis, and Analogue Drug Identification
For microarray assays, AC16 cells were treated for 6 h with 0.5 µM digoxin (n = 3), 1 µM HHT (n = 4), or corresponding vehicles (n = 3). Briefly, RNA was purified using Nucleospin RNA columns (Macherey-Nagel) following manufacturer’s recommendations. Total RNA amounts were determined by spectrophotometry using a Nanodrop One device (Thermo Scientific), and quality controls were performed using a RNA nano 6000 kit (Agilent) and a Bioanalyzer 2100 device (Agilent). Gene expression levels were determined using human Clariom S Arrays (Thermo Fisher Scientific, 902927) after RNA amplification, sscDNA labeling, and purification. Briefly, RNA was amplified using the GeneChip WT PLUS Reagent Kit (Thermo Fisher Scientific, 902280), retro-transcribed to sscDNA, and labeled using GeneChip WT Terminal Labeling Kit (Thermo Fisher Scientific, 902281), followed by hybridization on the GeneChip human Clariom S30 Array (Thermo Fisher Scientific, 902917) according to the manufacturer’s instructions. Raw data were processed using our in-house Galaxy instance “GIANT” (Galaxy-based interactive tools for analysis of transcriptomic data) (Vandel et al., 2020). Data have been deposited at the NCBI repository under the GEO number GSE222680 and GSE222682. A LIMMA differential analysis was used to determine upregulated and downregulated genes. Genes used for transcriptomic signature definition were selected with significant (false discovery rate [FDR] ≤ 0.05) log2FC set between 1.2 and ≤−0.8 or −1.2 for digoxin and HHT, respectively. These thresholds were defined to limit the number of hits. Selected gene lists were analyzed using the L1000FWD tool to identify drugs with similar transcriptomic signatures using all cellular models available in the web application (Wang et al., 2018). Duplicated signatures have been merged while keeping the highest similarity score.
Statistics
Data were plotted as means ± standard error of the mean (SEM). All statistical analyses were performed on all biological replicates using Prism (v 9.0, GraphPad Inc.). The number of biological replicates for each experiment has been detailed in corresponding figure legends. All groups were considered to have equal variances. For 2-group comparisons, a 2-sided Student’s t test was used. For multiple comparisons, a 1-way analysis of variance (ANOVA) followed by Dunnett’s multiple comparison test or 2-way ANOVA followed by a Sidak’s multiple comparisons test was applied as indicated in the figure legends. p values < 0.05 are considered as statistically significant.
Results
In Silico Identification of Potential REV-ERBα Proteostasis Modulators
In agreement with our recent study (Vinod et al., 2022), we first confirmed that a 2-h dexamethasone (dex) pulse synchronizes human AC16 cardiomyocytes revealing a time-dependent variation of total REV-ERBα protein amount, which showed a maximal expression 18-24 h after synchronization (Figure 1a). The expression of this nuclear receptor was totally inhibited by a 6-h exposure to 0.5 µM digoxin, a decrease which is abolished upon proteasome inhibition with clasto-lactacystin β-lactone (Vinod et al., 2022).
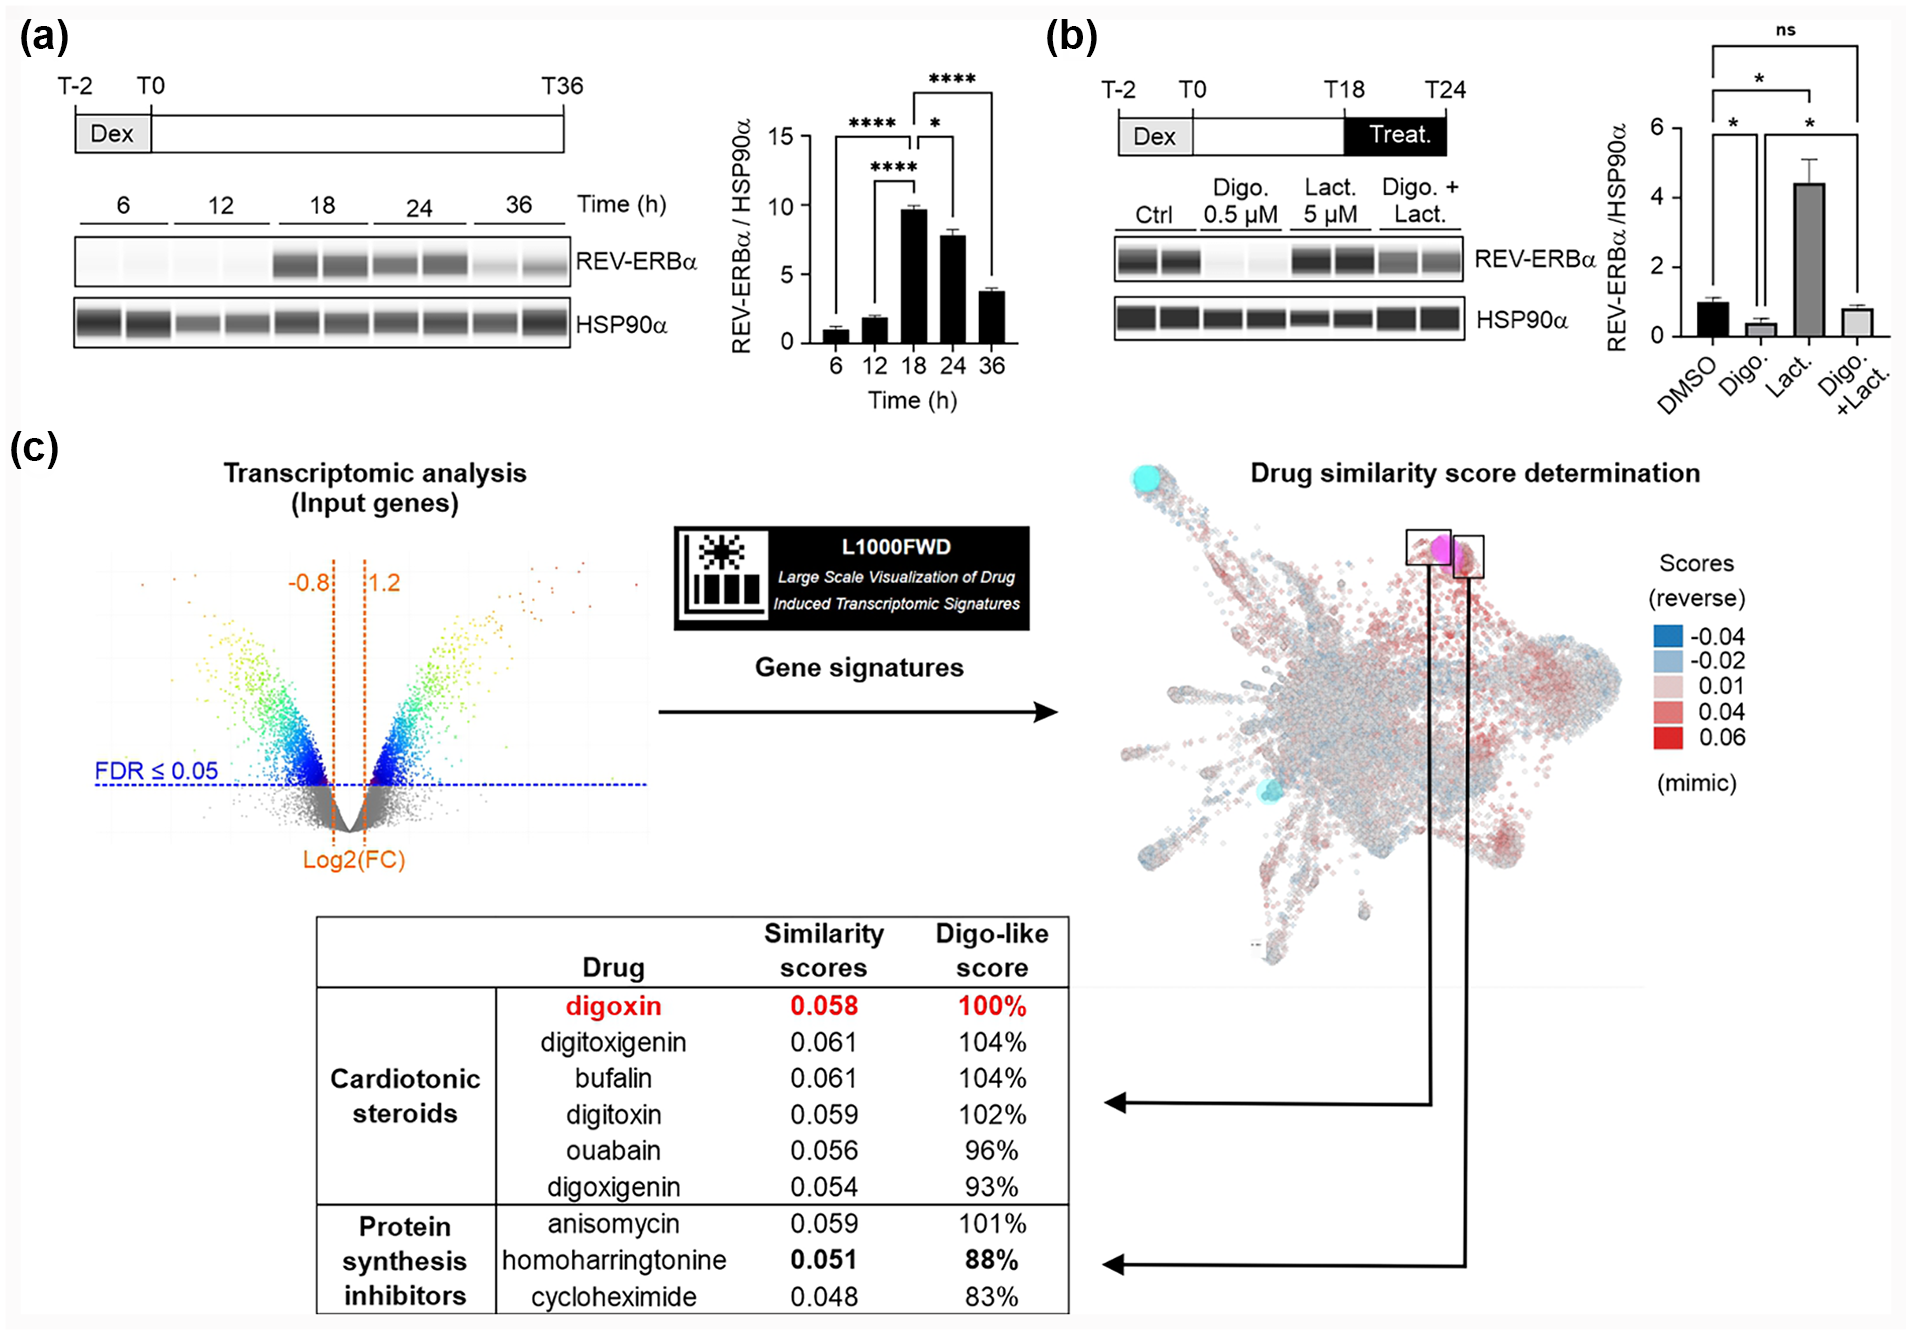
Identification of digoxin transcriptional similars. (a) Time course of REV-ERBα protein level variations (n = 2). Upper left panel: experimental scheme. Lower left panel: REV-ERBα protein fluctuations over time were determined by WES analysis of whole cell extracts from synchronized AC16. Right panel: densitometric analysis of WES data. Data were normalized to HSP90α content. (b) Digoxin (Digo.) effect on REV-ERBα/NR1D1 protein levels. Upper left panel: experimental scheme. Lower left panel: WES® analysis of REV-ERBα protein level in synchronized AC16 cells, treated for 6 h with 0.5 µM digoxin (n = 2), 5 µM clasto-lactacystin β-lactone (n = 2), both drugs (n = 2), or vehicle control (n = 2). Right panel: densitometric analysis of WES data. Data were normalized to HSP90α content. Results are expressed as mean ± standard error of the mean (SEM), and values were compared by a 1-way ANOVA followed by a Dunnett post hoc test (a) or a Brown-Forsythe and Welch ANOVA tests (b). *p < 0.05. ****p < 0.0001. Data shown are a representative experiment performed in duplicate. (c) Transcriptional similarities of digoxin treatment compared with the L1000 database. The transcriptomic profile of AC16 cells treated with digoxin (0.5 µM, 6 h) was determined by microarray analysis, and a signature similarity search was performed using L1000FWD. Left panel: clustering of gene signatures and mapping of digoxin-like molecules. Right panel: top hits as determined by the L1000FWD algorithm. The similarity score is the overlap between the input up/down genes and the signature up/down genes divided by the effective input (Wang et al., 2018). The Digo-like score is the similarity score divided by the digoxin similarity score multiplied by 100. Abbreviations: Dex = dexamethasone; Lact = clasto-lactacystin β-lactone; FDR = false discovery rate; ANOVA = analysis of variance; WES = automated western in capillary; REV-ERBα/NR1D1 = nuclear receptor subfamily 1 group D member 1.
To identify drugs that could have a similar impact on REV-ERBα protein level as digoxin, transcriptomic data from digoxin-treated AC16 cells were leveraged to obtain a list of up- and downregulated genes (fold change [FC] < x−0.8 or >x1.2). This transcriptomic profile was then analyzed using the L1000FWD tool to compare the digoxin-modulated gene pattern in AC16 cells with those induced by more than 16,000 compounds on a pool of cancer cell lines (Wang et al., 2018). Reassuringly, this analysis detected several perturbagens transcriptionally acting similar as digoxin which were structurally close cardiotonic steroids (cinobufagin, bufalin, ouabain, etc.) (Figure 1c and Suppl. Table S1). Another prominent chemical class was small molecules with potent protein synthesis inhibitory properties, such as anisomycin, narciclasine, and cephaeline (Tan et al., 1991; Dmitriev et al., 2020). Interestingly, anisomycin has already been described as a circadian modulator (Watanabe et al., 1995), further validating approach.
Time- and Dose-Dependent Effect of Homoharringtonine on REV-ERBα Protein Level
We noted a similarity score (88% of the digoxin-like score) for the anti-cancer compound HHT which exerts its beneficial anti-leukemic activity by binding to ribosomes, thereby disabling the elongation of nascent peptide chains (Tujebajeva et al., 1989). As this FDA-approved anti-cancer drug is associated with cardiovascular complications (Kantarjian et al., 2013) and also has anti-fibrotic properties in heart (Kreutzer et al., 2022), it prompted us to further characterize HHT activity on REV-ERBα protein expression in cardiomyocytes.
To do so, AC16 cells were synchronized and treated for 24 h with increasing concentrations of HHT, from 0.1 to 10 µM. In these conditions, REV-ERBα protein content was reduced by 37% with 0.1 µM HHT and was undetectable from 1 µM HHT (Figure 2a). Since the digoxin-dependent REV-ERBα degradation is significant within 6 h (or less) of treatment (Figure 1b [Vinod et al., 2022]), the effect of a shorter exposure to HHT was also tested. Here again, 4 h of treatment was enough to reduce the protein amount even with the lowest dose of HHT (Figure 2b). To assess whether HHT does not act only on cancer/transformed cells, synchronized human primary cardiomyocytes were treated for 4 h (from 20 to 24 h post-synchronization) with 1 µM HHT (Figure 2c). Again, HHT totally blunted REV-ERBα protein expression, suggesting that its mechanism of action is not specific to transformed cells.
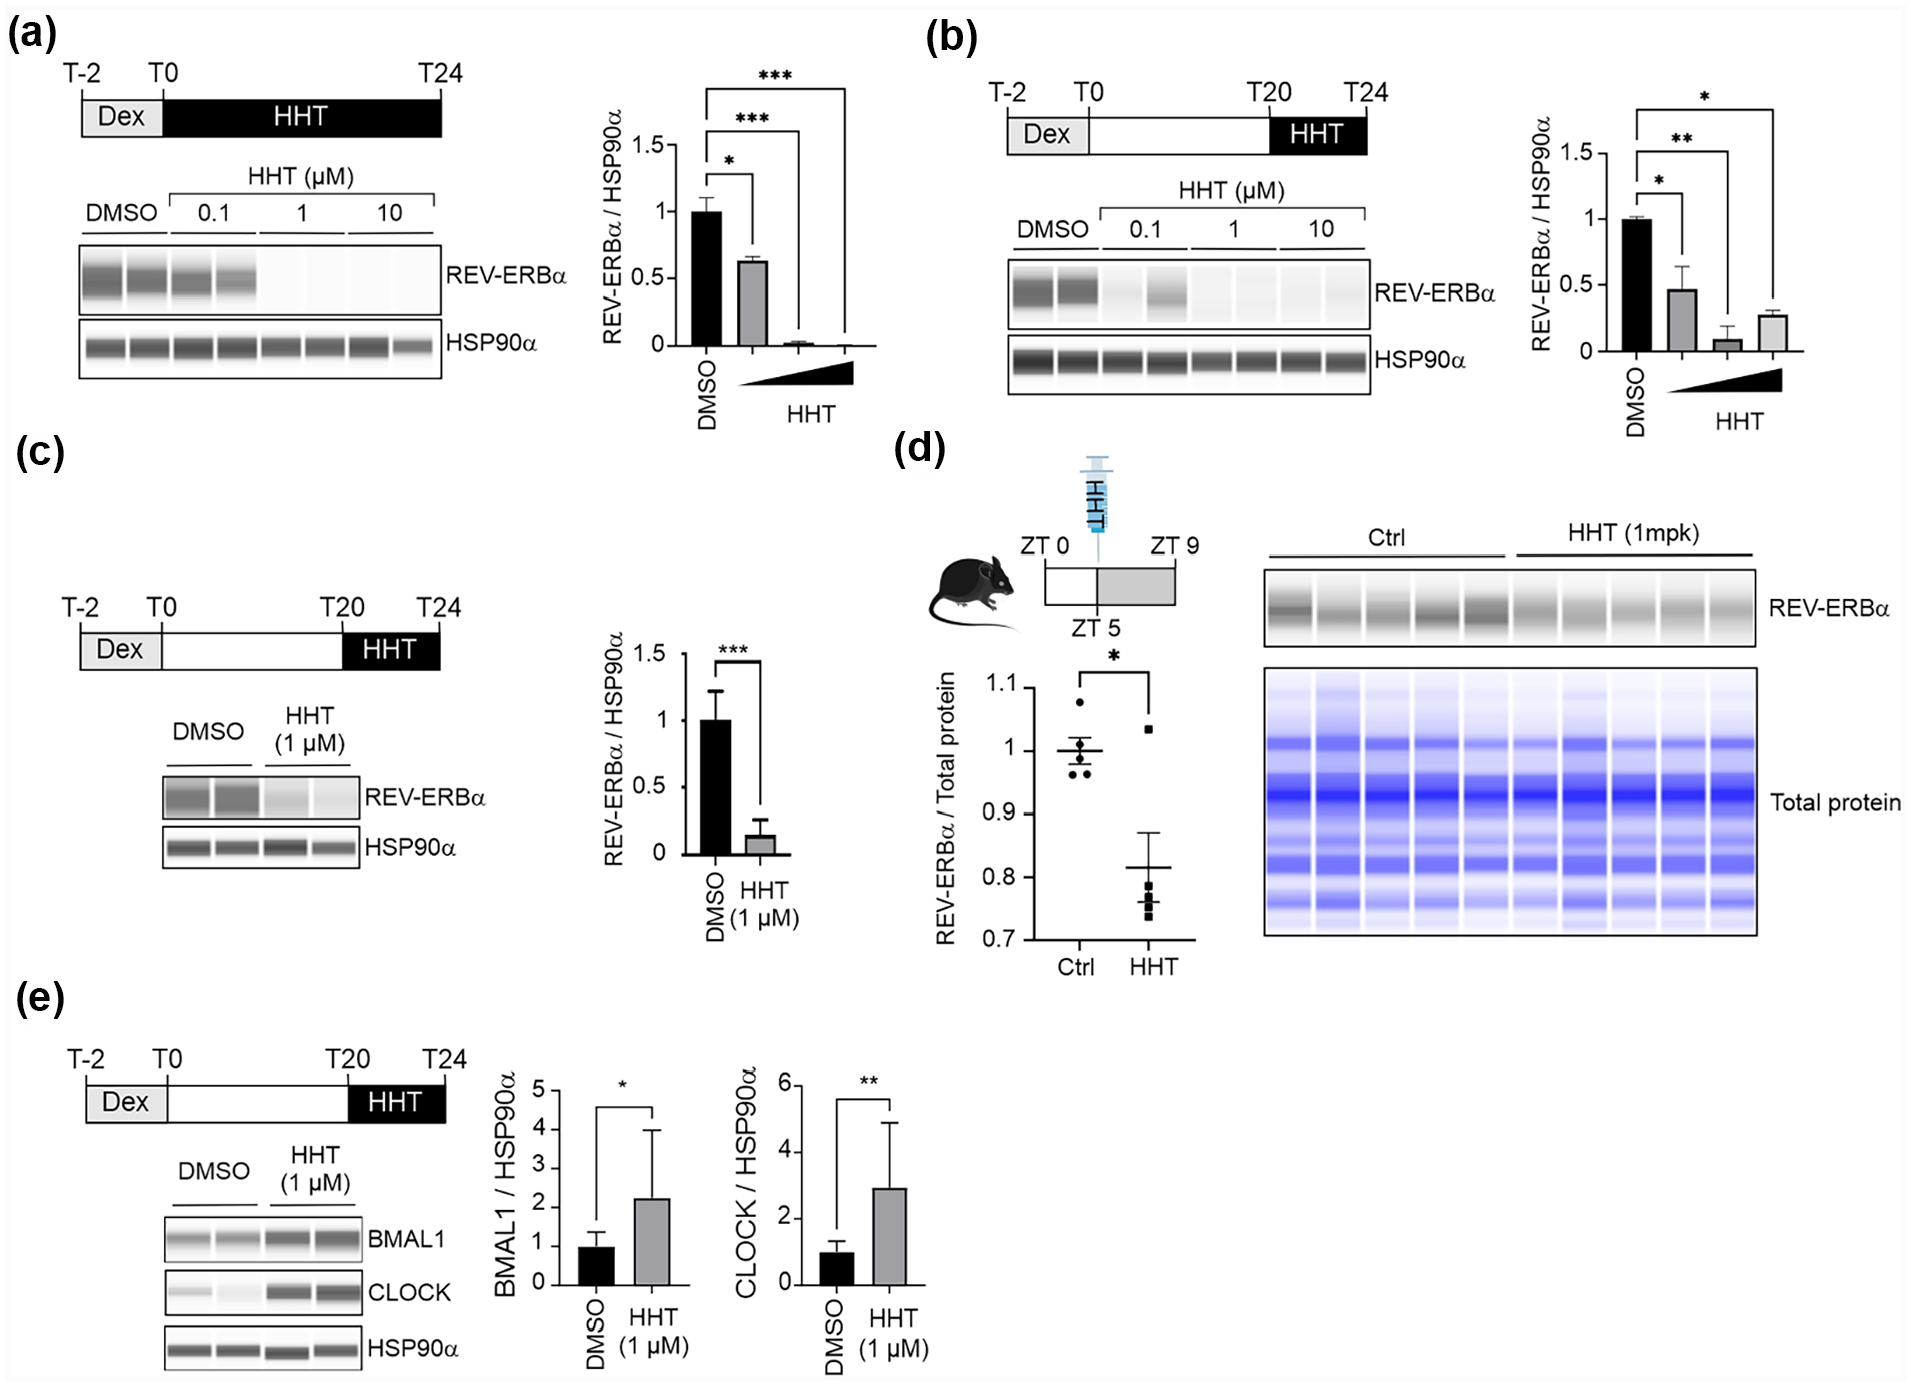
Effect of homoharringtonine (HHT) on REV-ERBα protein level in vitro and in vivo. (a) Dose-dependent effect of HHT on REV-ERBα protein levels in AC16 cells. Upper left panel: experimental scheme. Lower left panel: REV-ERBα protein levels were determined by WES analysis of synchronized AC16 whole cell extracts. Right panel: densitometric analysis of WES data. Data were normalized to HSP90α content. (b) Dose-dependent effect of HHT (short treatment) on REV-ERBα protein levels in AC16 cells. Upper left panel: experimental scheme. Lower left panel: REV-ERBα protein levels were determined by WES analysis of synchronized AC16 whole cell extracts. Right panel: densitometric analysis of WES data. Data were normalized to HSP90α content. (c) Effect of HHT (short treatment) on REV-ERBα protein levels in human primary cardiomyocytes. Upper left panel: experimental scheme. Lower left panel: REV-ERBα protein levels were determined by WES analysis of whole cell extracts from synchronized human primary cardiomyocyte. Right panel: densitometric analysis of WES data. Data were normalized to HSP90α content. (d) Effect of HHT REV-ERBα levels in mouse heart. Upper left panel: experimental scheme. HHT was injected at ZT5, that is, 4 h prior to the REV-ERBα protein peak. Hearts were collected at ZT9. Right panel: REV-ERBα protein levels were determined by WES analysis of whole heart extracts. Lower left panel: densitometric analysis of WES data. Data were normalized to total protein content as determined by WES analysis. (e) Effect of HHT (short treatment) on BMAL1 and CLOCK protein levels in AC16. Upper left panel: experimental scheme. Dex = dexamethasone. Lower left panel: REV-ERBα protein levels were determined by WES analysis of whole cell extracts from synchronized human primary cardiomyocyte. Right panel: densitometric analysis of WES data. Data were normalized to HSP90α content. Results are expressed as mean ± standard error of the mean (SEM) (a-e). Values were compared by a 1-way analysis of variance (ANOVA) followed by a Dunnett post hoc test (a, b, and e) or a t test (c and d). *p < 0.05. **p < 0.01. ****p < 0.001. Data correspond to a representative experiment with biological replicates (n = 2 for a, b, c, and e or n = 5 for d) reproduced twice (a-c) or 3 times independently (e). Abbreviations: DMSO = Dimethylsulfoxyde; REV-ERBα/NR1D1 = nuclear receptor subfamily 1 group D member 1.
So far, whether HHT can target cardiac REV-ERBα protein in vivo has not been investigated. To address this, a single dose of HHT was injected intraperitoneally (1 mg/kg) in mice at ZT5, that is, 4 h before the REV-ERBα protein zenith (ZT9 [Vinod et al., 2022]). Lu et al. (1988) have previously shown that HHT is able to reach the cardiac tissue from the dog and that 1% of the dose is still present in the organ 5 h after i.v. femoral injection. The clinical dose recommended for human is 2 injections of 1.25 mg/m2/day. Thus, for an individual of 175 cm for 70 kg, the body surface correspond to 1.85 m2 and the admitted dose is 4.625 mg/days or 0.07 mg/kg. The dose administrated to animal in our study (1 mg/kg) is based on the literature (Li et al., 2020; Wang et al., 2021) and is 15-fold higher than the human clinical recommendation and 4-fold below the toxic dose in mouse (Yakhni et al., 2019). Under our conditions, this alkaloid reduced REV-ERBα protein level by more than 20% at ZT9, its usual peak time in mouse hearts (Figure 2d). Taken together, our data show that the protein synthesis inhibitor HHT interferes with REV-ERBα protein level both in vitro and in vivo. To decipher the specificity of HHT on REV-ERBα proteostasis, BMAL1 and CLOCK protein levels were determined after a 6-h exposition to the drug. Contrasting with REV-ERBα, both transcription factors were stabilized in presence of HHT (Figure 2e).
Effects of Protein Synthesis Inhibitors on REV-ERBα Protein Level
From a mechanistic point of view, our results also suggested that cellular REV-ERBα protein content, mostly known to be regulated through the ubiquitin-proteasome pathway (Zhao et al., 2016), is also significantly regulated through its synthesis rate. Since protein translation inhibitors may interfere with the activity of many components of the translational machinery (Fan and Sharp, 2021), we aimed at identifying compounds acting upstream of the elongation step and affecting REV-ERBα protein synthesis. A transcriptomic analysis was first performed on synchronized AC16 cells treated for 4 h with 1 µM HHT to map the transcriptional blueprint of HHT against the LINCS L1000 database using the L1000FWD tool as above. In order to improve the stringency of the analysis, upregulated and downregulated gene FC threshold was set to absolute Log2 FC > 1.2 (FDR ≤ 0.05). As expected, HHT itself was identified by this analysis, together with a significant number of protein synthesis inhibitors such as anisomycin, cephaeline, and narciclasine, which were also identified as “digoxin-like” molecules (Suppl. Table S1). The 50 top hits from each L1000 analysis (digoxin and HHT) were compared with identified compounds potentially acting with a similar mechanism of action. This in silico screening allowed the identification of digoxin structural analogues (bufalin and ouabain) and of several protein synthesis inhibitors (Figure 3). Other types of anti-cancer drugs such as clofarabine, obatoclax, and others with seemingly distinct mechanisms of action were also identified by this approach (Figure 3 and Suppl. Table S1).
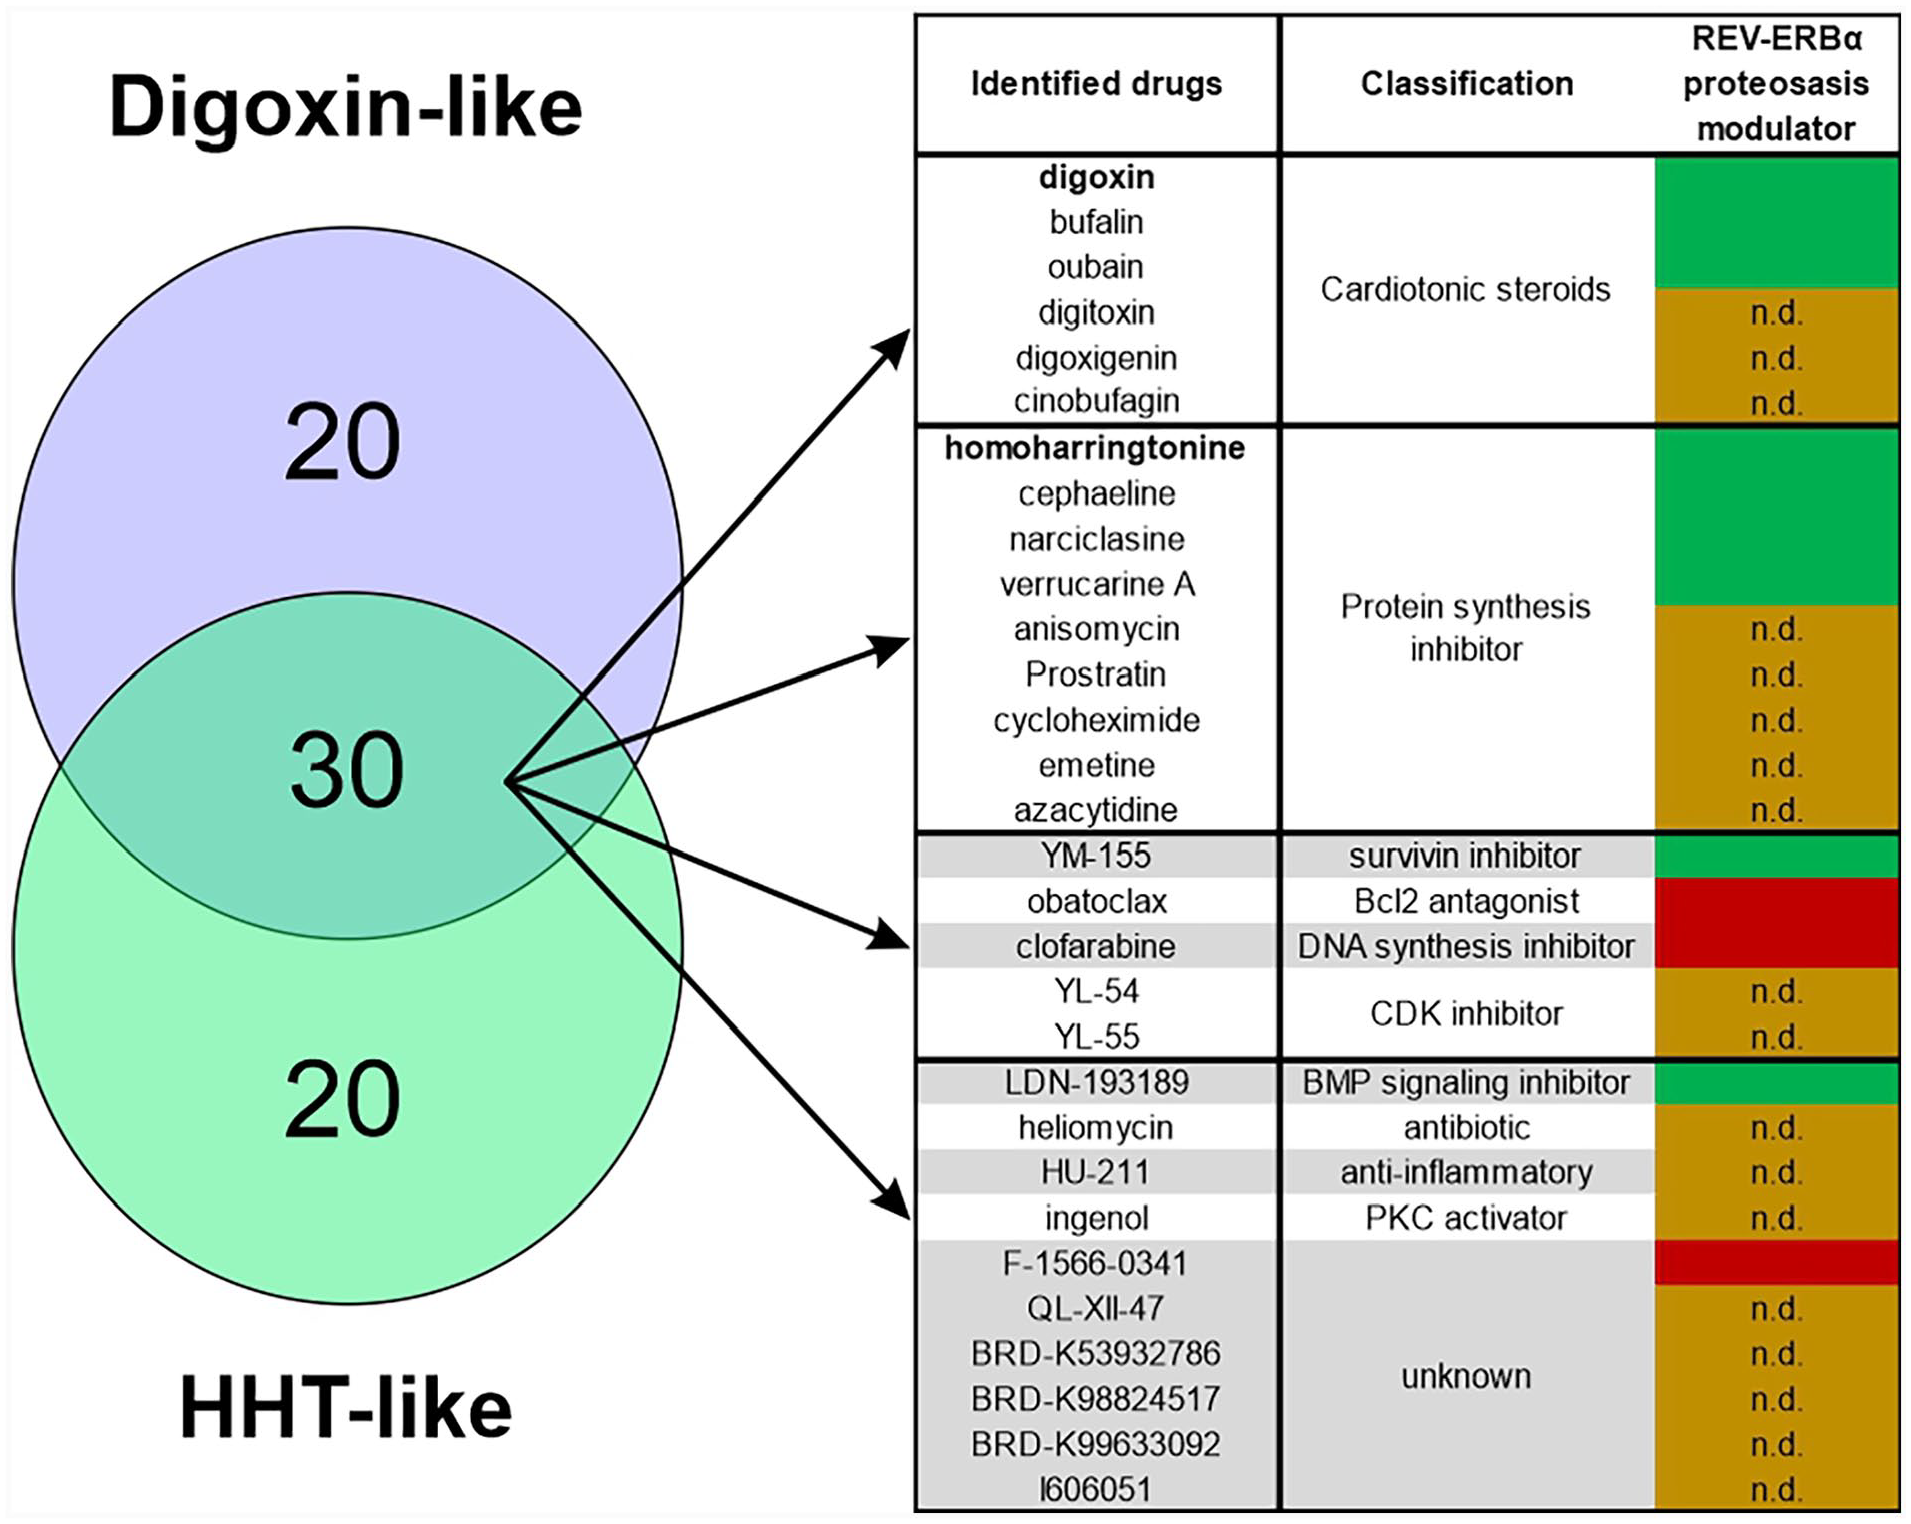
Identification of drugs having a transcriptional signature close to that of digoxin and homoharringtonine (HHT). Digoxin and HHT transcriptional similars were identified using L1000FWD. The top 50 hits from each list were crossed to identify molecules having potentially similar effects on REV-ERBα protein levels. The 30 identified common drugs (right panel) are classified according to their known targets/mechanism of action. Abbreviations: n.d. = not determined; green = triggers REV-ERBα protein level decrease; red = no effect on REV-ERBα protein level. Abbreviations: CDK = cyclin-dependent kinase; REV-ERBα/NR1D1 = nuclear receptor subfamily 1 group D member 1; BMP = bone morphogenetic protein.
We then validated this in silico approach by testing a panel of 7 of these molecules for their ability to alter REV-ERBα protein level in synchronized AC16 cells. In addition to the proteasomal activators bufalin and ouabain which were previously demonstrated to funnel REV-ERBα to the proteasome (Vinod et al., 2022), 3 out of 3 tested molecules classified as protein synthesis inhibitors were active in our REV-ERBα proteostasis assay (cephaeline, narciclasine, and verrucarin-A [Suppl. Figs. S1B and S1C]). With the exceptions of the survivin inhibitor YM-155 (Nakahara et al., 2007) and the bone morphogenetic protein (BMP) signaling inhibitor LDN-193189 (Cuny et al., 2008), none of the other compounds was active in AC16 cells (Suppl. Figs. S1B and S1C). This demonstrated that an essential arm of REV-ERBα proteostasis regulation is the protein translation process. Of note, all tested protein synthesis inhibitors act at late steps of this process, mostly at the peptidyl transferase reaction (Figure 4).
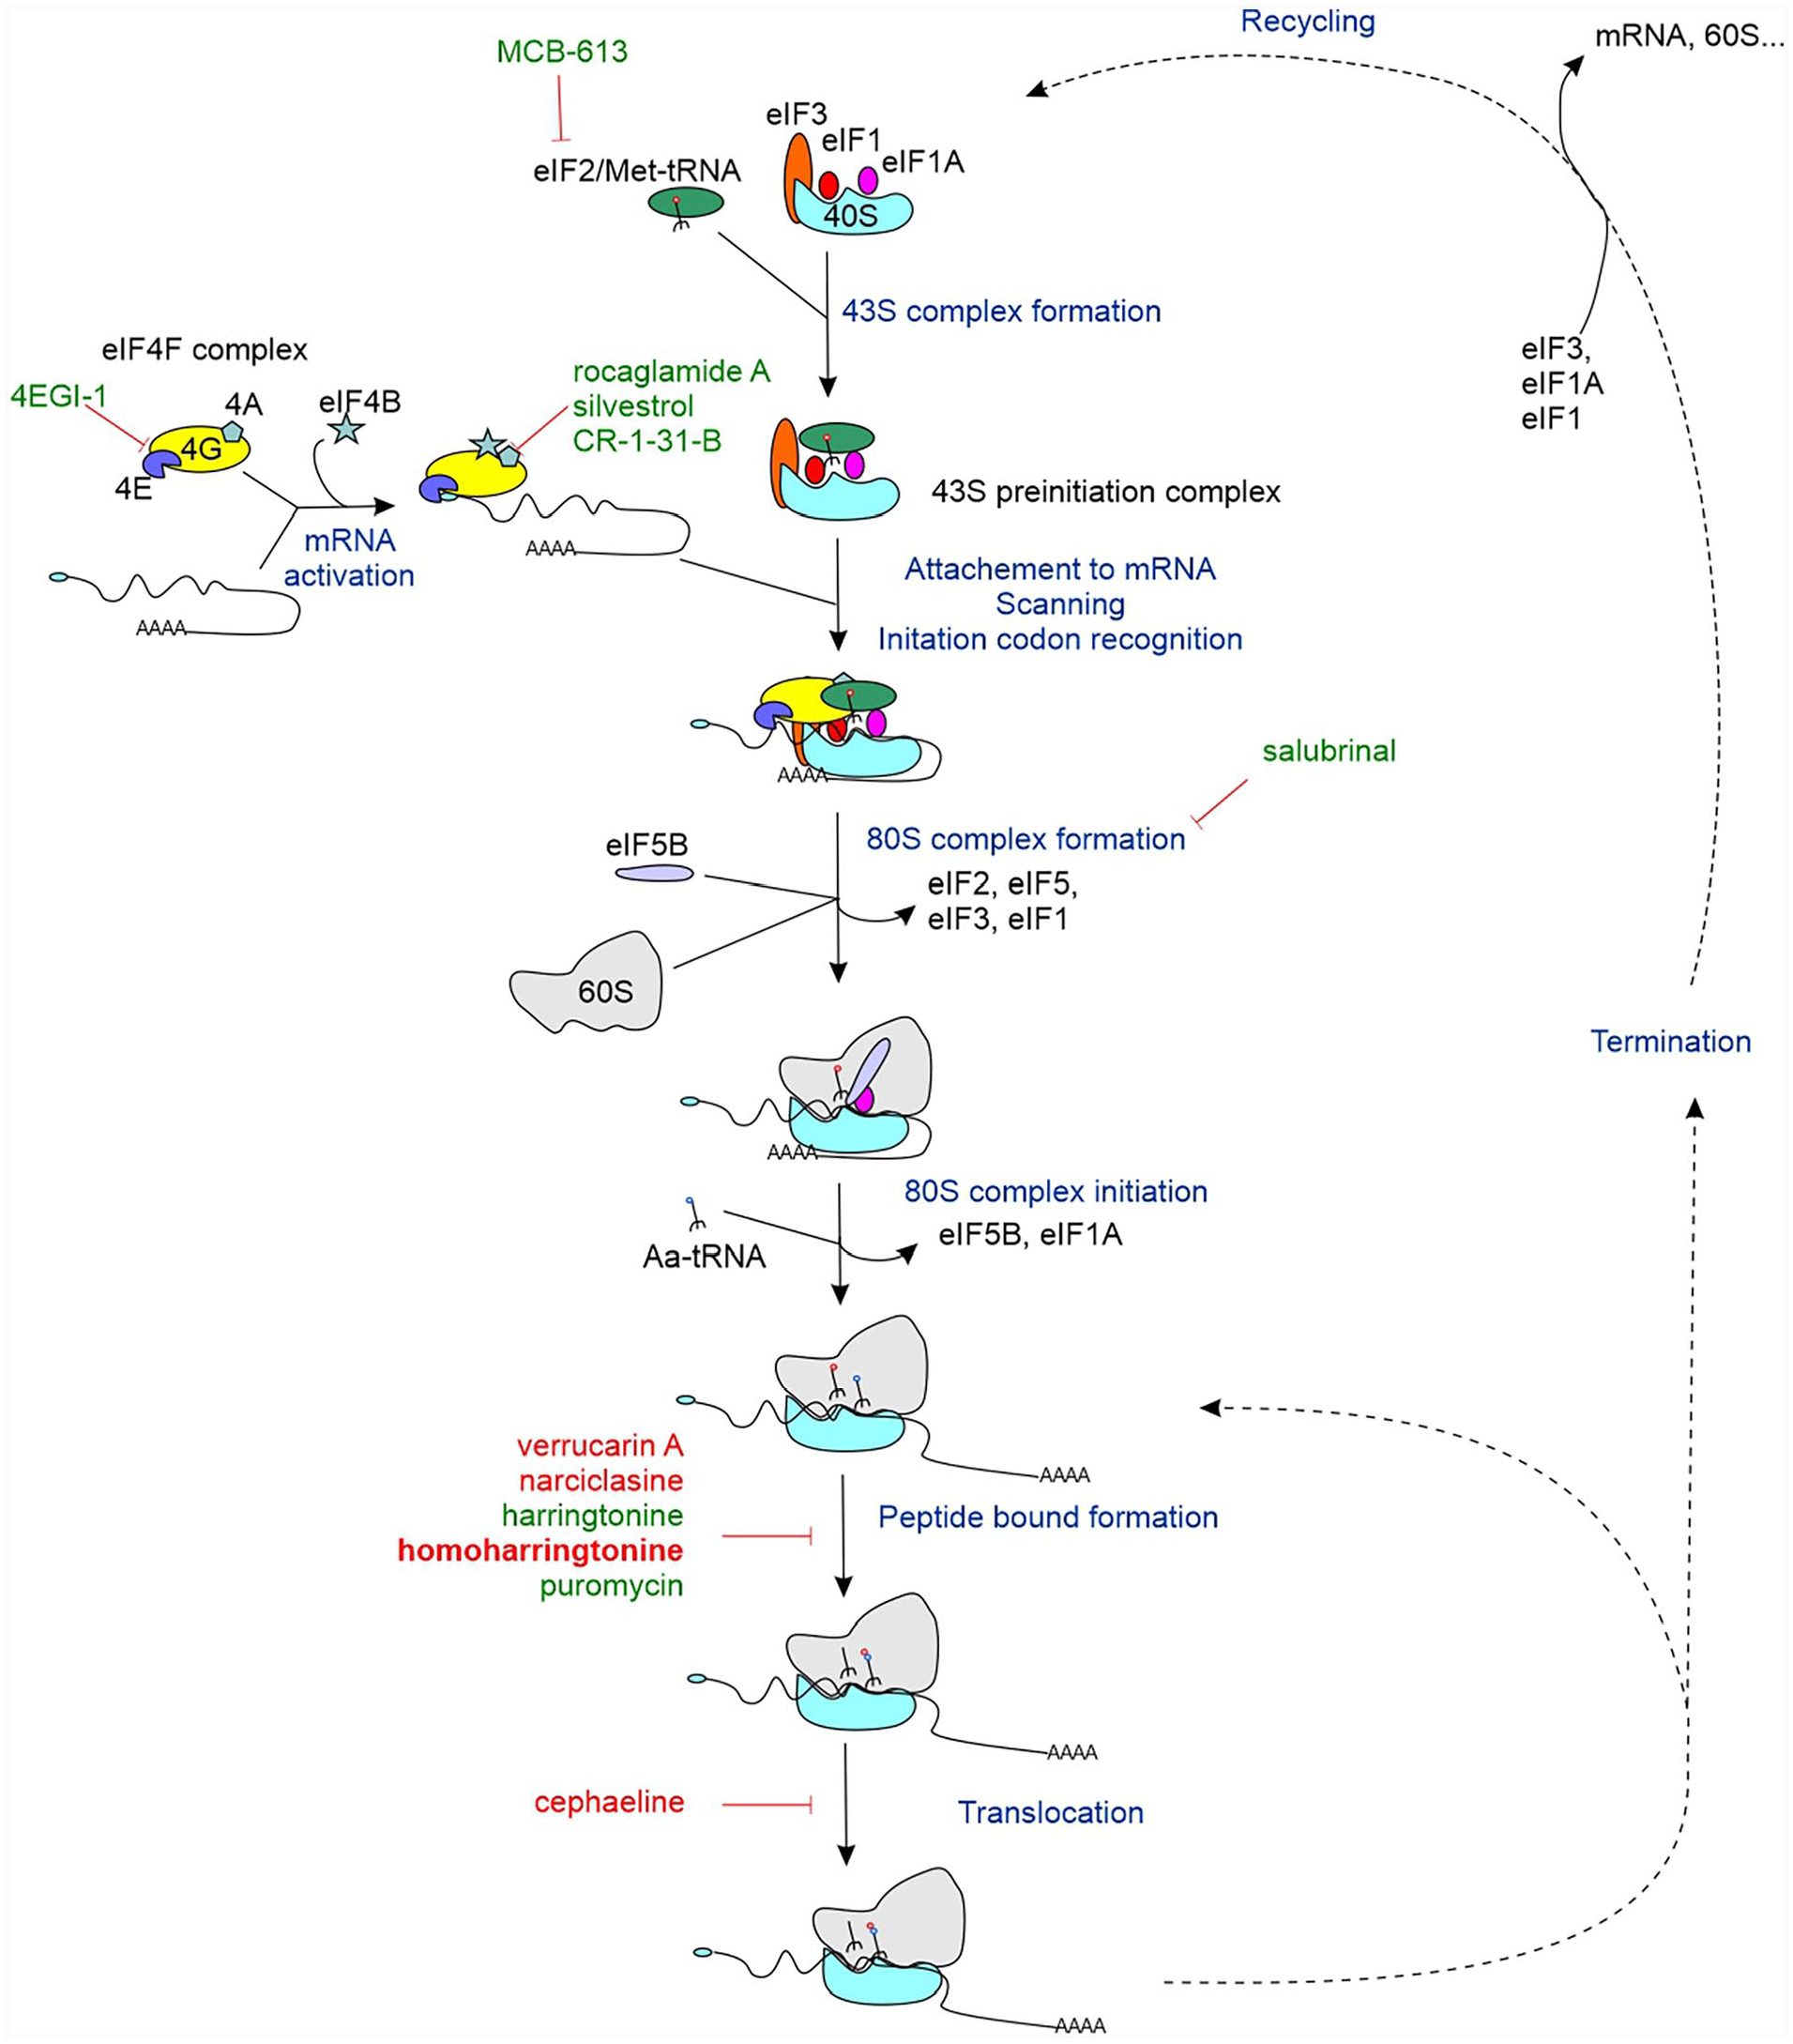
Overview of the protein synthesis pathway (adapted from Jackson et al. [2010], Wang et al. [2015], and Dmitriev et al. [2020]). In silico identified (in red) or manually selected (in green) translation inhibitors affecting REV-ERBα protein level are indicated on the graph. Abbreviations: mRNA = messenger ribonucleic acid; REV-ERBα/NR1D1 = nuclear receptor subfamily 1 group D member 1.
To gain further insights into steps required for efficient REV-ERBα translation, we further tested inhibitors acting upstream of the elongation step (Figure 4). Our previous work ruled out a contribution of the mTOR pathway in our system (Vinod et al., 2022). Compounds interfering with initiation steps such as compounds preventing eIF4E binding to eIF4G (4-EGI1), interfering with eIF4A helicase activity (rocaglamide, silvestrol, and CR-1-31-B), or preventing 80S initiation complex formation (salubrinal) were tested (Figure 4). Puromycin was tested as a widely-used molecule representative of elongation inhibitors. In the AC16 cell model, 4-EGI1 had no effect on REV-ERBα (Suppl. Fig. S1F), in opposition to its impact on REV-ERBα protein levels in synchronized U2OS cells (data not shown). All other translation inhibitors strongly reduced REV-ERBα protein amount (Suppl. Figs. S1C, S1D, and S1F). In parallel, we assessed whether the upstream ORF (uORF) located upstream of the NR1D1 locus encoding REV-ERBα (Janich et al., 2015) could have a functional importance in regulating cardiomyocytic REV-ERBα protein levels. uORFs generally have an inhibitory role on protein translation by blocking ribosome processivity, and thwarted translation at downstream CoDing Sequence (CDS) can be relieved using ISRIB (integrated stress response inhibitor), a small molecule inhibitor of the eIF2α kinase (Young and Wek, 2016). ISRIB alone had no effect on REV-ERBα protein level and was also inefficient at restoring its synthesis in presence of HHT (Suppl. Fig. S1F). Finally, treatment with the Steroid Receptor Coactivator (SRC) activator MCB-613, able to induce eIF2α phosphorylation (Wang et al., 2015), clearly reduced REV-ERBα protein level (Suppl. Fig. S1E). Thus, all tested protein synthesis inhibitors except 4-EGI1, irrespective of their mechanism of action, strongly impact REV-ERBα protein production in cardiomyocytes. Moreover, the NR1D1 uORF is not operative in our cardiomyocyte cellular model.
Protein Synthesis Inhibition by HHT Affects the Cellular Circadian Clock
Since a single administration of these drugs affected cardiac REV-ERBα proteostasis, we determined whether this nuclear receptor is the only component of the clock machinery to be affected by these perturbagens. HHT was used as a reference compound to determine potential global effects on the clock machinery. CCG mRNA expression levels in 4 h HHT-treated synchronized AC16 cells were determined (24 h after synchronization) by microarray analysis. Most of them were upregulated with the exception of PER3, CLOCK, RORA, and RORC (Figure 5a). REV-ERBα/NR1D1 and its target genes ARNTL1/BMAL1, NR1D2, CDKN1A, and NFIL3 were upregulated in agreement with the loss of REV-ERBα protein expression. Surprisingly, the other CCGs such as PER1/2 and CRY1/2 were also upregulated (Figure 5a). This was suggestive of a more general impact of HHT on circadian TTFLs, which was explored by real-time monitoring of BMAL1 and PER2 promoter activities. For this purpose, BMAL1 and PER2 promoters hooked to a luciferase gene were transfected in AC16 cells, from which luciferase activity was continuously recorded for several days. Prior to running these assays, we first assessed whether HHT interferes directly with luciferase enzymatic activity, as this is a major source for false positive detection in luciferase-based screening procedures (Berthier et al., 2021). The activity of purified recombinant luciferase enzyme was determined in the presence of varying concentrations of HHT or of a specific luciferase inhibitor as a positive control. In contrast to the Luc inhibitor, HHT did not significantly modify recombinant luciferase activity even at high concentrations (Figure 5b). Twenty hours after synchronization, transfected cells were treated for 4 h with increasing concentrations of HHT. During the 4-h treatment, the luciferase activity was transiently reduced in a dose-dependent manner in both models (Figure 5c). To understand the apparent contradiction between the observed upregulation of endogenous gene expression (Figure 5a) and downregulation of exogenous reporter activities, AC16 cells were transfected with a luciferase vector controlled by a highly constitutively active cytomegalovirus (CMV) promoter. When synchronized cells were treated for 4 h with 1 µM HHT, the bioluminescence signal decreased by about 50% (Suppl. Fig. S2). The half-life of the firefly luciferase protein being ≈ 3-4 h (Leclerc et al., 2000), this reduction of signal clearly indicated an inhibition of luciferase synthesis. Thus, the bioluminescence signal reduction observed with BMAL1 or PER2 promoter models did not reflect an alteration of promoter activities but a reduction of the luciferase mRNA translation. While these reporter models were not fully adequate to study the effect of HHT on the circadian machinery, we nevertheless noted that transient exposure to HHT was compatible with a recovery of BMAL1 or PER2 promoter activities. JTK_cycle analysis of data confirmed that rhythmicity was maintained in all conditions (Bmal-Luc q-values ≤ 0.008 and Per2-Luc q-values ≤ 0.03). HHT clearly reduced the amplitude and induced a phase shift to the right in a dose-dependent manner, without impacting the period of these oscillations. We note that the phase shift was more pronounced for the Per2-Luc signal (from 2.9 to 4.5 h) compared with the Bmal1-Luc signal (from 1.16 to 1.9 h). Cells were exposed to HHT 20 h after synchronization, thus when Bmal1 expression decreases, and when Per2 expression increases. We speculate that this observed differential phase shift results from distinct interference with multiple time-dependent processes regulating protein stability (Figure 5c).
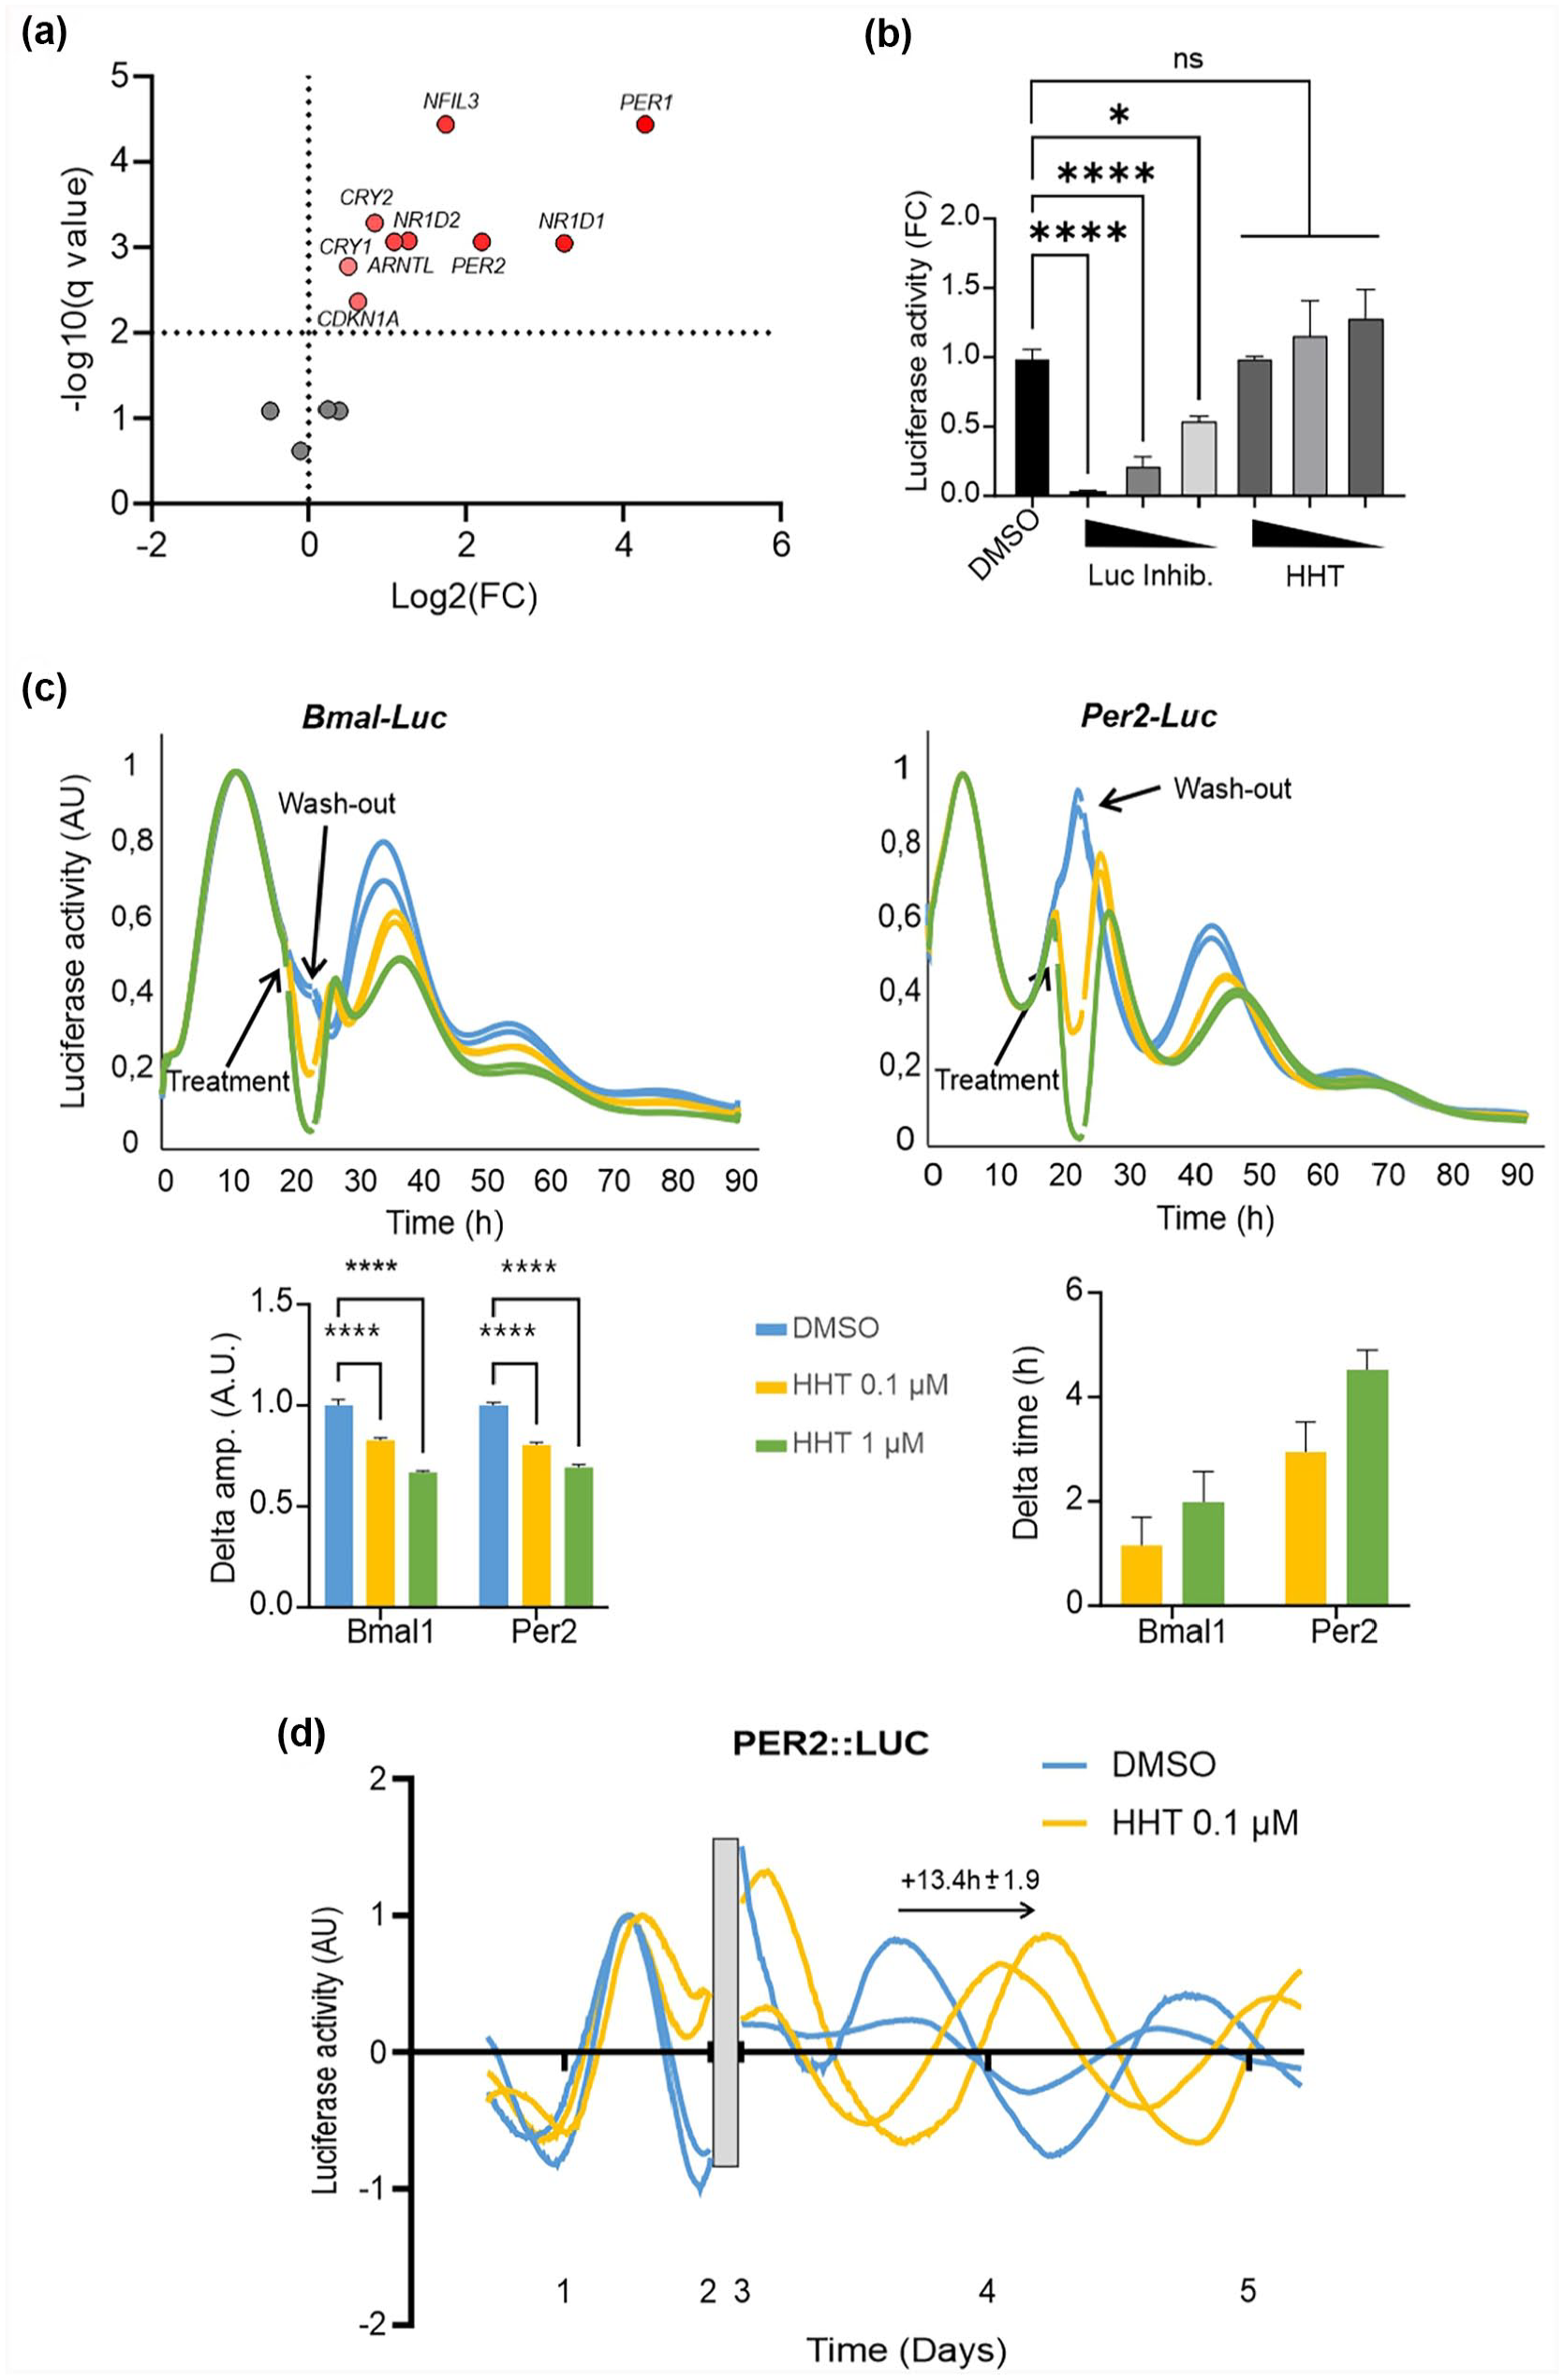
The clock machinery is disrupted by homoharringtonine (HHT). (a) Volcano plot of normalized core clock genes (CCGs) expression fold change in synchronized AC16 cells and after a 4-h treatment (n = 4) or not (n = 3) by HHT. Cells were exposed to the drug 20 h after synchronization. Statistical significance was determined by multiple unpaired t tests with a false discovery rate (FDR) set to 0.01. (b) In vitro recombinant luciferase activity assay (n = 3) in the presence of increasing doses of luciferase inhibitor II or HHT (0.1, 1, and 10 µM). Results are expressed as mean ± standard error of the mean (SEM), and values were compared by a 1-way analysis of variance (ANOVA) followed by a Dunnett post hoc test. *p < 0.05. ****p < 0.0001 (ns = non-significant). (c) Real-time luciferase reporter activity. AC16 cells were transfected by the indicated reporter gene and luciferase activity was monitored. Twenty hours after synchronization, cells were treated for 4 h with vehicle or increasing doses of HHT and then washed out 4 h later. Curves shown representative signal of 2 biological replicates for each conditions. Histograms correspond to the variation in signal amplitude compared with DMSO (Delta amp.) and the shift compared with control condition (DMSO) at zeniths (Delta time) for 2 independent experiments processed in duplicate (n = 4). Statistical significance was determined by a 2-way ANOVA followed by a Sidak’s multiple comparisons test (****p < 0.0001). (d) Ex vivo PER2::LUC fusion protein activity in transgenic mouse atrial explants. After collection of hearts, the luciferase activity was monitored in real time for 2 days from isolated heart explants. Explants were then treated (n = 2) or not (n = 2) for 24 h with 0.1 µM HHT and then washed out as above. Signals was presented as detrended data. The gray box indicates the treatment window. Within this interval, curves have been removed to mask system opening and fresh luciferase addition generated optical artifacts non-standardizable between the 2 independent experiments; DMSO = Dimethylsulfoxyde.
To further investigate a potential global alteration of the cardiac clock machinery during HHT therapy, we used an alternative ex vivo model based on the monitoring of a transgenic PER2::LUC fusion protein to directly interrogate endogenous PER2 protein level via the activity of the luciferase moiety activity (Yoo et al., 2004). Atrial explants from PER2::LUC mice were transiently exposed to 100 nM HHT for 24 h, while luciferase activity was recorded in real time for several days before and after treatment. HHT transiently blunted PER2::LUC fusion protein bioluminescent signal (data not shown). After wash out, PER2::LUC fusion protein recovered a cyclic, circadian activity, JTK-cycle analysis: DMSO (vehicle) q-value = 0.002 and HHT q-value = 7.5e-11, with a marked 12-h phase shift to the right which was stable over time (Figure 5d). Taken together, these observations suggest that even a transient interference with protein synthesis may propagate long-lasting effects on circadian rhythmicity. In addition, PER2::LUC signals were delayed by 13.4 h (±1.9 h), suggesting that this translation inhibition-induced phase shift is probably due to the HHT-dependent resetting of the cardiac circadian clock (Figure 5d).
Conclusion
Knowing the interconnection between the clock machinery and main body functions, for example, metabolic, cardiovascular, and immune regulations, a regular and synchronously paced circadian rhythm in all organs is required for the preservation of physiological homeostasis. Several groups have shown that protein synthesis inhibitors such as cycloheximide and anisomycin were able to affect the circadian rhythm (Jacklet, 1977; Olesiak et al., 1987; Watanabe et al., 1995). However, this concept has been set aside to focus mostly on the equilibrium between mRNA synthesis and degradation of both transcripts and proteins to explain the cyclicality of the circadian regulations (Dibner et al., 2009; Westermark and Herzel, 2013; Luck et al., 2014; Vinod et al., 2022). Here we show that controlling protein translation at various steps severely affected REV-ERBα proteostasis in particular and the molecular clock in general. While this observation may seem trivial at first, we note that potential iatrogenic effects resulting from a prolonged exposure of patients to these compounds affecting the circadian rhythm are not considered. Second, the use of these quite common reagents such as puromycin in biological experiments may significantly affect circadian rhythm-controlled biological responses and generate confounding effects which are not integrated in data analysis. Finally, we note that protein translation is itself cyclic and connected to circadian regulatory processes (Atger et al., 2015; Sinturel et al., 2017; Castillo et al., 2022), highlighting a complex connection between protein translation control and the molecular clock. Nevertheless, to the best of our knowledge, no recent investigation has been developed to analysis the effect of protein synthesis inhibitors on the circadian clock itself.
In addition to its selective cytotoxicity on cancer cells through SRC coactivator “super-activation” (Wang et al., 2015; Bazzaro and Linder, 2020), MCB-613 has cardioprotective effects post-myocardial infarction (Mullany et al., 2020). We previously demonstrated that the reduction of REV-ERBα activity or of protein amount improved recovery of the heart after an ischemia/reperfusion episode (Montaigne et al., 2018; Vinod et al., 2022). Therefore, it can be hypothesized that part of MCB-613’s cardioprotective effect stems from its ability to blunt REV-ERBα protein synthesis. Similarly, narciclasine (a.k.a. lycoricidinol), an anti-cancer alkaloid structurally unrelated to MCB-613, but also reducing REV-ERBα protein level, also shows cardioprotective properties after acute myocardial injury (Tang et al., 2021).
The (potential) use of protein synthesis inhibitors in cancer may be extended to other pathologies caused by fungi, parasites and viruses including SARS-CoV2 (Choy et al., 2020; Müller et al., 2021; Shahid and Shahzad-Ul-Hussan, 2021). Enlarging their spectrum of therapeutically applications has prompted many clinical evaluations in distinct pathologies, on the sole basis of their ability to reprogram cellular translatomes. As an example, eIF4A inhibitors (e.g., rocaglates) are powerful CAP-dependent translational inhibitors and their entry into clinical evaluation relies mostly on this property. However, cytotoxic effects of rocaglates are much more complex and involve signaling pathways activation (Ho et al., 2021). Our data highlight unsuspected effects of rocaglates and other translational inhibitors on circadian rhythm, thereby potentially affecting numerous biological processes such as metabolism and heart and muscle physiology.
Finally, we note that transient HHT treatment induced a long-lasting circadian rhythm phase shift. Therefore, depending on the relative bioavailability of this and of other tested compounds, this raises the possibility of drug-induced organ(s)-specific circadian phase shift and pathological outcomes. The effect observed on the heart in this study should encourage further investigation of possible consequences on other organs. Indeed, tissue-selective disruption of molecular clock components may have severe effects on behavior, cardiac physiology and metabolic homeostasis (Guan and Lazar, 2021), calling for a careful investigation of core molecular clock component levels during and after administration of translational inhibitors, as other zeitgebers such as food or light may restore or not the clock when the drug is cleared off the organ.
Supplemental Material
sj-docx-1-jbr-10.1177_07487304231202561 – Supplemental material for The Molecular Circadian Clock Is a Target of Anti-cancer Translation Inhibitors
Supplemental material, sj-docx-1-jbr-10.1177_07487304231202561 for The Molecular Circadian Clock Is a Target of Anti-cancer Translation Inhibitors by Alexandre Berthier, Céline Gheeraert, Manuel Johanns, Manjula Vinod, Bart Staels, Jérôme Eeckhoute and Philippe Lefebvre in Journal of Biological Rhythms
Supplemental Material
sj-jpg-2-jbr-10.1177_07487304231202561 – Supplemental material for The Molecular Circadian Clock Is a Target of Anti-cancer Translation Inhibitors
Supplemental material, sj-jpg-2-jbr-10.1177_07487304231202561 for The Molecular Circadian Clock Is a Target of Anti-cancer Translation Inhibitors by Alexandre Berthier, Céline Gheeraert, Manuel Johanns, Manjula Vinod, Bart Staels, Jérôme Eeckhoute and Philippe Lefebvre in Journal of Biological Rhythms
Supplemental Material
sj-jpg-3-jbr-10.1177_07487304231202561 – Supplemental material for The Molecular Circadian Clock Is a Target of Anti-cancer Translation Inhibitors
Supplemental material, sj-jpg-3-jbr-10.1177_07487304231202561 for The Molecular Circadian Clock Is a Target of Anti-cancer Translation Inhibitors by Alexandre Berthier, Céline Gheeraert, Manuel Johanns, Manjula Vinod, Bart Staels, Jérôme Eeckhoute and Philippe Lefebvre in Journal of Biological Rhythms
Footnotes
Acknowledgements
This work was supported by grants from INSERM, Région Hauts de-France and Université de Lille (START’AIRR REV-ERBalpha/SAS20215), and LABX EGID (ANR-10-LABX-0046). MJ is supported by a Bourse d’excellence Wallonie-Bruxelles International (WBI) World (ref. SOR/2019/441207) and a Sheila Sherlock fellowship from the European Association for the Study of Liver (EASL). BS is a recipient of an Advanced ERC Grant (694717).
Author contributions
Conceptualization: AB, JE, PL, and BS. Experimentation: AB, CG, MJ, and MV. Writing: AB and PL. Funding acquisition: PL and BS.
Conflict of interest statement
The authors have no potential conflicts of interest with respect to the research, authorship, and/or publication of this article.
Note
Supplementary material is available for this article online.
References
Supplementary Material
Please find the following supplemental material available below.
For Open Access articles published under a Creative Commons License, all supplemental material carries the same license as the article it is associated with.
For non-Open Access articles published, all supplemental material carries a non-exclusive license, and permission requests for re-use of supplemental material or any part of supplemental material shall be sent directly to the copyright owner as specified in the copyright notice associated with the article.