
Abstract
The circadian timing system controls absorption, distribution, metabolism, and elimination processes of drug pharmacokinetics over a 24-h period. Exposure of target tissues to the active form of the drug and cytotoxicity display variations depending on the chronopharmacokinetics. For anticancer drugs with narrow therapeutic ranges and dose-limiting side effects, it is particularly important to know the temporal changes in pharmacokinetics. A previous study indicated that pharmacokinetic profile of capecitabine was different depending on dosing time in rat. However, it is not known how such difference is attributed with respect to diurnal rhythm. Therefore, in this study, we evaluated capecitabine-metabolizing enzymes in a diurnal rhythm-dependent manner. To this end, C57BL/6J male mice were orally treated with 500 mg/kg capecitabine at ZT1, ZT7, ZT13, or ZT19. We then determined pharmacokinetics of capecitabine and its metabolites, 5′-deoxy-5-fluorocytidine (5′DFCR), 5′-deoxy-5-fluorouridine (5′DFUR), 5-fluorouracil (5-FU), in plasma and liver. Results revealed that plasma Cmax and AUC0-6h (area under the plasma concentration-time curve from 0 to 6 h) values of capecitabine, 5′DFUR, and 5-FU were higher during the rest phase (ZT1 and ZT7) than the activity phase (ZT13 and ZT19) (p < 0.05). Similarly, Cmax and AUC0-6h values of 5′DFUR and 5-FU in liver were higher during the rest phase than activity phase (p < 0.05), while there was no significant difference in liver concentrations of capecitabine and 5′DFCR. We determined the level of the enzymes responsible for the conversion of capecitabine and its metabolites at each ZT. Results indicated the levels of carboxylesterase 1 and 2, cytidine deaminase, uridine phosphorylase 2, and dihydropyrimidine dehydrogenase (p < 0.05) are being rhythmically regulated and, in turn, attributed different pharmacokinetics profiles of capecitabine and its metabolism. This study highlights the importance of capecitabine administration time to increase the efficacy with minimum adverse effects.
Daily rhythms are cyclic changes in behavior and physiology in organisms with a period of approximately 24 h (Lévi et al., 2010) such as memory, sleep, heart rate, and blood pressure (Allada and Bass, 2021; Kavakli et al., 2022). Moreover, many processes related to drug pharmacokinetics such as metabolism and detoxification, gastrointestinal tract motility, gastric pH, expression of plasma proteins, liver and kidney blood flow, glomerular filtration rate display temporal variations (Lévi et al., 2010). A large number of genes are rhythmically expressed in the liver and encode enzymes involved in metabolism and detoxification (Dibner et al., 2010). In addition, many genetic and epidemiological studies relate several diseases to circadian rhythm disruptions (Green et al., 2008; Kavakli et al., 2017; Onat et al., 2020; Patke et al., 2017; Pellegrino et al., 2014).
The tolerability/toxicity and efficacy of over 40 anticancer drugs may vary depending on the drug administration time (Kettner et al., 2014; Levi and Schibler, 2007; Ozturk et al., 2017). Studies suggest that such differences are due to the circadian control of the pharmacological processes in drug pharmacokinetics such as absorption, distribution, metabolism, and elimination by circadian clock (Lévi et al., 2010).
Recent chronotherapy studies revealed that changes in capecitabine administration time may cause some variations in efficacy and toxicity of capecitabine (Akgun et al., 2014; Bajetta et al., 2014; Pilancı et al., 2016; Roosendaal et al., 2020; Santini et al., 2007). Capecitabine is an orally administered fluoropyrimidine derivative anticancer drug. It is converted to its active metabolite, 5-fluorouracil (5-FU), with a three-step enzymatic conversion via carboxylesterase (CES), cytidine deaminase (CDA), and pyrimidine phosphorylases (Thymidine phosphorylase: TP and uridine phosphorylase: UPP; Reigner et al., 2001). As an antimetabolite drug, 5-FU both inhibits DNA synthesis and disrupts the normal functions of DNA and RNA (Longley et al., 2003). In a clinical study by our group when capecitabine was administered to patients in the morning and at noon, plasma capecitabine AUC0-4h (area under the plasma concentration-time curve from 0 to 4 h) values differed (Pilancı et al., 2016). However, time-dependent variations in the plasma levels of capecitabine were not significant in this study due to the small sample size. On the contrary, another study revealed that no diurnal rhythm was observed in the plasma pharmacokinetics of capecitabine, 5′-deoxy-5-fluorocytidine (5′DFCR), 5′-deoxy-5-fluorouridine (5′DFUR), and 5-FU in patients (Roosendaal et al., 2020). A recent study showed diurnal variations in the pharmacokinetics of capecitabine in rats (Kobuchi et al., 2018). Since 5′DFUR levels are very low due to low levels of CDA in rat plasma, this animal model is not considered as a suitable one for the pharmacokinetic assessment of capecitabine (Shindoh et al., 2006). However, it is still not known why capecitabine pharmacokinetic profile is different at molecular level. To address this question, we investigated capecitabine-metabolizing enzyme levels at four different time points (ZT1, ZT7, ZT13, and ZT19) in this study. Our results revealed that the pharmacokinetic profile of capecitabine is quite variable when administered at different ZTs of animals. Capecitabine-metabolizing enzymes (CES1, CES2, CDA, UPP2, and dihydropyrimidine dehydrogenase [DPD]) were being produced in a diurnal rhythm-dependent manner and attributed to different pharmacokinetic profiles. Our results suggest that administration of capecitabine based on day and night time may enhance its tolerability and improve therapeutic results.
Materials and Methods
Animals and Their Synchronization
Male C57BL/6J mice with the ages of 10 to 12 weeks were obtained from Istanbul University Aziz Sancar Institute of Experimental Medicine. Animal experiments were approved by Istanbul University Animal Experiments Local Ethics Committee—IUHADYEK (2018/11). Animals were housed in the Experimental Animal Care and Accommodation Unit of Istanbul University Faculty of Pharmacy (EDEHAB) in temperature (21 ± 1 °C) and humidity-controlled rooms under 12 h of light-dark cycle (LD 12:12) with ad libitum access to food and water. Mice were synchronized for 3 weeks prior to the beginning of experiments, and synchronization was confirmed by Western blot analysis. Light intensity at cage level was between 220 and 315 lux. Dim red light (7 lux) was used for experimental procedures during the dark phase. Zeitgeber Time (ZT) 0 corresponds to light onset and ZT12 corresponds to dark onset. All mice were randomly selected for the study groups.
Chemicals and Reagents
Capecitabine was kindly provided by Koçak Farma (Istanbul, Turkey). 5′-DFCR and 5′DFUR were purchased from TCI Chemicals (Tokyo, Japan). 5-FU was obtained from Alfa Aesar (Massachusetts, USA). All other chemicals and solvents were purchased from Merck (Darmstadt, Germany).
Study Design
For pharmacokinetic analyses, capecitabine was dissolved in propylene glycol: distilled water (25:75) and orally administered to the animals (500 mg/kg) as a single dose at ZT1, ZT7, ZT13, and ZT19. The drug administration times were chosen at 6-h intervals as two time points in each of the activity and rest phases to determine the peak and trough times. Blood samples were collected under sevoflurane anesthesia by cardiac puncture at 0.25, 0.5, 1, 2, 4, and 6 h after capecitabine administration (n = 5 for each time point). After cervical dislocation, livers were quickly isolated and snap-frozen in liquid nitrogen. Blood samples were collected in ethylenediaminetetraacetic acid (EDTA) tubes and immediately centrifuged at 4000 rpm for 10 min at 4 °C. For inhibition of enzymatic conversion, NaOH at 2% of the total plasma volume was added to the plasma samples. Plasma and liver levels of capecitabine and its metabolites were determined by high performance liquid chromatography (HPLC) as described below.
In protein expression studies, five groups (ZT1, ZT7, ZT13, ZT19, and ZT1′) were used. We repeated ZT1 (it is shown as ZT1′) to complete the 24-h cycle and to show the rhythmic protein expression with cosinor analysis. For protein expression studies, control animals were treated with vehicle at ZT1, ZT7, ZT13, ZT19, and ZT1′ sacrificed by cervical dislocation 15 min after oral gavage (n = 5 for each ZT). Liver samples were collected and snap-frozen in liquid nitrogen. All samples were stored at −80 °C until analyses. A total of 145 experimentally naive C57BL/6 J male mice were used for animal experiments.
Western Blot Analyses
We determined the protein levels of the enzymes in liver metabolizing the capecitabine, in a time-dependent manner, by Western blot. The protein levels of CES1, CES2, CDA, uridine phosphorylase 2 (UPP2), and DPD were measured. To verify oscillations of core clock components of BMAL1 and CRY1, the protein levels of BMAL1 and CRY1 were also measured.
Liver samples were homogenized in RIPA buffer (50 mM Tris, 150 mM NaCl, 1% Triton-X, 0.1% sodium dodecyl sulfate (SDS)) with fresh protease inhibitor cocktail (PIC), using Dounce homogenizer (Thomas Scientific, USA) and incubated on ice for 10 min. Homogenates were centrifuged at 13,000 × g for 15 min, and supernatant was removed. Protein concentrations were determined using Pierce Protein Assay Kit (Thermo Scientific, USA) following the manufacturer’s protocol. Lysates were incubated with 4X Laemmli buffer, 277.8 mM Tris-HCl pH:6.8, 4.4% lithium dodecyl sulfate (LDS), 44.4% (w/v) glycerol, 0.02% Bromophenol blue, 5% volume of beta Mercaptoethanol, at 95 °C for 10 min. Proteins were separated on sodium dodecyl sulfate polyacrylamide gel electrophoresis (SDS-PAGE) and transferred to polyvinylidene difluoride (PVDF) membrane (Millipore, USA) as described previously (Cal-Kayitmazbatir et al., 2021; Doruk et al., 2020). Briefly, membrane was blocked with 5% milk in Tris-buffered saline-Tween 20 (TBS-T) and immunoblotted with specific primary antibody. After washing three times in TBS-T, membranes were probed with HRP conjugated secondary antibodies overnight at 4 °C. Membranes were washed three times in TBS-T, and chemiluminescence was detected using BioRad ChemiDoc Imaging System (Bio-Rad, USA). Amount of each protein was quantified using Image Lab Software (Bio-Rad, USA).
Following primary and secondary antibodies were used in Western blot analyses: BMAL1 (Santa Cruz, USA, sc-365645), CRY1 (Bethyl, USA, A302-614A), CES1 (Abcam, USA, ab45957), CES2 (R&D Systems, USA, AF5280), CDA (Sigma, USA, SAB1300717), UPP2 (Thermo Fisher, USA, PA5-50894), DPD (Abcam, USA, ab180609), β-actin (Cell Signaling, USA, 8H10D10), HRP conjugated anti-goat IgG (R&D Systems, USA, HAF109), HRP conjugated anti-rabbit IgG (Cell Signaling, USA, 7074), and HRP conjugated anti-mouse m-IgGκ BP (Santa Cruz, USA, sc-516102).
Determination of Capecitabine Concentrations in Mouse Plasma and Liver
Plasma and liver concentrations of capecitabine were measured by a validated HPLC method with minor modifications (Farkouh et al., 2010). HPLC system consisting of 2695 separations module and 2489 UV/Vis detector (Waters, USA) were used for analysis. Separation was performed on a C18 RP column (150 × 4.6 mm2, 5 μm; Phenomenex, USA) with a C18 guard column (4 × 3.0 mm2; Phenomenex, USA) at 40 °C. The mobile phase consisted of HPLC grade purity water and methanol (50:50, v/v), and flow rate was 0.6 mL/min. Capecitabine was detected at 305 nm and the retention time was 13.5 min. Capecitabine was separated from matrix compounds by solid-phase extraction (SPE). First, Oasis HLB cartridge (Waters, USA) was washed with 1 mL of methanol and then pre-conditioned with 1 mL of water. After applying 100 µL of plasma sample on the cartridge, cartridge was washed with 250 µL water-methanol (95:5; v/v), and capecitabine was eluted from the column with 200 µL methanol.
The developed method was validated for selectivity, linearity, precision, accuracy, and recovery. Selectivity was performed using six different sources of blank plasma. They were extracted and analyzed, and the responses at the retention times of the analytes were assessed. Calibration standards were prepared at 0.1 to 20 μg/mL concentrations and analyzed in duplicate in three independent runs. To assess linearity, the coefficient of correlation (R2) was 0.9979. The LLOQ, defined as the lowest concentration at which both precision and accuracy were less than or equal to 20%, was evaluated by analyzing samples prepared in six replicates. The recovery of capecitabine was determined by comparing the mean peak areas of the regularly pretreated QC samples at three concentration levels with those of spike-after-extraction samples.
Determination of 5′DFCR and 5′DFUR Concentrations in Mouse Plasma and Liver
Plasma and liver concentrations of 5′DFCR and 5′DFUR were measured by a validated HPLC method with some modifications (Farkouh et al., 2014). Waters separation module and UV/Vis detector mentioned above were used for analysis. Separation was performed on a C18 RP column (150 × 4.6 mm2, 5 μm; Phenomenex, USA) with a C18 guard column (4 × 3.0 mm2; Phenomenex, USA) at 35 °C. The mobile phase consisted of 0.005 M disodium hydrogen phosphate buffer (pH 8.0) and methanol for solvent A at a ratio of 90:10 and for solvent B at a ratio of 10:90, respectively. Gradient elution was performed and the fraction of mobile phase A to mobile phase B at 0, 12, 20, 30, and 32 min were 100:0, 100:0, 0:100, 0:100, 100:0, respectively. Detection wavelength was 254 nm for 5′DFCR and 5′DFUR, and retention times were 6.5 and 9.9 min, respectively. 5′DFCR and 5′DFUR were separated from matrix compounds by SPE. Prior to SPE, 200 µL of 0.25 M zinc sulfate solution was added to the samples, and samples were centrifuged at 4000 rpm to separate the supernatant. Oasis HLB cartridge (Waters, USA) was washed with 1 mL of methanol and then pre-conditioned with 1 mL of water. After applying supernatant, cartridge was washed with 250 µL water-methanol (95:5; v/v). 5′DFCR and 5′DFUR were eluted from the column with 200 µL methanol: water (50:50).
The method was validated for selectivity, linearity, precision, accuracy, and recovery as described for capecitabine. Calibration standards were prepared at 1 to 100 μg/mL concentrations for 5′DFCR and at 0.5 to 20 μg/mL concentrations for 5′DFUR. Standards were analyzed in duplicate in three independent runs. To assess linearity, the coefficient of correlation (r2) values for 5′DFCR and 5′DFUR were 0.9986 and 0.9997, respectively.
Determination of 5-FU Concentrations in Mouse Plasma and Liver
Plasma and liver concentrations of 5-FU were measured by a validated liquid chromatography-mass spectrometry (LC-MS) method (Gülçin et al., 2010). Thermo HPLC system (UltiMate 3000) and Q-Exactive Orbitrap Mass Spectrometer (Thermo Scientific, USA) were used for analysis. Separation was performed on a C18 reversed phase column (150 × 3 mm2, 5 μm; Troyasil, Turkey). The mobile phase consisted of methanol (A, 1% formic acid) and water (B, 1% formic acid) and gradient program was used as follows; 0 to 1.00 min 50% A and 50% B, 3.01 to 6.00 min 100% B, and 7.01 to 15.00 min 50% A and 50% B. Conditions of the electrospray ionization (ESI) source were as follows: aux gas temperature, 320 °C; capillary temperature, 320 °C; sheath gas flow rate, 45; aux gas flow rate, 10; spray voltage, 3.80 kV. Transitions was performed m/z 100→900 for 5-FU. 5-FU was extracted from samples by using a liquid-liquid extraction method (Shiokawa et al., 2019) and 10 µL of sample was injected to LC-MS system.
The developed method was validated for selectivity, linearity, precision, accuracy, and recovery as described above. Calibration standards were prepared at 1.0 to 750 ng/mL concentrations and analyzed in duplicate in three independent runs. To assess linearity, the coefficient of correlation (R2) was 0.9997.
Statistical and Pharmacokinetic Analyses
Pharmacokinetic parameters of capecitabine and its metabolites were calculated by the non-compartmental pharmacokinetic analysis method using Excel (Microsoft Office, USA) (Ozturk et al., 2017; Pala Kara et al., 2021). Peak plasma concentration (Cmax) and time to reach peak concentration (tmax) values were directly obtained from the concentration-time curves. The area under the plasma concentration-time curve from 0 to 6 h (AUC0-6h) was calculated using the linear trapezoidal rule. The total area under the plasma concentration-time curve from 0 h to infinity (AUC0-∞) was calculated using the standard formula (Concentration at 24 h [C24h] / Elimination rate constant [kel]). The kel was calculated from the terminal points of concentration-time curve. t1/2 was calculated using the formula ln2/kel. The apparent total clearance (Cl/F) was calculated using the formula Dose/AUCtotal. The apparent distribution volume (Vd/F) was calculated by the formula (Cl/F)/Kel.
Data were presented as means ± standard error of means (SEM). Statistical analyses were performed using GraphPad Prism 5.00 (GraphPad Software, USA). The statistical significance of differences between groups were evaluated using one-way analysis of variance (ANOVA), following Tukey post hoc test. Diurnal rhythms were analyzed by Fourier analysis using IBM SPSS 22 (Chicago, IL, USA). Statistical significance required a p value < 0.05.
Results
Diurnal Variations in the Plasma Concentrations and Pharmacokinetic Parameters of Capecitabine and Metabolites
Pharmacokinetic values of capecitabine and its metabolites were greatly affected in plasma based on the time of drug administration (Table S1 in Supplementary Material). Capecitabine was rapidly metabolized and exhibited comparable t1/2 and tmax for all ZTs (Table S1). Figure 1 showed mean plasma concentration-time curves of capecitabine, 5′-DFCR, 5′-DFUR, and 5-FU following capecitabine dosing at each of the four ZTs. The mean AUC0-6h values of capecitabine following dosing at ZT1 and ZT7 were 2.9- and 2.7-fold higher than at ZT19, respectively (*p < 0.05). The mean Cmax value of capecitabine was 2.7- and 5-fold as high after drug dosing at ZT1 as compared with ZT13 or ZT19, respectively (*p < 0.05). Plasma Cmax and AUC0-6h values of 5′DFCR were comparable at all four ZT dosing times. Mean plasma AUC0-6h and Cmax of 5′DFUR were 2- and 4-fold as high following capecitabine dosing at ZT7 as compared with ZT13 and ZT19 (**p < 0.05). Plasma 5-FU levels remained below the limit of detection in capecitabine-treated mice at most time points (Figure 1). The mean AUC0-6h of 5-FU was found to be 6.9- and 12.4-fold as large in mice dosed at ZT1, as compared with those treated at ZT13 and ZT19, respectively (**p < 0.01) (Figure 2). The mean AUC0-6h of 5-FU was 6.6-fold and 11.9-fold as large following capecitabine administration at ZT7 as compared with ZT13 (*p < 0.05) and ZT19 (**p < 0.01), respectively (Figure 2). The mean Vd/F values of capecitabine at ZT19 was about 3-fold higher than at ZT1 and ZT7 (*p < 0.05). The mean Cl/F values of capecitabine at ZT19 found to be about 2-fold higher than at ZT1 and ZT7 (*p < 0.05) (Table S1).
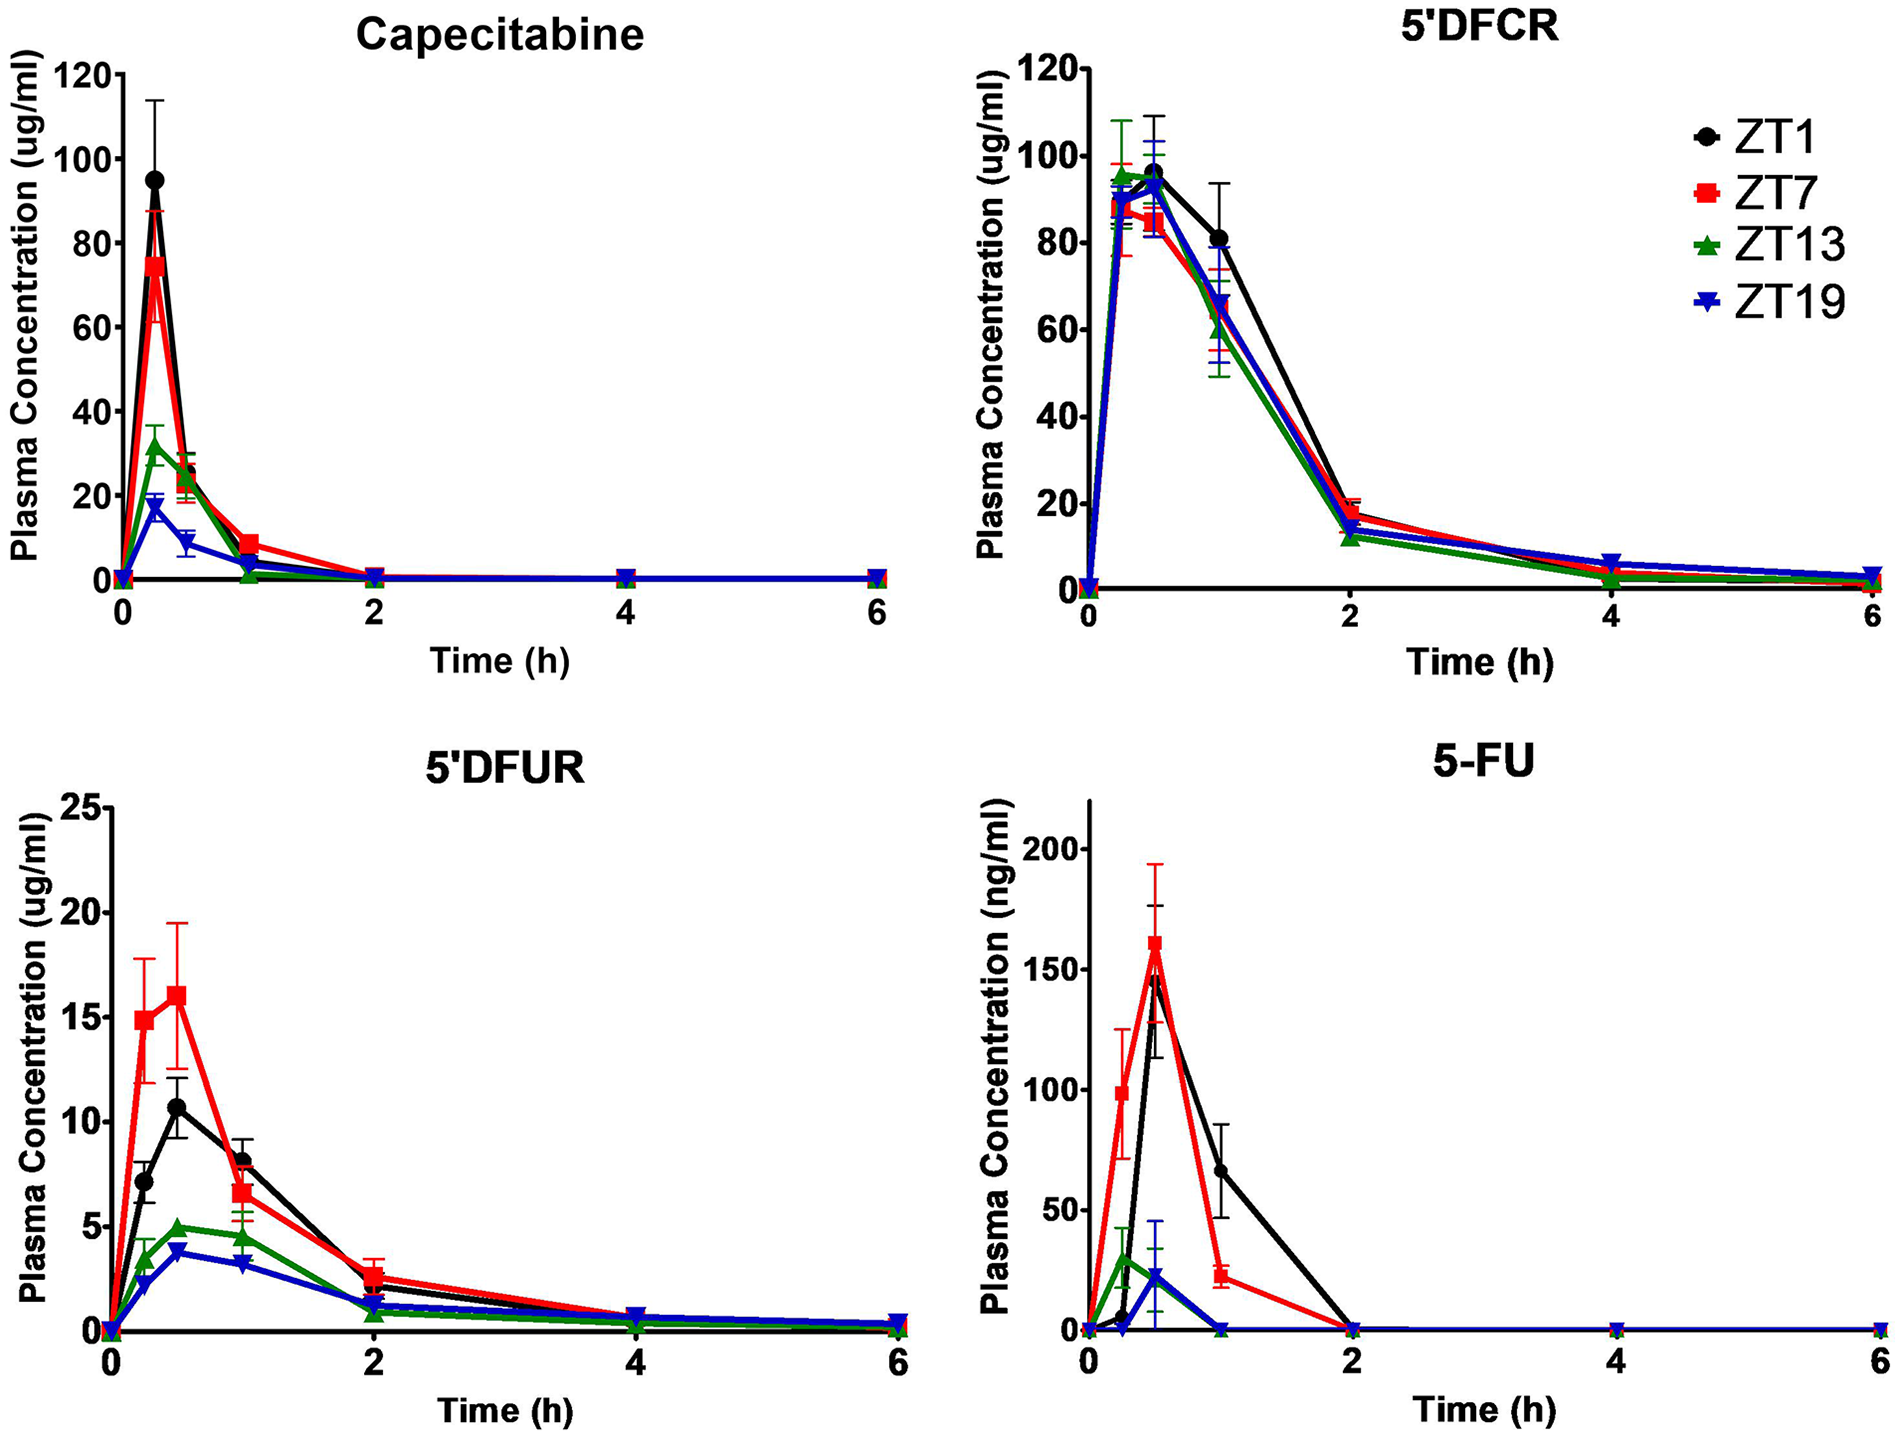
Plasma concentration-time curves of capecitabine, 5′DFCR, 5′DFUR, and 5-FU following oral administration of 500 mg/kg capecitabine to male mice at ZT1, ZT7, ZT13, or ZT19. Results are presented as mean ± SEM (n = 5). 5′DFCR = 5′-deoxy-5-fluorocytidine; 5′DFUR = 5′-deoxy-5-fluorouridine; 5-FU = 5-fluorouracil; SEM = standard error of mean.
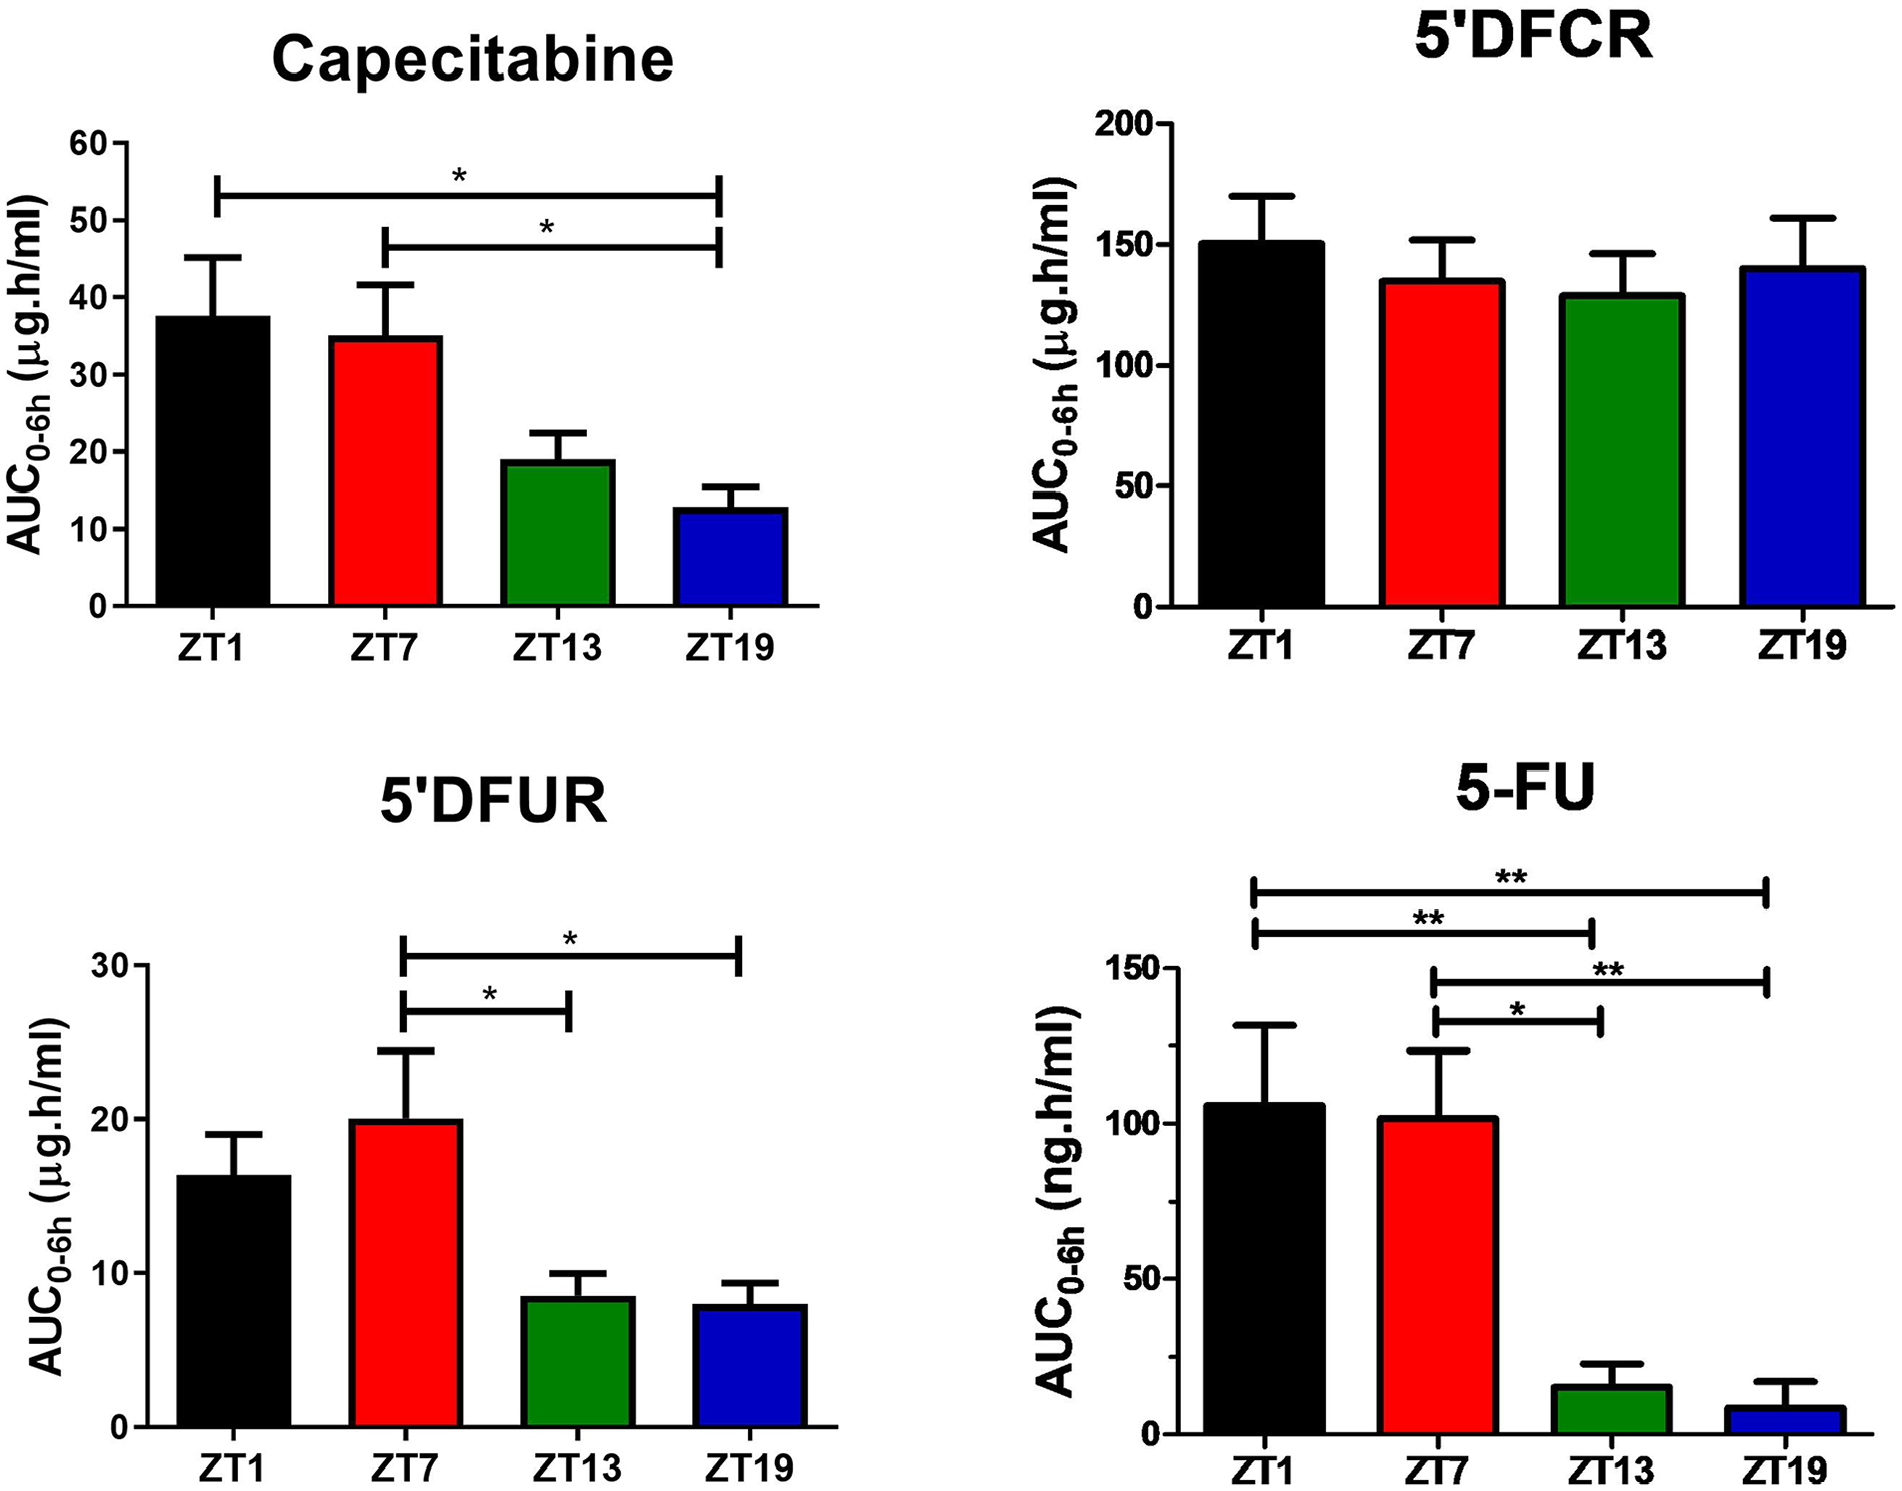
Plasma AUC0-6h values of capecitabine, 5′DFCR, 5′DFUR, and 5-FU following oral administration of 500 mg/kg capecitabine to male mice at ZT1, ZT7, ZT13, or ZT19. Results are presented as mean ± SEM (n = 5) (one-way ANOVA; *p = 0.0172, Capecitabine ZT1 vs. ZT19; *p = 0.0339, Capecitabine ZT7 vs. ZT19; *p = 0.0421 5′DFUR ZT7 vs. ZT13; *p = 0.0317 5′DFUR ZT7 vs. ZT19; **p = 0.0049, 5-FU ZT1 vs. ZT13; **p = 0.0027, 5-FU ZT1 vs. ZT19; *p = 0.0127, 5-FU ZT7 vs. ZT13; **p = 0.0074, 5-FU ZT7 vs. ZT19). AUC0-6h = area under the plasma concentration-time curve from 0 to 6 h; 5′DFCR = 5′-deoxy-5-fluorocytidine; 5′DFUR = 5′-deoxy-5-fluorouridine; 5-FU = 5-fluorouracil; SEM = standard error of mean; ANOVA = analysis of variance.
Diurnal variations in the liver concentrations and pharmacokinetic parameters of capecitabine and metabolites
While pharmacokinetic parameters of capecitabine in the liver did not vary significantly as a function of dosing time (Table S2), its metabolism into 5′DFUR and 5-FU was the highest following capecitabine administration at ZT1-7, and ZT7, respectively (Table S2 and Figure 3). Thus, the mean AUC0-6h values of 5′DFUR were largest by 7-fold after capecitabine dosing at ZT1 (***p < 0.001), by 6.2-fold after administration at ZT7 (**p < 0.01) and by 3.9-fold as compared with those in mice treated at ZT19 (p > 0.05). The mean AUC0-6h of 5-FU in the liver of mice treated at ZT7 was 1.8-, 1.9-, and 3.2-folds as large as those receiving capecitabine at ZT1, ZT13, and ZT19, respectively (*p < 0.05; **p < 0.01) (Figure 4).
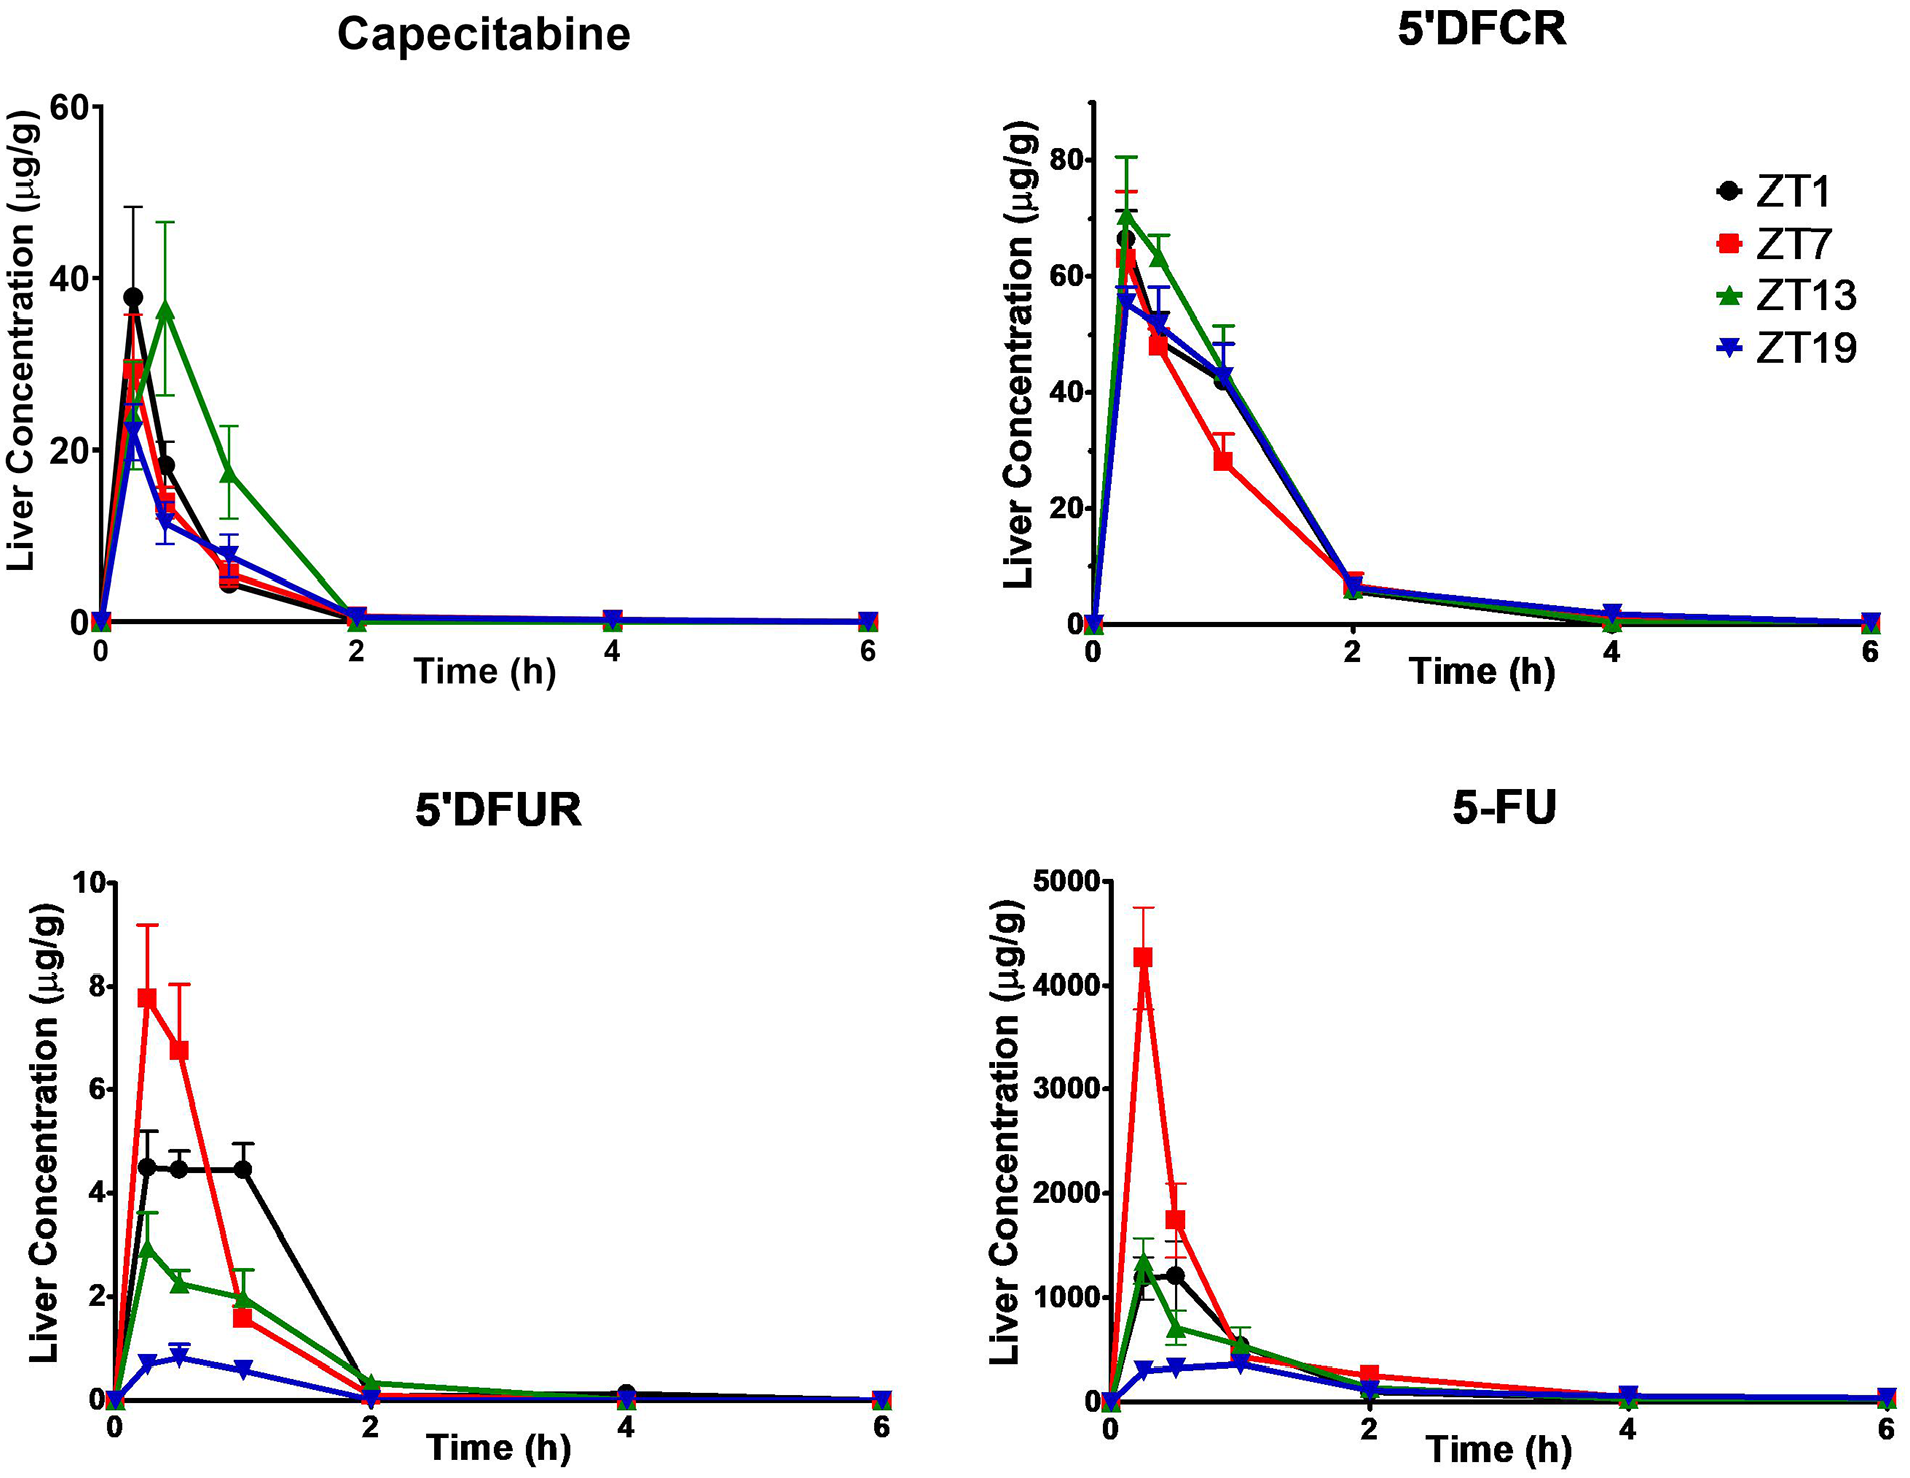
Liver concentration-time curves of capecitabine, 5′DFCR, 5′DFUR, and 5-FU following oral administration of 500 mg/kg capecitabine to male mice at ZT1, ZT7, ZT13, or ZT19. Results are presented as mean ± SEM (n = 5). 5′DFCR = 5′-deoxy-5-fluorocytidine; 5′DFUR = 5′-deoxy-5-fluorouridine; 5-FU = 5-fluorouracil; SEM = standard error of mean.
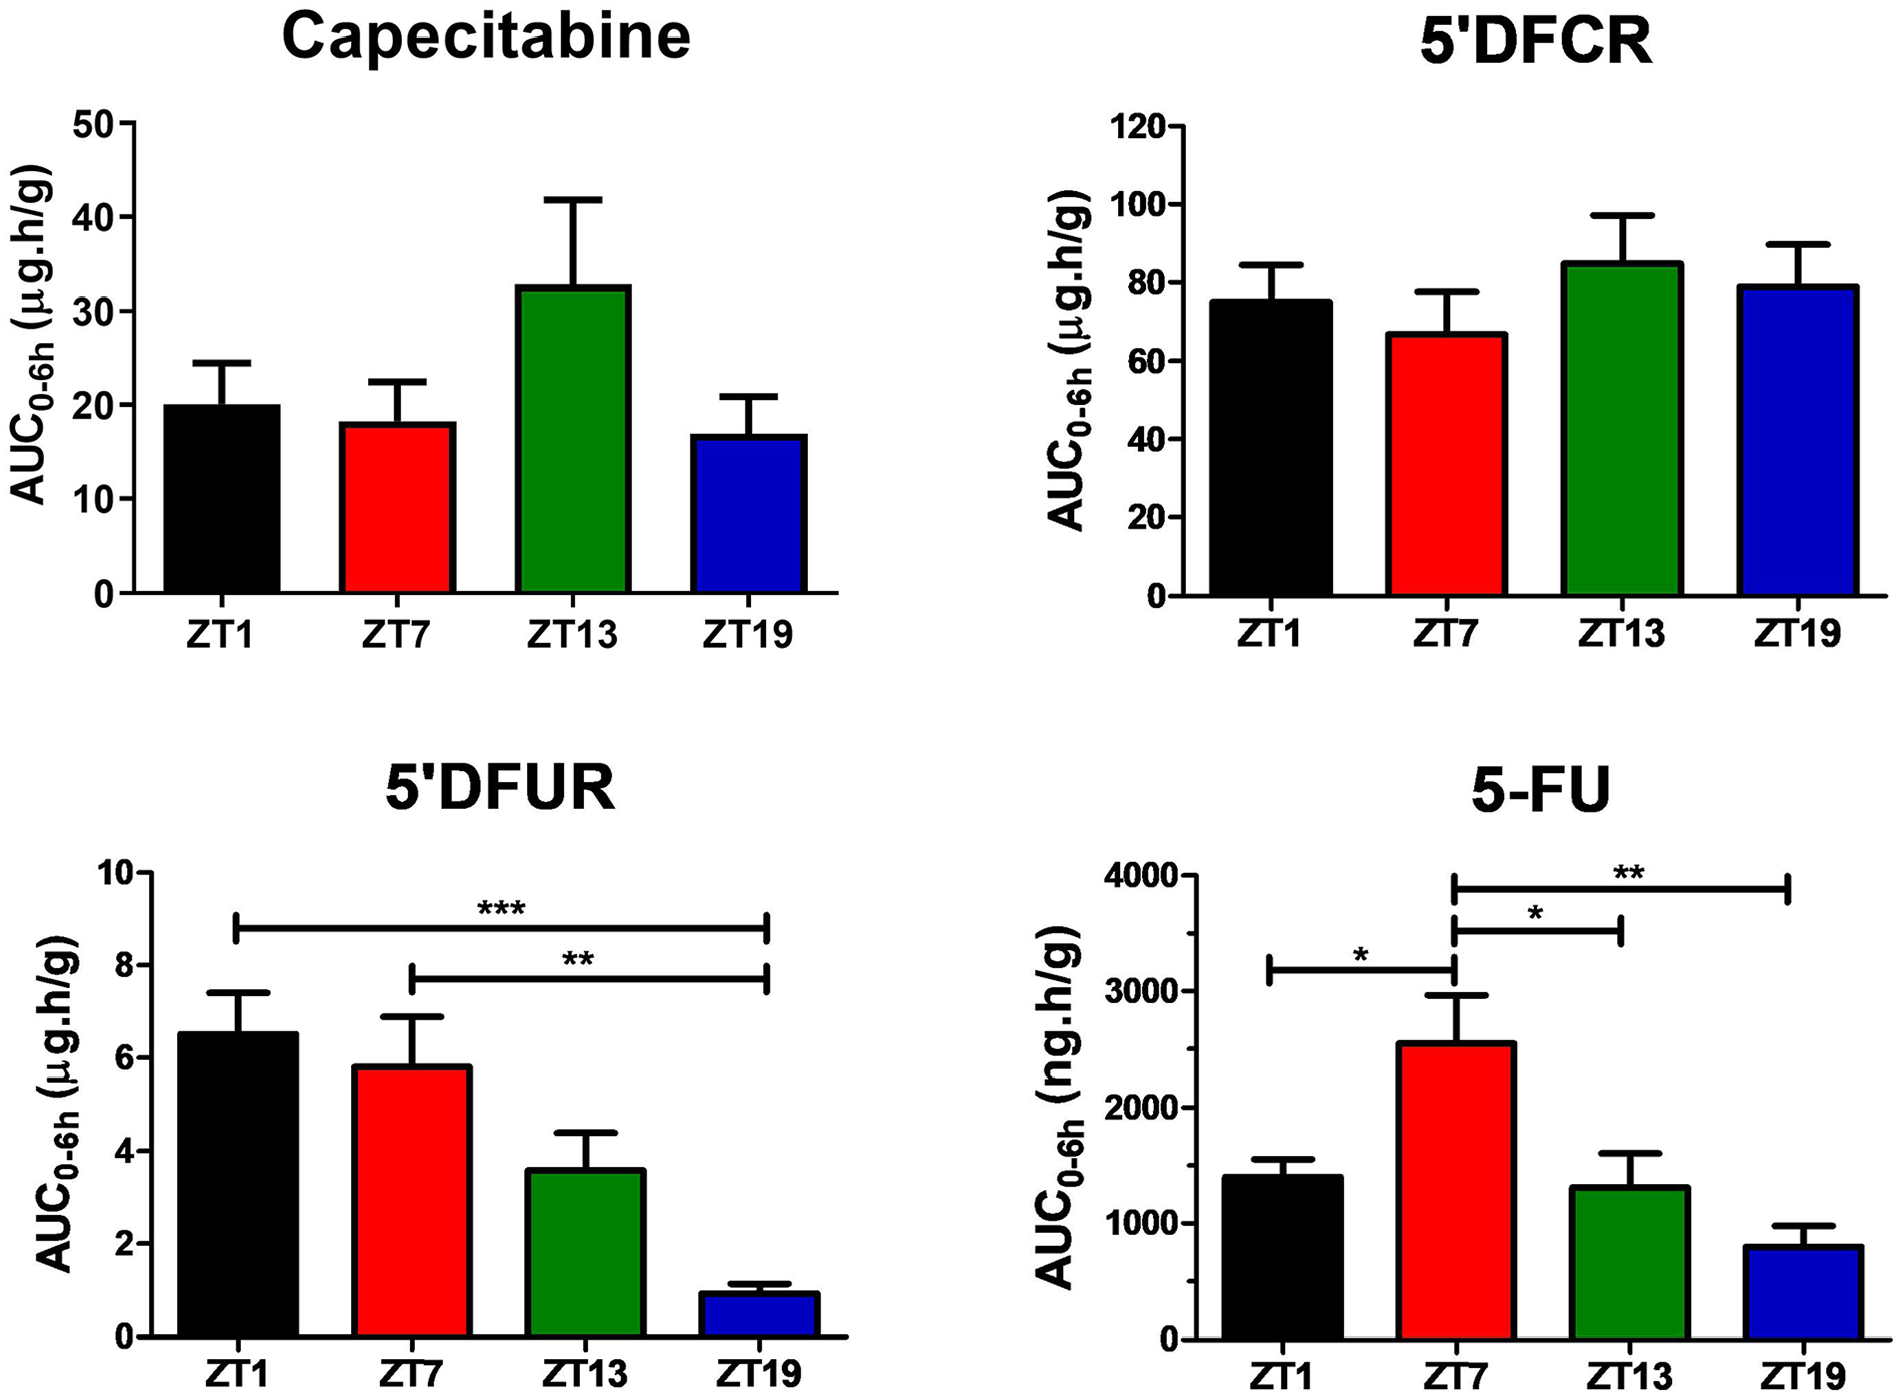
Liver AUC0-6h values of capecitabine, 5′DFCR, 5′DFUR, and 5-FU following oral administration of 500 mg/kg capecitabine to male mice at ZT1, ZT7, ZT13, or ZT19. Results are presented as mean ± SEM (n = 5) (one-way ANOVA; ***p = 0.0009, 5′DFUR ZT1 vs. ZT19; **p = 0.0033, 5′DFUR ZT7 vs. ZT19; *p = 0.0482, 5-FU ZT1 vs. ZT7; *p = 0.0311, 5-FU ZT7 vs. ZT13; *p = 0.0023, 5-FU ZT7 vs. ZT19). AUC0-6h = area under the plasma concentration-time curve from 0 to 6 h; 5′DFCR = 5′-deoxy-5-fluorocytidine; 5′DFUR = 5′-deoxy-5-fluorouridine; 5-FU = 5-fluorouracil; SEM = standard error of mean; ANOVA = analysis of variance.
Diurnal variations in capecitabine-metabolizing enzyme levels
Analyses of CRY1 and BMAL1 levels showed that animals were entrained and exhibiting diurnal oscillation (*p < 0.05) (Figure 5a, b) in agreement with previously published results (Lu et al., 2020; Wang et al., 2019; Ye et al., 2014). As shown in Figure 5, CES1 (**p = 0.001) and CES2 (**p = 0.008), convert capecitabine to 5′DFCR, exhibited diurnal oscillation in anti-phasic manner. In mouse liver, the protein expression levels of CES1 peaked at ZT19 while the protein expression levels of CES2 peaked at ZT1. On the contrary, the protein levels of CDA, which catalyzes the conversion of 5′DFCR to 5′DFUR, peaked at ZT1 (*p = 0.04). The protein levels of UPP2 (responsible for catalyzing the 5′DFUR to 5-FU) and DPD (catalyzes the reduction of uracil and thymine) showed diurnal oscillation (*p = 0.03; **p = 0.004). The peak UPP2 levels in mice occurred at ZT1 and the trough at ZT19. DPD levels reached peak value at ZT7 and significantly decreased during the activity phase (Figure 5). Data obtained by cosinor analysis regarding protein levels of BMAL1, CRY1, CES1, CES2, CDA, UPP2, and DPD at ZT1, ZT7, ZT13, and ZT19 are given in Table S3.
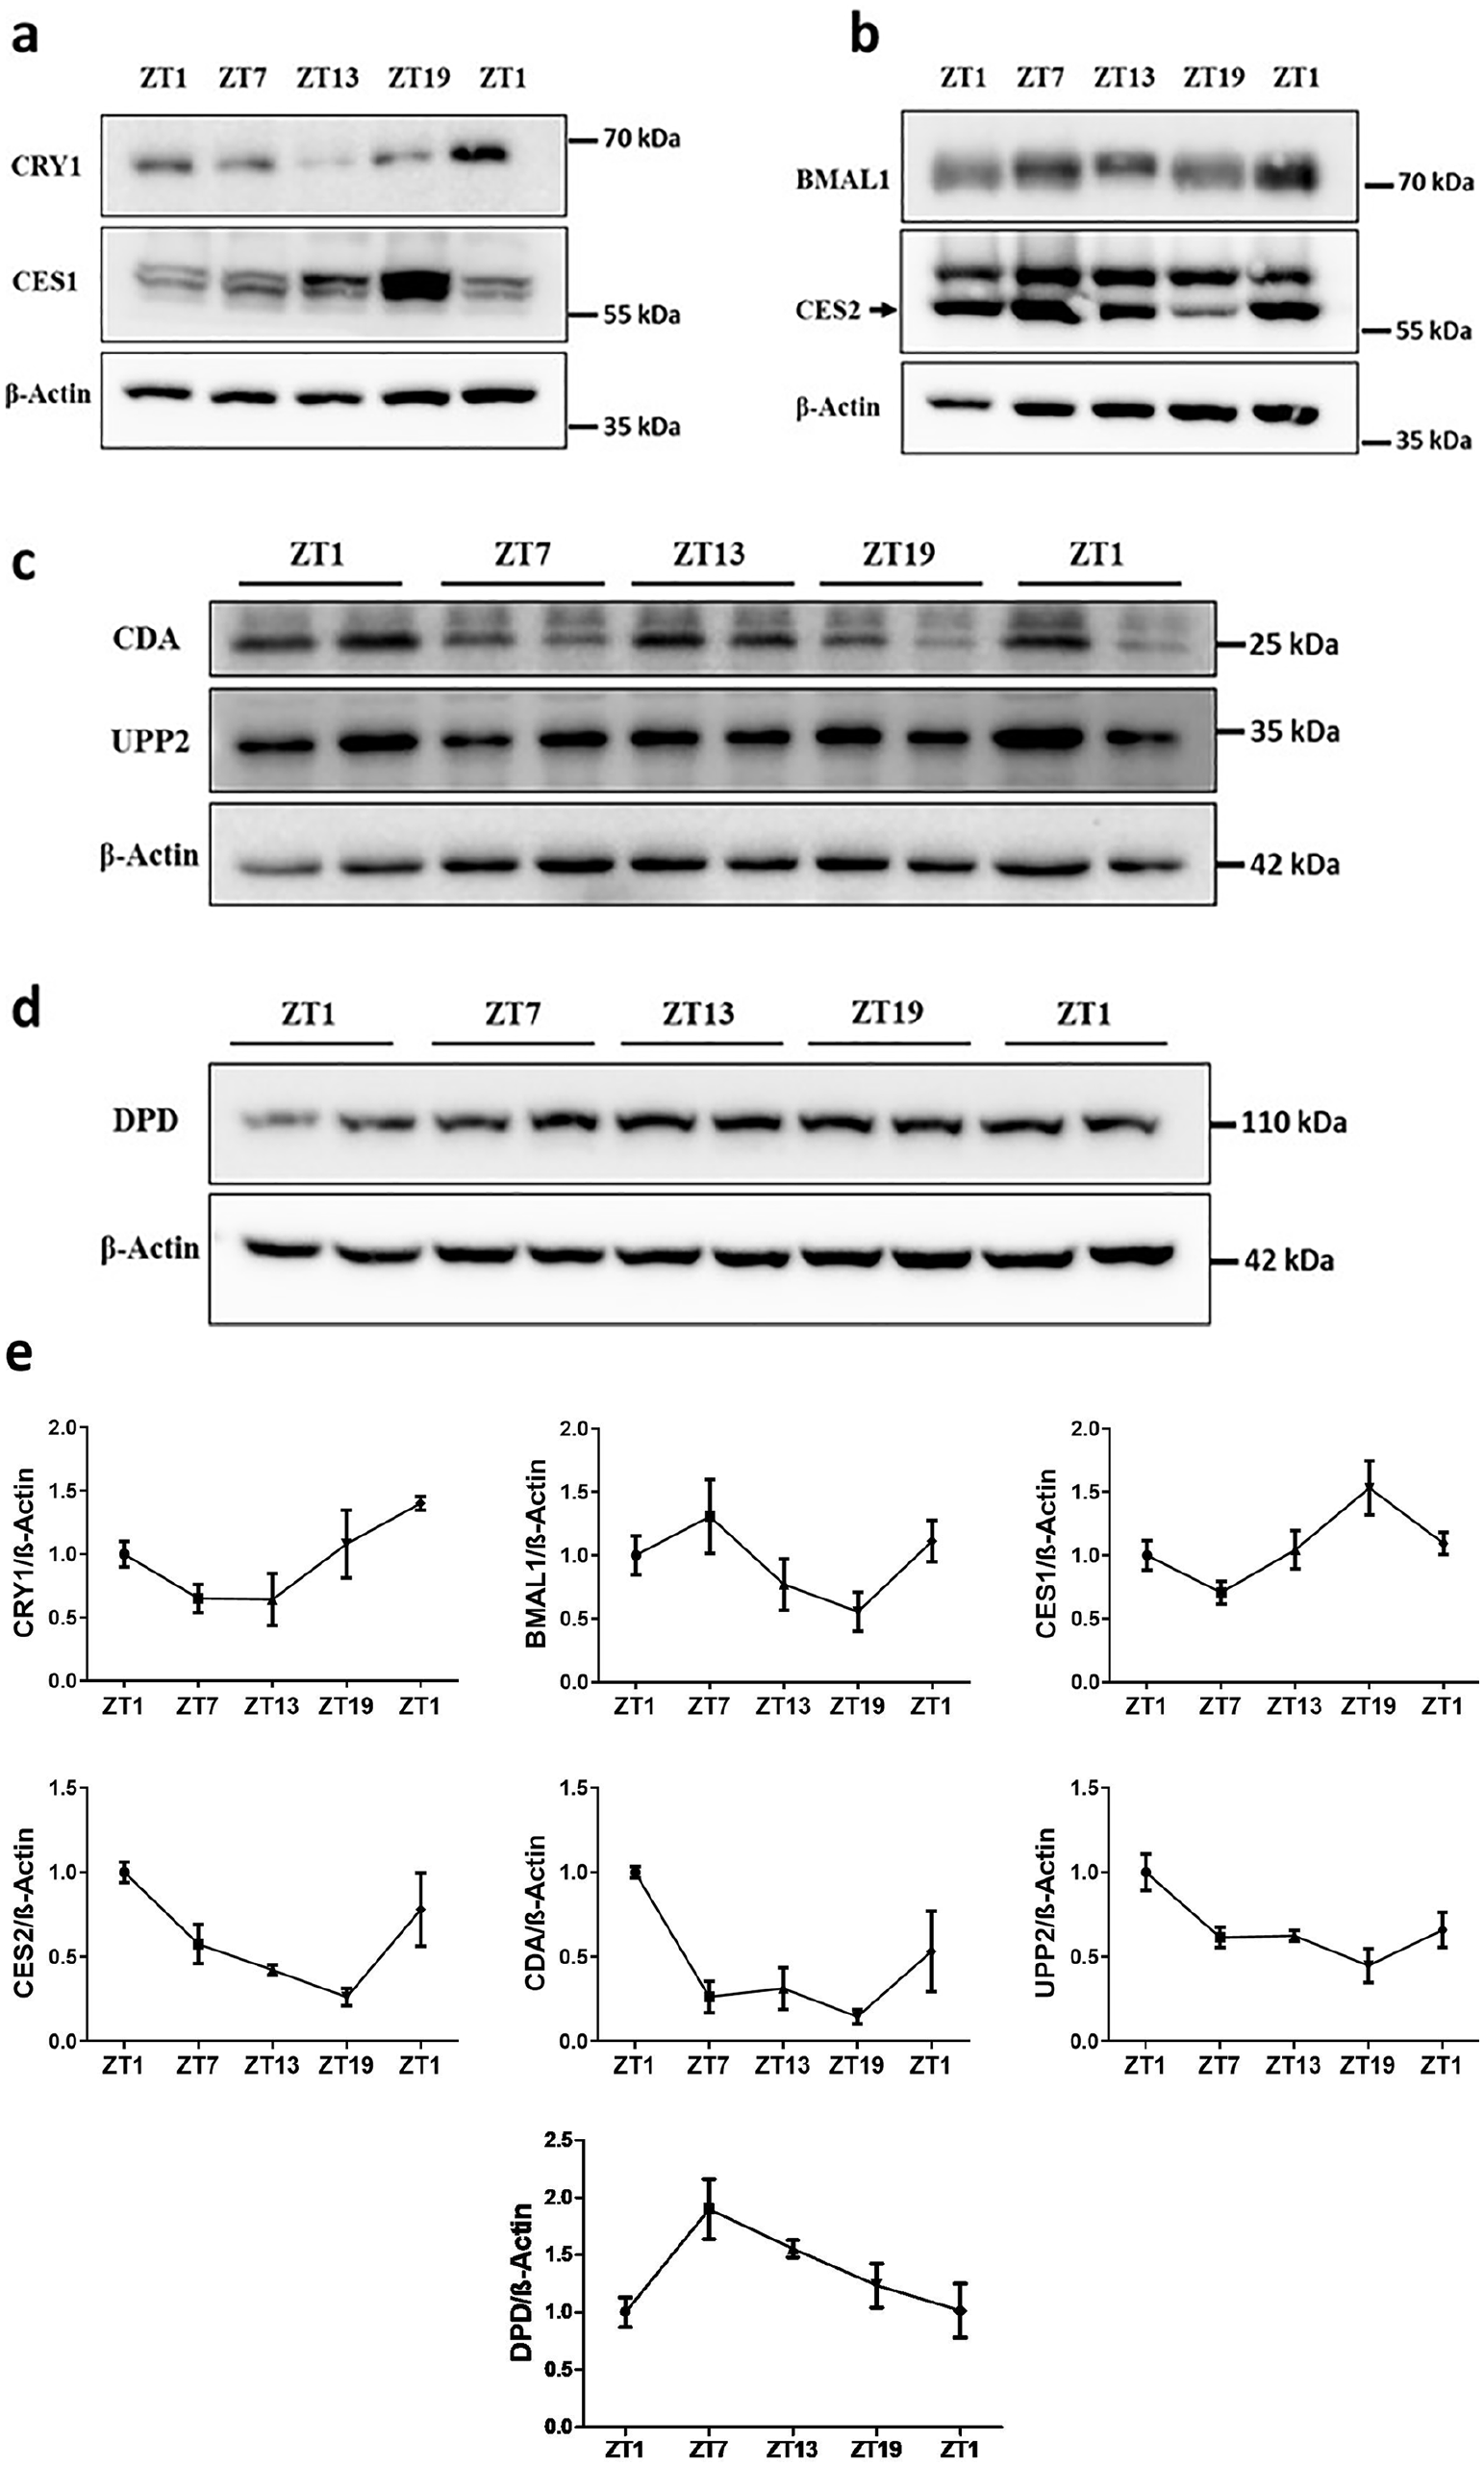
Protein levels of BMAL1, CRY1, CES1, CES2, CDA, UPP2, and DPD in mice livers at ZT1, ZT7, ZT13, and ZT19. Representative immunoblots are shown in a, b, c, and d, and the quantification of indicated protein levels are shown in e. Results are presented as mean ± SEM (n = 5) (Cosinor analysis, BMAL1: *p = 0.02; CRY1: *p = 0.01; CDA: *p = 0.04; UPP2: *p = 0.03; CES1: **p = 0.001; CES2; **p = 0.008; DPD: **p = 0.004). SEM = standard error of mean.
Discussion
Capecitabine is a prodrug used for the treatment of colorectal, breast, and liver cancers and cholangiocarcinoma (Primrose et al., 2019). It is mainly bioactivated in liver and tumor cells to produce the 5-FU (Figure 6). In this study, we evaluated the diurnal pharmacokinetic profiles of capecitabine and its metabolites in mouse plasma and liver. Plasma levels of capecitabine, 5′DFUR, and 5-FU were higher at ZT0-12 (rest phase) than ZT12-0 (activity phase). Plasma levels of 5′DFCR were similar in all groups. For the liver, there was no significant difference in capecitabine and 5′DFCR levels depending on the administration time, whereas liver 5′DFUR and 5-FU levels were higher during rest phase than the activity phase.
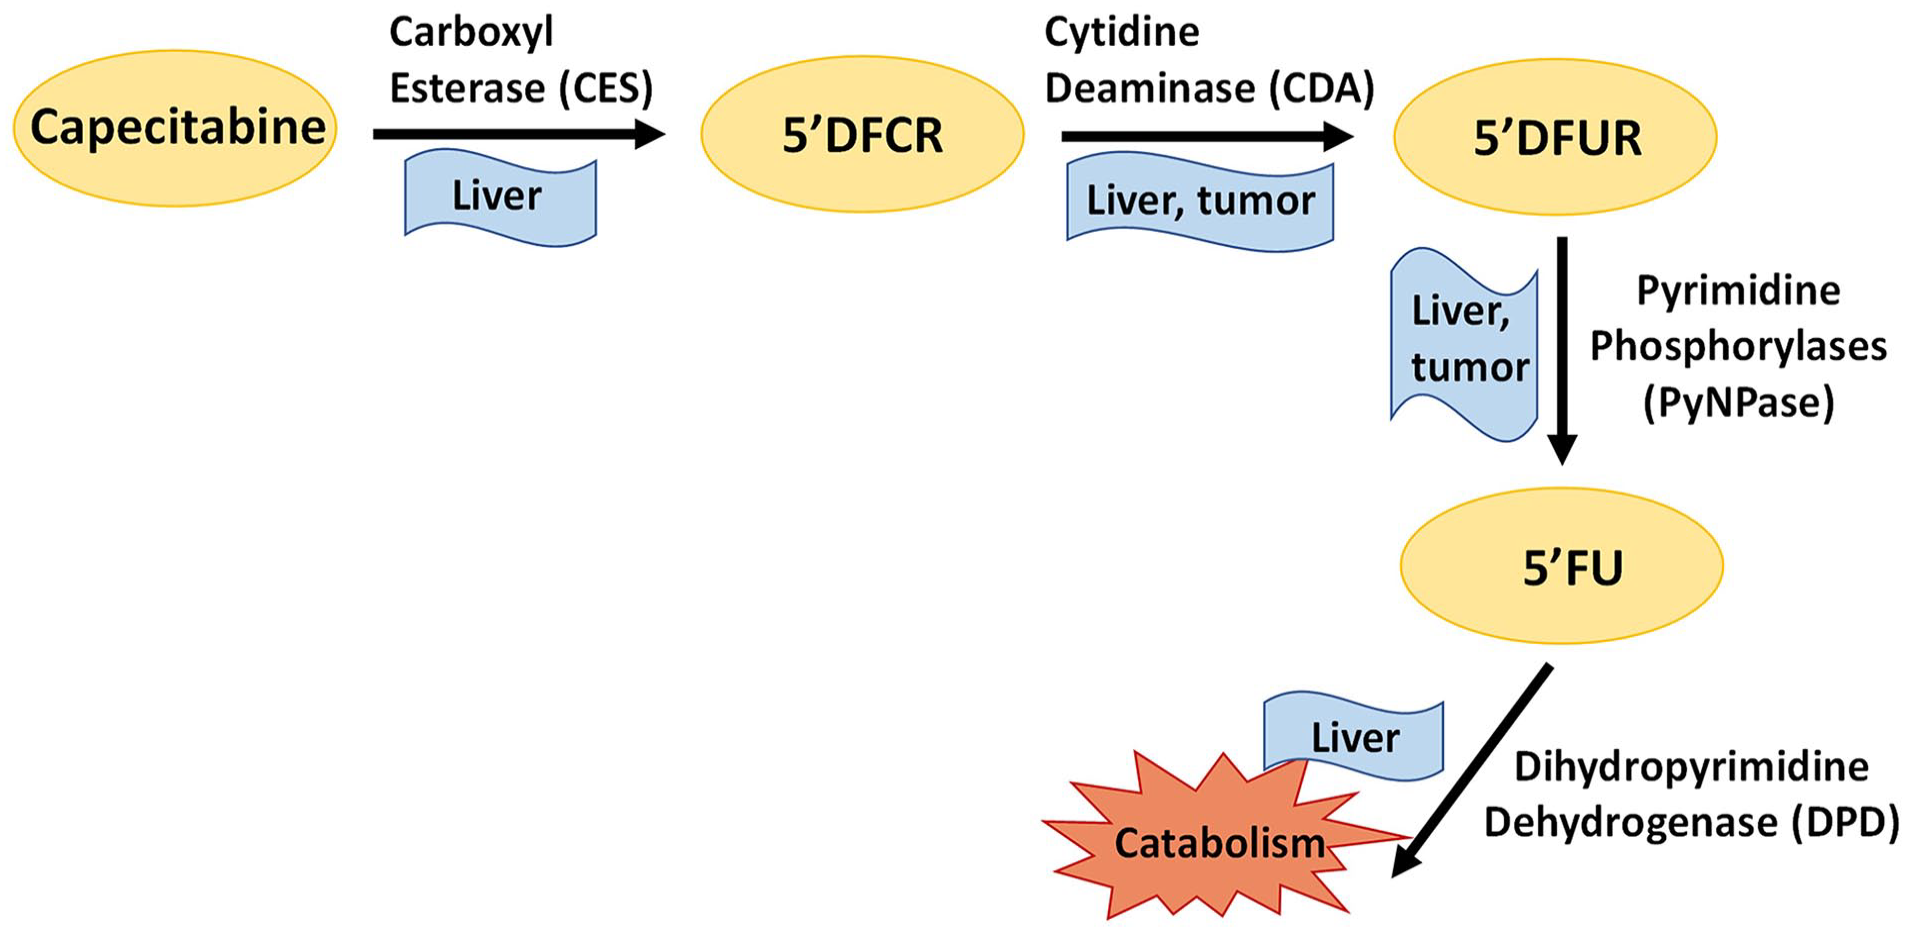
Metabolism pathway of capecitabine. Capecitabine is converted to 5′-deoxy-5-fluorocytidine (5′DFCR) by carboxylesterases (CESs), which are mainly located in the liver and then 5′DFCR is converted to 5′-deoxy-5-fluorouridine (5′DFUR) by cytidine deaminase (CDA) in the liver and tumor. 5′DFUR is converted to 5-FU (5-fluorouracil) by pyrimidine phosphorylases (PyNPase) in the liver and tumor. Finally, 5-FU is catabolized by dihydropyrimidine dehydrogenase (DPD) in the liver.
In our pharmacokinetic study, the plasma levels of capecitabine were lower in the mice treated during their nocturnal activity phase as compared with those treated during their daily rest phase, with a consistent decreasing gradient in systemic exposure from ZT1 (largest) to ZT7-ZT13, and down to ZT19 (lowest). Similarly, Kobuchi et al. (2018) also reported plasma Cmax and AUC0-∞ values of capecitabine to be highest in rats dosed at ZT5 and lowest in those treated at ZT11 (*p < 0.05).
Changes in the absorption level of orally administered drugs might be expected to cause differences in tmax values. It is known that absorption-related factors such as gastric blood flow, gastrointestinal tract motility and gastric acidity, function of drug uptake and efflux transporters in the gut display diurnal rhythms, and for most drugs, absorption is greater during the activity phase (Musiek and Fitzgerald, 2013). However, capecitabine is rapidly absorbed from the gastrointestinal tract, and this is also the case in our study with similar tmax values of ~0.25 h in all four drug timing groups.
In a clinical study, it was stated that food decreased the rate and extent of capecitabine absorption, but the effects of food on the AUC values of 5′DFCR, 5′DFUR, and 5′FU were not significant (Reigner et al., 1998). In clinical use, capecitabine is given after meals (Reigner et al., 2001). In the study by Kobuchi et al. (2018), capecitabine was administered after 12 h of fasting. However, it is known that feeding-fasting cycles effect diurnal rhythms (Levi and Schibler, 2007). In a physiologically based modeling study, it was shown that feeding status caused differences in time-dependent drug pharmacokinetics. The activity of the efflux transporter P-gp, which affects absorption, was largely varied according to feeding status and circadian time (Okyar et al., 2019). Due to the changes in ABC transporter levels, feeding patterns may also influence the therapeutic index of anticancer agents (Lee et al., 2012). Capecitabine plasma levels peaked at different time points in a previous study (Kobuchi et al., 2018), which differs from our observation. The reason may be attributed to different experimental designs, in which there were no food restrictions to animals during our study (Kobuchi et al., 2018).
Capecitabine is rapidly metabolized to 5′DFCR via CES enzymes (mostly via CES1) in the liver and small intestine in mouse (Matsumoto et al., 2020; Reigner et al., 2001; Shindoh et al., 2011). The transcription of Ces isoforms exhibits diurnal oscillations in mouse liver, the expression of Ces1 is abundant in the dark phase which is similar to our findings (Zhang et al., 2009). The protein levels of the CES1 enzyme, which metabolizes capecitabine to 5′DFCR, peaked in ZT19 and was lowest level in ZT7, with high oscillation. ZT19 plasma levels were found to be low because of rapid metabolism of capecitabine by CES1. The low protein levels of the CES1 enzyme at the ZT1 and ZT7 time points contributed to the increase in the plasma capecitabine level, which could not be adequately metabolized. While capecitabine AUC0-6h values in plasma showed a significant time-dependent difference, this was not observed in the liver. Since CES enzymes are found in the small intestine, liver, and also plasma (Shindoh et al., 2011; Tang et al., 2014), this may be the reason for time-dependent difference in plasma and liver levels of capecitabine. CDA and CES1 were expressed in the liver with anti-phasic expression pattern. CDA enzyme expression was high during resting phase therefore 5’DFUR level was found to be high in the rest phase compared to active phase.
Regarding the elimination of capecitabine from plasma, Vd/F and Cl/F values were significantly higher in mice treated at ZT19 as compared with those receiving the drug at ZT1 or ZT7 (p < 0.05). The diurnal changes in Vd/F and Cl/F could result from those in capecitabine metabolism, which also affected bioavailability and AUC values. Liver and kidney blood flow, glomerular filtration rate are also known to be diurnal rhythm-dependent in mice, with peak levels occurring during the nocturnal activity phase (Koopman et al., 1989; Musiek and Fitzgerald, 2013). The higher clearance values in mice dosed at ZT13 or ZT19 may also be associated with an increase in liver and kidney blood flow, as compared with mice treated at ZT1 or ZT7.
Cmax and AUC0-6h values of 5-FU were found to be 6- to 12-fold higher in rest than the activity phase. Kobuchi et al. (2018) showed that, after capecitabine administration at ZT5, ZT11, or ZT23, AUC values of 5-FU were the lowest at ZT5 and the highest at ZT23 in rats. The difference in diurnal rhythms of metabolites formed after 5′DFCR in mice and rats may be related to differences in metabolizing enzyme expressions between species. Differences in metabolic enzyme activities in the conversion of capecitabine to 5-FU have been shown comparatively in mice, rats, and humans. CDA enzyme has very low activity in rats as compared with mice in capecitabine metabolism (Shindoh et al., 2011).
Clearance and volume of distribution values of 5-FU could not be calculated since the amount of 5-FU metabolized from capecitabine was not known exactly. It is suggested that plasma concentrations and toxicity of 5-FU correlate with diurnal changes in DPD enzyme activity (Harris et al., 1990; Levi and Schibler, 2007). In our study, DPD protein levels were maximum at ZT7 and minimum at ZT1 in mice. This result was consistent with a previous study, where they showed DPD had highest activity between ZT3 and ZT7 (Porsin et al., 2003). When the molecular and pharmacokinetic data were evaluated together, the DPD level was low when 5-FU was highest in the plasma. Conversely, in the liver, when 5-FU was most abundant, DPD level was also found high. Kobuchi et al. (2016) showed that peak time of 5-FU clearance in rats did not exactly coincide with the peak time of DPD activity. It is suggested that many factors other than DPD enzyme activity may affect the clearance of 5-FU (Kobuchi et al., 2016). In our study, we did not show strong diurnal pattern in UPP2 enzyme, but DPD and UPP2 demonstrated the same diurnal pattern which was higher in activity phase in a clinical study (Van Kuilenburg et al., 1995). It is also thought that thymidine kinase activity, which shows a diurnal rhythm in anti-phasic with DPD activity, may also cause diurnal changes in 5-FU levels (Kobuchi et al., 2016). In our study, 5-FU liver levels may be affected by rhythmic enzyme activities and physiological functions in addition to DPD metabolism.
In this study, 5-FU concentration in liver was found to be 20 to 25 times higher than in plasma for all ZTs. It is known that after administration of capecitabine, 5-FU levels in humans are 8 to 10 times higher in liver tissue than in plasma, and approximately 20 times higher in colorectal tumor tissue than in plasma (Reigner et al., 2001). The difference in plasma/liver tissue distribution of 5-FU is associated with higher enzyme activities in liver (Reigner et al., 2001).
Studies in humans and animals showed that pharmacokinetics of intravenously administered 5-FU follow a diurnal rhythm (Fleming et al., 2015; Harris et al., 1990; Kobuchi et al., 2016, 2020; Kuwahara et al., 2010; Metzger et al., 1994; Petit et al., 1988). The peak concentration of 5-FU occurs in the early rest phase both in laboratory mice and in cancer patients when the drug is infused continuously in a constant rate (Lévi et al., 2007). Our results showed that the plasma 5-FU concentrations are high at the beginning of the rest phase, which display a similar diurnal rhythm of 5-FU given at a constant rate with continuous infusion.
In conclusion, significant changes were observed in capecitabine pharmacokinetics depending on the drug administration time. The relationship between diurnal changes in capecitabine and 5-FU plasma levels is important in terms of evaluating the efficacy and toxicity of the treatment. Our study was limited to male mice; further research is essential to confirm these effects in females. Increasing the knowledge about the time-dependent changes in pharmacokinetics and pharmacodynamics of capecitabine, and assessing their possible sex-specificities as well, may contribute to a safer use of the drug in cancer treatment through a chronotherapeutic approach. In male mice, ZT7 may correspond to the mid-activity phase (~7 h after rest onset) in male patients and can be used for achieving best efficacy especially for primary or secondary liver cancers. Because capecitabine is an orally administered fluoropyrimidine drug, modified-release or delayed-release pills can be used for timely administration. In this way, compliance can also be achieved during the patient’s sleep period.
Supplemental Material
sj-docx-1-jbr-10.1177_07487304221148779 – Supplemental material for Diurnal Changes in Capecitabine Clock-Controlled Metabolism Enzymes Are Responsible for Its Pharmacokinetics in Male Mice
Supplemental material, sj-docx-1-jbr-10.1177_07487304221148779 for Diurnal Changes in Capecitabine Clock-Controlled Metabolism Enzymes Are Responsible for Its Pharmacokinetics in Male Mice by Yasemin Kubra Akyel, Dilek Ozturk Civelek, Narin Ozturk Seyhan, Seref Gul, Isil Gazioglu, Zeliha Pala Kara, Francis Lévi, Ibrahim Halil Kavakli and Alper Okyar in Journal of Biological Rhythms
Footnotes
Acknowledgements
The present work was supported by the Research Fund of Istanbul University. Project Number: TDK-2018-30939. The data used in this study were derived from PhD thesis of Yasemin Kubra Akyel. We would like to thank Dr. Ali Cihan Taskin for his valuable contribution to animal work.
Conflict of Interest Statement
The author(s) have no potential conflicts of interest with respect to the research, authorship, and/or publication of this article.
Notes
References
Supplementary Material
Please find the following supplemental material available below.
For Open Access articles published under a Creative Commons License, all supplemental material carries the same license as the article it is associated with.
For non-Open Access articles published, all supplemental material carries a non-exclusive license, and permission requests for re-use of supplemental material or any part of supplemental material shall be sent directly to the copyright owner as specified in the copyright notice associated with the article.