
Abstract
Rats housed in a 22-h light-dark cycle (11:11, T22) exhibit 2 distinct circadian locomotor activity (LMA) bouts simultaneously: one is entrained to the LD cycle and a second dissociated bout maintains a period greater than 24 h. These 2 activity bouts are associated with independent clock gene oscillations in the ventrolateral (vl-) and dorsomedial (dm-) suprachiasmatic nucleus (SCN), respectively. Previous results in our laboratory have shown that the vl- and dm-SCN oscillators are weakly coupled under T22 and that the period of the dissociated bout depends on coupling between the 2 subdivisions. Here, we sought to study the behavior of the T22 SCN pacemaker upon release into free-running conditions and compare it to the behavior of the system upon release from typical 24-h (12:12, T24) entrainment. T22-desynchronized rats or T24-entrained rats were released into constant darkness (DD). Activity rhythms in T22 rats rapidly resynchronized upon release into DD, and the free-running period (FRP) of the fused rhythm was longer than the FRP of T24 rats. We then asked whether the in vivo period changes were also present in the ex vivo SCN. Per1-luc rats were desynchronized in T22 for assessment of SCN Per1-luc ex vivo. Similar to behavioral FRP, the period of ex vivo SCN explanted from T22 rats was longer than that for T24 animals. Mathematical models supported the observed behavior of the dual oscillator system as the result of mutual coupling between the vl- and dm-SCN oscillators. This bidirectionally coupled model predicted both the FRP of the T22 system and its phase-shifting response to light. Together, these data support a model of pacemaker organization in which a light-sensitive vl-SCN oscillator is mutually coupled with a light-insensitive dm-SCN oscillator, and together they determine the period of the coupled system as a whole and its response to light pulses.
Circadian rhythms in mammals are orchestrated by a central circadian pacemaker located in the suprachiasmatic nucleus (SCN) of the hypothalamus. Output signals from the SCN have the ability of setting the phase of specific circadian rhythms and of circadian oscillators throughout the body that in turn regulate behavioral and physiological rhythms. Direct axonal projections from the retina to the SCN entrain the central clock to the LD cycle, and this enables the synchronization of the whole circadian network of clocks and rhythms to the 24-h environment. The SCN is constituted by multiple single-cell autonomous circadian oscillators, and coupling between these cellular oscillators is critical for the nucleus to produce a coherent circadian output. The importance of SCN intercellular coupling is underscored by the wide spectrum of circadian locomotor activity (LMA) patterns that can emerge from different coupling configurations within the nucleus. For instance, constant light conditions in the mouse lead to behavioral circadian arrhythmicity that is associated with a lack of synchrony between single-cell oscillators, as determined by their fluorescence-reported clock gene expression (Ohta et al., 2005). The same conditions in the golden hamster, as well as in a small proportion of mice, lead to the presence of 2 bouts of LMA every ~24 h that are associated with the antiphase oscillation in clock gene expression of the left- and right-sided SCN (de la Iglesia et al., 2000; Ohta et al., 2005). These results suggest that clusters of SCN single-cell oscillators—in some instances anatomically identifiable—can drive independent LMA outputs.
When rats are exposed to a symmetric (11:11) 22-h LD cycle (T22), they exhibit 2 distinct circadian LMA bouts simultaneously: one is entrained to the LD cycle (T22h) and a second dissociated bout maintains a period greater than 24 h (τ>24h) (Campuzano et al., 1998; de la Iglesia et al., 2004). These 2 activity bouts are associated with independent clock gene oscillations in the ventrolateral (vl-) and dorsomedial (dm-) SCN, respectively (de la Iglesia et al., 2004). While these results suggest that neurons within the vl- and dm-SCN can each sustain LMA outputs independently, previous results in our laboratory have shown that the desynchronized subregional oscillators are weakly coupled (Schwartz et al., 2009). We modeled the T22 vl- and dm-SCN behavior and our model suggested that whereas the T22h oscillation is sustained by vl-SCN neurons, the τ>24h oscillation is the result of the 22-h input from the entrained vl-SCN to the dm-SCN neurons, whose limits of entrainment are outside of 22 h. Our model explained the period of the τ>24h oscillation, but the question remains whether it can predict the period of the free-running system upon release into constant conditions, which could display aftereffects of the previous desynchrony.
In the present study, we first measured the in vivo circadian period after releasing T22 forced desynchronized rats into free-running conditions. We also measured the period of the SCN ex vivo, by assessing luciferase-reported Per1 expression in SCN explants from T22 Per1-luc rats (Yamazaki et al., 2000). We used mathematical models to account for the behavior of the T22 dual oscillator system upon release into free-running conditions as well as when stimulated by phase-specific light pulses (Schwartz et al., 2010). Together, our data and our mathematical simulations support a model of SCN pacemaker organization in which a light-sensitive vl-SCN oscillator is mutually coupled with a light-insensitive dm-SCN oscillator, and together they determine the period of the coupled system as a whole as well as the response of the desynchronized system to light pulses.
Materials and Methods
Animals
Adult male Wistar rats (Charles River) and Per1-Luc rats—W(perl)1, Wistar, Charles River Japan (Yamazaki et al., 2000), maintained at University of Washington—were singly housed in polycarbonate cages (20 cm × 25 cm × 22 cm) in light- and sound-protected isolation chambers with ad libitum access to food and water and constant temperature. Unless otherwise noted, animals were maintained under a symmetrical 11 h:11 h LD cycle or under a symmetrical 12:12 LD cycle (T24); illumination was provided by white fluorescent tubes (100-300 lux at cage level) mounted above each row of cages, with dim red light (<2 lux) during the dark phase of the LD cycle and during constant darkness (DD). LMA was continuously monitored via paired crossed infrared photobeam detectors connected to a personal computer running the Clocklab data acquisition system (Actimetrics) at University of Washington or to a home-designed system at University of Barcelona. All experiments were in compliance with the University of Washington and the University of Barcelona Animal Care and Use Committee and National Institutes of Health Guide for the Care and Use of Laboratory Animals.
Experimental Design
Animals were monitored under T22 for 2-3 weeks until LMA rhythms desynchronized. Desynchrony was verified by visual inspection of the actograms (Figure 1) and defined as the presence of 2 significant (α < 0.05) circadian periods of 22.0 h (green onset in Figure 1b) and >24 h (blue onset in Figure 1b) after chi-square periodogram analysis (Sokolove and Bushell, 1978). After desynchronization was confirmed statistically for each animal, 2 independent investigators traced the onset of LMA for the dissociated bout, based on the same 2-3 weeks of data used for the periodogram analysis.
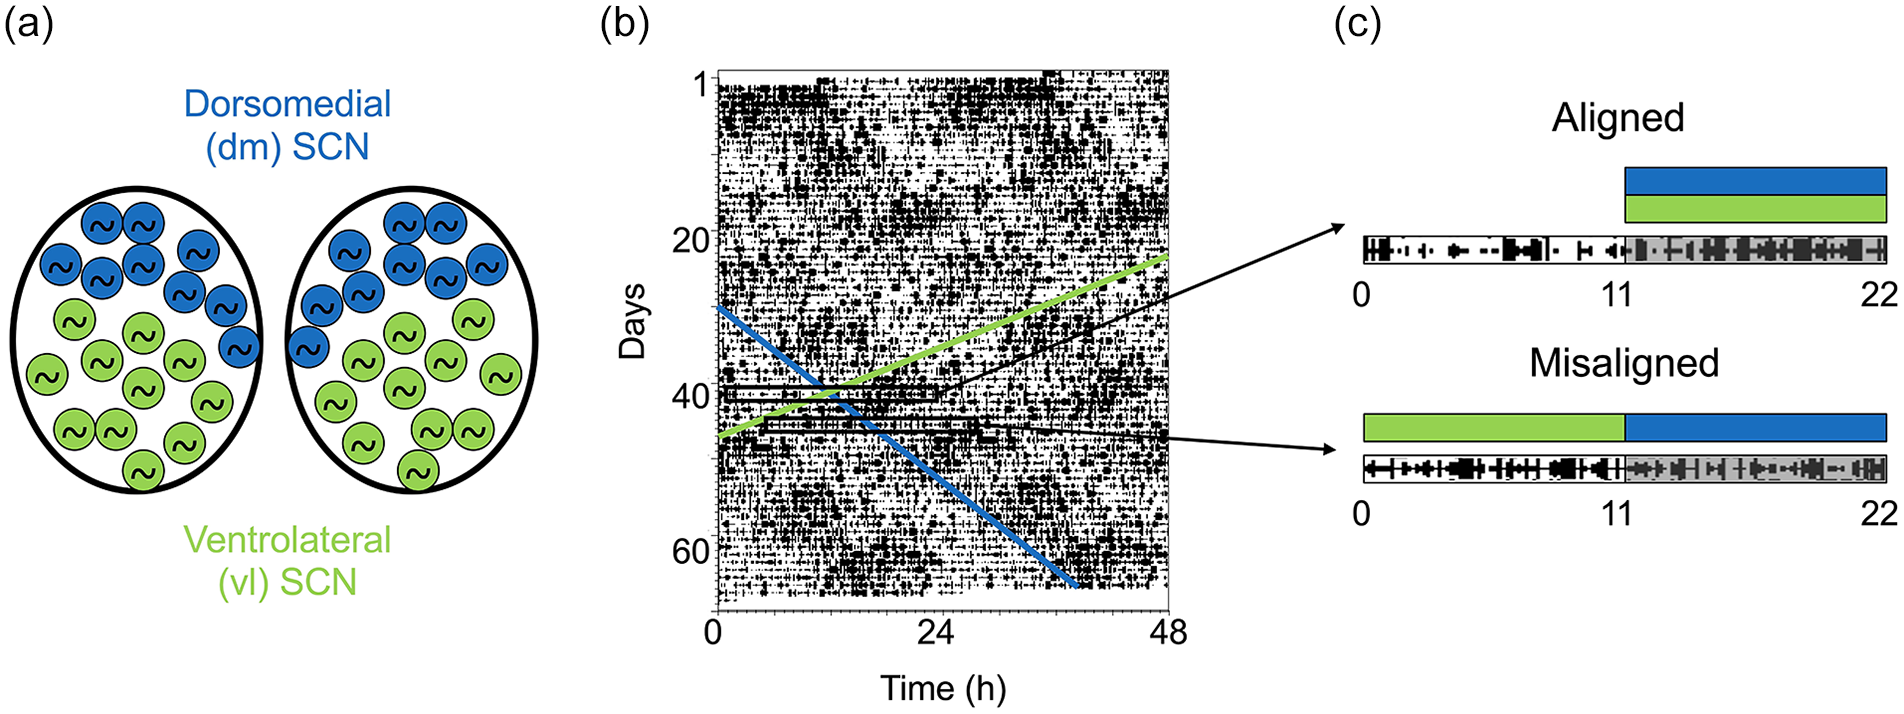
Dissociation between ventrolateral (vl) and dorsomedial (dm) SCN oscillators under T22. (a) Schematic representation of vl- and dm-SCN single-cell circadian oscillators associated, respectively, with an entrained 22-h locomotor activity rhythm (green) and a dissociated rhythm with a period longer than 24 h (>24 h; blue). (b) Representative actogram showing LMA of a male rat maintained in T22. The green diagonal band delineates the onset of the 22-h LMA rhythm, which coincides with the time of lights off. The blue line delineates the onset of the >24-h rhythm. Rectangles represent days of maximal phase alignment and misalignment. (c) Schematic representation of the 22-h activity bout (green) and the >24-h bout (blue) in either an aligned day, when the >24 h subjective night and the LD22 night coincide, or a misaligned day when they are out of phase. These 2 phases are used as contrasting phases for all the experiments in this study. Abbreviations: LMA = locomotor activity; SCN = suprachiasmatic nucleus.
Experiment 1: Resynchronization of LMA Rhythms in DD
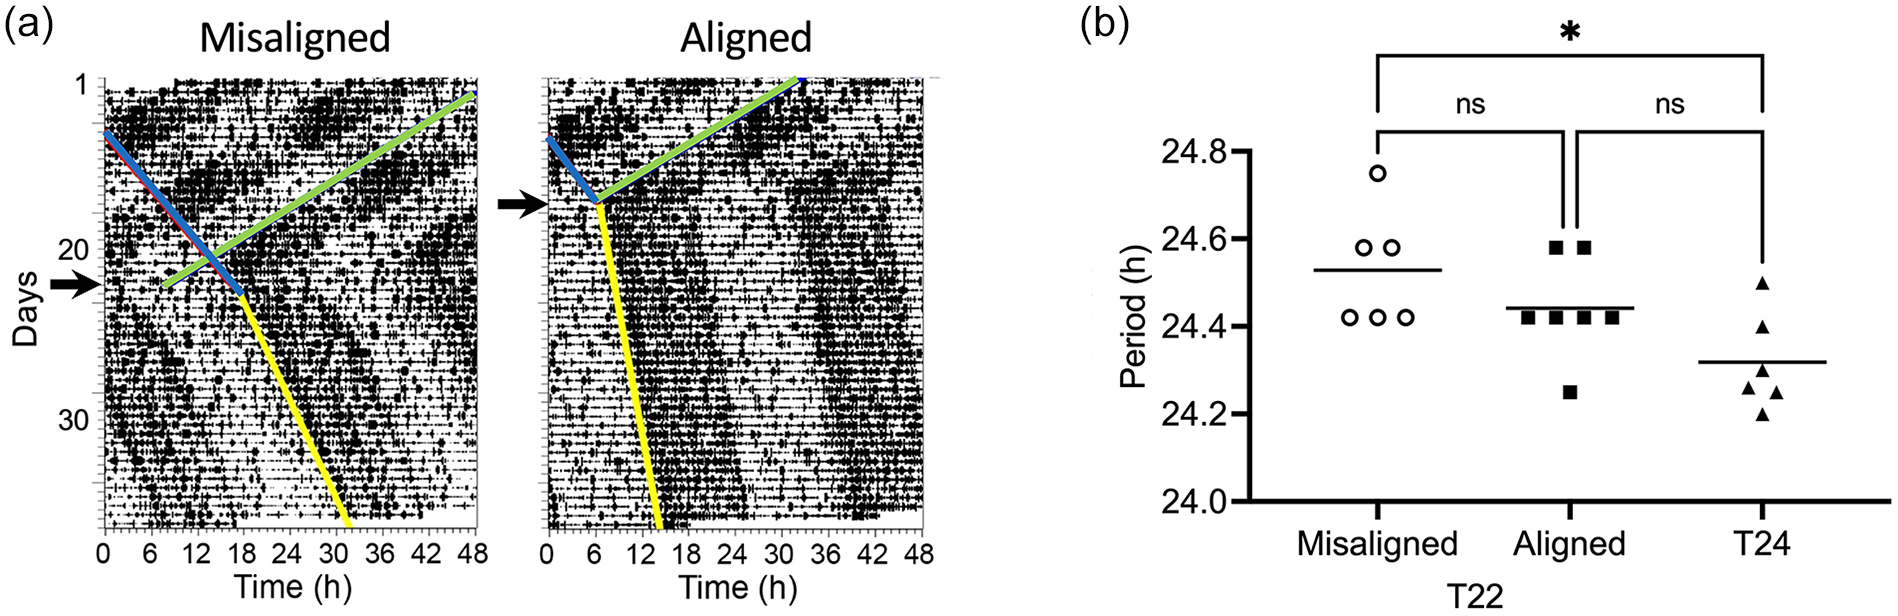
Rats were moved in the dark from their home chamber (T22) to a second chamber (constant dim red light, <2 lux) 3.8 h after lights off, on a day in which the dissociated activity bout fully coincided with the 22-h bout and the dark phase (“aligned” phase; Figure 1b and 1c) or on a day in which the dissociated activity bout fully occurred in the light phase, out of phase with the 22-h bout (“misaligned” phase; Figure 1b and 1c). Animals were subsequently left undisturbed and LMA was monitored for an additional 2-3 weeks. To avoid influence of activity transients immediately following release from T22, all phase measurements were made by eye-fitting activity onset for a 1- to 2-week interval in DD that began at least 7 days after release into DD and then extrapolated back to the day of release. Eye-fit onsets were plotted independently by 2 investigators blind to the treatment groups and were in agreement with each other. Period measurement for the resynchronized LMA rhythms was determined via chi-square periodogram (Sokolove and Bushell, 1978) for a 10-day window that started 1 day after the release into DD. The period for T24 animals was determined during the first 10 days after release into DD.
Experiment 2: Resynchronization of SCN Per1-luc Rhythms
Per1-luc rats were desynchronized in T22 as described above. Thirty minutes prior to lights out on a day of maximal phase alignment or misalignment (Figure 1), animals were rapidly decapitated under dim red light, and the brain was extracted and placed in cold Hank’s Balanced Salt Solution (HBSS). SCN cultures were prepared as described by Yamazaki et al. (2000). Briefly, SCN explants were prepared from 300 µm coronal brain sections cut on a vibrotome; explants were placed on a culture membrane inside a 35 mm Petri dish with 1.2 mL culture medium (serum-free, low sodium bicarbonate, no phenol red, Dulbecco’s modified Eagle’s medium; Sigma-Aldrich) supplemented with 10 mM 4-(2-hydroxyethyl)-1-piperazineethanesulfonic acid (HEPES) (pH 7.2), B27 (2%, Gibco), 0.1 mM luciferin (Promega), and antibiotics (25 U/mL penicillin, 25 µg/mL streptomycin). Dishes were covered with a coverslip sealed with vacuum grease and placed inside a light-tight and temperature-regulated chamber at 36 °C. Following an initial acclimation period of 12 h, explants from desynchronized rats were recorded undisturbed for at least 7 days. A control group of Per1-luc rats was housed in T24, and slices were prepared 30 min prior to lights-off as described above and recorded for 4-6 days.
Per1-luc bioluminescence was recorded with a cooled CCD video camera (Pixis 1024; Princeton Instruments, Trenton, NJ) directly coupled with non-infinity corrected with a 20× microscope objective using Winview32 software (Princeton Instruments). Raw images were taken every 15 min at 1024 × 1024 pixel resolution, down-sampled with 2 × 2 pixel binning, cosmic ray-corrected and exported to Image J as 8-bit image stacks. Image stacks were overlaid with a grid template consisting of 15 squares per SCN (Nakamura et al., 2005); each square measured 125 µm/side. Per1-luc bioluminescence was measured in the dm-SCN by averaging pixel density in 2 adjacent squares corresponding to the medial aspect of the dm-SCN, and for vl-SCN by averaging pixel density in 2 adjacent squares corresponding to the lateral aspect of the vl-SCN, respectively, total surface area per region of interest (ROI) = 125 µm × 250 µm. ROI time series data were baseline drift-corrected by subtracting a 24-h running average, re-zeroed by adding the minimum value of the series, and smoothed with a 3.0-h running average. Chi-square periodogram (Sokolove and Bushell, 1978) using El Temps (A. Diez-Noguera, Barcelona, Spain) was used to calculate the free-running period (FRP) of the baseline-corrected, smoothed bioluminescence data within each subregion ROI for a 6- to -day window starting 12 h after slice preparation for T22 slices and for a 4- to 6-day window for T24 slices. Only explants that exhibited a statistically significant period as determined by the periodogram analysis were used. The vl-SCN did not present sufficient amplitude in Per1-luc bioluminescence for period analysis; thus, only data from dm-SCN are reported here. Our previous studies have shown that the vl-SCN oscillation does not simply represent a light-masking response but likely a weak oscillator, as the clock gene oscillation persists in vivo for at least 1 cycle under DD conditions (de la Iglesia et al., 2004). This is consistent with the rapid fusion of the 2 LMA rhythms when the animals are released into DD from the misaligned state.
Statistics
Treatment effects for LMA and Per1-luc rhythms were analyzed via 1-way analysis of variance (ANOVA) followed by Tukey post hoc comparisons as appropriate. All effects were considered significant at p < 0.05.
Computer Simulations
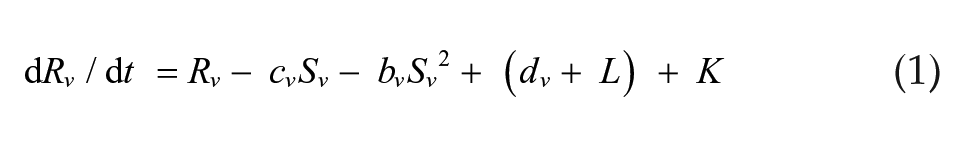
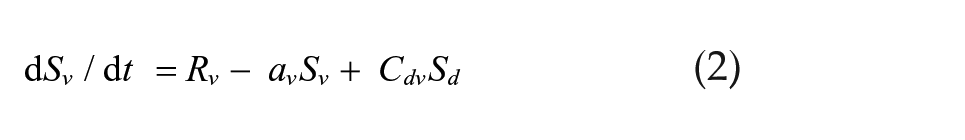
We simulated a set of 2 coupled Pittendrigh-Pavlidis oscillators forced by a zeitgeber L and then released into DD. In these equations, R and S are state variables, and a, b, c, and d are oscillator parameters.
Light-sensitive vl oscillator:
Light-insensitive dm oscillator:
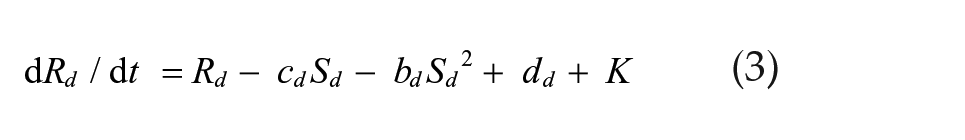
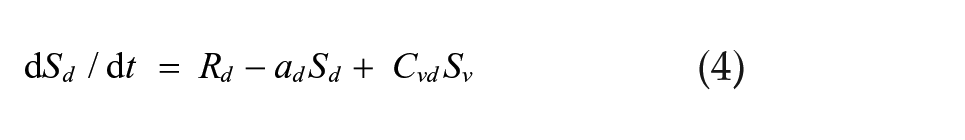
The zeitgeber L is represented by square waves with amplitude L = L and duration Ldur for lights-on and L = 0 for lights-off times. Cvd and Cdv are the coupling strengths of oscillator vl on dm and of oscillator dm on vl, respectively. These equations differ from the Pavlidis equation (Pavlidis, 1973) by a parameter K, which is a small nonlinear term (K = 1/[1 + 100R2]) formulated by W.T. Kyner (C. Pittendrigh and W. T. Kyner, personal communication). This parameter stabilizes the R variable by preventing it from approximating zero. Simulations were performed using the CircadianDynamix software (www.neurodynamix.net), which is an extension of NeuroDynamix II (Friesen and Friesen, 2010). We used the Euler method for numerical integration, with 1000 integration steps per 24-h day. LMA occurred every time the S variable in either the vl or dm oscillator rose above some threshold value, which we set to two-thirds of the maximum amplitude of this variable.
The Model
The 2 bouts of activity under T22 are modeled as the result of forced desynchrony of 2 oscillators, 1 T22-entrained vl, and 1 relatively coordinated dm, as explained in Schwartz et al. (2009). Oscillator period/amplitude, coupling strength, and T22 intensity are all interdependent parameters that generate the dissociation of vl and dm under T22 and their refusion under DD. The dependence of oscillator properties on these parameters is illustrated in Supplementary Figure S1. We first chose parameters for vl and dm that ensure τ V < τ D and free-running τ VD > 24 h. Then, we fixed a T22 intensity and verified the range of coupling strengths that were weak enough to allow entrainment of vl but not of dm under T22, while strong enough to allow their refusion under DD. This range was (0.01 < C < 0.15); thus, if C > 0.15 (too strong), vl and dm do not dissociate under T22, but if C < 0.01 (too weak), they do not refuse in DD due to their different τ (Osuna-Lopez et al., 2021; Suppl. Fig. S2). After fixing τ VD parameters and coupling strength, we can verify that if we either decrease zeitgeber intensity or its period difference relative to τ VD , then vl and dm refuse, illustrating the interdependence of these parameters on the generation of forced desynchrony (Suppl. Fig. S2).
A fixed, weak coupling system was sufficient to account for several forced desynchrony features that were modeled before (Schwartz et al., 2009) but cannot explain the different periods observed upon DD release of aligned and misaligned systems (Figures 2 and 3). We adopted a variable coupling strength to account for this limitation. In our model, coupling strengths are not fixed but depend on the phase relationship Φ VD between vl and dm oscillators. It is stronger and weaker, respectively, the more in-phase and out-of-phase the 2 oscillators are. For simplicity, we set a piecewise step function for the phase-dependent coupling parameter which restricts it to 2 values only:
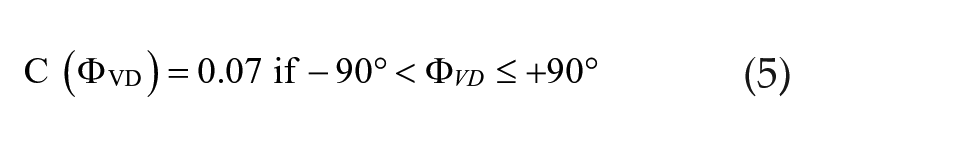
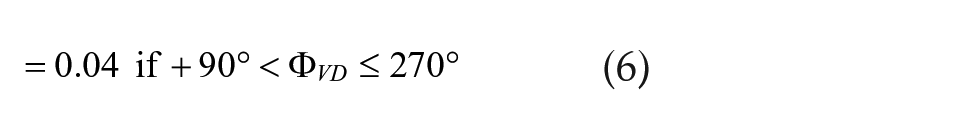
For the set of oscillator and T22 parameters we used, we were careful to use 2 values (C = 0.04, C = 0.07) that lay within the range of coupling strengths that were weak enough to allow entrainment of vl but not of dm under T22, while strong enough to allow their refusion under DD. In this way, the new model with alternating C values can account for both the previous (Schwartz et al., 2009) and the new phenomena.
The effect of T22 desynchrony on the free-running period of locomotor activity. (a) Actograms of 2 male rats that were maintained in several cycles of T22 desynchronization, then released into DD at dark onset; day of release is indicated by arrows. Release occurred when the 2 rhythmic components were maximally misaligned or maximally aligned; the animal chosen from the misaligned phase release shows an extreme period change for easier visualization. (b) Free-running period of animals released into DD from a T24 cycle or from a T22 cycle during the misaligned or aligned phases. Horizontal line represents the mean. One-way ANOVA for independent samples: F2,16 = 4.68, p = 0.0251. *p < 0.05 Tukey post hoc comparisons. Abbreviations: ANOVA = analysis of variance; DD = constant darkness.
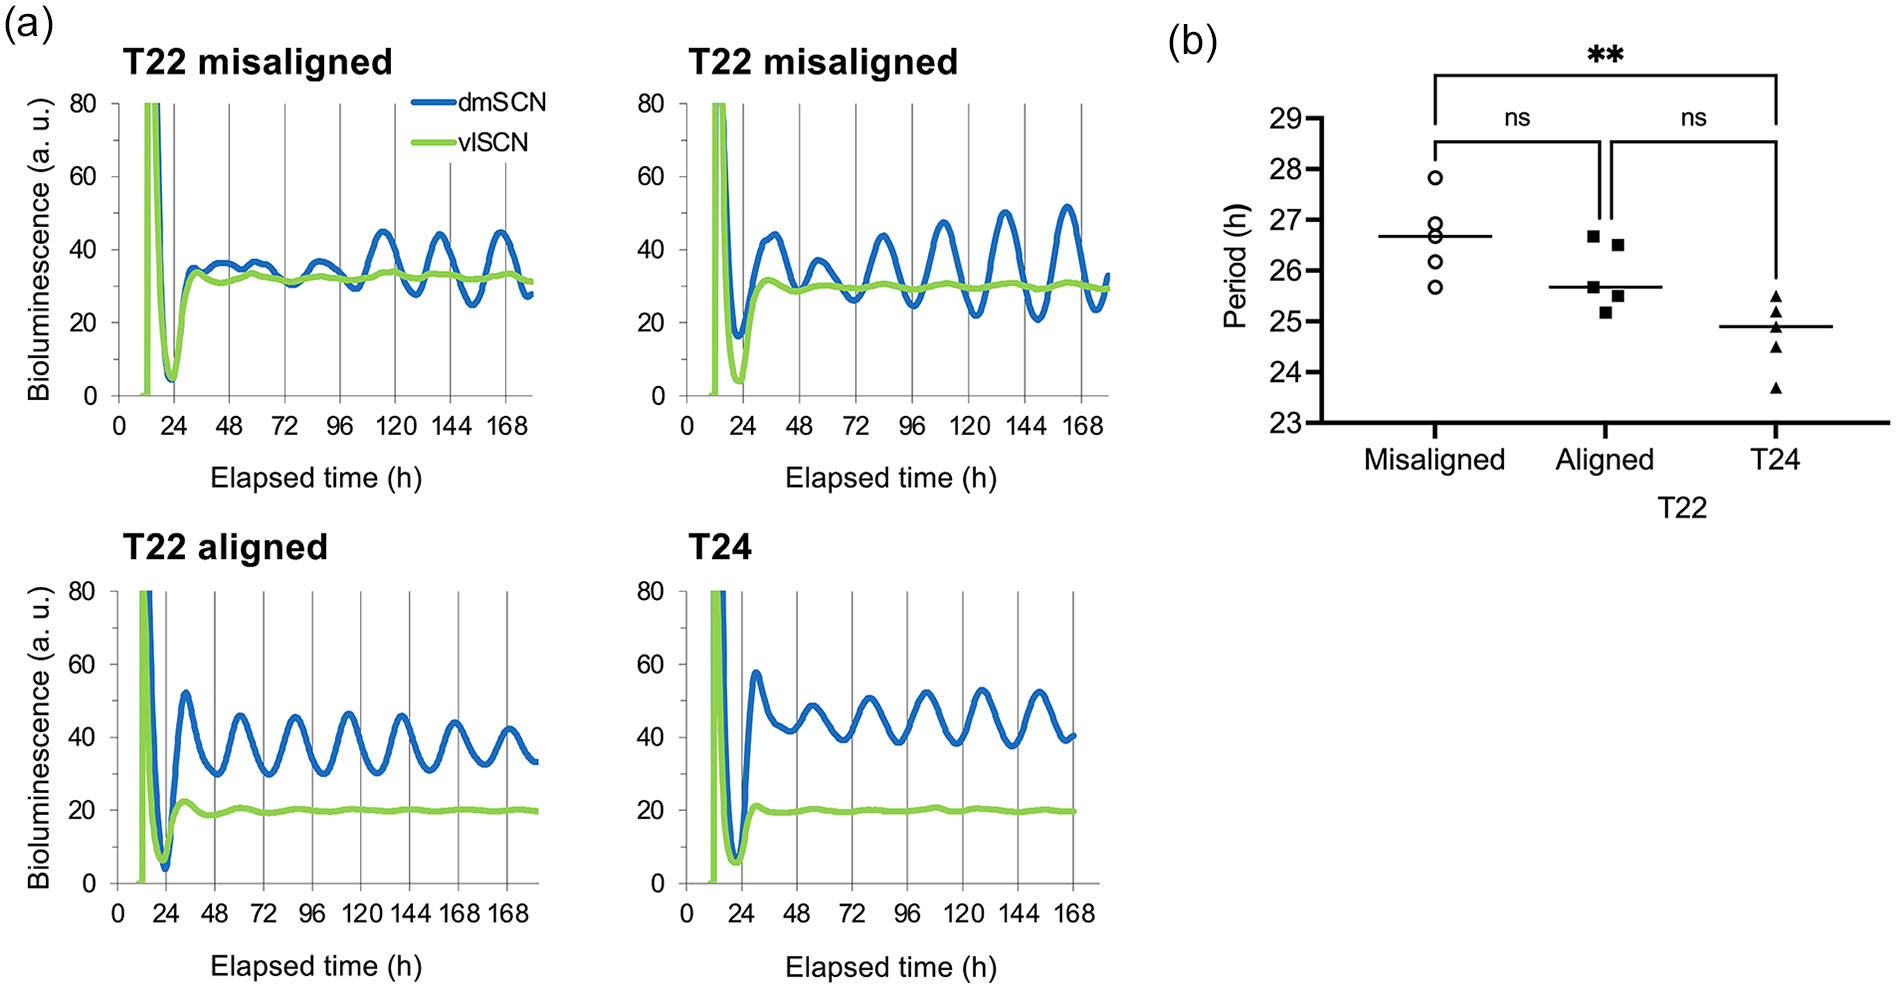
The effect of T22 desynchrony on the free-running period of ex vivo SCN explants from Per1-luc rats. (a) Detrended bioluminescence records from explants were taken 30 min prior to dark onset for a control (T24) animal or 30 min prior to dark onset at maximal phase alignment or misalignment for T22 animals. (b) The free-running period of the dm-SCN was longer in SCN explants taken from T22 animals compared with explants taken from control Per1-luc rats maintained in T24. One-way ANOVA for independent samples: F(2,12) = 8.63, p = 0.0047, **p < 0.01 Tukey post hoc comparisons. Per1-luc expression in vl-SCN quickly dampened in vitro, therefore we only analyzed the luminescence signal from dm-SCN. Abbreviations: ANOVA = analysis of variance; dm = dorsomedial; SCN = suprachiasmatic nucleus; vl = ventrolateral.
Results
T22 Desynchrony Lengthens the FRP of LMA and of Luciferase-Reported Clock Gene Expression
Wistar rats were desynchronized in T22 and were then released into constant darkness (DD) at maximal phase alignment or misalignment as determined by LMA. Activity rhythms rapidly resynchronized upon release into DD in both phase-aligned and phase-misaligned rats (Figure 2). A 1-way ANOVA comparing the FRP of T22 misaligned, T22 aligned and T24 rats showed that T22 animals had a longer FRP, F2,16 = 4.68, p = 0.0251. Post hoc comparisons revealed that T22 misaligned animals had a longer FRP than T24 animals (Figure 2).
We then asked whether the in vivo LMA period changes were also present in the isolated SCN. Per1-luc rats were desynchronized in T22 and then euthanized at maximal phase alignment or misalignment; a control group was housed in T24. The ex vivo period of both misaligned and aligned phase explants was longer than that of T24 controls, F2,12 = 8.63, p = 0.0047 (Figure 3). Post hoc comparisons revealed that T22 misaligned animals had a longer FRP than T24 animals (Figure 3). Misaligned phase explants typically revealed an initial lower amplitude (Figure 3a), a phenomenon that was predicted by our initial model of T22 forced desynchrony (Schwartz et al., 2009).
Bidirectional Coupling Between Ventrolateral and Dorsomedial SCN Accounts for the FRP and Light-Induced Phase Shifting
Although a simple 1-oscillator model is able to replicate several complex phenomena (Granada et al., 2011; Tokuda et al., 2020), a 2-oscillator system with Φ VD -dependent coupling strength was the minimum model required to account for the observed results. In addition, assessment of clock gene expression in the T22 desynchronized rat has identified 2 anatomically distinct oscillators in the vl- and dm-SCN (de la Iglesia et al., 2004). In our forced desynchrony model, coupling switches from strong to weak as the 2 oscillators alternate between aligned and misaligned states, respectively. If DD starts when oscillators are aligned, the zeitgeber is turned-off (L = 0) and the system free-runs with the fixed, prevailing coupling (C = 0.07). If, on the contrary, it is released into DD when oscillators are misaligned, free-running ensues with the prevailing weaker coupling (C = 0.04). Coupling strength does not change anymore because the phase relationship between oscillators does not change during free-running. Just after DD release, we assume that aftereffects are expressed, resulting in different FRPs associated with different coupling values (Figure 4). A similar trend in period changes is shown for simulations of another set of oscillator parameter values within the range of weak coupling strengths that allow forced desynchrony (Suppl. Fig. S3), although it becomes clear that the direction of this change could be different in a range of coupling values that we did not use. Because our simple model allows only 2 coupling strengths, the simulated period aftereffects are limited to 2 values, one for the desynchronized misaligned state and another for the desynchronized aligned and all synchronized states. For this reason, the period of simulated T24 aftereffects is the same as that of T22 aligned, both shorter than the LD22 misaligned animals. Our behavioral and ex vivo data revealed a trend, although not statistically significant, for the aligned T22 FRP to be longer than the T24 FRP (Figures 2 and 3). The reason for this discrepancy with the model may be that the vl- and dm-SCN under T22 are dynamically in and out phase, and it is virtually impossible to release the T22 system from a fully in-phase state. Of note, the number of simulated aftereffects days is exaggerated in Figure 4 to allow visualization of period differences.
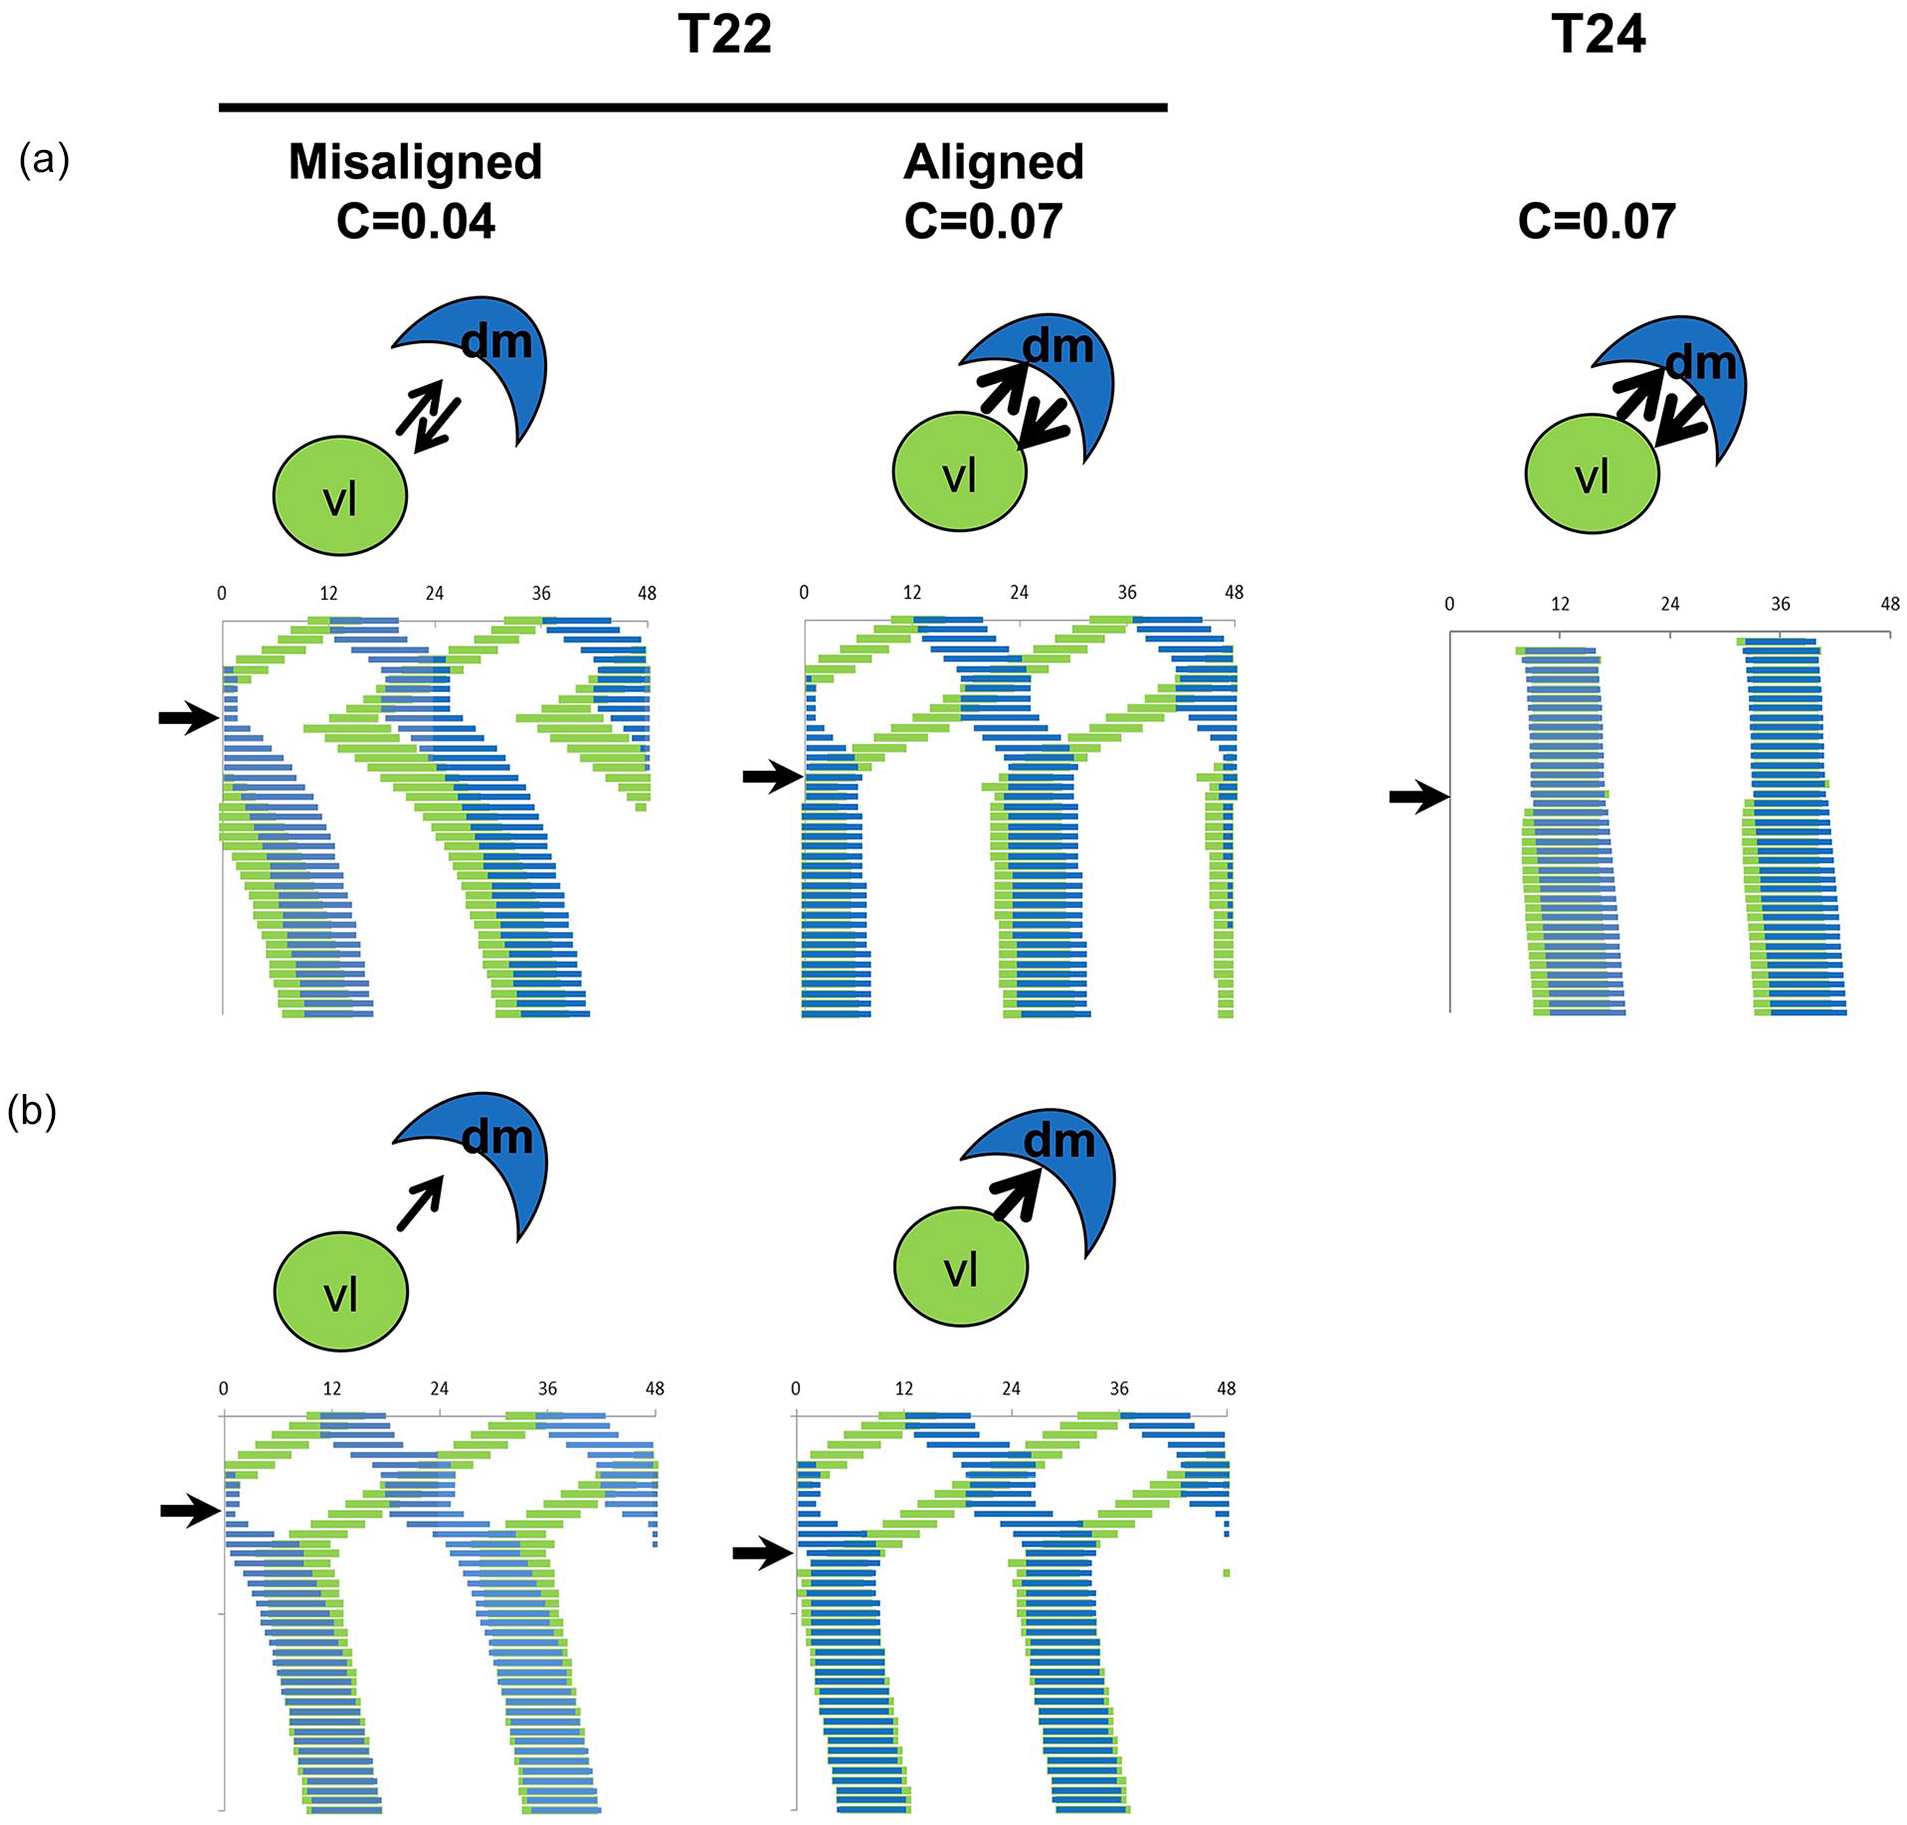
Mathematical modeling of the effect of T22 desynchrony on the free-running period of locomotor activity. (a) Three simulations are shown in which a light-sensitive oscillator vl (τ = 24.2 h) is differentially coupled to a light-insensitive oscillator dm (τ = 24.5 h) and forced by T22 or T24. During T22 forced desynchrony (days before the black arrow), the phase relationship between vl and dm is changing and our model assumes that coupling is changing according to equations (5) and (6), attaining stronger values during more aligned states: C = 0.04 under misalignment and C = 0.07 under alignment. Following these same equations, coupling is fixed on the stronger value (C = 0.07) under T24 because the in-phase relationship does not change. Each system is released into DD on the day indicated by the black arrow and our model assumes that upon refusion, coupling stays unchanged (C = 0.04 if the release occurred in the misaligned state and C = 0.07 if the release occurred in the aligned state or under T24) in the first days in DD (days after black arrow). The number of aftereffect days is exaggerated in this figure to better visualize their period differences. (b) Unidirectional (vl to dm) coupling fails to simulate the effect of T22 alignment and misalignment on the FRP. Directions of arrows between dm- and vl-SCN indicate coupling directions and their thickness and their coupling strength. Parameters: L = 1, Ldur = 11; avl =adm = 0.85; bvl = vdm = 0.3; cvl = 0.8, cdm = 0.6; dvl = ddm = 0.5. Abbreviations: DD = constant darkness; dm = dorsomedial; FRP = free-running period; SCN = suprachiasmatic nucleus; vl = ventrolateral.
A bidirectional coupling is shown to be essential for simulating this phenomenon (Figure 4a). In a unidirectional coupling system, vl entrains the dm oscillator and the period of the coupled system is the period of vl, independent of the coupling strength (Figure 4b). In this scenario, even if coupling between vl and dm changes along the forced desynchronization, the period of the system after DD release is always the same, independent of whether the initial state was aligned or misaligned. By contrast, in a bidirectional coupling system, the resulting FRP is modulated by coupling strength (Figure 4a). Importantly, our bidirectional model explains, as we had previously shown (Schwartz et al., 2009), the period of the τ>24h oscillation while the system is desynchronized under T cycles with periods lower than 24 h. Paradoxically, the τ>24h period gets longer as the period of the T cycle at which the system is desynchronized gets shorter (Campuzano et al., 1998), which is predicted by the model (Suppl. Fig. S4).
We have previously shown that a delaying light pulse applied during the subjective night of the vl oscillator just before DD release induces the expected phase shift if applied during the aligned state, but fails to do so if applied during the misaligned state ((Schwartz et al., 2010; Figure 5a). We wondered whether our bidirectional coupling model would also account for this state-dependent response to light. In our model, light-induced phase shifts are mediated by the light-sensitive vl oscillator, which undergoes a phase shift that propagates to the dm oscillator. The effectiveness of this propagation depends on the strength of coupling (Figure 5b). The model predicts that when bidirectional coupling is weak, the vl oscillator shifts but it is not sufficiently strong to carry the phase of the dm oscillator (Figure 5b, left). In contrast, the phase shift of the vl oscillator is effectively propagated to the dm oscillator when coupling is strong (Figure 5b, right) and the unified system shifts. Similar patterns are shown for light pulses at the advance region and for an intermediate coupling strength (Suppl. Fig. S5). Importantly, a model in which coupling was unidirectional from the vl- to the dm-SCN failed to mimic the observed phase-shifting response.
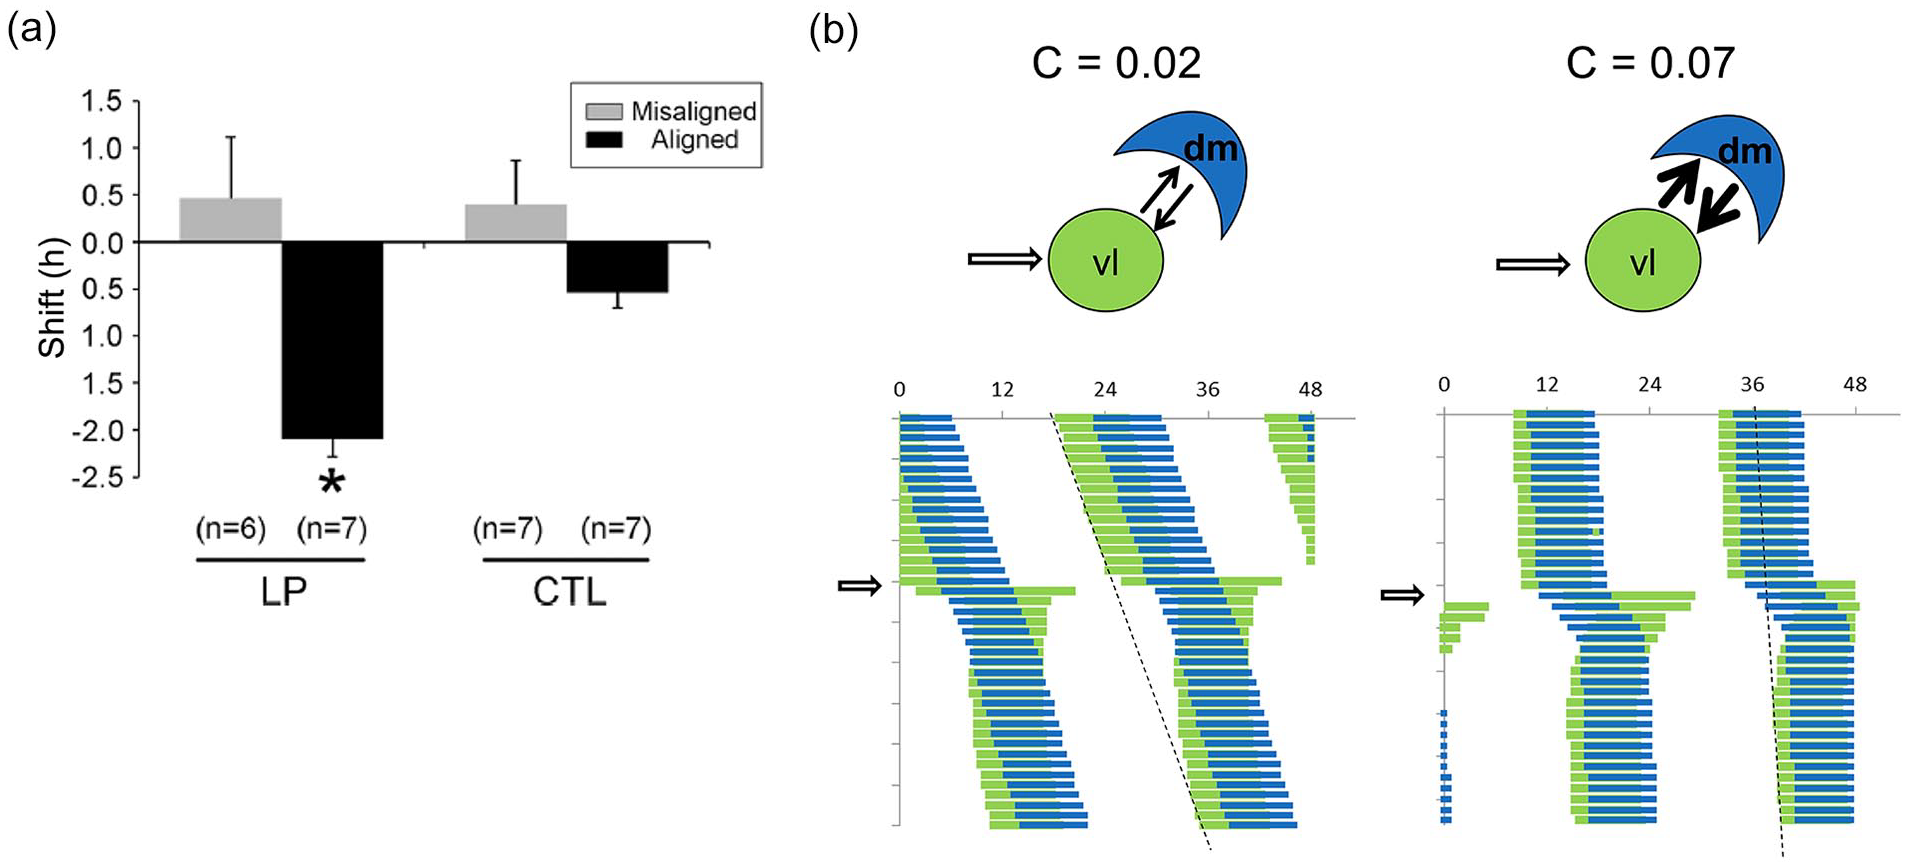
Mathematical modeling of the effect of T22 desynchrony on the response to a delaying LP. (a) Induced phase delay of T22 desynchronized rats by an LP applied during the early subjective night either during aligned or misaligned phases. Data from Schwartz et al. (2010). (b) Simulation of the application of an LP (open arrow) on a free-running system composed by a light-sensitive vl and a light-insensitive dm oscillator. Left: Bidirectional weak coupling (C = 0.02) is not enough for the initially phase-shifted vl oscillator to shift the dm oscillator. Right: Bidirectional strong coupling (C = 0.07) enables the phase-shifted vl oscillator to shift the dm oscillator, with the resulting phase shift of the entire system. Different free-running periods before and after LP application are due to their distinct coupling strengths. Parameters: L = 3, Ldur = 1, avl = adm = 0.85; bvl = vdm = 0.3; cvl = 0.8, cdm = 0.6; dvl = ddm = 0.5. Abbreviations: CTL = control light pulse; dm = dorsomedial; LP = light pulse; vl = ventrolateral.
Discussion
Exposure of rats to T22 leads to the stable desynchronization of several rhythmic outputs of the central circadian pacemaker located in the SCN, including the rhythms of LMA, sleep stages, core body temperature, and the release of melatonin, cortisol, and luteinizing hormone (de la Iglesia et al., 2004; Cambras et al., 2007; Lee et al., 2009; Schwartz et al., 2009; Smarr et al., 2012; Wotus et al., 2013). The desynchrony of these rhythmic outputs is associated with rhythmic clock gene expression within the T22-entrained vl-SCN and the dm-SCN that oscillates with a >24-h period. The results and modeling we present here suggest that under T22 forced desynchrony the 2 subregional oscillators change their mutual coupling strength as they move in and out of phase with each other. Our simulations of the interacting oscillators were only able to mimic the behavior of the DD released circadian system in aligned and misaligned states when the 2 subregional oscillators were bidirectionally coupled. In other words, a unidirectional model in which the LD cycle entrains the vl-SCN, which in turn entrains the dm-SCN with a single vl→>dm coupling direction, failed to emulate the FRP changes we measured in vivo and ex vivo upon release of the system into constant conditions. Furthermore, the mutually coupled model also predicted our previously described phase-shifting response to a single light pulse after T22 rats are released into DD (Schwartz et al., 2010). Thus, the T22 forced desynchrony paradigm reveals that the functionally, phenotypically, and anatomically distinct vl- and dm-SCN likely constitute a system of mutually coupled oscillators that dynamically interact to orchestrate outputs and encode photic signals that entrain it.
Tract tracing studies have shown that the retinohypothalamic tract of the rat predominantly targets the vl-SCN, whereas in other species like the mouse, retinal axonal terminals have a more widespread distribution in the SCN (Moore and Silver, 1998; Morin et al., 2006). These differences in topography of retinal input were historically interpreted as the basis of how photic input to the SCN is encoded by the different subregions and cell types. Our data suggest that regardless of which neurons are the direct targets of retinal ganglion cells, the coding of photic signals likely involves a dynamic mutual interaction between retino-recipient and non-retino-recipient neurons in the nucleus. Indeed, our simulation in which the vl-SCN unidirectionally entrains the dm-SCN failed to predict key aspects of the LD22 forced desynchronized SCN. Interestingly, the configuration in which 2 mutually coupled oscillators encode photic information also predicts desynchronization of behavioral rhythms in the mouse under chronic jetlag conditions, suggesting that the dual oscillator encoding of photic entraining signals may be a common feature of the SCN (Casiraghi et al., 2016).
Previous studies in the rat have shown that after abrupt phase shifts of the LD cycle, the vl-SCN may be more readily phase-shifted than the dm-SCN (Nagano et al., 2003; Albus et al., 2005; Nakamura et al., 2005). Although these results support the notion of a unidirectional flow of photic information from the retina to the vl-SCN, to the dm-SCN, our results suggest that the final state of the system after a phase-shifting stimulus will be determined by the bidirectional interaction between the vl- and dm-SCN. This interpretation is supported by our previous results showing that a light pulse during the subjective night of the vl-SCN fails to induce an effective shift of the whole system if the vl- and dm-SCN are completely misaligned with each other (Schwartz et al., 2010). The simulations in the present study suggest that the effective phase shifts depend on the extent of coupling between the vl- and dm-SCN at the time the photic induction occurs. This interpretation is supported by evidence in the mouse that shows that reduced coupling as result of long photoperiods is associated with smaller pharmacologically induced phase shifts of SCN explants (vanderLeest et al., 2009).
Our model also predicted the changes in period we observed depending on the specific phase relationship between the 2 oscillators when the system is released into constant conditions. Although the FRP has been shown to depend on the period (T) of the LD cycle before release into constant darkness (Pittendrigh and Daan, 1976), the mechanisms behind these aftereffects are unknown. Our results suggest that different T cycles may drive the dual oscillator system to different degrees of coupling that could account for differences in FRP.
The period of the ex vivo SCN in our experiments was clearly different from the behavioral FRP displayed by animals under the same conditions (Figures 2 and 3). These differences could be the result of neural inputs to the central pacemaker that are removed when the SCN explants are prepared. Discrepancies between the behavioral and ex vivo SCN FRPs have been observed in mice as well. Paradoxically, while the mouse behavioral FRP is longer under longer T cycles, the ex vivo SCN period changes in the opposite direction (Aton et al., 2004; Molyneux et al., 2008; Azzi et al., 2017). In contrast, the changes in behavioral and ex vivo FRP after exposure of rats to T22 are in the same direction. Azzi et al. (2017) demonstrated that whereas the ex vivo period of the mouse ventral SCN changes in the expected direction – longer period with longer T cycle – the ex vivo period of the dorsal SCN changes in the opposite direction, as it is the case of the dm-SCN in the T22 rat. Furthermore, the T cycle induction of opposite period changes in each SCN subregion in the mouse relies on the ongoing and dynamic interaction between the 2 subregions (Azzi et al., 2017). Although these studies in the mouse suggest common network properties to those in the rat, it is important to highlight that each species behaves very differently under T22 cycles. Whereas rats show clear desynchronized behavior, mice appear to entrain to this T cycle. Our model explains the FRP of the coupled system as a direct consequence of the desynchrony of the rat vl- and dm-SCN, a phenomenon that is likely not present in the T22 mouse. Thus, one should be cautious about drawing analogies between the SCN network properties of the 2 species.
In summary, our analysis of the rat T22 desynchronized SCN reveals that a dual oscillator system constituted by the vl- and dm-SCN subregions may not only explain how the central circadian pacemaker orchestrates specific physiological and behavioral outputs but also underlie critical properties of the circadian clock, including period determination and photic entrainment.
Supplemental Material
sj-docx-1-jbr-10.1177_07487304221126074 – Supplemental material for Coupling Between Subregional Oscillators Within the Suprachiasmatic Nucleus Determines Free-Running Period in the Rat
Supplemental material, sj-docx-1-jbr-10.1177_07487304221126074 for Coupling Between Subregional Oscillators Within the Suprachiasmatic Nucleus Determines Free-Running Period in the Rat by Michael D. Schwartz, Trinitat Cambras, Antoni Díez-Noguera, Ana Campuzano, Gisele A. Oda, Shin Yamazaki and Horacio O. de la Iglesia in Journal of Biological Rhythms
Footnotes
Acknowledgements
This work was supported by awards #R01MH075016 and R01NS09421 to HOdlI. The authors thank Prof. Otto Friesen for the use of software Neurodynamix and Danilo Flôres for the simulation program.
Conflict of Interest Statement
The author(s) have no potential conflicts of interest with respect to the research, authorship, and/or publication of this article.
Notes
References
Supplementary Material
Please find the following supplemental material available below.
For Open Access articles published under a Creative Commons License, all supplemental material carries the same license as the article it is associated with.
For non-Open Access articles published, all supplemental material carries a non-exclusive license, and permission requests for re-use of supplemental material or any part of supplemental material shall be sent directly to the copyright owner as specified in the copyright notice associated with the article.