
Abstract
Modern imaging techniques allow the monitoring of circadian rhythms of single cells. Coupling between these single cellular circadian oscillators can generate coherent periodic signals on the tissue level that subsequently orchestrate physiological outputs. The strength of coupling in such systems of oscillators is often unclear. In particular, effects on coupling strength by varying cell densities, by knockouts, and by inhibitor applications are debated.
In this study, we suggest to quantify the relative coupling strength via analyzing period, phase, and amplitude distributions in ensembles of individual circadian oscillators. Simulations of different oscillator networks show that period and phase distributions become narrower with increasing coupling strength. Moreover, amplitudes can increase due to resonance effects. Variances of periods and phases decay monotonically with coupling strength, and can serve therefore as measures of relative coupling strength.
Our theoretical predictions are confirmed by studying recently published experimental data from PERIOD2 expression in slices of the suprachiasmatic nucleus during and after the application of tetrodotoxin (TTX). On analyzing the corresponding period, phase, and amplitude distributions, we can show that treatment with TTX can be associated with a reduced coupling strength in the system of coupled oscillators. Analysis of an oscillator network derived directly from the data confirms our conclusions.
We suggest that our approach is also applicable to quantify coupling in fibroblast cultures and hepatocyte networks, and for social synchronization of circadian rhythmicity in rodents, flies, and bees.
Introduction
Networks of coupled oscillators are ubiquitous in living nature and physical systems (Pikovsky et al., 2001; Strogatz, 2003). Therein, even weak coupling can lead to a synchronization or pattern formation (Glass and Mackey, 1988; Winfree, 1990). Often, oscillator networks constitute incoherent states (i.e., oscillators have independent periods and random phases) or synchronized states due to overcritical coupling strength (Kuramoto, 2003).
In chronobiology, dispersed fibroblasts represent an incoherent state (Nagoshi et al., 2004), whereas the suprachiasmatic nucleus (SCN) exhibits complete synchronization in wild-type animals under standard conditions (Yamaguchi et al., 2003). The observation of frequency locking in the synchronized state allows a binary classification associated with undercritical and overcritical coupling.
There are, however, chronobiological questions requiring a more detailed quantification of coupling strength: do increasing cell densities strengthen coupling between fibroblasts even if no global synchronization is achieved (Noguchi et al., 2013)? Do inhibitors of neuronal communication weaken coupling within the SCN despite persisting synchronization (Ono et al., 2016)? Is there a dependence of coupling strength on the number of cohabitating animals in systems with social synchronization (Paul et al., 2015)?
In all these cases, modern recording techniques allow to monitor rhythms of individual oscillators. In this work, we suggest to study the corresponding distributions of individual periods, phases, and amplitudes to quantify coupling strength beyond a binary classification into incoherent and coherent states. It will be shown that period distributions are helpful indicators in the case of undercritical coupling, whereas narrowing of phase distribution and amplitude expansions can serve as markers of coupling strength in synchronized states.
Circadian systems constitute networks of coupled oscillators on different levels. Gene-regulatory feedback loops generate oscillations in almost every cell. Synchronization of these noisy oscillations can lead to precise self-sustained circadian rhythms on the organismic level.
In mammals, synchronized neurons in the SCN orchestrate physiological rhythms of the whole body with an astonishingly high precision. The network of SCN neurons illustrates that single-cell oscillations can be quite different from network oscillations. Synchrony, precision, and large amplitudes arise as emergent properties due to coupling (Herzog et al., 2004, 2017; Welsh et al., 2010; Mohawk and Takahashi, 2011).
There is also evidence that other cell types such as fibroblasts or hepatocytes can be coupled. It has been shown, for example, that cell densities of fibroblast cultures affect rhythmicity (O’Neill and Hastings, 2008; Noguchi et al., 2013). In many cases, however, the coupling strength is not sufficient to allow complete synchronization.
Moreover, there are reports on social synchronization of circadian rhythmicity in weakly interacting mice (Paul et al., 2015), hamsters (Paul et al., 2014), flies (Levine et al., 2002), and bees (Fuchikawa et al., 2016). Here, tactile contacts, pheromones, and common environmental factors are discussed as coupling mechanisms (Bloch et al., 2013).
In all these examples of coupled circadian oscillators, the type and strength of coupling are debated. Close to the synchronization threshold, the Kuramoto theory provides a sophisticated framework to quantify synchronization (Kuramoto, 1975). For example, the synchronization index R, which is tantamount to the global phase coherence, is widely used to characterize the onset of synchronization (see, e.g., Strogatz, 2000).
The situation is less clear for overcritical coupling as found in the SCN or undercritical coupling as in dispersed fibroblasts. In these cases, wide ranges of coupling strength lead to practically the same phenotype: complete synchronization or desynchronization, respectively.
We present in this article a conceptional framework of how measured data can be exploited to estimate coupling strength between oscillators. We illustrate the concept using well-studied networks of amplitude phase oscillators (Bodenstein et al., 2012; Gu et al., 2013) and an established experimental protocol to pharmacologically reduce circadian coupling. Ensembles of coupled amplitude phase oscillators are systematically analyzed to extract features that are associated with increasing coupling strength. These features are based on distributions of periods, phases, and amplitudes. We show that narrowing of period and phase distributions as well as amplitude expansion are related to an increasing coupling strength. Although an explicit calculation of coupling strength from ensembles of oscillators is currently impossible, a quantitative comparison between situations in which putative coupling mechanisms are differentially manipulated can be performed. In the case of SCN networks, for example, the effects of GABA inhibitors could be tested; and, in fibroblasts, cultures of low and high cell densities can be compared.
As a first step, we analyze simulated networks to test the following hypotheses that have been previously described in the dynamical systems literature:
For undercritical coupling (desynchronized oscillators), the period distribution becomes narrower with increasing coupling strength (Liu et al., 1997). It is known from engineering that frequencies can approach each other due to coupling (frequency pulling) (Wiener, 1961). Furthermore, when increasing coupling, some of the oscillators might constitute frequency-locked clusters (Hoppensteadt and Keener, 1982).
For overcritical coupling (complete synchronization), the phase distribution becomes narrower with increasing coupling strength. Even in the case of complete frequency locking, phases of individual oscillators differ due to varying intrinsic frequencies or amplitudes (Strogatz, 2000). On a population level, these different phases are termed “chronotypes” (Roenneberg et al., 2003). It is plausible that for strong synchronizing signals, the phase dispersion shrinks.
Coupling can induce amplitude expansion (“resonances”). Whereas rigid limit cycles can be described successfully as phase oscillators (Ashwin et al., 2016), amplitudes of weak oscillators near the Hopf bifurcation can be amplified by synchronizing agents. This implies that an observation of resonant behavior also provides information on the underlying oscillator type.
After studying simulated networks, we will analyze data from brain slices representing the network of SCN neurons. We exploit local fits with amplitude-phase models to quantify period, phase, and amplitude distributions for 3 different situations: 1) synchronized SCN mouse explants, 2) application of TTX to reduce spike-associated coupling, and 3) washout of TTX to restore coupling. It is reasonable to assume that these situations represent strong, weak, and medium coupling, respectively (Yamaguchi et al., 2003; Baba et al., 2008; Webb et al., 2009, 2012; Enoki et al., 2012; Evans et al., 2013; Taylor et al., 2017).
Materials and Methods
Numerical Simulations
Numerical solutions of Equations (11)–(12), have been obtained for a total integration time of
Analysis of Simulated Time Series
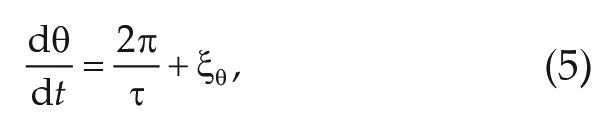
The instantaneous phase
A further analysis of the instantaneous phases and amplitudes was restricted to a time interval between
Analysis of Experimental Time Series
Previously published data from PER2::LUC recordings in coronal SCN slices, as published in Abel et al. (2016), are analyzed in the Experimental Data from the Suprachiasmatic Nucleus section. First, time series corresponding to bioluminescence recordings of single SCN neurons are detrended by means of a Hodrick–Prescott filter. To this end, we use the
by means of an autocorrelation approach as described in Westermark et al. (2009). Here,
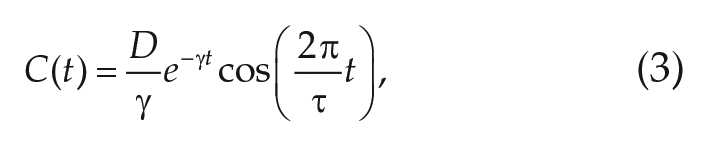
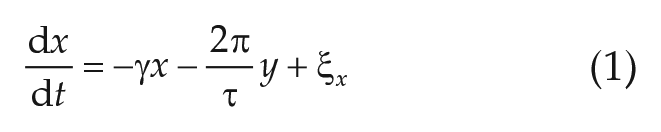
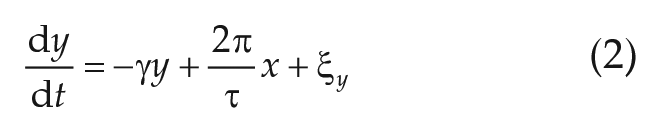
which can be analytically obtained from Equations (1)–(2), is fitted to the numerically obtained autocorrelation function of the experimental time series of interests, obtained by means of the
Simulations of the stochastic ordinary differential Equations (1)–(2), as depicted in Figure 5B–D, have been obtained by means of Euler’s method for stochastic equations using
Fitting a Linearized Hopf Oscillator
In addition to the method described in the previous section, we also fit a (stochastic) linearized Hopf oscillator
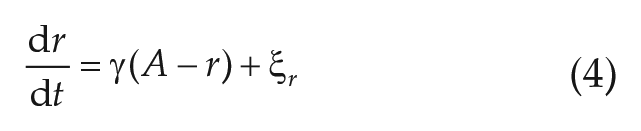
with
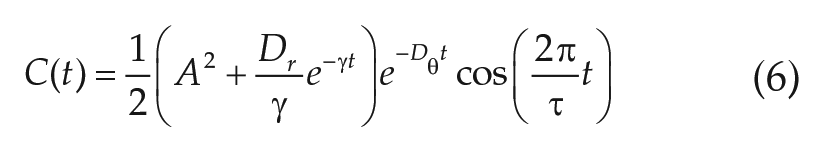
is fitted to the numerically obtained autocorrelation function of the experimental time series of interest. Because fitting Equation (6) is an ill-conditioned problem due to the summation of 2 exponentials, we set
Networks of Linearized Hopf Oscillators
In the Network Model Based on Fitted Parameters section, we study mean-field coupled networks of linearized Hopf oscillators. The underlying equations read as
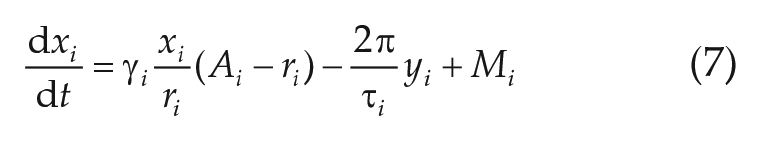
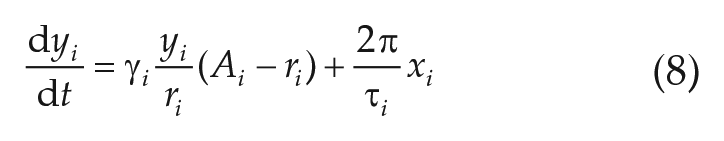
with
Random Networks
Oscillator dynamics on a random network are investigated as follows: we assume that the probability of oscillator
Results
Analysis of Coupled Amplitude-Phase Oscillators
Model Equations
In complex systems of coupled oscillators, the emergent behavior at the network level is influenced by both the properties of the individual oscillators and the coupling topology and strength between the oscillatory units. At an abstract level, the oscillatory entities can be of diverse nature. In the case of “social synchronization,” each oscillatory unit describes the dynamics at the level of the organism. In the case of the SCN or fibroblast cultures, the individual oscillatory units correspond to cell-autonomous circadian clocks. The intrinsic dynamical properties of the single oscillators can be conveniently parameterized by means of the generic phase-amplitude model:
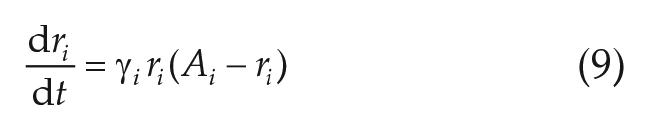
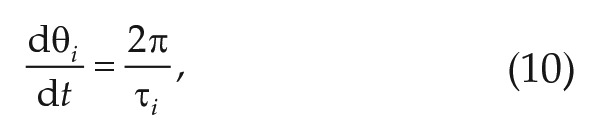
which is considered a simple description of a stable limit cycle in a 2-dimensional (2D) plane and is commonly termed the Poincaré oscillator (Glass and Mackey, 1988). Equation (9) determines the dynamical evolution of the radial coordinate
What kind of emergent network properties, not inherent to the isolated oscillatory units, arise due to mutual coupling, and how do these properties depend on the coupling strength? To test this, we consider an ensemble of
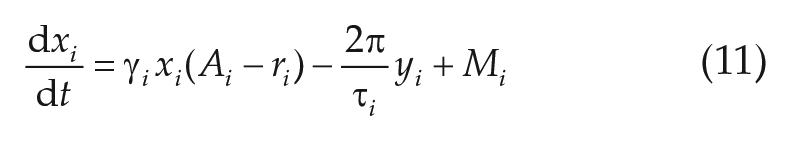
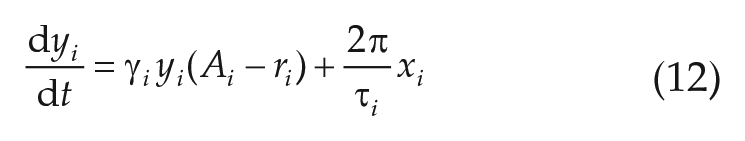
where we have rewritten Equations (9)–(10) in Cartesian coordinates and made, without loss of generality, the assumption that the mean field
To get an intuition about the impact of increasing coupling strength, we investigate the dynamics of system (11)–(12) for 3 representative values of
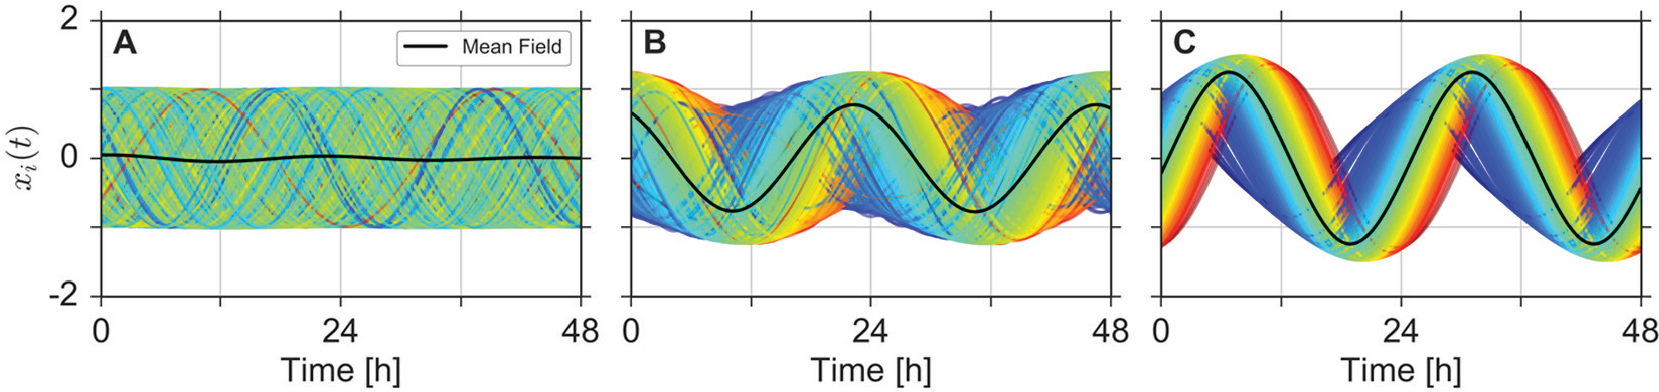
Temporal order formation after coupling. Steady-state dynamics (i.e., after decay of transients) are plotted for a total length of 2 days and 3 different coupling strengths: (A)
In the case of
Emergent network properties are fingerprints of coupling
The examples of the previous section show that certain dynamical properties such as amplitudes and periods of the individual oscillators are subject to change if the mutual coupling between the oscillators is varied. To study changes in amplitudes, phase organization, and periods in more detail, we investigate the oscillatory properties of every single oscillator for all 3 coupling strengths (
A direct comparison of the intrinsic free-running periods
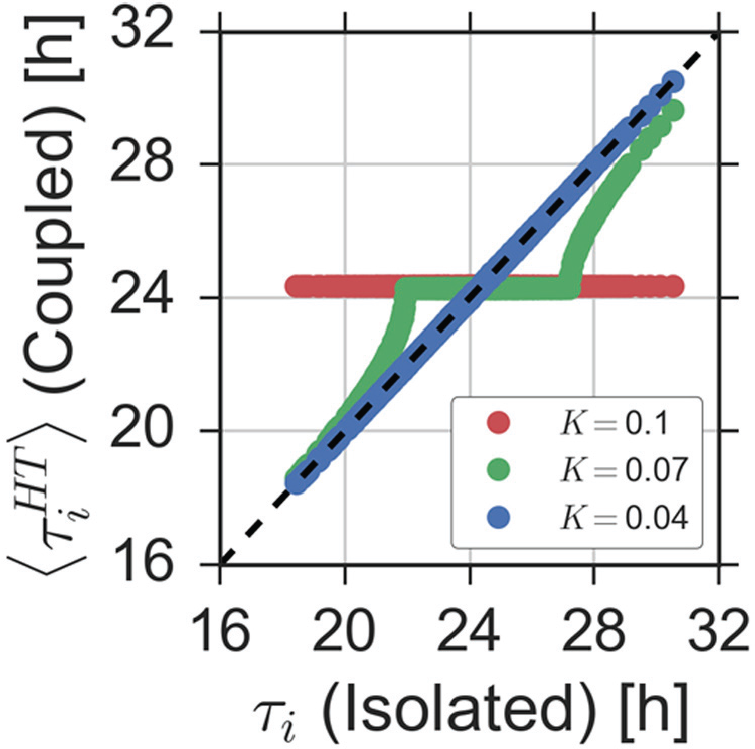
Increasing coupling leads to the formation of frequency plateaus. Average periods
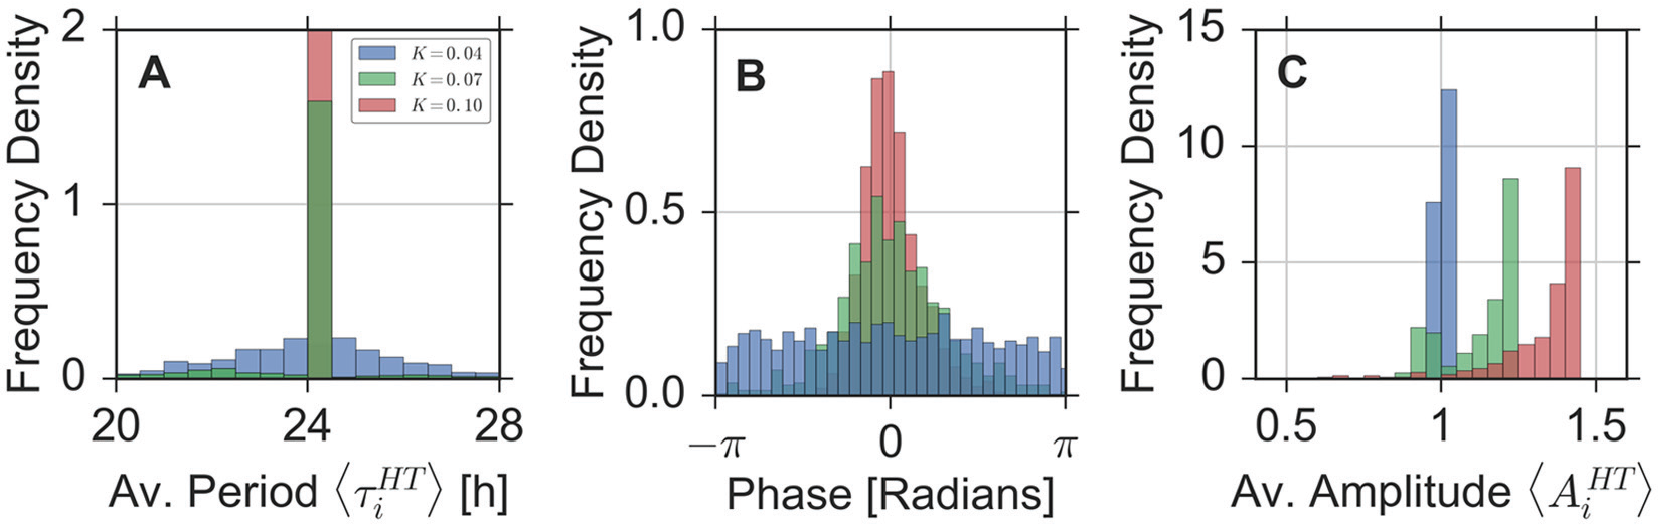
Distributions of oscillator properties. Histograms of the periods (A), phases (B), and amplitudes (C) of the individual oscillators for 3 different coupling strengths. Color coding represents the coupling strength:
As noted in the previous section, we can observe a re-organization of the oscillation phases with varying coupling strength. Although (instantaneous) oscillator phases
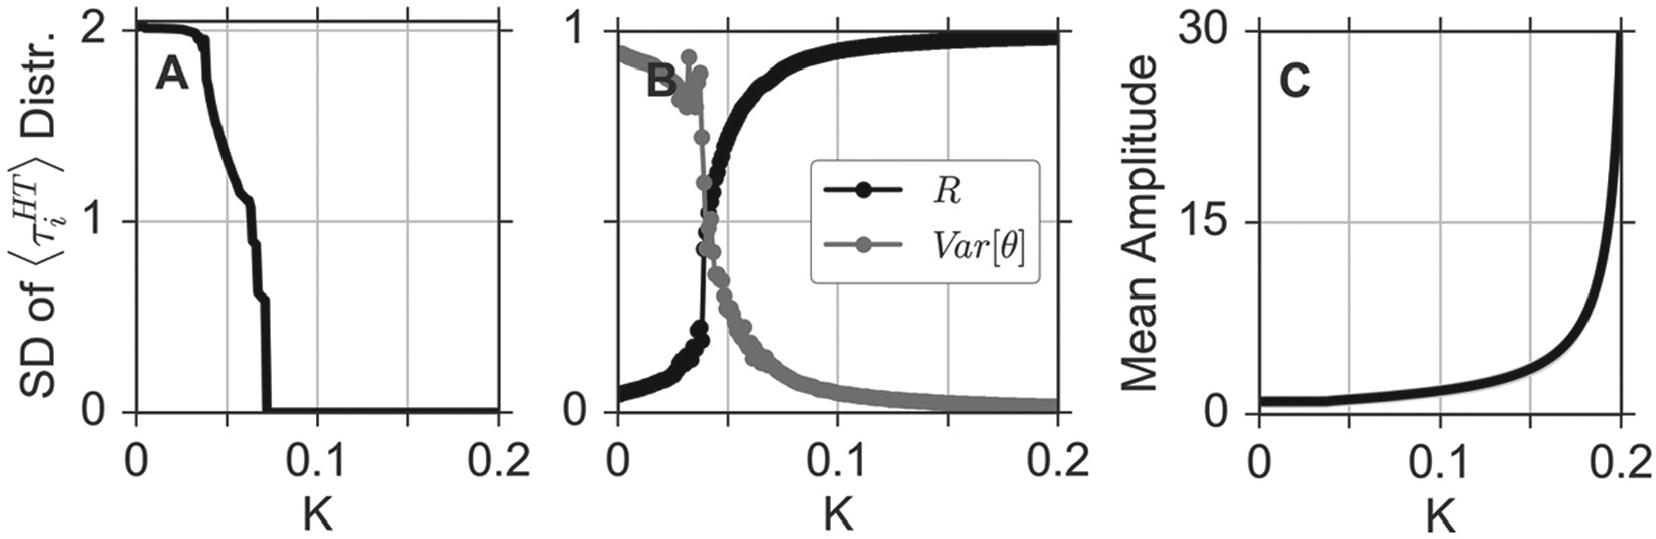
Finally, in Figure 4, we systematically explore the above-described findings for a broader range of coupling strength
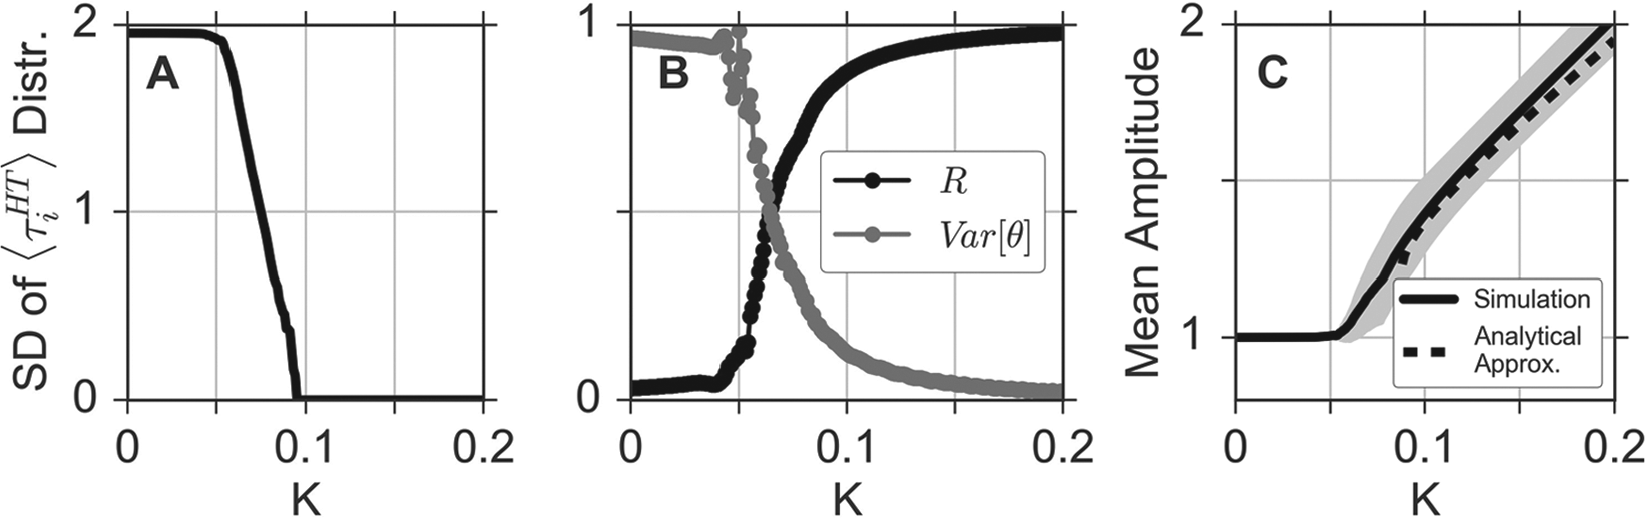
Dependence of emergent network properties on the coupling strength K. (A) Standard deviations (SDs) of the period distribution of individual oscillators in dependence of the coupling strength K. (B) Circular variance (gray) of the phase distribution and global phase coherence
Similar to the oscillation period, the amplitude of the oscillators experiences no change in the regime of undercritical coupling; see Figure 4C. As soon as the coupling exceeds the threshold
in the case of overcritical coupling (i.e., for all K ≥
Dependence on Single-Cell Properties
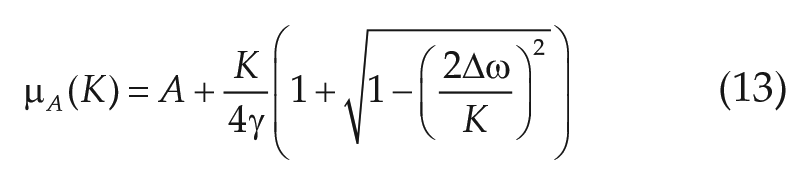
From Equation (13), it becomes clear that the amplitude not only increases with increasing coupling strength
The critical coupling strength
For fixed values of
Finally, as also can be deduced from Equation (13), we can observe that an increasing intrinsic amplitude
In conclusion, different oscillator properties at the single-cell level can produce differential responses with coupling. Thus, the behavior at the network level for different coupling regimes might provide information on the underlying oscillator type.
Experimental Data from the Suprachiasmatic Nucleus
Studying simulated networks of mean-field coupled oscillators resulted in the following theoretical predictions: increasing coupling can lead to frequency locking, a narrowing period distribution, a decreasing variance of the phase distribution, and an increasing amplitude due to resonance effects. We will use these predictions to interpret data from slices of SCN tissue ex vivo. It has been shown that, even though single SCN neurons are able to generate circadian rhythms, the remarkable precision of the SCN as a tissue crucially depends on heterogeneous intercellular couplings (Herzog et al., 2004). Here, we focus on previously published data from PER2::LUC recordings in 5 coronal SCN slices of neonatal to 7-day-old mice, in which spike-associated couplings have been altered by pharmacological treatments with tetrodotoxin (TTX) (Abel et al., 2016). Therein, after 4 days of bioluminescence recordings following the slice preparations, 2.5 µM TTX was applied and remained in the medium for 6 days. Subsequently, TTX was washed out from the culture medium, and recordings were maintained for at least 8 more days; see Abel et al. (2016) and Taylor et al. (2017) for details. In Abel et al. (2016), single SCN neurons were automatically identified and tracked in the 2D bioluminescence time-lapse recordings. Ensemble average bioluminescence intensities (black line) and SDs (gray-shaded area) for each time point of the recordings of one SCN slice are plotted in Figure 5A. Time-series data that correspond to the other SCN slice preparations are plotted in Supplementary Figure S8. As already noted in Abel et al. (2016) and Taylor et al. (2017), application of TTX leads to a reduction in synchrony and a reduced amplitude of the SCN cells that can be partially reversed by washing out TTX. Here, we estimate oscillation properties of these single-cell time series separately under all 3 conditions (i.e., before TTX application, during TTX application, and after washing TTX from the medium). To this end, we fit a (stochastic) linearly damped oscillator model with 3 parameters to the data separately under all these conditions, using an autocorrelation function approach as described previously (Westermark et al., 2009; Tokuda et al., 2015); see the Materials and Methods section for further details. By this method, we determine for each neuronal cell its free-running period, amplitude, radial relaxation rate, and fluctuation or noise strength independently under every condition. In Figure 5B–D, representative simulated time traces for the estimated parameters under each condition are shown.
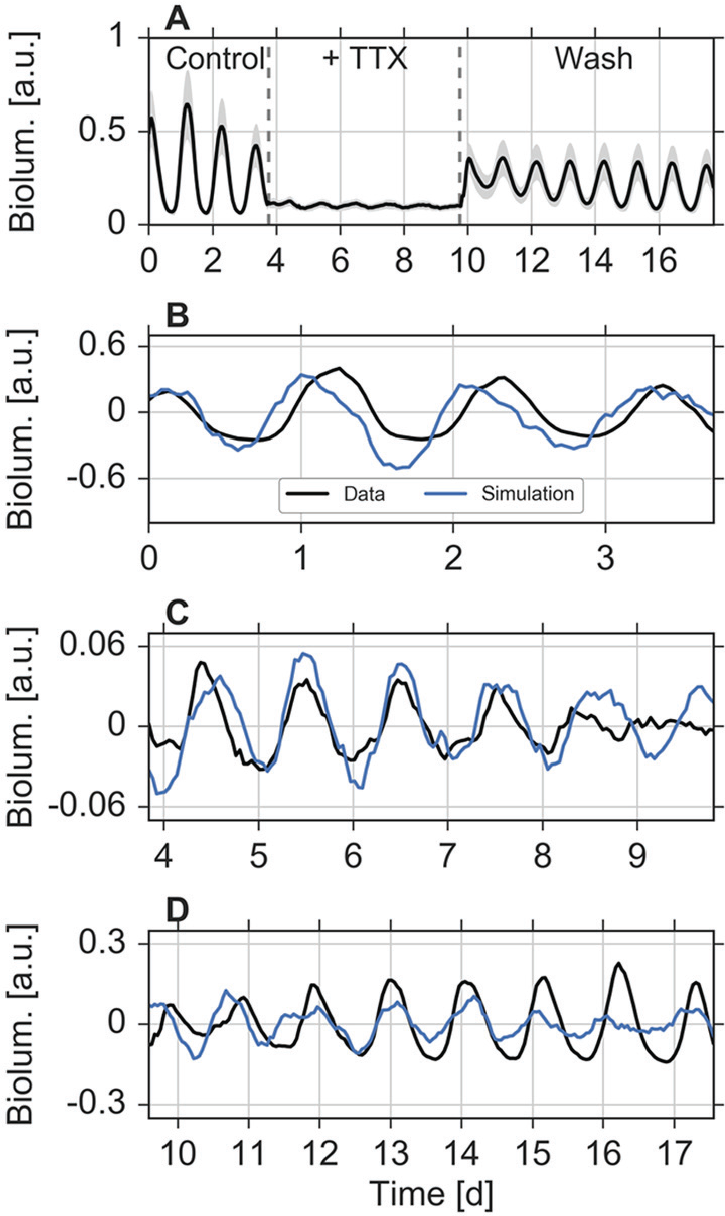
Fitting oscillator models to experimental data. (A) Ensemble averages (black line) and standard deviations (gray-shaded area) of bioluminescence time series from automatically identified and tracked neurons in coronal slices of the SCN, as described in Abel et al. (2016). (B–D) Fits to time series from representative cells under all 3 conditions: before applying tetrodotoxin (TTX) (B), during the application of TTX (C), and after washing TTX from the culture medium (D). Black curves denote the original data, detrended by means of a Hodrick–Prescott filter as described in the Materials and Methods section. Blue curves denote simulations of the stochastic ordinary differential Equations (1)–(2) for the parameters, obtained by fits to the corresponding experimental time series as described in the Materials and Methods section. Initial conditions have been selected such that the stochastic dynamics resemble the experimental time series.
We can rediscover the characteristic patterns of different coupling regimes, as known from our simulation studies, when comparing period, phase, and amplitude distributions under all 3 experimental conditions; see Figure 6 for example distributions from the first SCN slice. Before application of TTX, the distribution of the single-cell periods has a mean of
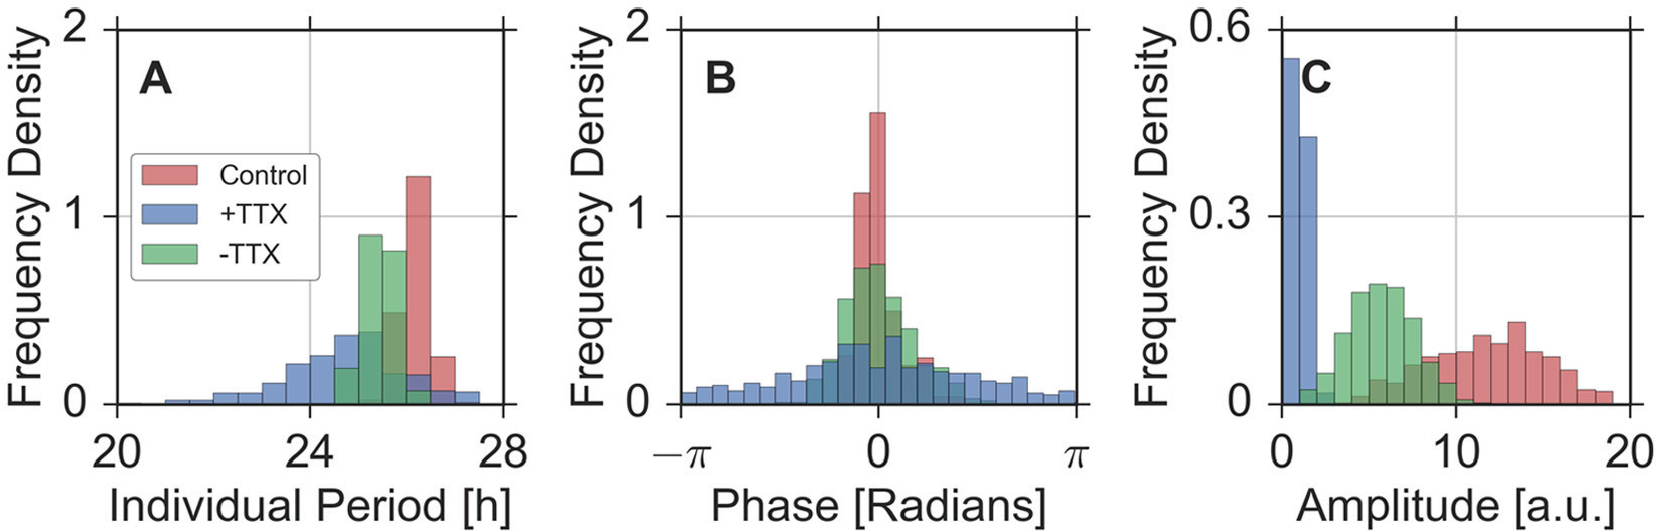
Emergent properties in SCN slice data. Period (A), phase (B), and amplitude (C) distributions under 3 experimental conditions, that is, before applying tetrodotoxin (TTX) (red bars), during the application of TTX (blue bars), and after washing out TTX from the medium (green bars). Periods and amplitudes of single neuronal biolouminscence time series are determined by means of oscillator fits as described in the Materials and Methods section. Phases have been obtained at times
In summary, we observe an increase of the empirical SD in the distributions of single-cell periods and phases as well as a decreasing mean of the amplitude distribution with application of TTX compared to the control condition or after washing out TTX. In analogy to our simulation results and previous studies (Gu et al., 2016a; Beersma et al., 2017), it is therefore plausible to assume that the application of TTX corresponds to a dynamical regime with relatively weak intercellular couplings compared to the other conditions. Note that application of TTX also might affect single-cell oscillators. Such additional effects of TTX could contribute to the period and amplitude changes.
Quite similar results were obtained in the 4 other SCN slice preparations, as shown in Supplementary Figures S9–S12. A summary of the statistical properties in the distributions of periods, phases, and amplitudes among all 5 SCN slice preparations can be found in Supplementary Tables S1–S3, respectively.
Network Model Based on Fitted Parameters
Inspired by our previous results, we next sought to investigate a network model, based on amplitude-phase oscillators that were fitted to the experimental single-cell data. To this end, we fit a “linearized Hopf oscillator” with 5 parameters to the time-series data separately under all 3 conditions, using an autocorrelation approach as performed in Westermark et al. (2009) and Tokuda et al. (2015); see the Materials and Methods section for details on the model and its corresponding autocorrelation function. Because the fit of such an autocorrelation function is an ill-conditioned problem due to the summation of 2 exponentials (see Equation (6)), we set
Our fitting procedure has been applied to the time-series data obtained under the application of TTX. Thus, we can investigate an oscillator network closely related to experimental data. We observe a qualitatively similar response of this biologically motivated network to changes in the coupling strength
Dependence of emergent network properties on the coupling strength
Finally, we investigate the behavior of oscillator networks under different random network topologies. Here, we assume that the probability that a certain oscillator has an influence on any other oscillator is given by a small number p; see the Materials and Methods section for details. In summary, we find that the results depicted in Figures 4 and 7 are robust for a broad range of network topologies as long as the connectivity between the oscillators is high enough. This holds true for coupled Poincaré oscillators (Suppl. Fig. S16) as well as coupled linearized Hopf oscillators that are based on fitted parameters (Suppl. Fig. S17).
Discussion
The circadian clock can be regarded as a system of coupled oscillators on the levels of cells, peripheral organs, and organisms. In many cases, for example the wild-type SCN, the individual oscillators are perfectly synchronized. In the case of undercritical coupling (e.g., for dispersed fibroblasts), no synchronization is observed. For varying conditions such as cell densities (Noguchi et al., 2013), population size (Bloch et al., 2013), knockouts (Ono et al., 2013), developmental stages (Tokuda et al., 2015), inhibitor applications (Herzog et al., 2017), or entrainment schedules (Buijink et al., 2016), changes of coupling strength can be expected. As long as no transitions between coherent and incoherent states are induced, however, no obvious qualitative changes occur.
A direct measurement of the absolute coupling strength is currently unavailable. This would be best estimated by monitoring the response of a single oscillatory entity with respect to its network embedding after an isolated perturbation of this entity. Here, we emphasize to indirectly quantify the relative coupling strength between different experimental conditions by analyzing distributions of periods, phases, and amplitudes. Network simulations show that for undercritical coupling, period distributions become narrower due to partial synchronization and frequency pulling. For overcritical coupling, phase distributions are informative because large coupling induces narrow phase distributions. This effect resembles reduced spreads of chronotypes for strong zeitgebers (Roenneberg et al., 2003; Granada et al., 2013). Furthermore, amplitudes might increase with coupling due to resonance effects. We provide analytical calculations for the amplitude expansion that agrees well with our numerical simulations.
We confirmed the theoretical predictions from oscillator theory using data from recent experiments with SCN slices (Abel et al., 2016). The untreated or restored SCNs exhibit larger amplitudes and narrow period and phase distributions compared to data with TTX treatment. According to our theoretical results, this is indicative of a reduction of coupling with application of TTX, which is in accordance with previous interpretations (Yamaguchi et al., 2003; Abel et al., 2016).
There are numerous additional applications of coupling strength quantifications in SCN preparations. For example, it has been suggested that coupling is changing in early development (Ono et al., 2016). Moreover, the relative strength of coupling via gap junctions and coupling factors such as vasoactive intestinal peptide (VIP), γ-aminobutyric acid (GABA), and arginine vasopressin (AVP) is discussed (Herzog et al., 2017). Our study encourages closer inspections of the corresponding period, phase, and amplitude distributions in forthcoming studies. Importantly, all these properties continuously change in a dose-dependent fashion. Often, a binary classification (synchronized or not synchronized) is used. Our approach allows to study dose-dependent changes of coupling strength.
Furthermore, circadian clocks have been found in virtually all mammalian tissues (Dibner et al., 2010). Thus, the quantification of coupling between cells in peripheral organs has been raised (Abraham et al., 2010; Guenthner et al., 2014). There are indications that hepatocytes are coupled, leading to a rather strong liver clock (Saini et al., 2013; Guenthner et al., 2014). In dispersed fibroblasts, mathematical modeling predicts coupling, even though no full synchronization is achieved (Rougemont and Naef, 2007). Indeed, Noguchi et al. (2013) have shown that increasing cell densities improve rhythmicity accompanied by increasing amplitudes. According to our concept, these observations indicate coupling.
In plant circadian systems, early studies suggested weak intercellular couplings of cell-autonomous clocks (Thain et al., 2000), but recent data show that circadian coupling allows synchrony among shoot apex clocks as quantified by phase variances (Takahashi et al., 2015). Furthermore, the statistical analysis of individual periods and phases indicates coupling in social groups of rodents (Paul et al., 2014, 2015) and honeybees (Fuchikawa et al., 2016).
In addition to the method described in this article, there are also alternative indirect methods to quantify coupling. For example, monitoring relaxation to equilibria after a perturbation provides information on coupling strength. In the SCN, local perturbations might be induced by optogenetic tools (Jones et al., 2015). In flies, short light pulses induced transient desynchrony, and the relaxation of the neuronal network revealed the kinetics of retuning (Roberts et al., 2015).
Another strategy is to study the kinetics of SCN plasticity on different protocols of light–dark cycles. Regional phase differences within the SCN network can be induced by very long photoperiods (e.g., 20 h of light and 4 h of darkness) (Evans et al., 2013), or by entrainment with unnaturally short and long zeitgeber periods such as 22 h or 26 h (Azzi et al., 2017). The relaxation dynamics of the induced phase differences can be exploited to explore coupling mechanisms.
Mathematically, a network of N uncoupled oscillators with different individual frequencies represents an N-dimensional torus (Grebogi et al., 1985). Contrarily, complete synchronization constitutes a 1D limit cycle in phase space. Thus, the attractor dimension (Farmer et al., 1983) could be regarded as a measure of coupling strength. Estimations of attractor dimensions, however, require long, stationary time series rarely available in chronobiology. Still, the observations of multiple period clusters (Ono et al., 2016), of “relative coordination” (Holst, 1939), and of “splitting” (Gwinner, 1974; de la Iglesia et al., 2000) point to loss of synchrony due to reduced coupling.
Our simulations in Figures 1–4 were based on amplitude-phase oscillators with global coupling. Our data-based networks with global (Figure 7) or random coupling (Suppl. Fig. S16–S17) do not address spatial structures. For more local coupling schemes or spatial clusters of differential oscillator properties, complex spatiotemporal patterns of periods, phases, and amplitudes can be expected (Bernard et al., 2007; Myung et al., 2012; DeWoskin et al., 2015). In such situations, measures of spatial coherence such as mutual information (Abel et al., 2016) or Moran’s I (Schmal et al., 2017) can complement the analysis of overall distributions discussed in this article.
Our approach assumes that periods, phases, and amplitudes can be measured for individual oscillators. In many cases, only overall signals are available for tissue slices or cell cultures (Maier et al., 2009). In such cases, only indirect cues provide information on coupling strength. It has been shown theoretically and experimentally (Abraham et al., 2010) that coupling can establish strong oscillators (Bordyugov et al., 2015), that is, robust oscillations with limited sensitivity to perturbations and narrow entrainment ranges. Indeed, in vertebrates with strongly coupled pacemaker cells, the entrainment ranges are much narrower than in invertebrates (Aschoff and Pohl, 1978). A narrow entrainment range implies also a high sensitivity of the entrainment phase with respect to period variations (Hoffmann, 1969; Schmal et al., 2015), which is known also for human chronotypes (Granada et al., 2013; Wright et al., 2005).
In summary, we stress that a quantification of coupling strength is essential to understand emergent properties of circadian systems. Oscillator theory predicts that period, phase, and amplitude distributions are useful indicators of coupling strength. We analyze several oscillator networks and find that variances of periods and phases shrink monotonically with increasing coupling strength. The increase of amplitudes appears to be model dependent as confirmed by numerical studies and analytical calculations. The theoretically predicted effects are illustrated by experimental data from SCN slices treated with TTX. We emphasize that our approach is also applicable to peripheral tissues and social networks.
Footnotes
Acknowledgements
The authors gratefully thank Dr Bharath Ananthasubramaniam, Dr Grigory Bordyugov, Dr Jihwan Myung, and Dr Isao T. Tokuda for stimulating discussions, as well as Dr Daniel Granados-Fuentes and Thomas Wang for experimental support.
This work has been supported by the Deutsche Forschungsgemeinschaft (grant no. BO 3612/2-1) to CS, the Bundesministerium für Bildung und Forschung (grant no. 01GQ1503) to HH, and the National Institute of Neurological Disorders and Stroke (grant no. 095367-01) to EH. CS acknowledges support from the Joachim Herz Stiftung.
Author Contributions
CS, EH, and HH conceived and designed the study. CS performed the simulations. EH contributed the experimental data. CS, EH, and HH wrote the article. All authors gave final approval for publication.
Conflict of Interest Statement
The author(s) have no potential conflicts of interest with respect to the research, authorship, and/or publication of this article.
Notes
References
Supplementary Material
Please find the following supplemental material available below.
For Open Access articles published under a Creative Commons License, all supplemental material carries the same license as the article it is associated with.
For non-Open Access articles published, all supplemental material carries a non-exclusive license, and permission requests for re-use of supplemental material or any part of supplemental material shall be sent directly to the copyright owner as specified in the copyright notice associated with the article.