
Abstract
Photoperiodism plays an important role in the synchronization of seasonal phenomena in various organisms. In mammals, photoperiod encoding is mediated by differential entrainment of the circadian system. The limits of daily light entrainment and photoperiodic time measurement can be verified in organisms that inhabit extreme photic environments, such as the subterranean. In this experimental study, we evaluated entrainment of circadian wheel-running rhythms in South American subterranean rodents, the Anillaco tuco-tucos (Ctenomys aff. knighti), exposed to different artificial photoperiods, from extremely long to extremely short photophases (LD 21:3, LD 18:6, LD 15:9, LD 9:15, LD 6:18 and LD 3:21). Artificial photoperiods synchronized their activity/rest rhythms and clear differences occurred in (a) phase angles of entrainment relative to the LD cycle and (b) duration of the daily activity phase α. These photoperiod-dependent patterns of entrainment were similar to those reported for epigeous species. Release into constant darkness conditions revealed aftereffects of entrainment to different photoperiods, observed in α but not in the free-running period τ. We also verified if animals coming from summer and winter natural photoperiods entrained equally to the artificial photoperiods by evaluating their phase angle of entrainment, α and τ aftereffects. To this end, experimental animals were divided into “Matching” and “Mismatching” groups, based on whether the experimental photoperiod (short-day [L < 12 h] or long-day [L > 12 h]) matched or not the natural photoperiod to which they had been previously exposed. No significant differences were found in the phase angle of entrainment, α and τ aftereffects in each artificial photoperiod. Our results indicate that the circadian clocks of tuco-tucos are capable of photoperiodic time measurement despite their natural subterranean habits and that the final entrainment patterns achieved by the circadian clock do not depend on the photoperiodic history.
Keywords
A common feature of several animal species is the alternation between activity and rest times within a day—the daily activity/rest rhythm—expressed in both field and in laboratory conditions. These rhythms have been thoroughly studied in rodents in the laboratory, with the aid of running-wheels, which provide clear activity/rest outputs long assumed to be reasonable proxies for activity patterns in the field (Halle, 2000; Silvério and Tachinardi, 2020). In mammals, activity rhythms are controlled endogenously by a central circadian oscillator located in the hypothalamic suprachiasmatic nuclei (SCN) (Moore, 1983). The oscillator in the SCN is entrained by light/dark (LD) cycles via a monosynaptic input from the retina (Abrahamson and Moore, 2001). Thus, the properties of the circadian oscillator and its photic entrainment have been uncovered with experimental manipulation of artificial LD cycles. While most experiments have been performed with LD12:12 (12 h of light and 12 h of darkness), others have verified entrainment under different photoperiods, that is, proportions of light and darkness hours within a 24-h day (DeCoursey, 1972; Pittendrigh and Daan, 1976b; Elliott, 1976; Tackenberg et al., 2020). Because photoperiod varies throughout the seasons in nature (Bradshaw and Holzapfel, 2007), these experiments could provide a simplified model to understand the role of photoperiod in seasonal variation of daily activity patterns (Daan and Aschoff, 1975; Kenagy, 1976; Daan and Slopsema, 1978; Halle, 1995; Hoogenboom et al., 1984; Ware et al., 2012; Improta, 2020).
As the natural photoperiod changes progressively from summer to winter, dawn times happen later and dusk times earlier and, accordingly, animals in the field adjust their activity patterns. In many diurnal animals, activity onset times follow dawn, whereas in nocturnal animals, activity onsets often follow dusk (Daan and Aschoff, 1975; Kenagy, 1976). Thus, throughout seasons there is a stable phase angle of entrainment, that is, a steady phase difference between activity onset and dawn or dusk. In addition to the seasonal modulation of activity onset times, there is also a change in the activity duration, the time interval between daily activity onset and offset. For nocturnal animals, the activity duration is shorter in summer and longer in winter; the opposite is true for diurnal animals.
In some rodent species, the seasonal variations of activity patterns (onset time and activity duration) have been replicated in the laboratory, using artificial photoperiods and running activity rhythms (Pittendrigh and Daan, 1976b). When photoperiod is varied within the natural range experienced in the field, activity onset of nocturnal rodents closely follows lights-off times of the LD cycle (Elliott, 1976). This is accompanied by a lengthening of daily activity duration (α), in close agreement with field activity duration (Kenagy, 1976). When these animals are released into DD (constant darkness), these α changes are maintained in the first days under constant conditions, indicating the aftereffects of entrainment to different photoperiods (Pittendrigh and Daan, 1976a). In mammals, the photoperiod-dependent entrainment of the SCN shapes both α and the duration of the daily melatonin profile (Illnerová and Vaněček, 1982; Elliott and Tamarkin, 1994; Coomans et al., 2015), which relays time-of-year information to the hypothalamus-hypophyseal axis for control of seasonal phenomena such as reproduction and hibernation (Goldman, 2001; Ikegami and Yoshimura, 2012; Nakane and Yoshimura, 2019; Dardente et al., 2019).
In the laboratory, it is also possible to test what happens under extreme artificial photoperiods, much outside the natural range observed in the field. In these extreme conditions, the linear relationship between photoperiod, phase angle of entrainment, and α is lost (Elliott, 1976; Pittendrigh and Daan, 1976b; DeCoursey, 1972). The dynamics behind these complex patterns has been explained using mathematical modeling (Schmal et al., 2015; Flôres and Oda, 2020).
In this work, we verify the response to artificial photoperiods in a subterranean rodent species endemic to South America, known as the Anillaco tuco-tuco (Ctenomys aff. knighti). In contrast to epigeous rodents, tuco-tucos spend most of the day in underground tunnels, shielded from the natural LD cycle (Tomotani et al., 2012). On the annual scale, there is little information on the seasonal biology of Anillaco tuco-tucos, but other tuco-tuco species have seasonal modulation of their reproduction (Fanjul and Zenuto, 2008), fur cover (Cutrera and Antinuchi, 2004) and glucocorticoid hormones (Vera et al., 2011). These subterranean animals might not necessarily respond to daily and seasonal LD cycles like their epigeous counterparts. Nevertheless, our previous laboratory studies have shown that, in the 24 h scale, tuco-tucos display robust nocturnal running-wheel activity rhythms under LD12:12 conditions, and stable free-running rhythms in constant darkness (Valentinuzzi et al., 2009; Tachinardi et al., 2014; Yassumoto et al., 2019). Despite being subterranean and experiencing irregular light cycles in nature (Flôres et al., 2016), their phase response curve is similar to epigeous species (Flôres et al., 2013). In the annual scale, we have shown seasonal patterns of daily light exposure that were paralleled by α aftereffects in tuco-tucos captured in the field in summer and winter (Flôres et al., 2021), strongly indicating their ability to distinguish long- and short-day photoperiods in the natural range experienced in the tropics. Here, we submitted tuco-tucos to artificial LD cycles in the laboratory, with photoperiods ranging from extreme short- to long-day regimens, to verify their entrainment patterns of wheel-running activity/rest rhythms under controlled conditions. Specifically, we evaluated the phase angle of entrainment, α and aftereffects of entrainment. We also verified the effect of the photoperiodic history in these responses, by comparing animals previously kept in summer and winter natural photoperiods. The response of the circadian system to the artificial range of extended photoperiods confirms that tuco-tucos can process photoperiodic information in the SCN and shows that the response patterns are associated to those previously observed in model rodent species.
Material and Methods
This study was conducted between 2018 and 2019 in CRILAR (Centro Regional de Investigaciones Científicas y de Transferencia Tecnológica de La Rioja) in Anillaco, La Rioja, Argentina (28° 48′ S; 66° 56′ W; altitude: 1350 m), amid tuco-tuco’s (Ctenomys aff. knighti) natural habitat. At the summer solstice, photophase duration for the region is approximately 14 h and 53 min. This length is 3 h and 43 min longer than the photophase during the winter solstice, when the sunlight lasts for roughly 11 h and 10 min (time between civil twilights from Time and Date AS, 2021). All captures were held between January and February for “summer animals” and during July for “winter animals,” after the respective solstices, comprising four experimental seasons (Summer 2018, Winter 2018, Summer 2019, and Winter 2019).
Animals: Trapping and Housing
Tubular live traps made of rigid plastic (PVC) were placed in the entrance of active burrows. To minimize discomfort and stress to the animals, each trap was checked at least every 2 h.
After each capture, animals were weighed and sexed in the animal room, under controlled temperature (24 ± 2 °C) and natural photoperiod provided by a glass window. They were housed individually in acrylic cages (53 × 29 × 27 cm), with wood shavings for bedding, equipped with a running-wheel (23 cm in diameter, 10 cm wide, 1 cm between the bars). Food—commercial rabbit pellets, carrots, sweet potato, and diverse native plants—was available ad libitum and replaced daily at noncyclical times.
We used 48 specimens throughout the experimental seasons, from which we obtained 71 activity records. Of these, 27 activity records were obtained within a few days after capture and were classified as “freshly caught” records (15 animals during winter and 12 animals during summer). In addition, we also obtained 44 “previously caught” activity records from captive animals, either healthy animals that were already in the lab or animals that were recorded before as “freshly caught” and then “repeated.” These captive animals had been maintained under natural annual photoperiod variation (window illumination) before entering an experimental group.
Each experimental group consisted of freshly and previously caught activity records. Altogether, the 71 records were obtained using 34 animals once (Supplemental Table S2A) and repeating 14 animals (in two or more experimental seasons) (Supplemental Table S2B). We used these strategies to increase the number of animals in each group, considering the limitations of capturing wild tuco-tucos at a restricted seasonal window, which made it impractical to compose the groups solely of freshly caught animals.
The ratio between freshly and previously caught activity records was maintained as even as possible between different experimental conditions (Supplemental Table S1). Although tuco-tucos in the field do not expose to full photoperiods, in contrast to individuals maintained under lab window illumination, we have verified photoperiod dependent patterns of entrainment in the former (Flôres et al., 2021). We are, thus, convinced that animals in both conditions are exposed to similar photoperiodic signals and can be used together. Furthermore, no systematic differences were found in rhythm parameters between freshly caught tuco-tucos and those previously maintained under window illumination (Supplemental Table S3).
The experiments were carried out inside opaque insulation boxes, equipped with dedicated systems for ventilation and illumination (L: fluorescent white lights—1000 lux; D: dim red lights—5 lux); each isolation box supporting up to four cages. Running-wheel activity was monitored under artificial LD cycles, detailed in this article. Wheels were connected to the ArChron Data Acquisition System (Simonetta System-Universidad Nacional de Quilmes, Buenos Aires), the number of revolutions were recorded continuously and stored in a file in 5-min bins. In each experimental season, new animals were captured on consecutive days. Until the experimental groups were complete, the first captured animals were kept in the animal room under window-illumination for at most 6 days. Only then were the insulation boxes closed and the experiment started, preventing further interventions during the experiment.
Capture and laboratory procedures were approved by CEUA/IB-USP under the protocol Nº 319/2018 (São Paulo, Brazil) and by Secretaría de Ambiente—Ministerio de Planeamiento e Industria, Expte. Nº P4 00501-17-2018 (La Rioja, Argentina).
Experimental Protocol
The experimental protocol consisted of two stages:
Stage 1. Artificial Photoperiod (LD) and
Stage 2. Constant Darkness (DD).
In the Stage 1, animals were exposed to one of the following LD regimens:
All these regimens had the same period (24 h) given by the sum of L and D durations. Each animal was exposed to Stage 1 for 20 days, except animals #301 and #337 (Supplemental Figure S1D).
In Stage 2, animals were kept under DD, so that aftereffects from the previous artificial photoperiods could be measured.
To verify the effect of photoperiodic history, this complete protocol was applied on animals exposed to two opposite seasons. “Winter animals” were captured or previously held under a natural LD cycle with a “short-day” photoperiod (L < 12 h). “Summer animals” were captured or previously held under a natural “long-day” photoperiod (L > 12 h). Animals from both seasons were transferred to the LD regimens in Stage 1, ranging from extreme short- to long-day artificial photoperiods.
We organized the data in “Matching” and “Mismatching” experimental conditions, based on the relationship between the previous natural photoperiod and the artificial photoperiod in Stage 1 of the protocol. A “Matching” group stands for summer animals transferred to a long-day, or winter animals transferred to a short-day in Stage 1. However, a “Mismatching” group means summer animals transferred to a short-day or winter animals transferred to a long day in Stage 1. Figure 1 summarizes the protocol and displays the sequence of conditions in each experimental group. In addition, as a reference, we included data from the standard LD 12:12 photoperiod from a previous study in which animals (n = 8) had been caught between June and October 2007 (Valentinuzzi et al., 2009). These animals were not used in Matching and Mismatching comparisons.
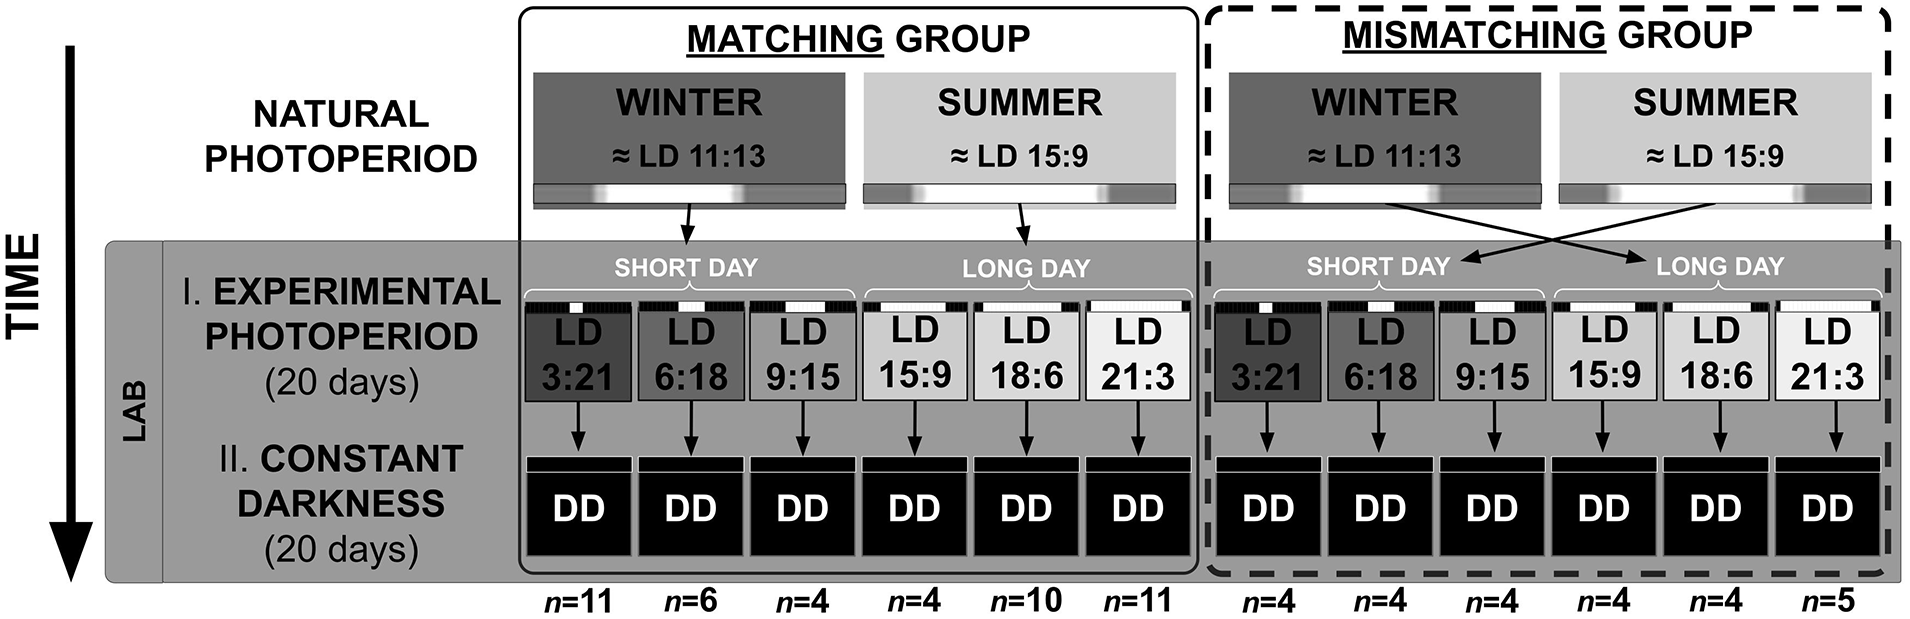
Schematic diagram of the experimental protocol. Animals previously exposed to summer or winter natural photoperiods, were exposed to artificial photoperiods (Stage 1) and finally to DD (Stage 2). The distribution of the winter and summer animals in a Matching (left) and a Mismatching (right) group are indicated. Black and white bars indicate the artificial LD cycles with photoperiods depicted by L and D lengths. Natural photoperiod bars include a gray shade which indicates crepuscular time. Sample size of each subset (within the larger Matching and Mismatching groups) is specified below each column. Abbreviations: DD = constant darkness; LD = light/dark.
Data Analysis
Activity data acquired at 5-min bins were plotted in actograms in El Temps (Diéz-Noguera, 1999) for evaluation of activity rhythms and other analyses. Visual inspection by three independent observers assisted by the ‘‘point-and-read’’ tool of El Temps was used to determine daily activity onset and offset. The difference between activity onset and light offset determined the phase angle of entrainment with respect to the LD cycle. Daily activity duration α was calculated as the daily difference between activity onset and offset. Other calculations and plots were conducted in R (R Core Team, 2021).
From a total of 71 activity records (actograms), 59 were used for the analyses (Supplemental Figure S1). We excluded from the analyses the data from animals that did not synchronize, judged by the inclination of the activity band in their actograms throughout the days in LD (Supplemental Figure S2). We also excluded those activity records with unstable activity onsets or α, or expressing activity splitting (Supplemental Figure S2). Activity rhythm parameters (onset, α) were calculated based on selected intervals (2-4 days) to assure representative values in each actogram. The intervals are explicitly shown for each activity record in Supplemental Figure S1. Quantifications were made on the first days under DD, which reflect the state of the rhythm in the previous entrainment under LD. This strategy relies on the aftereffects of entrainment that persist in DD. We did not measure the entrained rhythm directly under LD, to avoid the negative masking of activity by light, which precluded the definition of activity onsets and α in several animals under long-day photoperiods. In other animals exposed to long-day photoperiods, entrainment was achieved by a strong α compression, which was followed by a rapid decompression over the days in DD. This indicates a gradual change in the rhythm in DD, as it diverges from the previous entrained state. Thus, whenever possible, we restricted the analysis intervals to the very first days under DD to capture more reliably the rhythm parameters from the previous entrainment in LD. For free-running period estimation, we applied the Lomb-Scargle periodogram on days 31 to 40 (starting 10 days after the beginning of DD), using the R package “lomb,” with an oversampling factor of 100.
Kruskal-Wallis test was used to compare experimental photoperiods and Wilcoxon rank-sum test was used for comparisons between Matching and Mismatching groups, as well as for α between long-day and short-day photoperiods. Correlation between α and photoperiod was calculated with Kendall’s rank correlation coefficient, a nonparametric alternative to Pearson’s correlation, more suitable for cases containing smaller sample sizes, outliers, and tied values. This advantage comes with the trade-off of being more conservative in the numeric value of the correlation estimation (Akoglu, 2018). Dunn’s multiple comparisons post hoc test was conducted among each pair of experimental photoperiods for phase angle of entrainment. The Brown-Forsythe test for equality of group variances was used to evaluate the effect of photoperiod on the variance of the phase of entrainment, followed by Dunn’s post hoc test on the residues of group medians. Data are presented as “mean ± standard deviation,” except where indicated.
Results
Entrainment Patterns Under Artificial Photoperiods
To verify if subterranean species are able to encode photoperiodic information in their circadian clock, we tested the effects of different artificial photoperiods on tuco-tucos’ activity/rest rhythms. As already known for tuco-tucos under lab conditions, wheel-running activity occurred mainly during the dark phase (Figure 2).
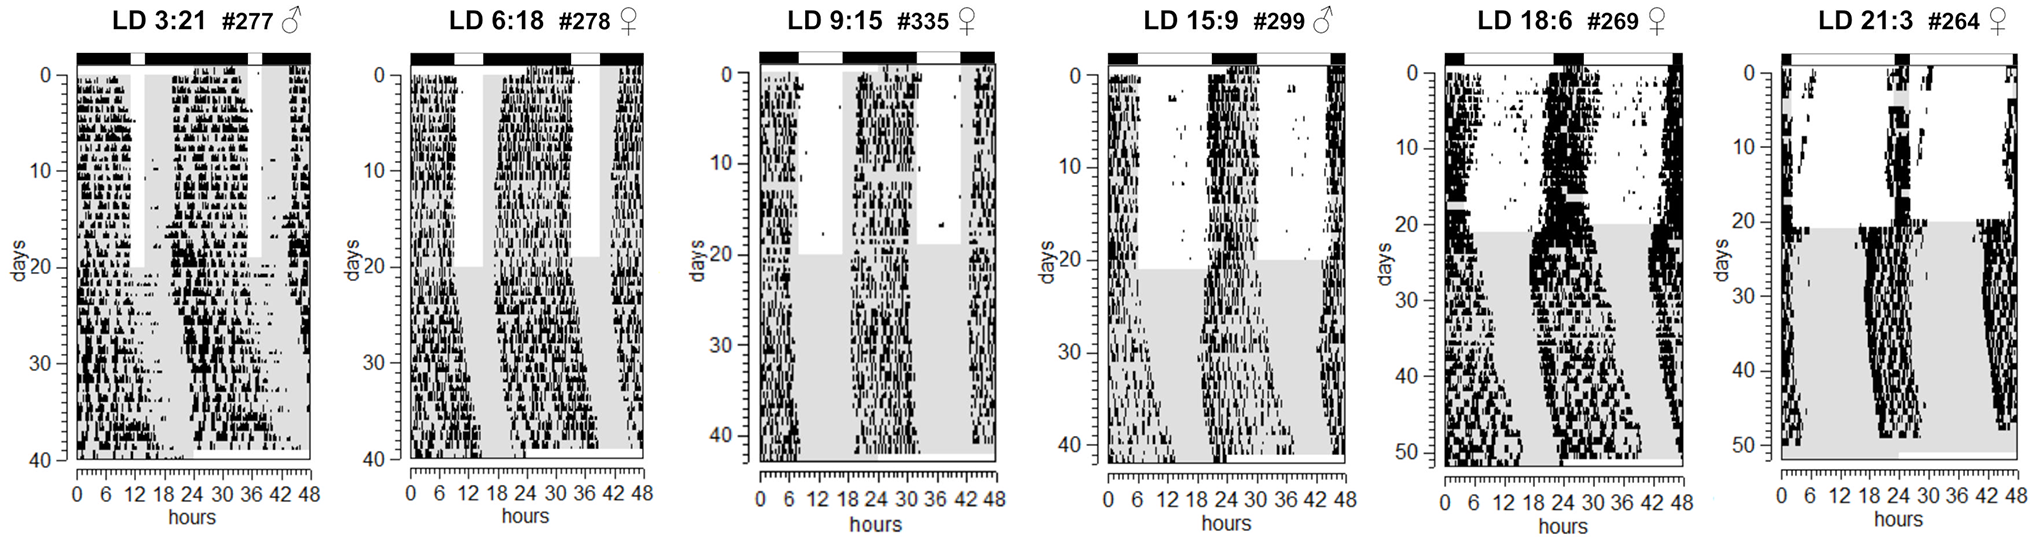
Representative actograms of running wheel activity of animals submitted to different artificial photoperiods from extremely short days (LD 3:21) to long days (LD 21:3). The actograms are from freshly caught animals in the Matching group. The light regimen is indicated by the LD bars (white for L phases and black for D) on top of each actogram as well as through the background colors in the body of the actograms (white represents the photophase while gray the dark phase). Animals were transferred from LD to DD on day 20. Animal ID and sex are indicated on the top-right of each actogram. Abbreviations: LD = light/dark; DD = constant darkness.
Figure 3a illustrates the time of activity onsets relative to the LD cycle under different photoperiods for all animals (i.e., pooled data from Matching or Mismatching groups). Activity onset times track lights-off more prominently between LD 15:9 and 9:15. This is near the natural photoperiod range of La Rioja region (~ LD 15:9 in the summer solstice and LD 11:13 in the winter solstice, which we set as the “natural range”). We quantified the phase angle of entrainment to lights-off, calculated as “lights-off—activity onset.” Positive values indicate activity onsets in advance to lights-off, while negative values represent activity onsets after lights-off. The closest phase relationships were observed in LD 12:12 (–0.12 h) and LD 15:9 (+0.37 h), within or near the “natural range.” In more extreme short-day photoperiods (LD 3:21 and 6:18), activity started later relative to lights-off (more negative phase relationships). The opposite occurred for extreme long-day photoperiods (LD 18:6 and 21:3), except for LD 21:3 (starting 0.18 h earlier than LD 18:6), but still with more positive phase relationships. Supplemental Figure S3 shows the same graph using freshly caught animals only. Comparisons between freshly and previously caught animal data showed a significant change for later onsets in the latter (p = 0.003, two-way ANOVA Supplemental Figure S4A).
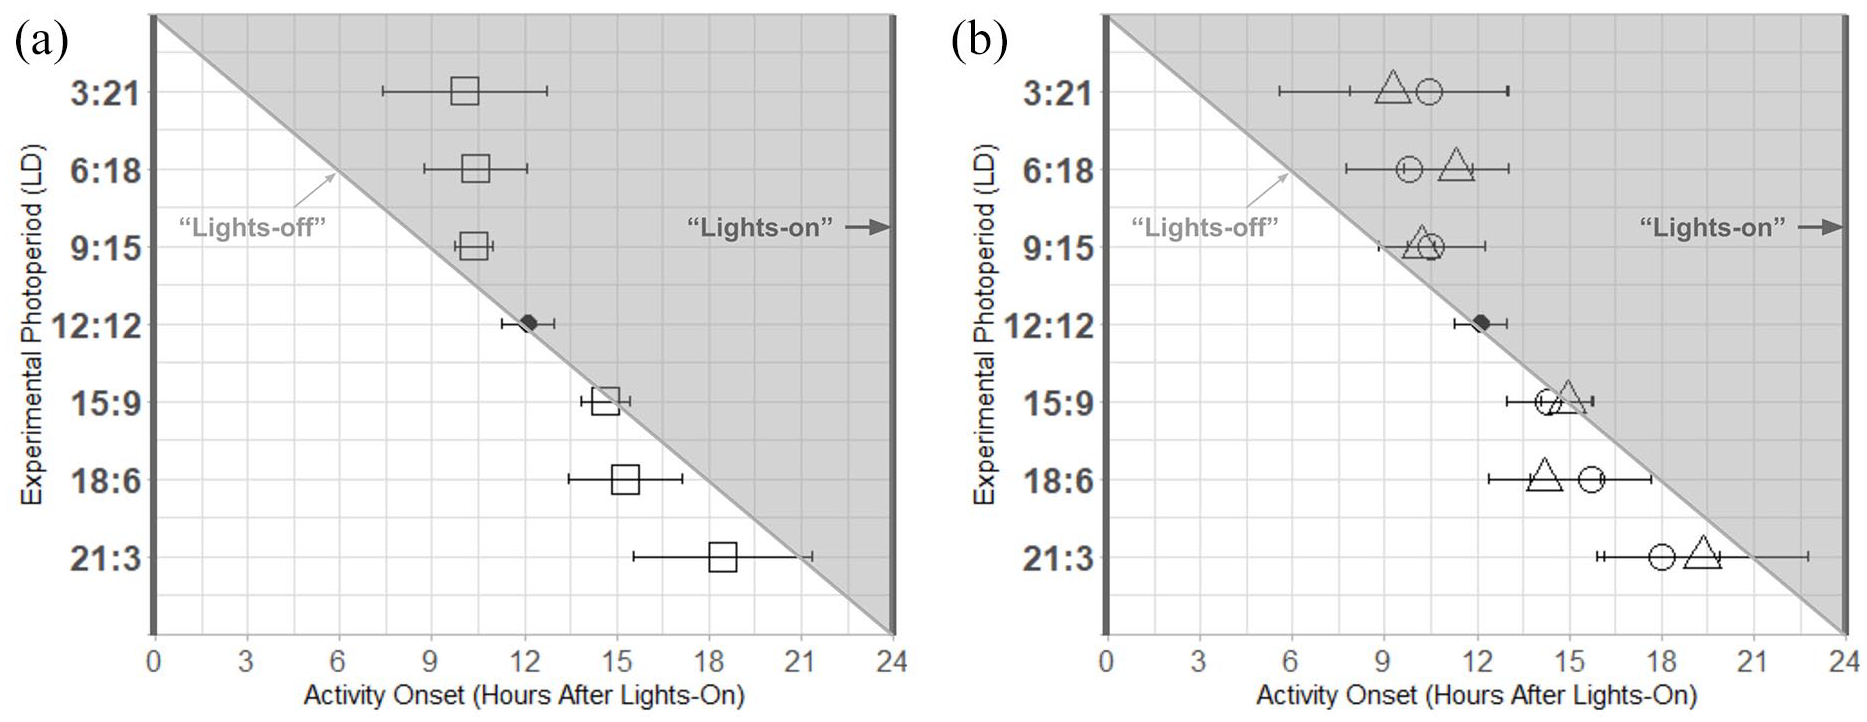
Phase relationship between activity onset and the LD cycle during entrainment to different artificial photoperiods from LD 21:3 to 3:21. The diagonal line represents time of lights-off for each photoperiod indicated in the Y-axis. (a) Squares (□) represent the general mean activity onsets for all the individuals of each photoperiod. (b) the animals were divided into individuals coming from previous photoperiods that matched (○) or mismatched (∆) the experimental artificial photoperiod. Data from the standard LD12:12 photoperiod (•) was obtained from Valentinuzzi et al. (2009). Abbreviation: LD = light/dark.
This pattern indicates that activity onset is not a direct response to the times of lights/dark transitions. Kruskal-Wallis test indicated that there is a difference in phase relationship between activity onsets and lights-off obtained among different photoperiods, χ2(5) = 49.041, p = 2.177e–09. Pairwise comparison with the Dunn’s post hoc test (Supplemental Table S3) has shown that the two most extreme short-day photoperiods (3:21 and 6:18) differ significantly from the two most extreme long-day photoperiods (18:6 and 21:3). No significant difference was found between pairs of short-day photoperiods (LD 3:21 × 6:18 × 9:15) and between pairs of long-day photoperiods (LD 15:9 × 18:6 × 21:3) (Supplemental Table S3).
Higher standard deviations occurred in extreme photoperiods (LD 3:21 and LD 21:3), while lower SD occurred the closer the artificial photoperiod was to LD 12:12. The Brown-Forsythe test for equality of variances returned a significant effect of photoperiod on the variance of activity onset times relative to lights-off, F5, 33.19 = 46.45, p = 4.85e–14. Pairwise comparison of the residues from the group medians, using Dunn’s post hoc test, indicated that the variance of the two extreme long-day photoperiods (LD 18:6 and 21:3) differ significantly from that of the short intermediate photoperiod (LD 9:15). We hypothesized that this divergence in the times of activity onsets with respect to lights-off could be related to the photoperiodic history, with Matching and Mismatching groups responding differently to artificial photoperiods. For this reason, we verified if the photoperiodic history of the animals could primarily explain the divergences in the phase angles of entrainment to different artificial photoperiods.
In Figure 3b, we partitioned the phase of entrainment attained by animals from previous photoperiods that matched (○) or mismatched (∆) the artificial photoperiod. Contrary to the expected, onset times did not differ between Matching and Mismatching animals. The two groups were most consistent (lower standard deviation) under LD 15:9 and 9:15 conditions in which we also observed the closest phase relationships between activity onsets and lights-off.
Five animals failed to attain stable entrainment during the 20 days of Stage 1, all of them under LD 21:3, as concluded from partially masked activity rhythms that did not phase-lock to the LD cycle (Supplemental Figure S2—“unentrained”). In addition, seven actograms exhibited pronounced unstable activity onsets or α (two from LD 21:3, two from LD 15:9 and three from LD 3:21) (Supplemental Figure S2). One of these animals, exposed to LD 21:3 (Mismatching) exhibited splitting in its free-running activity rhythm in the subsequent DD (Supplemental Figure S2F). None of these animals were considered for Figures 3 and 4.
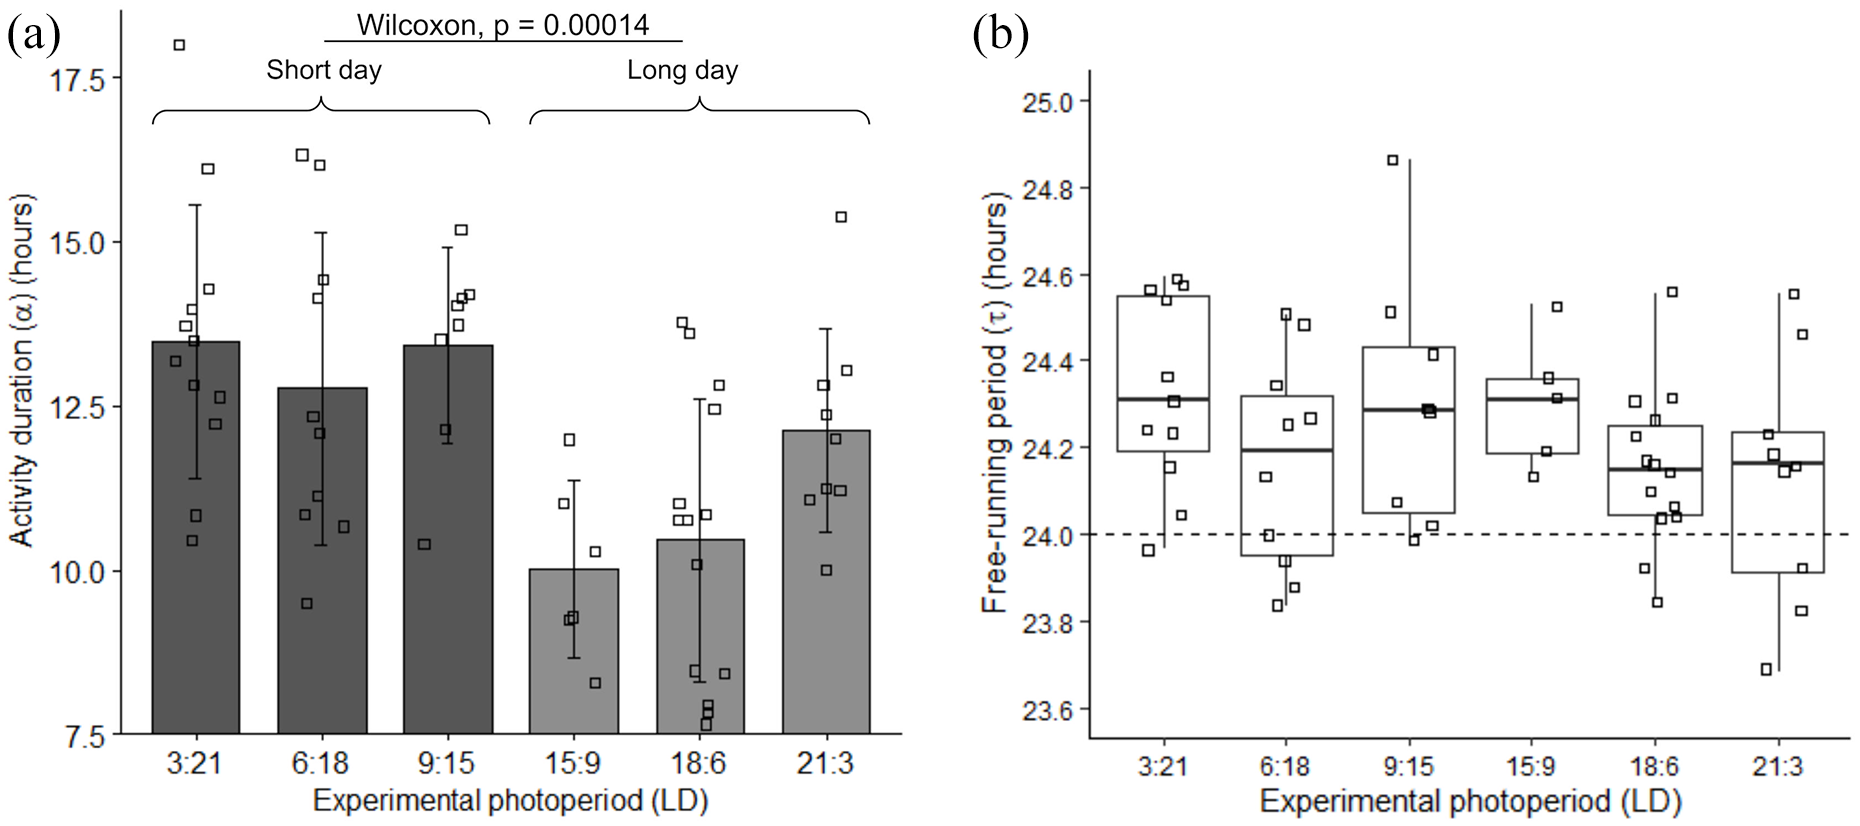
Photoperiod aftereffects in activity duration (α) and free-running period (τ) after transferring animals from different artificial photoperiods to constant dark conditions. (a) Distribution of α across all photoperiod groups. Each square represents the mean α measured in each activity recording during the first days of the DD regimen. There is a significant difference between short-day (LD 3:21, 6:18, 9:15; represented in dark gray) and long-day (LD 15:9, 18:6, 21:3; represented in light gray) photoperiod categories (p = 0.000016, Wilcoxon rank-sum test). (b) Distribution of τ, measured with the Lomb-Scargle periodogram, for each artificial photoperiod. Squares indicate individual τ measurements. The horizontal dashed line indicates a 24-h period. No significant differences were detected between photoperiods. Abbreviation: LD = light/dark.
Artificial Photoperiod Aftereffects
Aftereffects of entrainment to the artificial photoperiods were measured after animals were released into DD. Different photoperiods could cause long-term effects on the activity phase duration (α) and on the free-running period (τ).
Figure 4 displays the distribution of α and τ in each photoperiod. To analyze correlation of α with photoperiod (Figure 4a), we divided the experimental groups into two categories: short-day (LD 3:21, 6:18 and 9:15) and long-day (LD 15:9, 18:6 and 21:3). The mean α values for each of these categories differed significantly (Wilcoxon rank-sum, p = 0.00014). The mean α for the short-day category was 13.2 ± 2 h while that for the long-day category was 10.8 ± 1.97 h. Kendall’s test showed significant correlation between α and photoperiod within the long-day category (p = 0.028), but no significant correlation between α and photoperiod within the short-day category (p = 0.95). Finally, pairwise comparison within each photoperiod showed no significant difference between Matching and Mismatching groups (Wilcoxon rank-sum test, p > 0.1).
To quantify the free-running period of the activity rhythm, we skipped the first 10 days in DD (21-30), when animals tend to maintain 24-h rhythms, as first manifestations of 24-h entrainment aftereffects. Figure 4b depicts the free-running periods (τ) on the subsequent 10 days (31-40), calculated with the Lomb-Scargle periodogram. Kruskal-Wallis test indicated no effect of photoperiod on the free-running periods, χ2(5) = 6.54, p = 0.26. Furthermore, pairwise comparison within each photoperiod showed no significant difference between Matching and Mismatching groups (Wilcoxon rank-sum test, p > 0.2), except for the LD 18:6 photoperiod (p = 0.047). Confirming Valentinuzzi et al. (2009), τ was about 24 h or longer in most (80.7%) of the activity recordings.
Discussion
Our data indicate that the circadian clock of tuco-tucos is able to process photoperiodic information over a range that extends from extreme short to long days. Their activity/rest rhythms display different patterns of entrainment under different artificial photoperiods and manifest aftereffects in α after release in constant conditions. This experimental, laboratory finding is complementary to our previous field work where we measured the natural daily light exposure of these subterranean rodents across seasons in their natural habitat and verified through mathematical modeling that those seasonal light patterns could provide photoperiod information to the SCN (Flôres et al., 2021). Our results on the effect of photoperiodic history may be affected by the variability in experimental conditions (freshly caught × captive animals) and further studies are invited to confirm the results with more stringent experimental designs. However, within the constraints imposed by the use of wild animals, they contribute to broaden what we have learned about photoperiod dependent entrainment from model lab species.
The entrainment patterns of tuco-tucos under distinct photoperiods agrees with previous studies that evaluated the phase of entrainment in different rodent species under complete and skeleton photoperiods (Elliott, 1976; DeCoursey, 1972; Pittendrigh and Daan, 1976b; Spoelstra et al., 2014). These studies have shown that activity onsets may not phase-lock to the LD transitions across photoperiods. Similarly, we report that the phase angle of entrainment in tuco-tucos is only locked to lights-off in photoperiods closer to the natural range (i.e., between LD 9:15 and LD 15:9). In more extreme photoperiods, however, the phase angle of entrainment becomes more negative for short-day photoperiods and more positive for long-day photoperiods. The complex dynamic observed here and in the other studies can be explained, in part, by nonparametric entrainment of the circadian pacemaker, predicted from its free-running period (τ) and its response to light along the 24 h (the Phase Response Curve—PRC). Indeed, Pittendrigh and Daan (1976b) have explained fairly well the photoperiod-dependent entrainment of activity rhythms in Peromyscus leucopus and Mesocricetus auratus, based on their τ and PRC. Some of these general predictions were later elaborated with mathematical modeling (Schmal et al., 2015; Flôres and Oda, 2020).
The studies of Pittendrigh and Daan (1976b) and the conceptual model of Schmal et al. (2015) make a more specific prediction: individual differences in τ should provoke variations in the phase of entrainment, which would be greater for photoperiods farther from LD 12:12 and smaller for photoperiods closer to LD 12:12. The tuco-tucos used in the present study come from a heterogenous wild population, containing males and females of different ages, and could thus express large individual differences in the properties of their circadian clock, including the τ. This could explain why we see variations in the phase of entrainment, which are greater in the extreme long-day photoperiods than in those closer to the equinox. Schmal et al. (2015) have yet another prediction: that the strength of the entraining LD would be weaker for extreme photoperiods, resulting in a smaller range of entrainment. One implication is that only the circadian pacemakers with τ closer to 24 h would successfully entrain to photoperiods far from the equinox. This is a possible explanation for the lack of stable entrainment in some animals under LD 23:1, likely because these have free-running periods farther from 24 h.
Besides the phase of entrainment, we have also seen photoperiod-dependent changes in the duration of the activity phase α, in response to short- and long-day photoperiods. These photoperiod-induced changes in α were measured in DD, relying on the aftereffects of the previous entrainment under LD (Pittendrigh and Daan, 1976a; Tackenberg et al., 2020). They indicate the encoding of photoperiod in the circadian clock, which is carried over for some days in the following constant conditions. In another work, we showed that winter and summer captured tuco-tucos released into DD in the lab also displayed different α, which suggested aftereffects of natural photoperiod (Flôres et al., 2021). However, it was still possible that other seasonal factors in the field, such as temperature and food availability, could be causing the seasonal differences in the endogenous timing of activity. The current data confirm the role of photoperiod in determining differences in α, since animals were kept in controlled conditions under ad libitum food and constant temperature. Expectedly, α was more compressed in response to the long-day photoperiods, in which the dark phase is shorter. The use of extreme long-day photoperiods showed the limits of α compression that the tuco-tucos may achieve. In many of these activity records, the compression was followed by a slow α decompression along the days in DD. However, under this same condition, it was not possible to assess the phase of entrainment in several other individuals, due to the masking effects of light. We speculate that this might have been one possible reason for the lack of this photoperiod range in several published works on photoperiod dependent entrainment. As said above, we circumvented this problem by measuring the unmasked activity patterns in the first days of DD release. One unexpected result was the large α after entrainment to LD 23:1, compared with the less extreme long-day photoperiods LD 15:9 and LD 18:6. In line with the discussion in the previous paragraph, this result could be explained by the weak entraining signal in LD 23:1 (Schmal et al., 2015). We hypothesize that LD 23:1 was only strong enough to set the period and phase of the activity rhythm, but not enough to compress the activity α.
The observed changes in activity α in response to the photoperiods and the α dynamics in DD are likely explained by an internal reorganization of the circadian clock. In mammals, the circadian clock that controls the activity-rest rhythm is located in the SCN, which is composed of a network of cellular oscillators (Welsh et al., 2010). Several studies have indicated that different photoperiods generate changes in intercellular coupling within subregions of the nuclei, resulting in a seasonal internal reconfiguration of the SCN network (Evans et al., 2013; Farajnia et al., 2014; Lucassen et al., 2012), which is maintained in vitro (Mrugala et al., 2000; Tackenberg et al., 2020). Moreover, this photoperiod-induced reconfiguration changes the shape of the overt rhythm in SCN electrical activity, which is correlated to the photoperiod modulation of α in the behavioral activity rhythms (Houben et al., 2009). These results resonate with the proposal by Pittendrigh and Daan (1976c), namely, that changes in α throughout the seasons can be understood in terms of two-coupled subpopulations of the circadian pacemaker (E—evening and M—morning oscillators) whose phase relationship changes according to photoperiod and can be understood through mathematical modeling (Flôres and Oda 2020; Flôres et al., 2021). In this sense, aftereffects in α after entrainment under different photoperiods may be due to persistent changes in coupling within the SCN, in the beginning of the following DD (Pittendrigh and Daan, 1976c; Flôres and Oda, 2020). With the progression of DD, there is likely a slow decay in the coupling strengths (Oda et al., 2000), resulting in a slowly decompressing α. The multioscillatory nature of the tuco-tucos circadian clock is further supported by the splitting of activity rhythms into two components under constant light (Valentinuzzi et al., 2009; Flôres et al., 2021), which was also observed in one animal in the present study, after exposure to a long-day photoperiod (Supplemental Figure S2F).
In sum, the results reinforce how the entrainment of an endogenous circadian pacemaker define the activity-rest patterns of tuco-tucos under varying photoperiods. In addition to the endogenous control, the activity under LD is also modified by the direct effect of exogenous light via negative masking of activity (Redlin and Mrosovsky, 1999), especially in the long-day photoperiods. We have tested the endogenous and exogenous contributions to the control of the activity rhythms under different photoperiods by comparing the patterns in LD and subsequent DD. In Figure 5, we show schematic scenarios that guided our interpretation of the control mechanisms. When the activity in LD reflects an endogenous control, some properties of the activity rhythm in different photoperiods should persist in DD, such as the α aftereffects discussed above (Figure 5a). In summer photoperiods, the slow α decompression in DD is explained by a dynamic change within the endogenous clock, as it diverges from the entrained state. However, if the effects of different photoperiods are only exogenous, the rhythm in DD should be similar between photoperiods (Figure 5b). This is, for instance, what happens to mutant mice that fail to express the clock gene Per2 (Spoelstra et al., 2014) or the neurotransmitter VIP (Lucassen et al., 2012). In a more drastic case, a few animals that live in the extreme photic environment of the Arctic (Reierth and Stokkan, 1998; van Oort et al., 2007) only express activity rhythms in LD and are arrhythmic under constant illumination (Figure 5c). For these animals, the exogenous control not only determines the photoperiodic-dependent activity, but it is required for the expression of the activity rhythm itself. It is interesting that the tuco-tucos, which also live in an extreme photic environment, still preserve both an endogenous rhythmicity and the property to adjust their endogenous control to different photoperiods, as in Figure 5a.
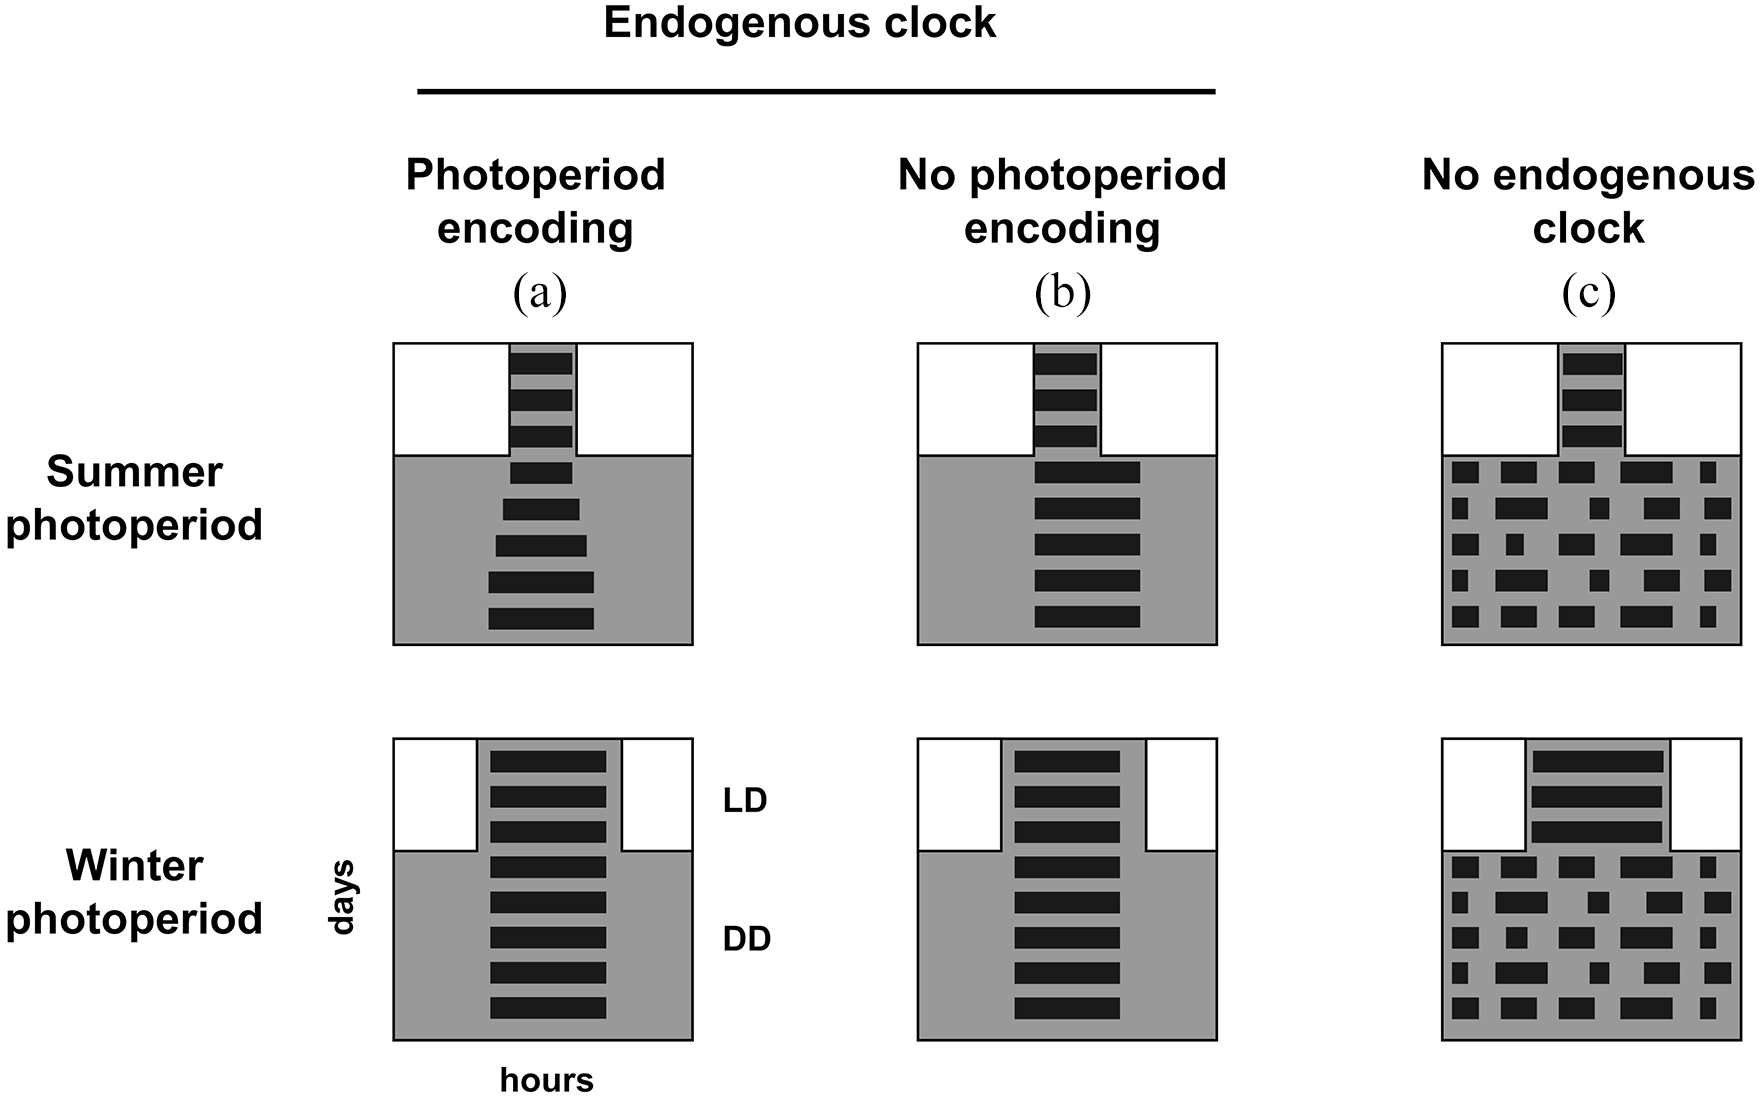
Hypothetical patterns of activity and rest in generic dark-active animals exposed to a LD cycle followed by DD. In each actogram, white and gray indicate the times of light and dark, respectively. The black horizontal bands represent the activity phase. (A) An animal with endogenous clock able to encode photoperiod. Its α is different in summer and winter photoperiods under LD. When transferred to DD, the difference is maintained, indicating a change in the endogenous circadian clock. In summer, the compressed α under LD is slowly decompressed in DD. (B) Animal with an endogenous clock that does not encode different photoperiods. The circadian clock is entrained by LD in the two photoperiods but no differences are seen in the unmasked rhythms under DD. (C) Animals without an endogenous clock. The rhythm in LD is generated exogenously by masking. The absence of a rhythm in the subsequent DD indicates lack of a functional circadian clock. Abbreviations: LD = light/dark; DD = constant darkness.
Experiments characterizing activity rhythms and the SCN under artificial photoperiods usually subdivide a uniform group of animals into short- and long-day photoperiods for comparison. It is assumed that the observed responses are representative of the new imposed photoperiod, but little consideration is given to the effect of their photoperiodic history. We hypothesized that results would differ if the animals were previously held in summer or winter photoperiods, due to the discrepancy in the initial-to-final photoperiods. Moreover, the persistent aftereffects of previous photoperiod, discussed above, could impact the response to the new LD regimen. Our results indicated, however, that Matching and Mismatching groups do not show significant general differences in the phase angle of entrainment of daily activity rhythms. Nevertheless, the smallest difference between these groups occurs at LD 9:15 and 15:9, the least extreme experimental photoperiods. The pattern could be related to the small overall variability in the phase of entrainment in these photoperiods, as discussed above.
Besides the effects on locomotor activity rhythms, different photoperiods also affect the control of the SCN over the daily pattern of the pineal neurohormone melatonin. In mammals, long- and short-day entrained SCN generate, respectively, short and long daily melatonin release patterns. The duration of daily melatonin release is one of the main humoral outputs associated to reproductive responses to short and long days. In this sense, photoperiod encoding in the SCN is the first step in the photoperiodic synchronization of seasonal neuroendocrine events (Reiter, 1993; Goldman, 2001; Nakane and Yoshimura, 2019). While our results indicate that photoperiodic history does not affect the pattern of SCN entrainment to mismatching photoperiods in tuco-tucos (Figure 3), it could have more dramatic consequences on downstream seasonal outputs. It has been shown, for instance, that seasonal animals transferred from Northern to Southern Hemispheres display several-year transients until resynchronizing their internal annual physiological program (Davis and Finnie, 1975; Gwinner, 1986).
The endogenous changes observed in locomotor activity α of tuco-tucos are suggestive of a functional seasonal signal from the SCN to their neuroendocrine control of reproduction. If confirmed in future studies, we would expect that subterranean tuco-tucos synchronize their seasonal cycles, such as reproduction (Fanjul and Zenuto, 2008), to the annual photoperiod variation. Photoperiodic information is considered the strongest synchronizer of seasonal functions in most species of mammals (Bradshaw and Holzapfel, 2007). The pervasiveness of photoperiodism in mammals is presumably explained by phylogenetic relations. Given the recent natural history of the family Ctenomyidae (Parada et al., 2011), the “disappearance” of this trait might not be likely, regardless of the subterranean habits observed in modern Ctenomys.
Supplemental Material
sj-pdf-1-jbr-10.1177_07487304221085105 – Supplemental material for Daylength Shapes Entrainment Patterns to Artificial Photoperiods in a Subterranean Rodent
Supplemental material, sj-pdf-1-jbr-10.1177_07487304221085105 for Daylength Shapes Entrainment Patterns to Artificial Photoperiods in a Subterranean Rodent by Giovane Carreira Improta, Danilo Eugênio França Laurindo Flôres, Gisele Akemi Oda and Verónica Sandra Valentinuzzi in Journal of Biological Rhythms
Supplemental Material
sj-pdf-2-jbr-10.1177_07487304221085105 – Supplemental material for Daylength Shapes Entrainment Patterns to Artificial Photoperiods in a Subterranean Rodent
Supplemental material, sj-pdf-2-jbr-10.1177_07487304221085105 for Daylength Shapes Entrainment Patterns to Artificial Photoperiods in a Subterranean Rodent by Giovane Carreira Improta, Danilo Eugênio França Laurindo Flôres, Gisele Akemi Oda and Verónica Sandra Valentinuzzi in Journal of Biological Rhythms
Footnotes
Acknowledgements
This work was only possible because of the inestimable technical assistance from Johanna Barros in all experimental steps, frequent discussions with Patricia Tachinardi, Milene Jannetti, and Jefferson Silva, and a very fruitful discussion with Carolina VM Azevedo. Finally, the authors acknowledge the anonymous reviewers for their excellent criticisms and suggestions.
This work was supported by FONCyT—Agencia Nacional de Promoción Científica y Tecnológica [grant PICT 2013/2753 to VSV], and CONICET—Consejo Nacional de Investigaciones Científicas y Técnicas [grant PIP-11220120100415CO to VSV and grant PUE-201622920160100125 to the CRILAR Institution]. Grants 2014/20671-0, 2017/19680-2, 2019/26752-5 to GAO, 2017/16242-4 to DEFLF, São Paulo Research Foundation (FAPESP). Coordenação de Aperfeiçoamento de Pessoal de Nível Superior—Brazil (CAPES) [Finance Code 001 to GCI]; and CNPq scholarship [130689/2018-1 to GCI]
Author Contributions
G.A.O. and V.S.V. conceived the experiments; G.C.I. and V.S.V. performed experiments; G.C.I. and D.E.F.L.F. analyzed the data; and G.A.O., G.C.I., D.E.F.L.F., and V.S.V. wrote the paper. All authors reviewed and approved the final manuscript.
Conflict of Interest Statement
The author(s) have no potential conflicts of interest with respect to the research, authorship, and/or publication of this article.
Statement of Material Access
The raw data supporting the conclusions of this article will be made available by the authors, without undue reservation.
ORCID iDs
Notes
References
Supplementary Material
Please find the following supplemental material available below.
For Open Access articles published under a Creative Commons License, all supplemental material carries the same license as the article it is associated with.
For non-Open Access articles published, all supplemental material carries a non-exclusive license, and permission requests for re-use of supplemental material or any part of supplemental material shall be sent directly to the copyright owner as specified in the copyright notice associated with the article.